Communication

Determination of the Optimal Tilt Angle of Solar Collectors for Different Climates of China

College of Energy and Electrical Engineering, Hohai University, Nanjing 211100, China
*
Author to whom correspondence should be addressed.
Sustainability 2016, 8(7), 654; https://doi.org/10.3390/su8070654
Submission received: 18 May 2016 / Revised: 4 July 2016 / Accepted: 5 July 2016 / Published: 11 July 2016
(This article belongs to the Special Issue Renewable Energy Applications and Energy Saving in Buildings)

Abstract

:
The tilt angle with the horizon (with respect to the ground) of the solar energy system affects the amount of solar radiation received. This paper suggests a simple and universal method to obtain the optimum tilt angles by estimating the monthly mean daily global solar radiation on tilted surfaces facing directly towards the equator, which is based on monthly average daily global solar radiation data produced from Typical Meteorological Year (TMY) data. The monthly, seasonal, and yearly optimum tilt angles for photovoltaic panels are calculated at six stations of different climatic types (Tropical Zone (TZ), Subtropical Zone (SZ), Warm Temperate Zone (WTZ), Mid Temperate Zone (MTZ), Cold Temperate Zone (CTZ) and Tibetan Plateau Zone (TPZ)). The results indicate that changing the monthly, seasonal, and yearly optimum tilt angles causes a significant yearly gain in the solar radiation for the region. In addition, general correlations are generated to estimate the optimum tilt angle of solar collectors at six typical climatic stations of China. The performances of the proposed models are compared using statistical error tests such as the mean absolute bias error (MABE), the root mean square error (RMSE) and the correlation coefficients (R).

1. Introduction

The performance of a photovoltaic panel is highly influenced by its tilt angle with the horizontal surface (with respect to the ground) because the tilt angle changes the solar radiation reaching the surface of the collector [1,2]. The best way to collect the maximum daily energy is to use a tracking system. A tracking system is a mechanical device that tracks the sun on its daily sweep across the sky. However, most photovoltaic (PV) modules are not suited for tracking, as they collect more sunlight and, therefore, produce more electricity if they are always oriented toward the sun. Trackers are expensive, need energy for their operation, and are not always applicable. Therefore, it is often practical to orient the solar collector at an optimum tilt angle and to correct the tilt from time to time.
Some investigators have made different recommendations for the optimum tilt, based on the latitude. Lunde [3] and Garg [4] obtained the optimum tilt angle, βopt, φ ± 15°. Duffie and Beckman [5] obtained βopt, (φ ± 15°) ± 15°. Ibrahim [6] showed the optimum tilt angles of summer months (φ − 21°) and winter months (φ + 13°) for Cyprus. Asl-Soleimani [7] reported an annual optimum tilt angle of 30°, which is a bit lower than the local latitude (35.7°). Kalogirou [8,9] suggested the optimum tilt angle to be φ ± (10° − 15°). Gunerhan and Hepbasli [10] determined the yearly optimum tilt angle for collectors in Izmir to be 35.8°, which is approximately the location’s latitude. Lave and Kleissl [11] suggested yearly optimum tilt angles for several regions of the United States as βopt, φ − (1° − 10°), by calculating the maximum incident solar radiation on the solar collector, where φ is the latitude of the location. Jafarkazemi [12] concluded that the yearly optimum tilt angle (βopt = 22°) is almost close to the latitude of Abu Dhabi (φ = 24.4°).
Some other optimization techniques have also been devoted to this problem in recent years, most of which treat the problem both qualitatively and quantitatively. Abdolzadeh and Mehrabian [13], Bakirci [14,15], and Despotovic [1] estimated the total (global) solar radiation intensity to obtain the optimum slope angle in a specific period for solar collectors. Kaldellis [16,17] and Pourgharibshahi [18] verified the computational optimum tilt angles of a PV module by conducting experiments. The genetic algorithm method [19,20], particle swarm optimization [21,22], and the artificial neural network method [23,24] were also used to estimate the optimum tilt angle of PV modules.
The previous studies on the topic were carried out mostly in the foreign climate and geography. Yang and Lu [25] developed a new mathematical model for calculating the optimum tilt angles and azimuth angles for building-integrated photovoltaic (BIPV) applications in Hong Kong on yearly, seasonal, and monthly bases. Sun [26] investigated the combined energy effect produced by shading-type BIPV claddings and found that the optimum tilt angles of shading-type BIPV claddings at different orientations provide the most desirable energy-saving effect. Tang [27] theoretically investigated the multi-reflection of radiation on both parabolic reflectors of a compound parabolic concentrator (CPC) with a one-sided flat absorber and its effect on energy-collection calculations. Generally, such research in China is still limited. Thus, the present study aims to develop an analytical procedure to obtain formulae which determine βopt for any climatic type in China.
The main objective of this study is to determine the optimum tilt angle of photovoltaic panels on the basis of maximizing the global solar radiation reaching the collector surface on a monthly, seasonal, and yearly basis and to develop general correlations for estimating the monthly optimum tilt angles at six stations of different climatic zones. The effect of the Earth’s reflection on the global solar radiation for a solar collector inclined at the optimum slope angle is investigated. The calculations are based on the data of air-dry bulb temperature, relative humidity, wind velocity, and global solar radiation from China’s meteorological stations. These data are collected for a period of 16 years (1994–2009).

2. Different Climates of China and Optimal Angles Designed for the Six Typical Cities

China lies in the northeastern part of East Asia and has a complex climate [28,29]. Various methods for classifying the climatic types of China can be found in References [30,31,32]. In this paper, we use the method which designated China’s temperature strip. Accordingly, China is classified into six climatic types, namely the Tropical Zone (TZ), Subtropical Zone (SZ), Warm Temperate Zone (WTZ), Mid Temperate Zone (MTZ), Cold Temperate Zone (CTZ) and Tibetan Plateau Zone (TPZ). Moreover, the zoning criteria are mainly based on the annual accumulated temperature, which is the sum of the daily mean temperature over 10 degrees within a year. Six stations (Sanya, Shanghai, Zhengzhou, Harbin, Mohe, and Lhasa) in China are investigated and generated based on the measured weather data in this paper. General information about the six selected typical stations is shown in Table 1.

3. Development of Monthly Mean Daily Global Solar Radiation Data

3.1. Data Used

In this work, the measured weather data (including daily maximum, minimum, and mean air-dry bulb temperature; daily minimum and mean relative humidity; daily maximum and mean wind velocity; and daily global solar radiation data) for the six stations are gathered from China’s meteorological stations. The missing and invalid measured weather data for the six stations shown in Table 1 are marked and coded as 32,744 or 32,766 in the original document of China’s meteorological stations. In addition, the questionable data are replaced by the values of previous or subsequent days using the interpolation method [33].

3.2. Method and Process for Forming Monthly Mean Daily Global Solar Radiation Data

Monthly mean daily global solar radiation data are the basic and key parameters in the following process of forming the optimal tilt angle. Since solar radiation data can vary from year to year, there is a need to generate a customized solar radiation database that can well represent the long-term averaged solar radiation over a year [31,34,35,36,37]. In this subsection, the Typical Meteorological Year (TMY) method is recommended and applied. The TMY method is the methodology for combining 12 typical meteorological months (TMMs) from different years of the measured period to form a complete year. The selection procedure of the 12 TMMs consists of two steps:
Step 1: Selection of five candidate years. The cumulative distribution function (CDF) for each weather index is determined by the following function:
S n ( x ) = { 0 ( i 0.5 ) / n 1 for for for x < x 1 x i x < x i + 1 x x n
where Sn(x) is the value of the CDF for weather index x; n is the total number of elements; i is the rank order number (i = 1, 2, 3,…, n − 1). Next, the values of Finkelstein-Schafer (FS) statistics [38] for each weather index are calculated by the equation:
F S x ( y , m ) = 1 N i = 1 N | C D F m ( x i ) C D F y , m ( x i ) |
where FSx(y, m) is the FS statistic for the year y, month m; CDFm is the long-term and CDFy,m is the short-term (for the year y) cumulative distribution function of the weather index x for month m; N is the number of daily readings of the month.
The weighted sum (WS) of the FS statistics for the above eight meteorological indices is then calculated for each year. In addition, the five years are selected as the candidate years having the smallest WS values. The WS is defined as follows:
W S ( y , m ) = 1 M x = 1 M W F x F S x ( y , m )
where WS(y, m) is the average weighted sum for the month m in the year y; WFx is the weighting factor for the xth weather index (shown in Table 2); M is the number of meteorological parameter indices (eight in this paper).
Step 2: Final selection of TMM. The final step is to choose TMMs from the five candidate years. The month with the minimum root mean square difference (RMSD) [39] of global solar radiation is chosen as the TMM. The TMM is calculated according to:
R M S D = [ i = 1 N ( H y , m , i H m a ) 2 N ] 1 / 2
where Hy,m,i is the daily global solar radiation values of the year y, month m and day i; Hma is the mean values of the long-term global solar radiation for the month m; N is the number of daily readings of the month.
The TMY data and typical global solar radiation data for the six stations listed in Table 1 are investigated and generated based on the above measured weather data and the TMY method. The detailed generation process for the TMY data can be found in our previous research [39]. In addition, the TMY data of the six stations in different climatic zones of China produced in Reference [39] are shown in Table 3.
By applying the daily mean global solar radiation data, the monthly mean daily global solar radiation data of the six stations in six different climatic zones of China are computed and formed based on the corresponding TMY data. The monthly mean daily global solar radiation data of the six stations are given in Table 3.

4. Estimation of Solar Radiation on the Inclined Surface

The monthly mean daily global solar radiation data on the inclined surface are important and useful for solar energy applications. However, daily global solar radiation data on a tilted surface are generally unmeasured and unavailable. In this paper, a simple and universal method is proposed to estimate the monthly mean daily global solar radiation on tilted surfaces facing directly towards the equator. Moreover, the monthly mean daily global radiation on a tilted surface (HT) can be estimated by the following relation:
H T = R H
where R is the ratio of the monthly average daily global radiation on a tilted surface to that on a horizontal surface. The ratio R, developed by Liu and Jordan [15,40], can be defined as:
R = ( 1 H d H ) R b + H d H ( 1 + cos β 2 ) + ρ ( 1 cos β 2 )
where H and Hd are the monthly average daily global and diffuse solar radiation on a horizontal surface, respectively; Rb is the ratio of the average daily beam radiation for each calendar month on an inclined surface to that on a horizontal surface; ρ (=0.2) is the ground reflection coefficient; β is the tilt angle of photovoltaic panels. The monthly average daily global solar radiation data produced from the TMY data, proposed in our earlier research [39], are applied in the present study.
The diffuse component recommended in the previous studies [41] is adopted in this work. Accordingly, the monthly average daily diffuse solar radiation data is calculated according to:
H d = H ( 1.00 1.13 K T )
where KT is the clearness index of the sky. KT can be obtained using the following formula:
K T = H / H 0
Here, H0 is the monthly mean daily extraterrestrial radiation on a horizontal surface [42], which is computed by
H 0 = 24 × 3600 π I 0 ( 1 + 0.033 cos 360 n 365 ) ( cos j cos δ sin ω s + 2 π ω s 360 sin j sin δ )
where I0 is the solar constant (1367 W/m2); n is the number of daily readings of the month and is counted from 1 January (1–365); j is the geographic latitude of the location; ωS is the sunrise (or sunset) angle on a horizontal surface; δ is the declination of the sun. In this paper, the monthly representative day and its corresponding declination are applied and shown in Table 4.
In the present study, the photovoltaic panels are all in the Northern Hemisphere, and the factor Rb suggested by Liu and Jordan [40] can be written as
R b = cos ( j β ) cos δ sin ω s + ( π / 180 ) ω s sin ( j β ) sin δ cos j cos δ sin ω s + ( π / 180 ) ω s sin j sin δ
where ωS′ is the sunrise (or sunset) hour angle for the inclined surface.
In this paper, Equations (5)–(10) are applied to calculate the monthly mean daily global solar radiation on the south-facing inclined surface for six different stations in China. The tilt angle is changed from −20° to 90° in steps of 0.1° and the corresponding value of maximum global solar radiation for a specific period is defined as the optimal tilt angle.

5. Results and Discussions

By applying the above procedure and the data from the six stations listed in Table 1, the monthly, seasonal, and yearly optimum tilt angles and total radiation on the inclined panel are calculated using Equations (5)–(10).
Table 5 shows the monthly optimum tilt angle of the six stations. The monthly optimum angles range from −14.7° (June) to 43.3° (December) for Sanya, from −5.2° (June) to 53.2° (December) for Shanghai, from −3.9° (June) to 57° (December) for Zhengzhou, from 2.6° (June) to 69.4° (December) for Harbin, from 9.3° (June) to 78.4° (December) for Mohe, and from −8.5° (June) to 60.5° (December) for Lhasa. Obviously, negative values appear in the determination of optimum tilt angles, such as for June in Lhasa. A negative value of the optimum tilt angle indicates that the photovoltaic panels face North.
Taking Harbin as an example, the calculated data generated by the above method are given in Table 6, including the monthly mean daily extraterrestrial radiation on a horizontal surface (H0), the clearness index of the sky (KT), diffuse solar radiation on a horizontal surface (Hd), the optimum tilt angle (βopt), the monthly mean daily global solar radiation on an optimum tilt surface (HT), and the comparison of H and HT. Clearly, the maximum and minimum HT values occur in June and December, respectively. Meanwhile, it can be seen from Table 6 (the last column) that the efficiency of the solar panel at the monthly optimum tilt angle is obviously increased compared to that with a horizontal surface. Within a year, the comparison of H and HT has a maximum value of 120.95% (December).
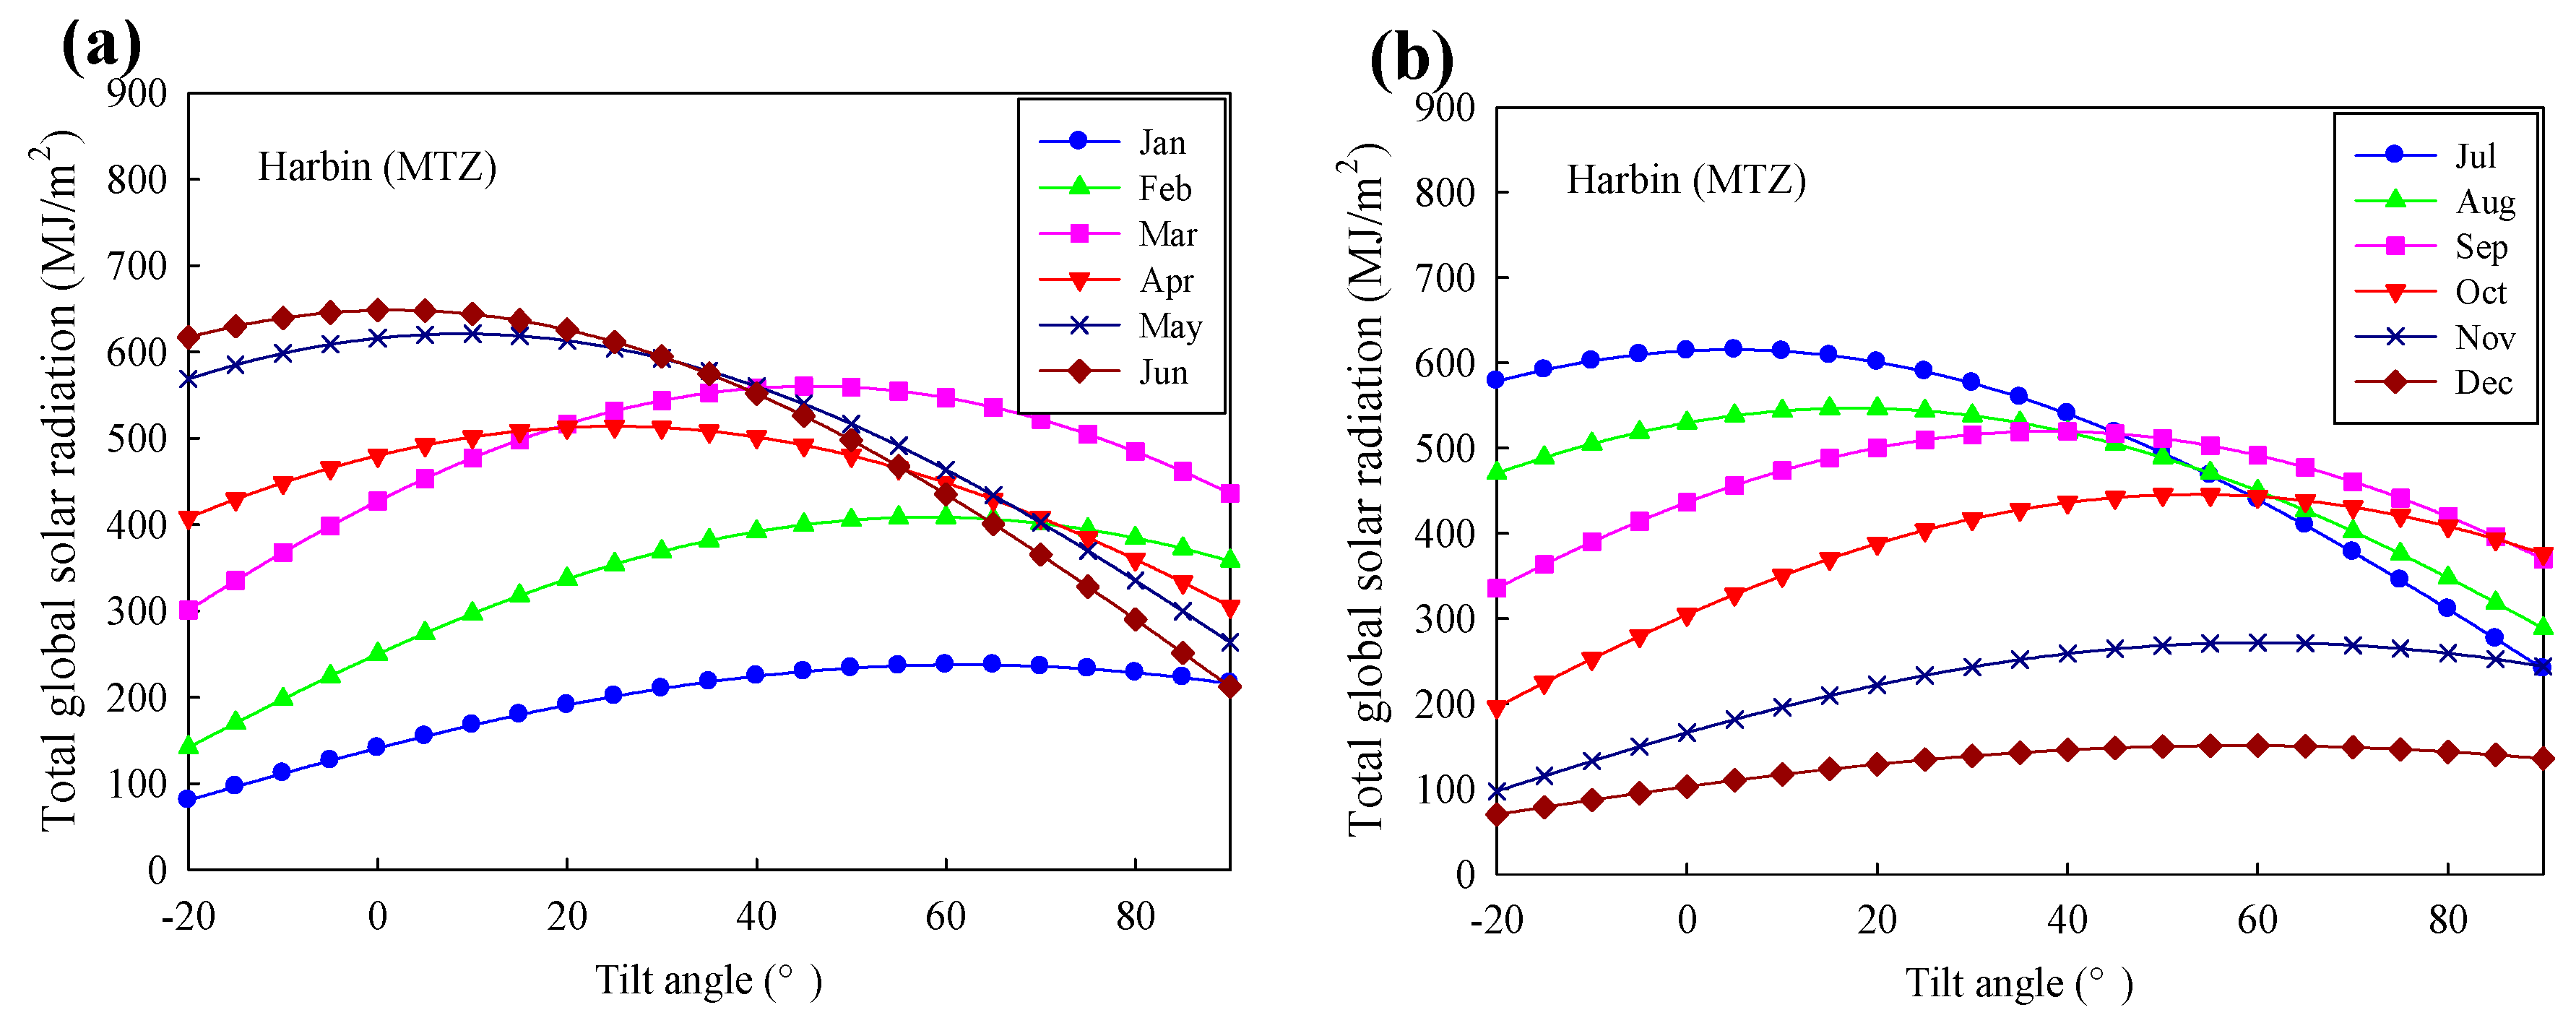
The monthly total global solar radiation, when the tilt angle changes from −20° to 90°, is given in Figure 1. The figure indicates that for each month, there is a great difference among the monthly total global solar radiation values due to different tilt angles. In addition, the maximum value of the monthly total global solar radiation corresponds to a specific tilt angle, i.e., the monthly optimum tilt angle. For October, the maximum value of the monthly total global solar radiation for Harbin (MTZ) is 467.48 MJ/m2, corresponding to 54.8° (the monthly optimum tilt angle).
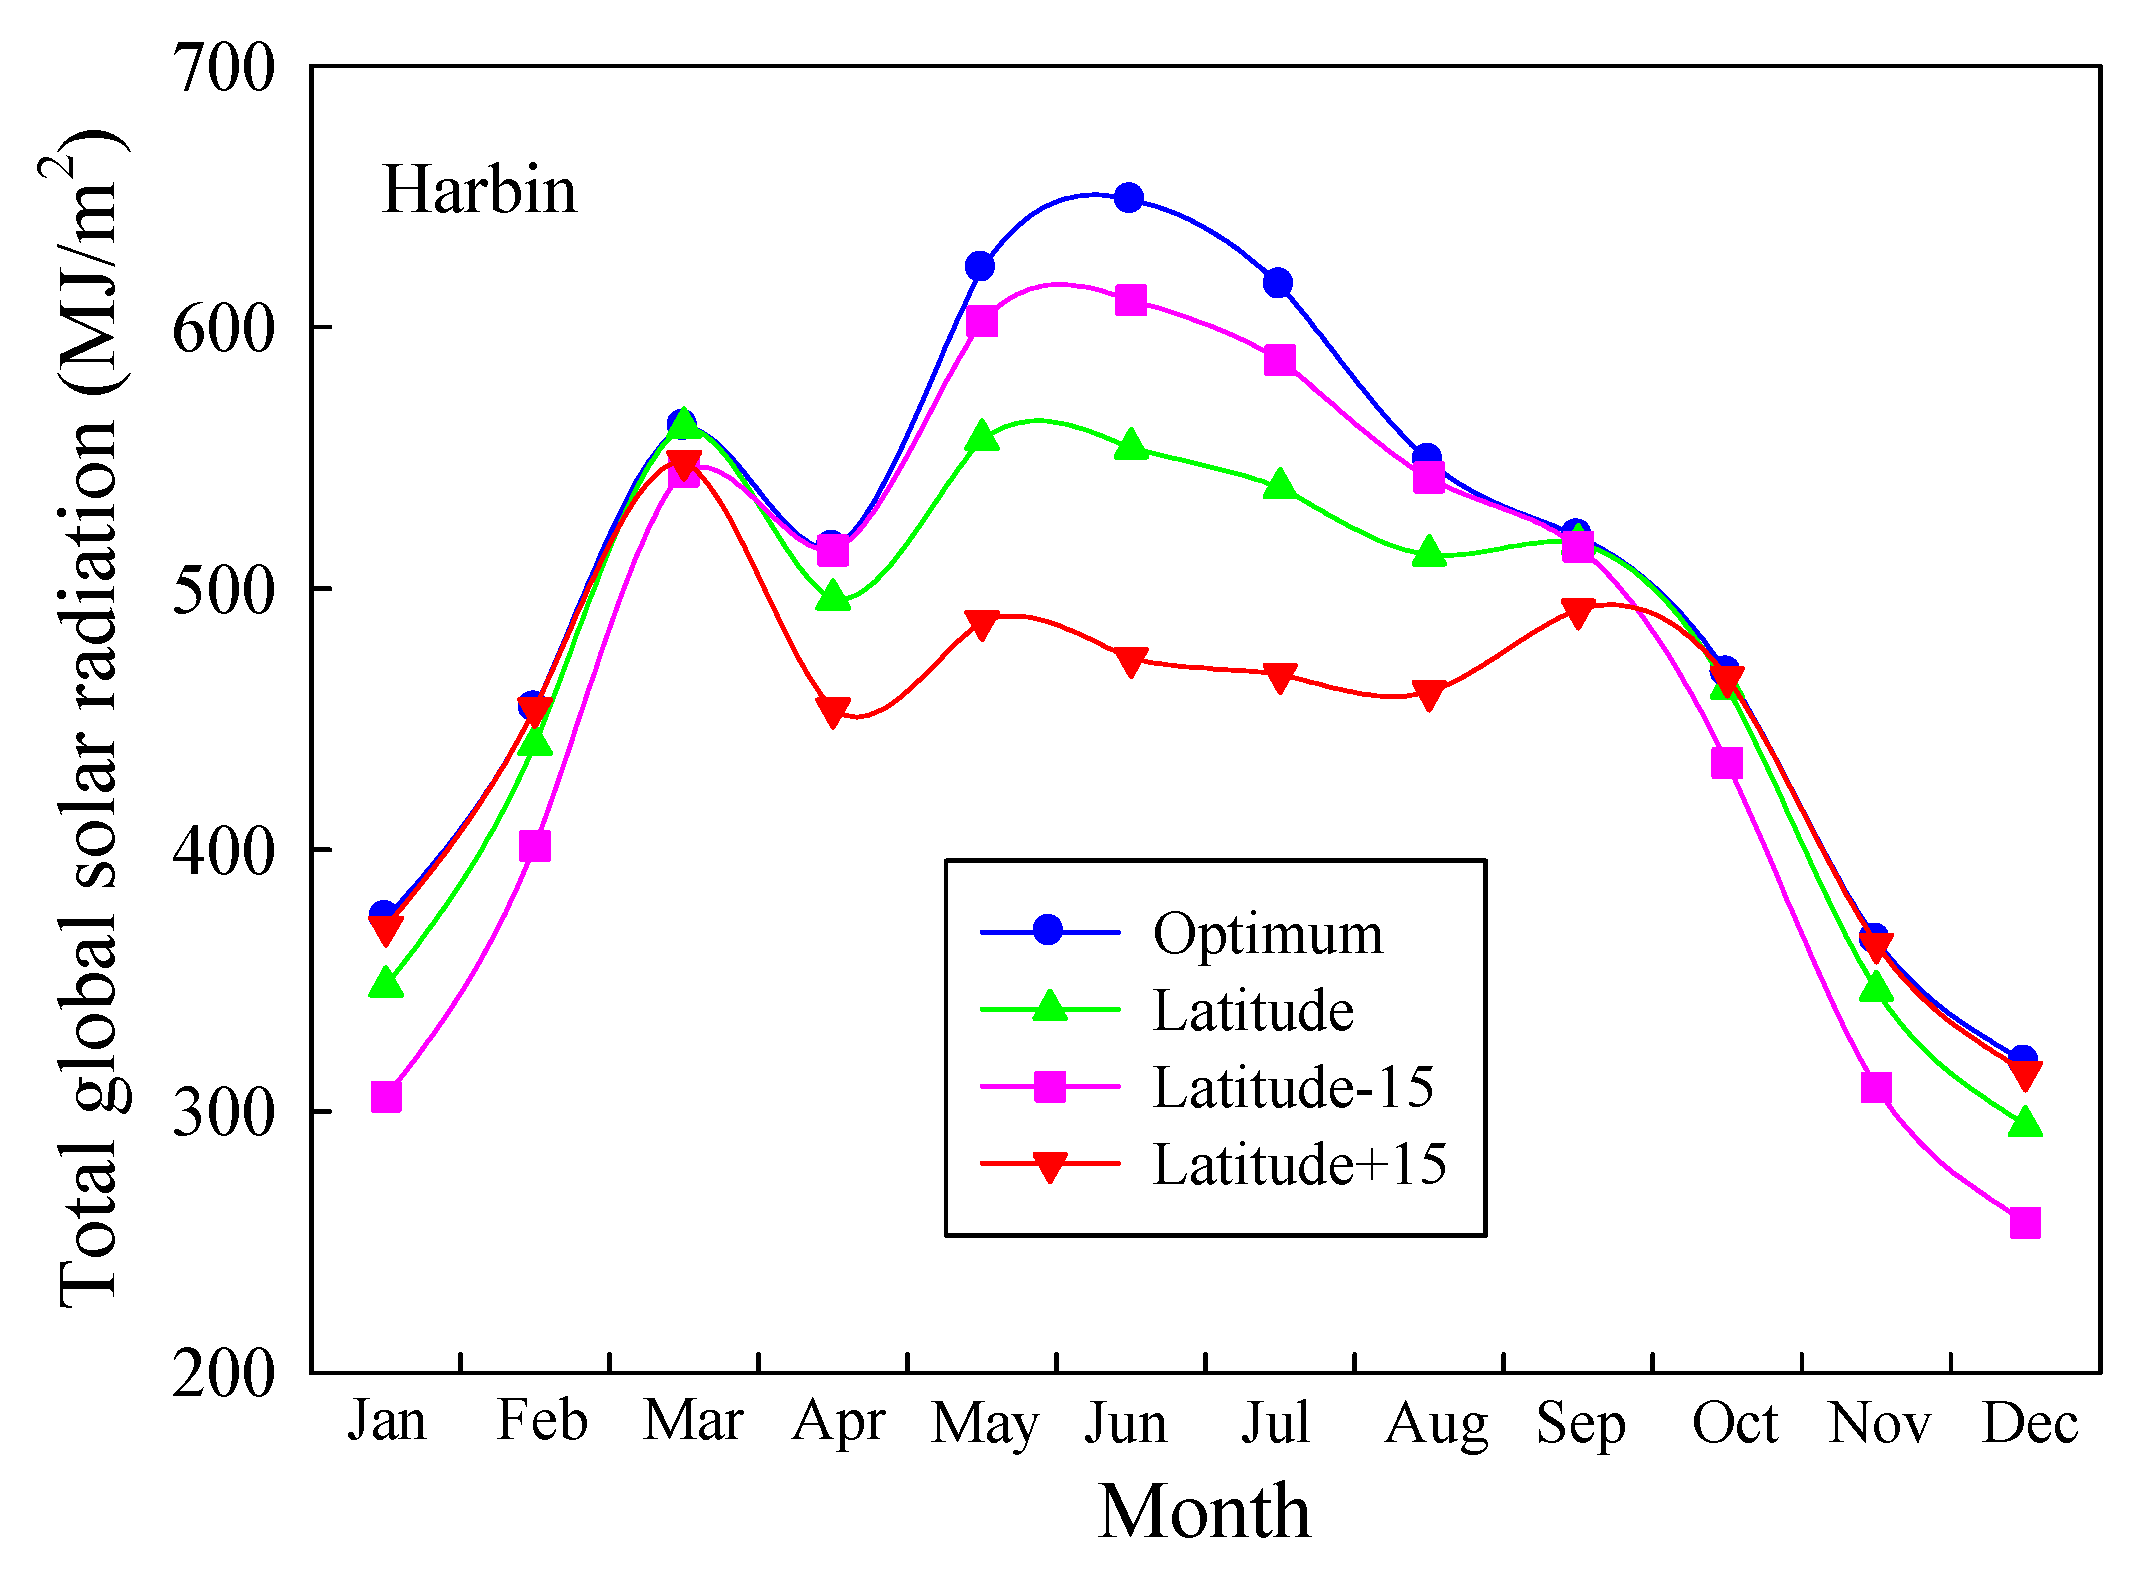
Figure 2 shows the total global solar radiation for the determined tilt angles when the solar collector is tilted at the monthly optimum tilt angle, the latitude, and the latitude ±15. Results reveal that the optimum angles give higher values of the optimum angle for the whole year as compared with the latitude and the latitude ±15. It is noted that in March, there is little difference in the radiation values determined by these methods.
The seasonal and yearly optimum tilt angles for six stations in different climatic zones are also given in Table 5. The seasonal optimum tilt angles are the mean of the monthly optimum tilt angles in a season, while the yearly optimum tilt angles are the average of the monthly optimum tilt angles in a year. 
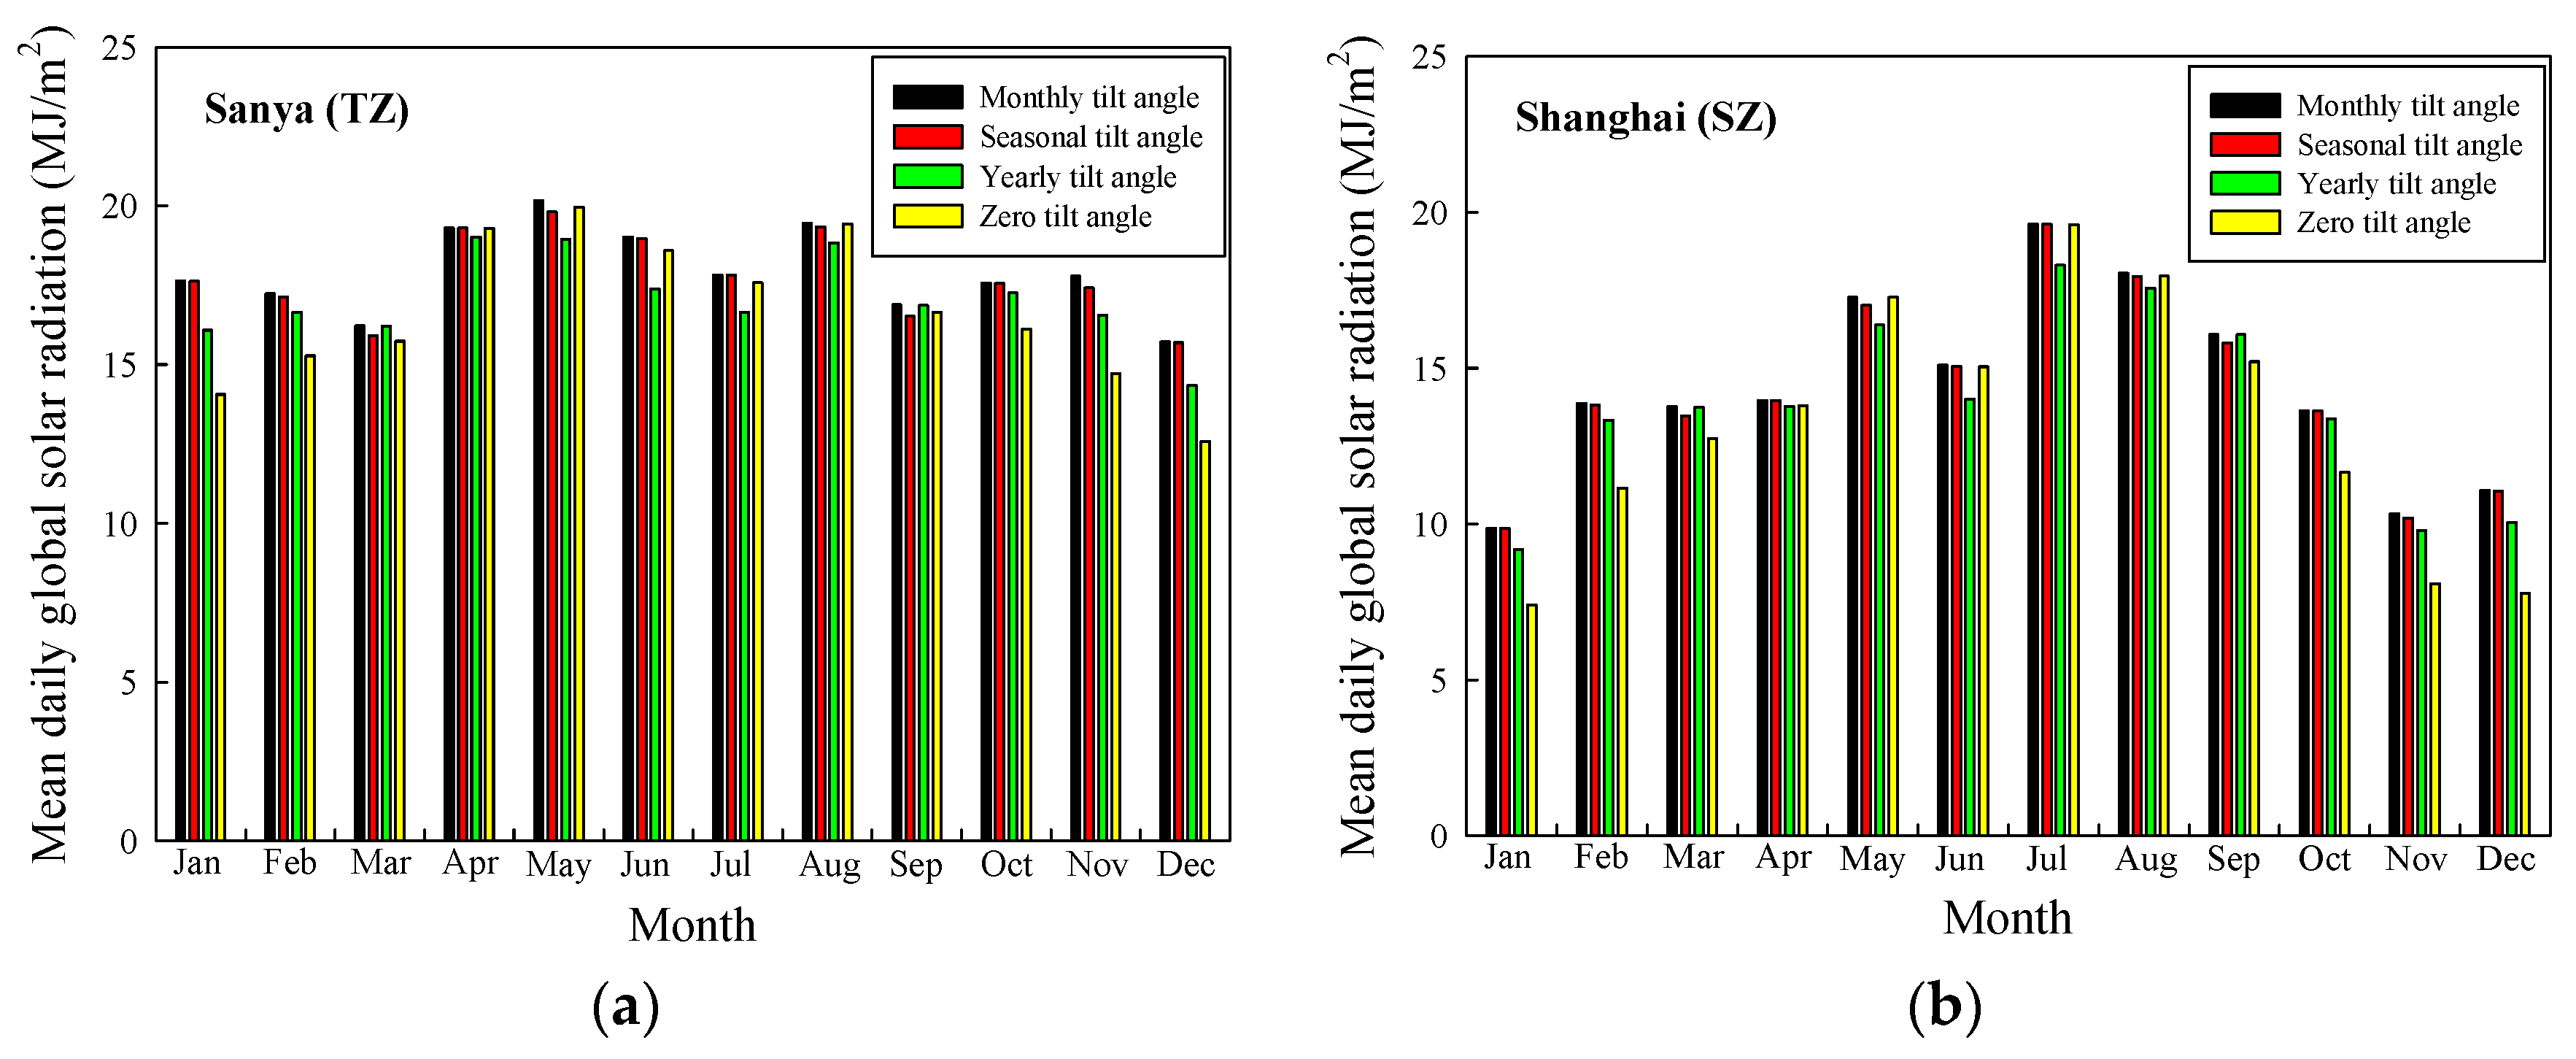
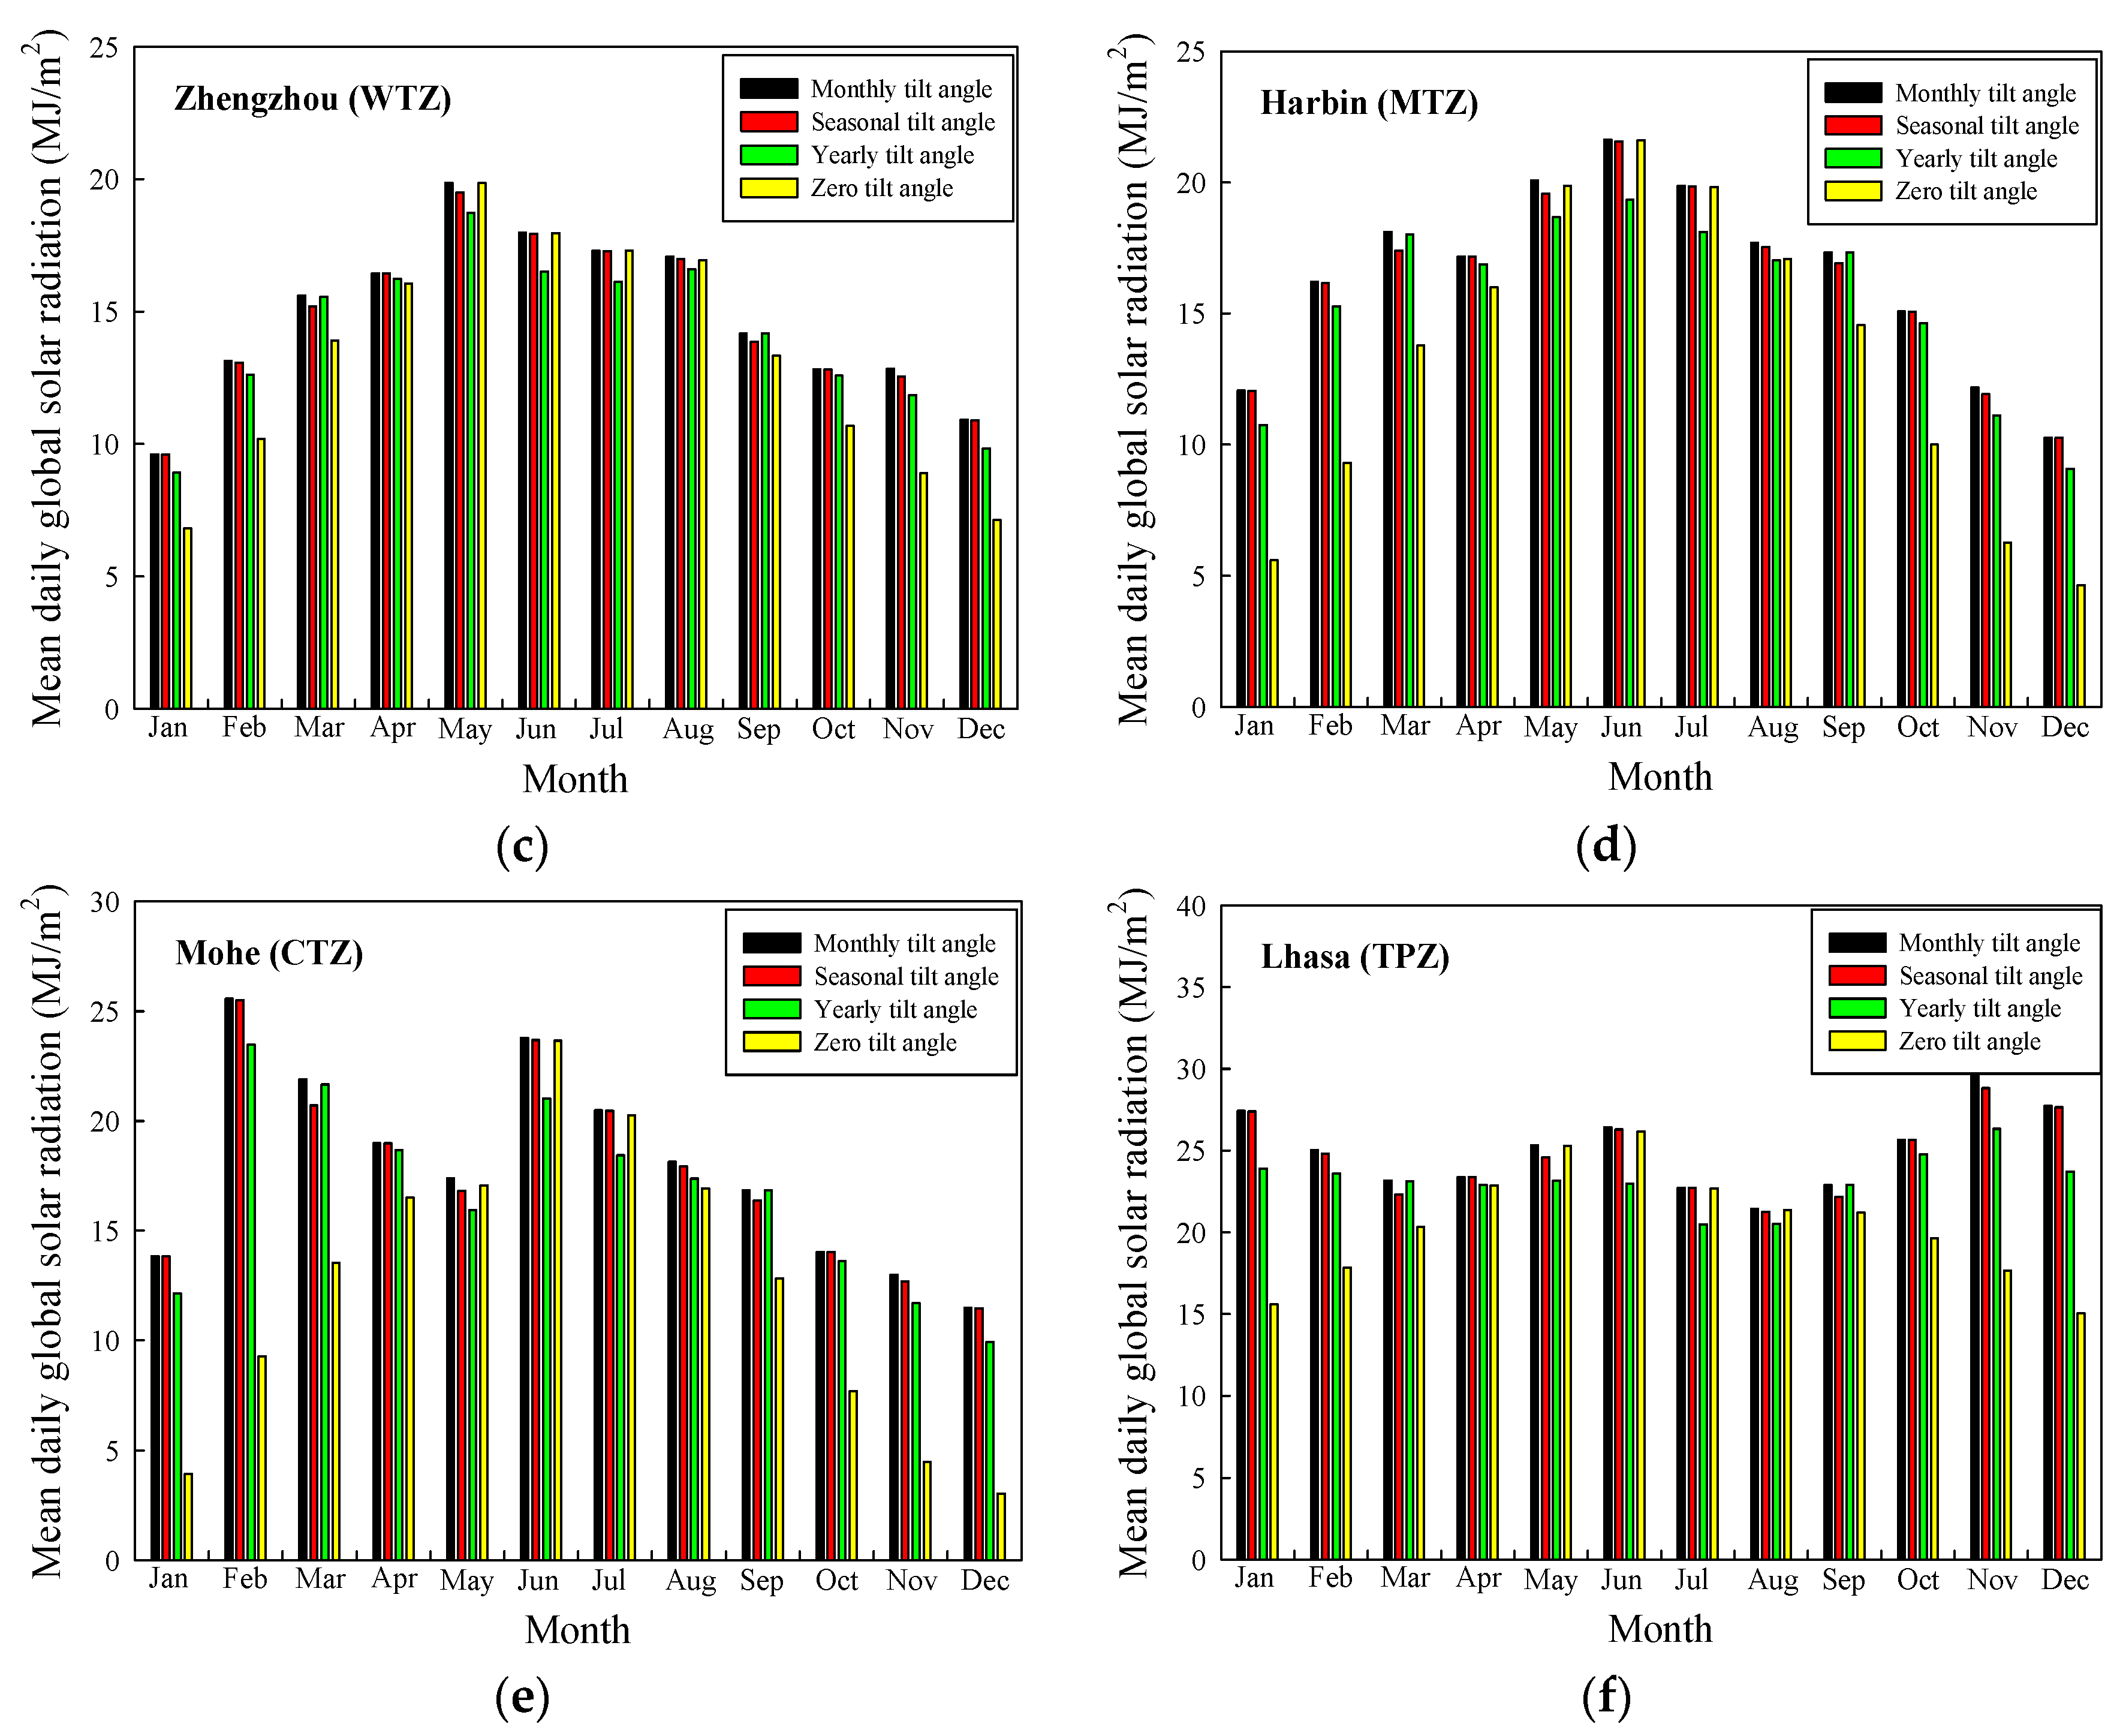
Figure 3 shows the mean daily global solar radiation collected fixed at zero and at optimum monthly, optimum seasonal, and optimum yearly tilt angles for each month at six stations. As shown in the figure, the mean daily global solar radiation on a solar collector fixed at the monthly optimum tilt angle shows a significant increase compared to the horizontal and yearly collectors. Moreover, the mean daily global solar radiation at the optimum tilt angle is generally more than that for the horizontal collector, especially in the spring and winter at the Zhengzhou (WTZ), Harbin (MTZ), Mohe (CTZ), and Lhasa (TPZ) stations.
Additionally, the correlation equations of the optimum tilt angle (βopt) based on the declination factor (δ) are generated and investigated for six stations in different climatic zones of China. These correlation equations are given below, where a, b, c, d are the regression coefficients of δ from degree 0 (constant term) to degree 3, respectively.
β o p t = a b ( δ )
β o p t = a b ( δ ) c ( δ ) 2
β o p t = a b ( δ ) c ( δ ) 2 ( d ) δ 3
The accuracy and suitability of the models is checked by the mean absolute bias error (MABE), the root mean square error (RMSE) and the correlation coefficient (R) [43,44,45]. The values of βopt calculated from the above equations obtained for each station are presented in Table 7. The regression coefficients and the statistical errors of the proposed equations for the six stations in different climates of China are shown in Table 8. The MABE lies between 0.2221 MJ/m2 and 2.5413 MJ/m2, the maximum of RMSE is 2.8892 MJ/m2 and the minimum of RMSE is 0.2697 MJ/m2. Also, the mean value of the correlation coefficients R for all the six stations is as high as 0.9983. The results indicate that the monthly optimum tilt angle data obtained from the proposed models are sufficiently reliable. According to the results of the statistical indicators, Equation (13) generally has the best performance when compared with Equations (11) and (12).

6. Conclusions

The optimum tilt angle plays an important role in enhancing the energy collection of solar collectors. In the present research, the monthly, seasonal, and yearly optimum tilt angles for solar collectors in six different climatic zones of China are computed using the measured weather data from China’s meteorological stations over a 16-year period from 1994 to 2009, including air-dry bulb temperature, relative humidity, wind velocity, and global solar radiation data. The results show that the calculated maximum and minimum monthly optimum tilt angles are −9.7° (June, Sanya) and 78.4° (December, Mohe) at six typical stations. The monthly optimum tilt angles, with Harbin as an example, are studied and analyzed. The yearly average optimum tilt angles for a south-facing solar collector are 15°, 24.2°, 27.4°, 39.0°, 47.1°, and 27.5° in Sanya, Shanghai, Zhengzhou, Harbin, Mohe, and Lhasa, respectively. We have found that the yearly average of the optimum tilt angle is equal to the latitude of the site. This, in general, is in agreement with the results of many other researchers [13,46]. It is observed that six cities have the highest gain in solar radiation intensity when a collector is fixed at the monthly optimum tilt angle. It can be concluded that a yearly average fixed tilt angle can be used in many general applications in order to keep the manufacturing and installation costs of collectors low. For higher efficiency, the collector should be designed such that the tilt angle can easily be changed at least on a seasonal basis, if not monthly. Moreover, the general correlation equations for estimating the monthly optimum angles are developed for six stations at different climatic zones. The three proposed models are investigated using statistical indicators (including MABE, RMSE and R). The results of the statistical analysis indicate that the models in Equations (11)–(13) obtained in the paper can be used to estimate the optimum tilt angle with a high accuracy in China. These correlations can be used elsewhere with similar climatic conditions.
It is expected that the monthly, seasonal, and yearly optimum tilt angles and the general correlation equations giving optimum tilt angles generated in this paper will exert positive effects on pertinent energy-related scientific research and engineering applications in China. Future research will focus on optimum tilt angles and the general correlations on a larger regional scale; we hope to report on such works in the near future.

Acknowledgments

The research is supported by National Natural Science Foundation of China (Program No. 51507052), the China Postdoctoral Science Foundation (Program No. 2015M571653), and the Fundamental Research Funds for the Central Universities (Program No. 2015B02714). The authors also thank the China Meteorological Administration.

Author Contributions

Haixiang Zang is the principal investigator of this work. He performed the simulations and wrote the manuscript; Mian Guo contributed to the data analysis work and language editing; Zhinong Wei and Guoqiang Sun designed the simulations solution and checked the whole manuscript. All authors revised and approved the publication.

Conflicts of Interest

The authors declare no conflict of interest.

References

  1. Despotovic, M.; Nedic, V. Comparison of optimum tilt angles of solar collectors determined at yearly, seasonal and monthly levels. Energy Convers. Manag. 2015, 97, 121–131. [Google Scholar] [CrossRef]
  2. Stanciu, D.; Stanciu, C.; Paraschiv, I. Mathematical links between optimum solar collector tilts in isotropic sky for intercepting maximum solar irradiance. J. Atmos. Sol. Terr. Phys. 2016, 137, 58–65. [Google Scholar] [CrossRef]
  3. Lunde, P.J. Solar Thermal Engineering: Space Heating and Hot Water Systems; John Wiley & Sons Inc.: New York, NY, USA, 1980; p. 635. [Google Scholar]
  4. Garg, H. Treatise on Solar Energy; John Wiley & Sons Inc.: New York, NY, USA, 1982. [Google Scholar]
  5. Erbs, D.; Klein, S.; Duffie, J. Estimation of the diffuse radiation fraction for hourly, daily and monthly-average global radiation. Sol. Energy 1982, 28, 293–302. [Google Scholar] [CrossRef]
  6. Ibrahim, D. Optimum tilt angle for solar collectors used in Cyprus. Renew. Energy 1995, 6, 813–819. [Google Scholar] [CrossRef]
  7. Asl-Soleimani, E.; Farhangi, S.; Zabihi, M. The effect of tilt angle, air pollution on performance of photovoltaic systems in Tehran. Renew. Energy 2001, 24, 459–468. [Google Scholar] [CrossRef]
  8. Kalogirou, S.A. Solar thermal collectors and applications. Prog. Energy Combust. Sci. 2004, 30, 231–295. [Google Scholar] [CrossRef]
  9. Kalogirou, S. The potential of solar industrial process heat applications. Appl. Energy 2003, 76, 337–361. [Google Scholar] [CrossRef]
  10. Gunerhan, H.; Hepbasli, A. Determination of the optimum tilt angle of solar collectors for building applications. Build. Environ. 2007, 42, 779–783. [Google Scholar] [CrossRef]
  11. Lave, M.; Kleissl, J. Optimum fixed orientations and benefits of tracking for capturing solar radiation in the continental United States. Renew. Energy 2011, 36, 1145–1152. [Google Scholar] [CrossRef]
  12. Jafarkazemi, F.; Saadabadi, S.A. Optimum tilt angle and orientation of solar surfaces in Abu Dhabi, UAE. Renew. Energy 2013, 56, 44–49. [Google Scholar] [CrossRef]
  13. Abdolzadeh, M.; Mehrabian, M.A. The Optimal Slope Angle for Solar Collectors in Hot and Dry Parts of Iran. Energy Sources Part A Recovery Util. Environ. Eff. 2012, 34, 519–530. [Google Scholar] [CrossRef]
  14. Bakirci, K. Correlations for Optimum Tilt Angles of Solar Collectors: A Case Study in Erzurum, Turkey. Energy Sources Part A Recovery Util. Environ. Eff. 2012, 34, 983–993. [Google Scholar] [CrossRef]
  15. Bakirci, K. General models for optimum tilt angles of solar panels: Turkey case study. Renew. Sustain. Energy Rev. 2012, 16, 6149–6159. [Google Scholar] [CrossRef]
  16. Kaldellis, J.; Kavadias, K.; Zafirakis, D. Experimental validation of the optimum photovoltaic panels’ tilt angle for remote consumers. Renew. Energy 2012, 46, 179–191. [Google Scholar] [CrossRef]
  17. Kaldellis, J.; Zafirakis, D. Experimental investigation of the optimum photovoltaic panels’ tilt angle during the summer period. Energy 2012, 38, 305–314. [Google Scholar] [CrossRef]
  18. Pourgharibshahi, H.; Abdolzadeh, M.; Fadaeinedjad, R. Verification of computational optimum tilt angles of a photovoltaic module using an experimental photovoltaic system. Environ. Prog. Sustain. Energy 2015, 34, 1156–1165. [Google Scholar] [CrossRef]
  19. Talebizadeh, P.; Mehrabian, M.; Abdolzadeh, M. Prediction of the optimum slope and surface azimuth angles using the genetic algorithm. Energy Build. 2011, 43, 2998–3005. [Google Scholar] [CrossRef]
  20. Čongradac, V.; Prica, M.; Paspalj, M.; Bojanić, D.; Čapko, D. Algorithm for blinds control based on the optimization of blind tilt angle using a genetic algorithm and fuzzy logic. Sol. Energy 2012, 86, 2762–2770. [Google Scholar] [CrossRef]
  21. Chang, Y.-P. Optimal the tilt angles for photovoltaic modules using PSO method with nonlinear time-varying evolution. Energy 2010, 35, 1954–1963. [Google Scholar] [CrossRef]
  22. Tabet, I.; Touafek, K.; Bellel, N.; Bouarroudj, N.; Khelifa, A.; Adouane, M. Optimization of angle of inclination of the hybrid photovoltaic-thermal solar collector using particle swarm optimization algorithm. J. Renew. Sustain. Energy 2014, 6, 053116. [Google Scholar] [CrossRef]
  23. Dixit, T.; Yadav, A.; Gupta, S. Optimization of PV array inclination in India using ANN estimator: Method comparison study. Sadhana 2015, 40, 1457–1472. [Google Scholar] [CrossRef]
  24. Mehleri, E.D.; Zervas, P.L.; Sarimveis, H.; Palyvos, J.A.; Markatos, N.C. Determination of the optimal tilt angle and orientation for solar photovoltaic arrays. Renew. Energy 2010, 35, 2468–2475. [Google Scholar] [CrossRef]
  25. Yang, H.; Lu, L. The Optimum Tilt Angles and Orientations of PV Claddings for Building-Integrated Photovoltaic (BIPV) Applications. J. Sol. Energy Eng. 2005, 129, 253–255. [Google Scholar] [CrossRef]
  26. Sun, L.; Lu, L.; Yang, H. Optimum design of shading-type building-integrated photovoltaic claddings with different surface azimuth angles. Appl. Energy 2012, 90, 233–240. [Google Scholar] [CrossRef]
  27. Tang, R.; Wang, J. A note on multiple reflections of radiation within CPCs and its effect on calculations of energy collection. Renew. Energy 2013, 57, 490–496. [Google Scholar] [CrossRef]
  28. Liu, L.Q.; Wang, Z.X.; Zhang, H.Q.; Xue, Y.C. Solar energy development in China-A review. Renew. Sustain. Energy Rev. 2010, 14, 301–311. [Google Scholar] [CrossRef]
  29. Zhao, H.; Guo, S. External benefit evaluation of renewable energy power in China for sustainability. Sustainability 2015, 7, 4783–4805. [Google Scholar] [CrossRef]
  30. Lau, C.C.S.; Lam, J.C.; Yang, L. Climate classification and passive solar design implications in China. Energy Convers. Manag. 2007, 48, 2006–2015. [Google Scholar] [CrossRef]
  31. Yang, L.; Lam, J.C.; Liu, J.P. Analysis of typical meteorological years in different climates of China. Energy Convers. Manag. 2007, 48, 654–668. [Google Scholar] [CrossRef]
  32. Lam, J.C.; Wan, K.K.W.; Yang, L. Solar radiation modelling using ANNs for different climates in China. Energy Convers. Manag. 2008, 49, 1080–1090. [Google Scholar] [CrossRef]
  33. Argiriou, A.; Lykoudis, S.; Kontoyiannidis, S.; Balaras, C.A.; Asimakopoulos, D.; Petrakis, M.; Kassomenos, P. Comparison of methodologies for tmy generation using 20 years data for Athens, Greece. Sol. Energy 1999, 66, 33–45. [Google Scholar] [CrossRef]
  34. Bulut, H. Generation of typical solar radiation year for mediterranean region of turkey. Int. J. Green Energy 2009, 6, 173–183. [Google Scholar] [CrossRef]
  35. Jiang, Y.N. Generation of typical meteorological year for different climates of China. Energy 2010, 35, 1946–1953. [Google Scholar] [CrossRef]
  36. Marion, W.; Urban, K. User Manual for TMY2s-Typical Meteorological Years; National Renewable Energy Laboratory: Golden, CO, USA, 1995. [Google Scholar]
  37. Wilcox, S.; Marion, W. Users Manual for TMY3 Data Sets; National Renewable Energy Laboratory: Golden, CO, USA, 2008. [Google Scholar]
  38. Finkelstein, J.M.; Schafer, R.E. Improved goodness-of-fit tests. Biometrika 1971, 58, 641–645. [Google Scholar] [CrossRef]
  39. Zang, H.; Xu, Q.; Bian, H. Generation of typical solar radiation data for different climates of China. Energy 2012, 38, 236–248. [Google Scholar] [CrossRef]
  40. Liu, B.; Jordan, R. Daily insolation on surfaces tilted towards equator. Am. Sco. Heat. Refrig. Air Cond. Eng. 1962, 67, 526–541. [Google Scholar]
  41. Page, J.K. The Estimation of Monthly Mean Values of Daily Short Wave Irradiation on Vertical and Inclined Surfces from Sunshine Records for Latitudes 60° N to 40° S; University of Sheffield: South Yorkshire, UK, 1976. [Google Scholar]
  42. Alboteanu, I.L.; Bulucea, C.A.; Degeratu, S. Estimating Solar Irradiation Absorbed by Photovoltaic Panels with Low Concentration Located in Craiova, Romania. Sustainability 2015, 7, 2644–2661. [Google Scholar] [CrossRef]
  43. Menges, H.O.; Ertekin, C.; Sonmete, M.H. Evaluation of global solar radiation models for Konya, Turkey. Energy Convers. Manag. 2006, 47, 3149–3173. [Google Scholar] [CrossRef]
  44. Bulut, H. Generation of typical solar radiation data for’Istanbul, Turkey. Int. J. Energy Res. 2003, 27, 847–855. [Google Scholar] [CrossRef]
  45. Bulut, H.; Büyükalaca, O. Simple model for the generation of daily global solar-radiation data in Turkey. Appl. Energy 2007, 84, 477–491. [Google Scholar] [CrossRef]
  46. Benghanem, M. Optimization of tilt angle for solar panel: Case study for Madinah, Saudi Arabia. Appl. Energy 2011, 88, 1427–1433. [Google Scholar] [CrossRef]
Figure 1. Monthly total global solar radiation data (Harbin) when the tilt angle changes from −20° to 90°, (a) January–June and (b) July–December.
Sustainability 08 00654 g001
Figure 2. Total global solar radiation (Harbin) for determined tilt angles.
Sustainability 08 00654 g002
Figure 3. Comparison between the monthly mean daily solar radiation on a solar collector fixed at zero and at optimum monthly, optimum seasonal, and optimum yearly tilt angles at six different climatic stations. (a) Sanya (TZ); (b) Shanghai (SZ); (c) Zhengzhou (WTZ); (d) Harbin (MTZ); (e) Mohe (CTZ); (f) Lhasa (TPZ).
Sustainability 08 00654 g003aSustainability 08 00654 g003b
Table 1. Geographical locations and weather database for the present study.
No.ClimateLocationLatitude (N)Longitude (E)Elevation (m)Period
1Tropical Zone (TZ)Sanya18°14′109°31′5.91994–2009
2Subtropical Zone (SZ)Shanghai31°24′121°29′61994–2009
3Warm Temperate Zone (WTZ)Zhengzhou34°43′113°39′110.41994–2009
4Mid Temperate Zone (MTZ)Harbin45°45′126°46′142.31994–2009
5Cold Temperate Zone (CTZ)Mohe53°28′122°31′4331994–2009
6Tibetan Plateau Zone (TPZ)Lhasa29°40′91°08′3648.71994–2009
Table 2. Meteorological indices and weighting factors (WFx) for the FS statistic in this study.
NumberParameter IndicesPresent Article
1TemperatureMax Dry Bulb Temperature1/24
2 Min Dry Bulb Temperature1/24
3 Mean Dry Bulb Temperature3/24
4HumidityMin Relative Humidity 1/24
5 Mean Relative Humidity2/24
6WindMax Wind Velocity 2/24
7 Mean Wind Velocity2/24
8Solar radiationGlobal Solar Radiation12/24
Table 3. Summary of TMYs selected and the corresponding monthly average daily global solar radiation (MJ/m2) for the six stations in different climatic zones of China.
ClimateStationMonth
JanuaryFebruaryMarchAprilMayJuneJulyAugustSeptemberOctoberNovemberDecember
TZSanya200220022001200319982000200020022004199520022004
14.0615.2815.7319.2919.9618.5917.5819.4216.6416.1214.7112.58
SZShanghai199719972004200819961998199820042003199719991998
7.4111.1512.7413.8017.2715.0519.6017.9515.2111.668.087.79
WTZZhengzhou199619981995200620001997200220022001200819981998
6.8110.1913.9016.0619.8517.9617.3016.9413.3310.698.907.13
MTZHarbin200319982004199620011995199820092004200420091996
5.599.3113.7916.0019.8721.6119.8117.0914.5510.006.274.56
CTZMohe200320002006200320041999200620062007200520052004
3.949.2713.5416.5117.0523.6520.2616.9212.837.694.493.04
TPZLhasa200119992008200819942002199920052001200020012001
15.6017.8220.3522.8725.3026.1922.6721.3521.2019.6317.6415.03
Table 4. Monthly representative day and its corresponding declination (δ).
MonthJanuaryFebruaryMarchAprilMayJune
Day (n)174775105135162
Declination (δ)−20.92−12.95−2.439.4118.7923.09
MonthJulyAugustSeptemberOctoberNovemberDecember
Day (n)198228258288318344
Declination (δ)21.1813.462.22−9.60−18.91−23.05
Table 5. Monthly, seasonal, and yearly optimum tilt angles for six selected stations.
StationPeriodMonth
JanuaryFebruaryMarchAprilMayJuneJulyAugustSeptemberOctoberNovemberDecember
Sanya (TZ)Monthly42.932.517.42.7−9.7−14.7−11.6−2.811.927.839.943.3
Seasonal39.639.63.53.53.5−9.7−9.7−9.726.526.526.539.6
Yearly15.015.015.015.015.015.015.015.015.015.015.015.0
Shanghai (SZ)Monthly49.143.127.411.6−0.3−5.2−3.57.42337.646.653.2
Seasonal48.648.612.912.912.9−0.4−0.4−0.435.735.735.748.6
Yearly24.224.224.224.224.224.224.224.224.224.224.224.2
Zhengzhou (WTZ)Monthly53.14632.315.62.2−3.9−1.39.824.640.353.357
Seasonal52.052.016.716.716.71.51.51.539.439.439.452.0
Yearly27.427.427.427.427.427.427.427.427.427.427.427.4
Harbin (MTZ)Monthly68.260.545.926112.66.319.238.254.865.469.4
Seasonal66.066.027.627.627.69.49.49.452.852.852.866.0
Yearly39.039.039.039.039.039.039.039.039.039.039.039.0
Mohe (MTZ)Monthly76.971.256.23515.99.312.426.546.162.874.378.4
Seasonal75.575.535.735.735.716.116.116.161.161.161.175.5
Yearly47.147.147.147.147.147.147.147.147.147.147.147.1
Lhasa (TPZ)Monthly58.548.332.213.9−1.7−8.5−56.825.243.756.560.5
Seasonal55.855.814.814.814.8−2.2−2.2−2.241.841.841.855.8
Yearly27.527.527.527.527.527.527.527.527.527.527.527.5
Table 6. H0, KT, Hd, βopt, HT, and comparison with H of Harbin.
MonthH0 (MJ/m2)KTHd (MJ/m2)βopt (°)HT (MJ/m2)The Comparison HT with H (%)
January11.130.502.4268.212.06115.69
February16.400.573.3460.516.2274.21
March24.570.565.0445.918.1231.42
April32.090.506.982617.187.39
May40.470.498.841120.081.04
June41.780.528.982.621.620.05
July42.910.469.486.319.870.30
August36.430.478.0319.217.703.58
September26.950.545.6738.217.3319.13
October19.370.524.1654.815.0850.80
November13.020.482.8665.412.1894.23
December10.250.452.2769.410.27120.95
Table 7. The values of the monthly optimum tilt angle (in degrees) calculated from correlations obtained for each station.
StationEquationMonth
JanuaryFebruaryMarchAprilMayJuneJulyAugustSeptemberOctoberNovemberDecember
Sanya (TZ)(11)42.031.718.12.8−9.3−14.8−12.4−2.412.127.439.444.8
(12)42.131.718.12.8−9.3−14.8−12.3−2.412.127.439.544.8
(13)41.932.318.22.3−9.4−14.2−12.2−2.911.927.939.644.3
Shanghai (SZ)(11)50.840.727.312.20.3−5.1−2.77.121.436.448.253.5
(12)50.241.028.212.90.0−6.1−3.37.422.337.047.952.5
(13)50.041.628.412.3−0.2−5.5−3.26.822.137.648.052.0
Zhengzhou (WTZ)(11)55.244.630.715.02.5−3.2−0.69.624.540.252.558.0
(12)54.545.031.615.62.2−4.1−1.39.925.540.852.257.0
(13)54.445.331.715.32.1−3.8−1.29.625.441.152.356.7
Harbin (MTZ)(11)69.758.042.525.211.45.17.819.235.753.166.872.9
(12)68.059.045.227.010.52.36.020.138.454.965.870.1
(13)67.859.745.426.310.33.06.219.538.255.666.069.5
Mohe (MTZ)(11)79.367.150.832.618.211.614.526.443.761.976.382.6
(12)77.068.454.435.117.08.012.127.647.364.375.079.0
(13)76.869.354.734.216.88.812.326.747.065.175.278.1
Lhasa (TPZ)(11)59.447.331.313.2−1.0−7.6−4.77.124.242.256.462.7
(12)58.647.732.514.1−1.4−8.8−5.57.525.443.055.961.4
(13)58.448.332.713.5−1.6−8.2−5.36.925.343.656.160.8
Table 8. Regression coefficients and statistical indicators (MABE, RMSE, R) of Equations (11)–(13) at six different climatic stations.
StationEquationabcdMABERMSER
(MJ/m2)(MJ/m2)
Sanya (TZ)(11)14.99881.29230.56650.67510.9995
(12)14.93531.2924−0.00020.54910.67360.9995
(13)14.93071.3636−0.0002−0.00020.44290.54890.9997
Shanghai (SZ)(11)24.19821.27040.94911.19310.9995
(12)25.14631.26990.00360.81860.98290.9989
(13)25.14131.34600.0036−0.00020.75230.89010.9991
Zhengzhou (WTZ)(11)27.44961.32570.80561.00480.9995
(12)28.45501.32520.00380.51010.70360.9989
(13)28.45221.36830.0038−0.00010.52560.66280.9990
Harbin (MTZ)(11)38.99481.47031.80212.08100.9995
(12)41.74881.46890.01030.57010.68600.9960
(13)41.74301.55790.0103−0.00020.40970.48300.9962
Mohe (CTZ)(11)47.12161.54022.54132.88920.9995
(12)50.74941.53850.01361.04511.28420.9940
(13)50.74181.65510.0136−0.00030.87021.11390.9942
Lhasa (TPZ)(11)27.57111.52220.87961.02730.9995
(12)28.82631.52160.00470.44310.50350.9988
(13)28.82121.59930.0047−0.00020.22210.26970.9989

