
Analysis and Optimization of Power Supply Structure Based on Markov Chain and Error Optimization for Renewable Energy from the Perspective of Sustainability


Abstract
:1. Introduction
2. Basic Theory
2.1. Markov Property, Markov Process and Markov Chain
2.2. Transition Probability
2.3. The Ergodic Property of a Markov Chain
2.4. Error Optimization Transition Probability Matrix Estimation Method
3. Case Study
3.1. Prediction of Power Supply Structure Based on the Optimized Markov Model
3.2. Analysis of the Equilibrium State of Regional Power Supply Structure
4. Optimization Adjustment Strategy for Power Supply Structure
4.1. Developing Renewable Energy Friendly Power Systems
4.2. Rational Planning of Development Scale Power Grids and Renewable Energy Power
- (1)
- Central and local governments should be coordinated in renewable energy source planning. The central level of renewable energy power development planning should be strategic and directional planning, while the local renewable energy power supply planning should carry out the specific scientific planning within the frame and scope of central planning. Central planning and local planning must coordinate with each other to form a scientific and rational planning system. That is, on the one hand, it is important to enhance the attractiveness local renewable energy development; on the other hand, the construction scale and speed of local renewable energy sources should planned with reason to avoid renewable energy power generation projects being blindly launched.
- (2)
- Renewable energy power planning, overall power planning and other power planning should be coordinated with each other. To achieve sustainable renewable energy development in the future, we need a flexible peaking power plan to speed up peaking power planning of fuel power generation and pumping storage power, actively develop coal-fired units with great peak performance, high parameters, large capacity and high efficiency. Under the premise of ecological environment protection, the construction of large hydropower stations with good regulation performance should speed up to meet the needs of the power system load, and promote the coordinated development of new energy power and supporting peaking power.
- (3)
- Renewable energy source planning should be coordinated with regional power grid planning. With the further expansion of the scale of renewable energy power construction, renewable energy source development planning must be explicitly given priority regarding its status in the power system. For a large-scale new energy power base, planning schemes which promote consumption must be elaborated ahead of time to realize the coordinated development of renewable energy power and regional power grid planning.
4.3. Improving Operation
- (1)
- We should give full play to the advantages of scheduling systems to achieve coordination and cooperation at all levels. At present, China’s power grid has formed a three level-scheduling system, dispatching on the state, province and regional levels. We should make full use of existing management modes, give full play to scheduling functions of all levels, achieve scheduling coordination at all levels, further enhance the interprovincial transmission capacity and realize cross-scheduling by optimizing regional power grid operation modes.
- (2)
- We should learn from foreign advanced scheduling operation management technology and methods. By setting up special grid-dispatching operation research institutions and establishing renewable energy power analysis platforms, we can realize real-time tracking of the national and world’s major countries’ renewable energy power operation. On this platform, timely analysis and comparison could be carried out to further understand and grasp the latest trends of developments in renewable energy sources and advanced power grid dispatching operation experience, which will further enhance and improve renewable energy power dispatching operation management methods and means.
- (3)
- A real-time scheduling monitoring network for renewable energy should be established. To realize the controllability and adjustment of renewable energy power generation, power grids must establish a dispatching and monitoring network, which covers the whole renewable energy electricity market to achieve grid interconnection. Research on renewable energy power prediction methods and technology would help to improve the precision of power prediction and enhance dispatching and control capabilities of power grids.
4.4. Actively Promoting Renewable Energy Quota System
5. Conclusions
- (1)
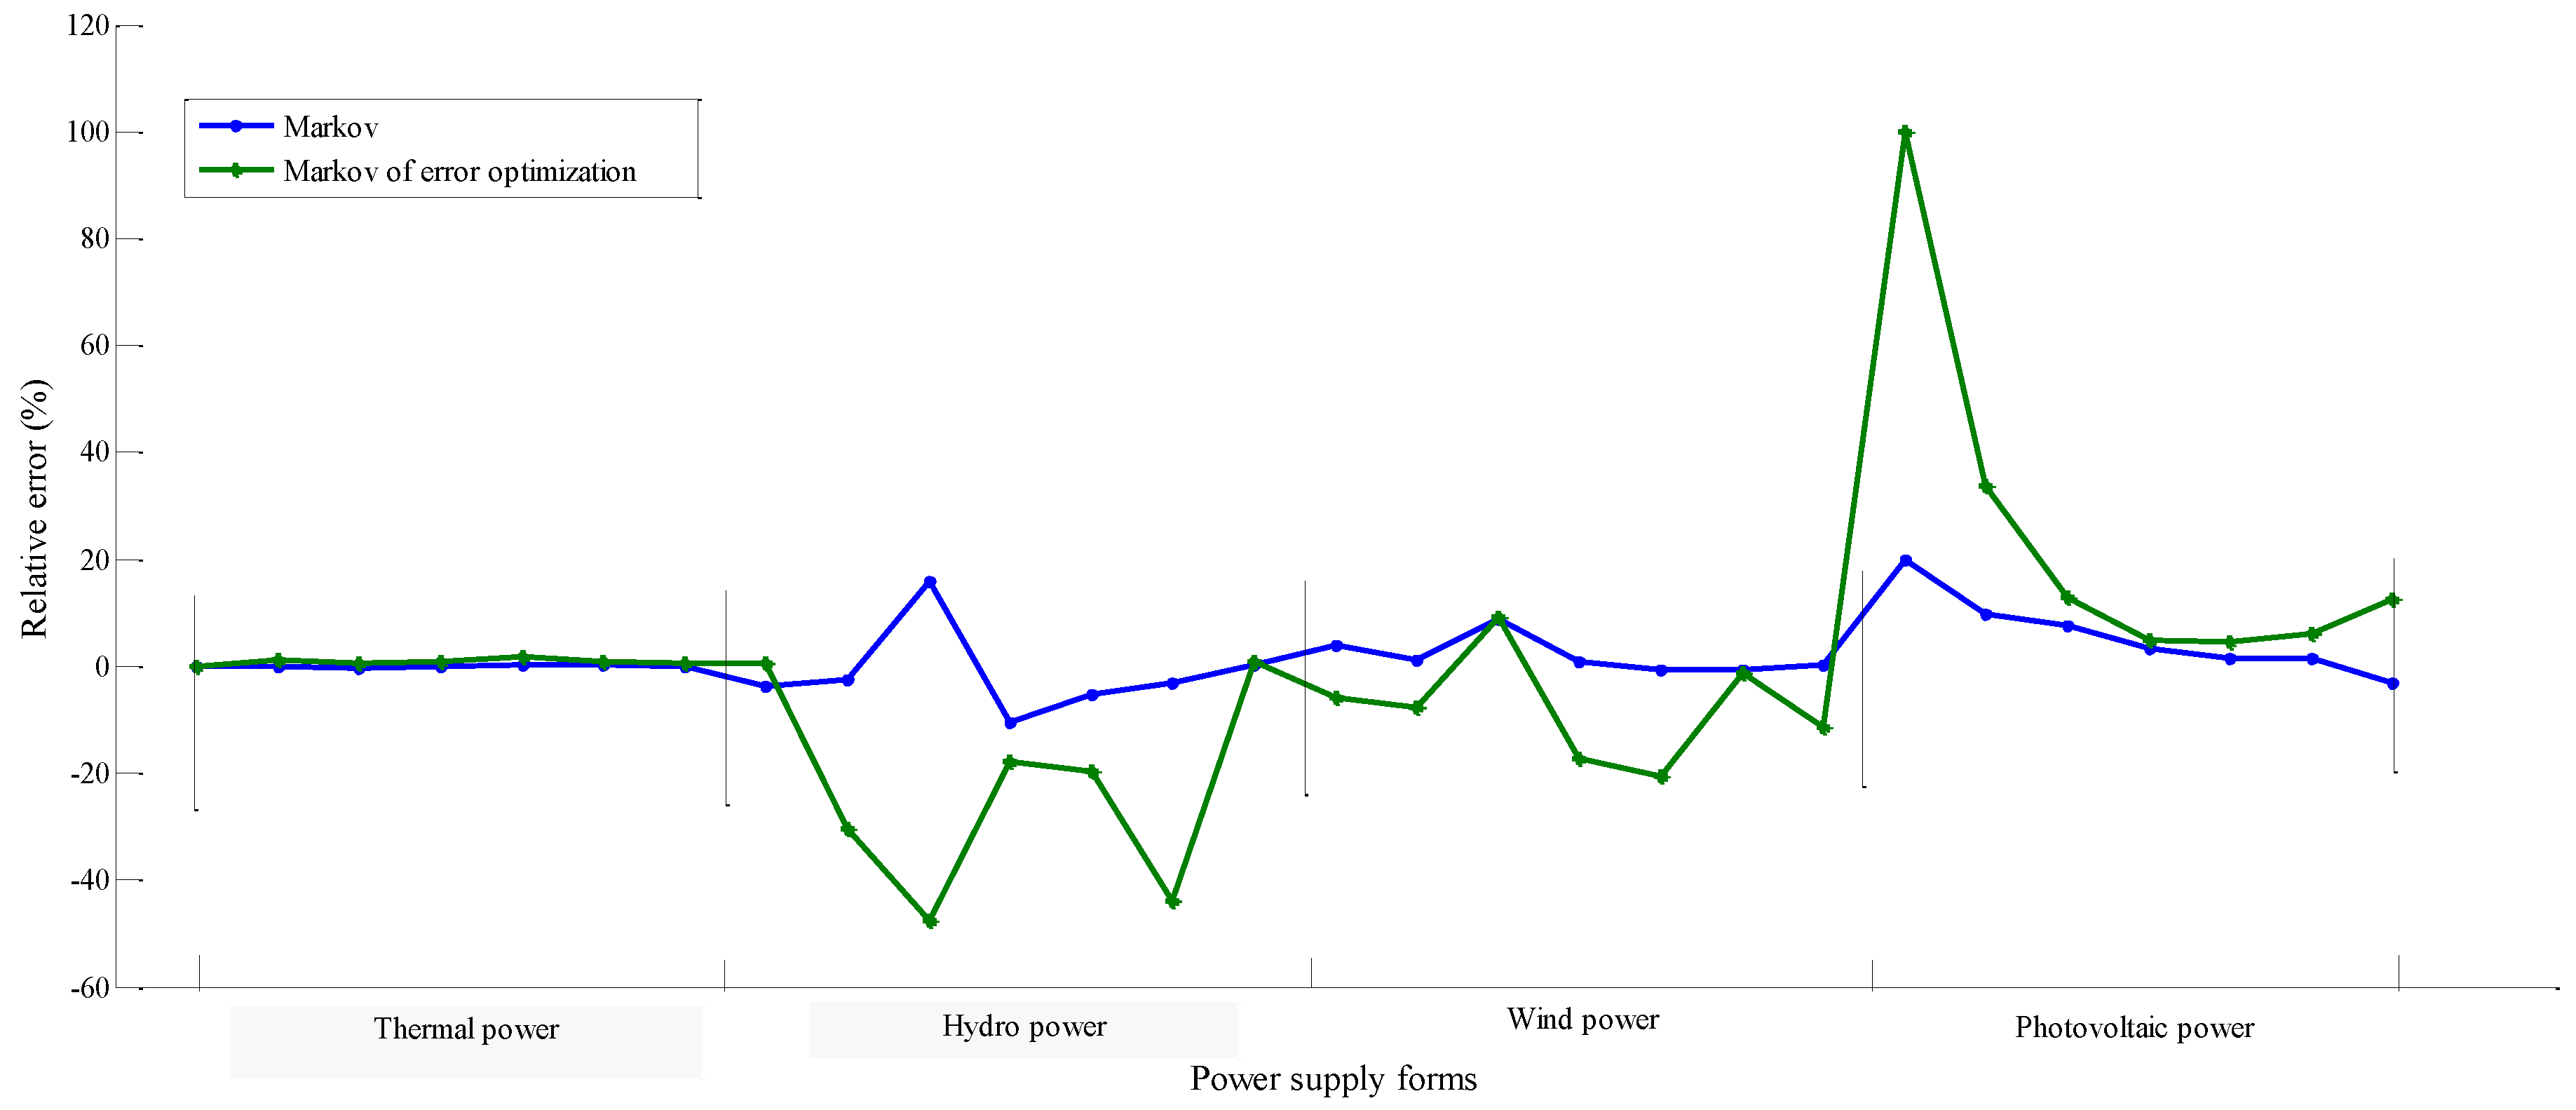
- Through the establishment of a Markov prediction model based on error optimization and the prediction of renewable energy in Ningxia Province, we conclude that the model can accurately reflect structural trends of the renewable energy on-grid generation in the area. In comparison with the traditional Markov model, the fitting degree of the prediction results is higher, which verifies the effectiveness of the optimization model.
- (2)
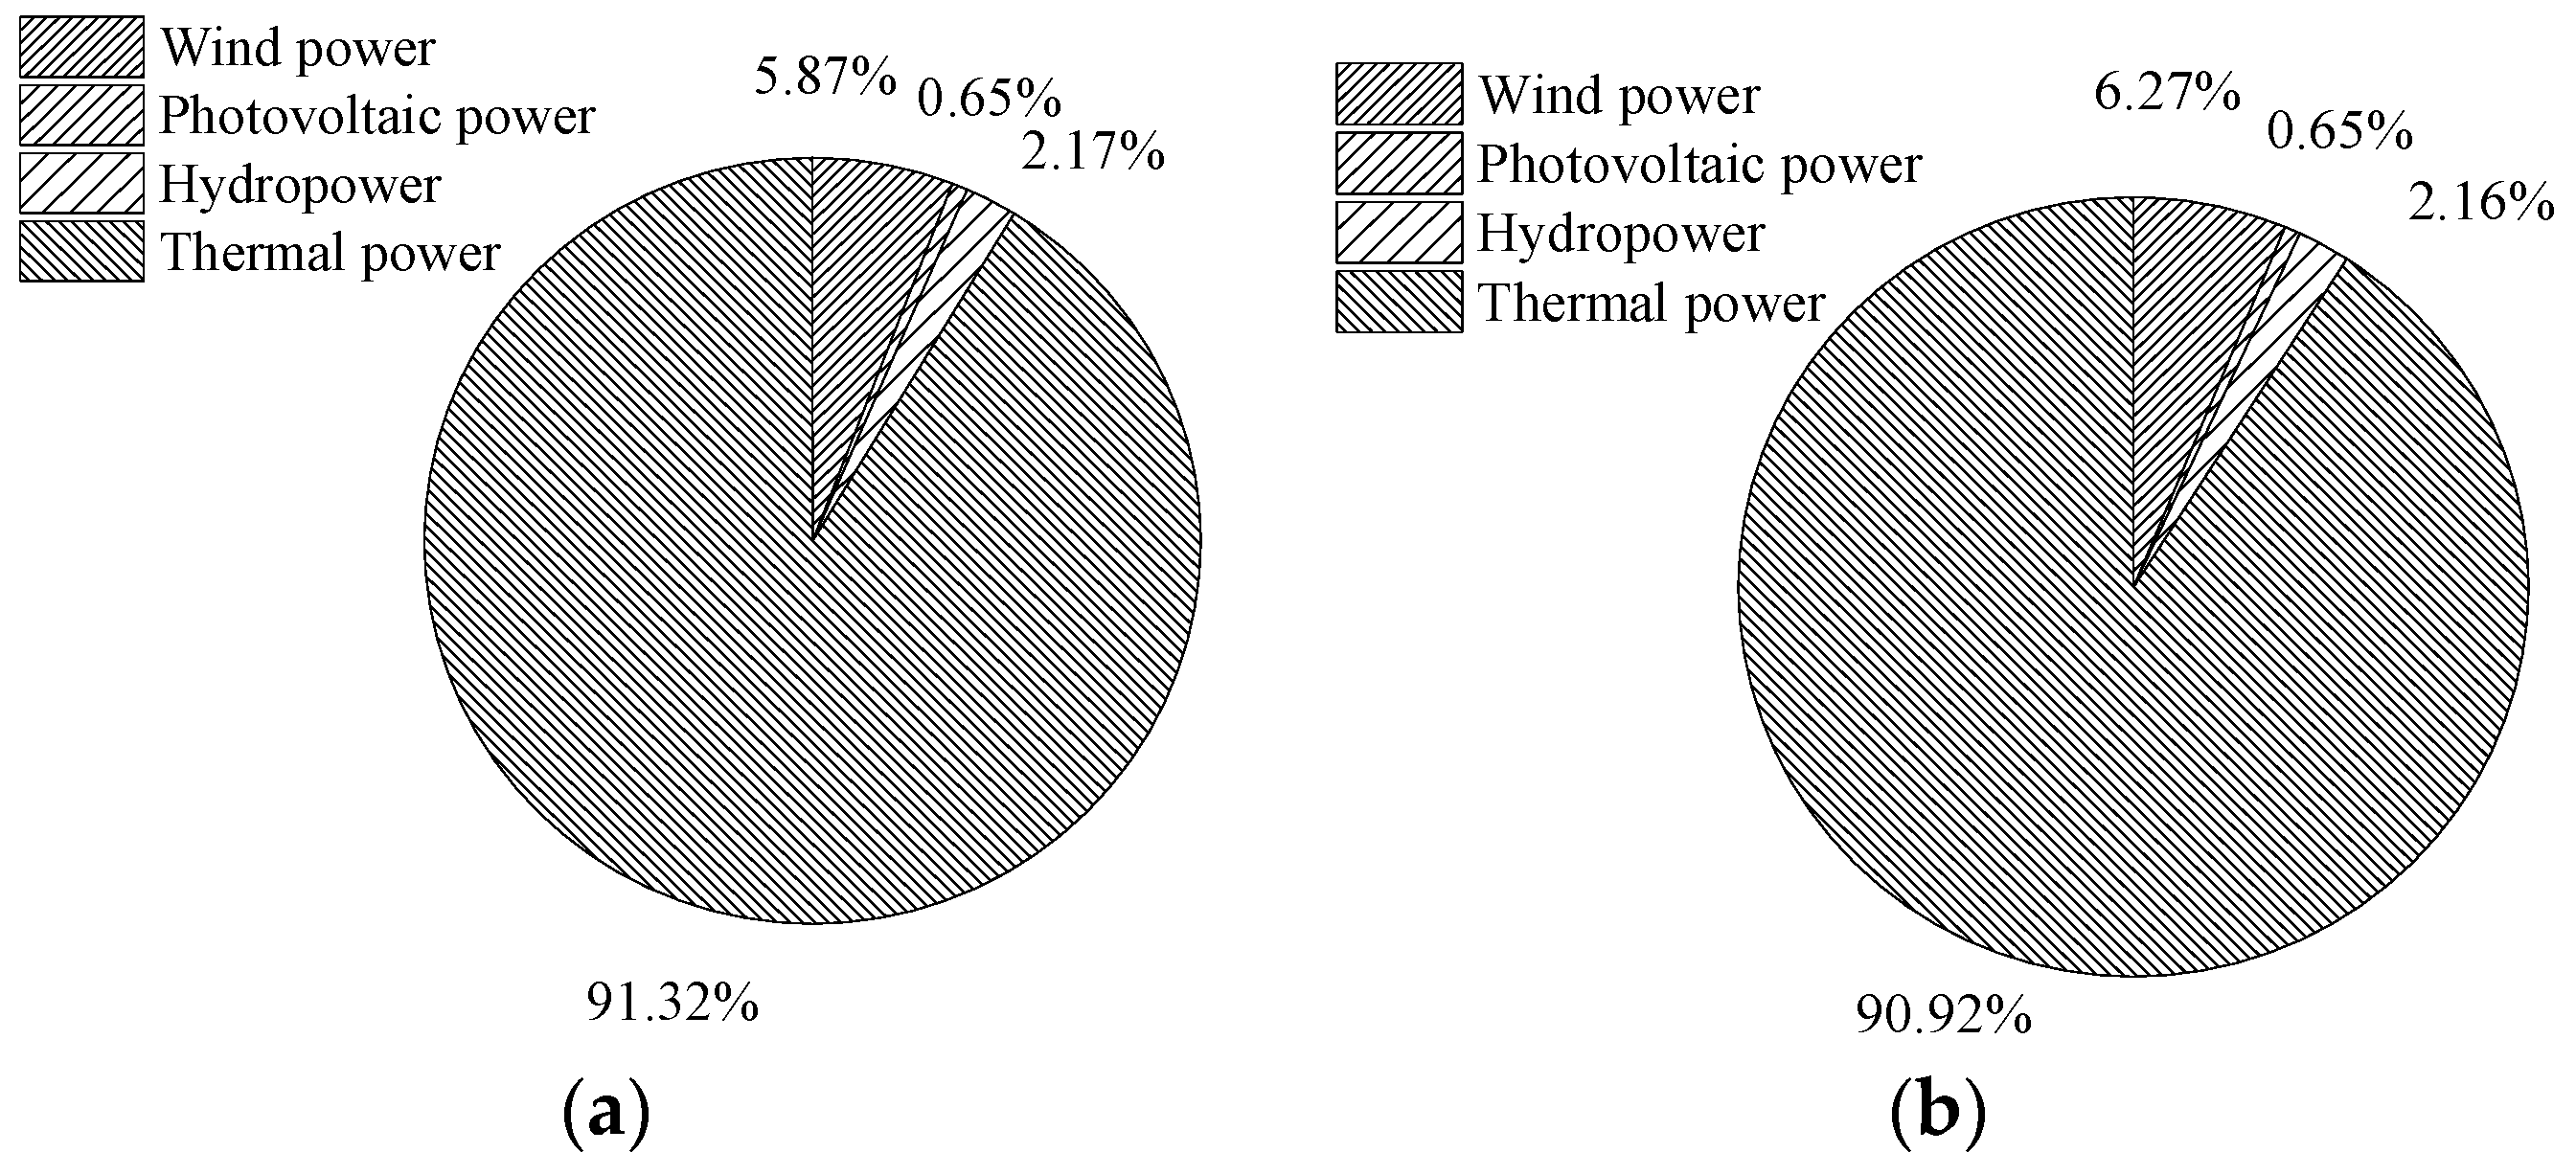
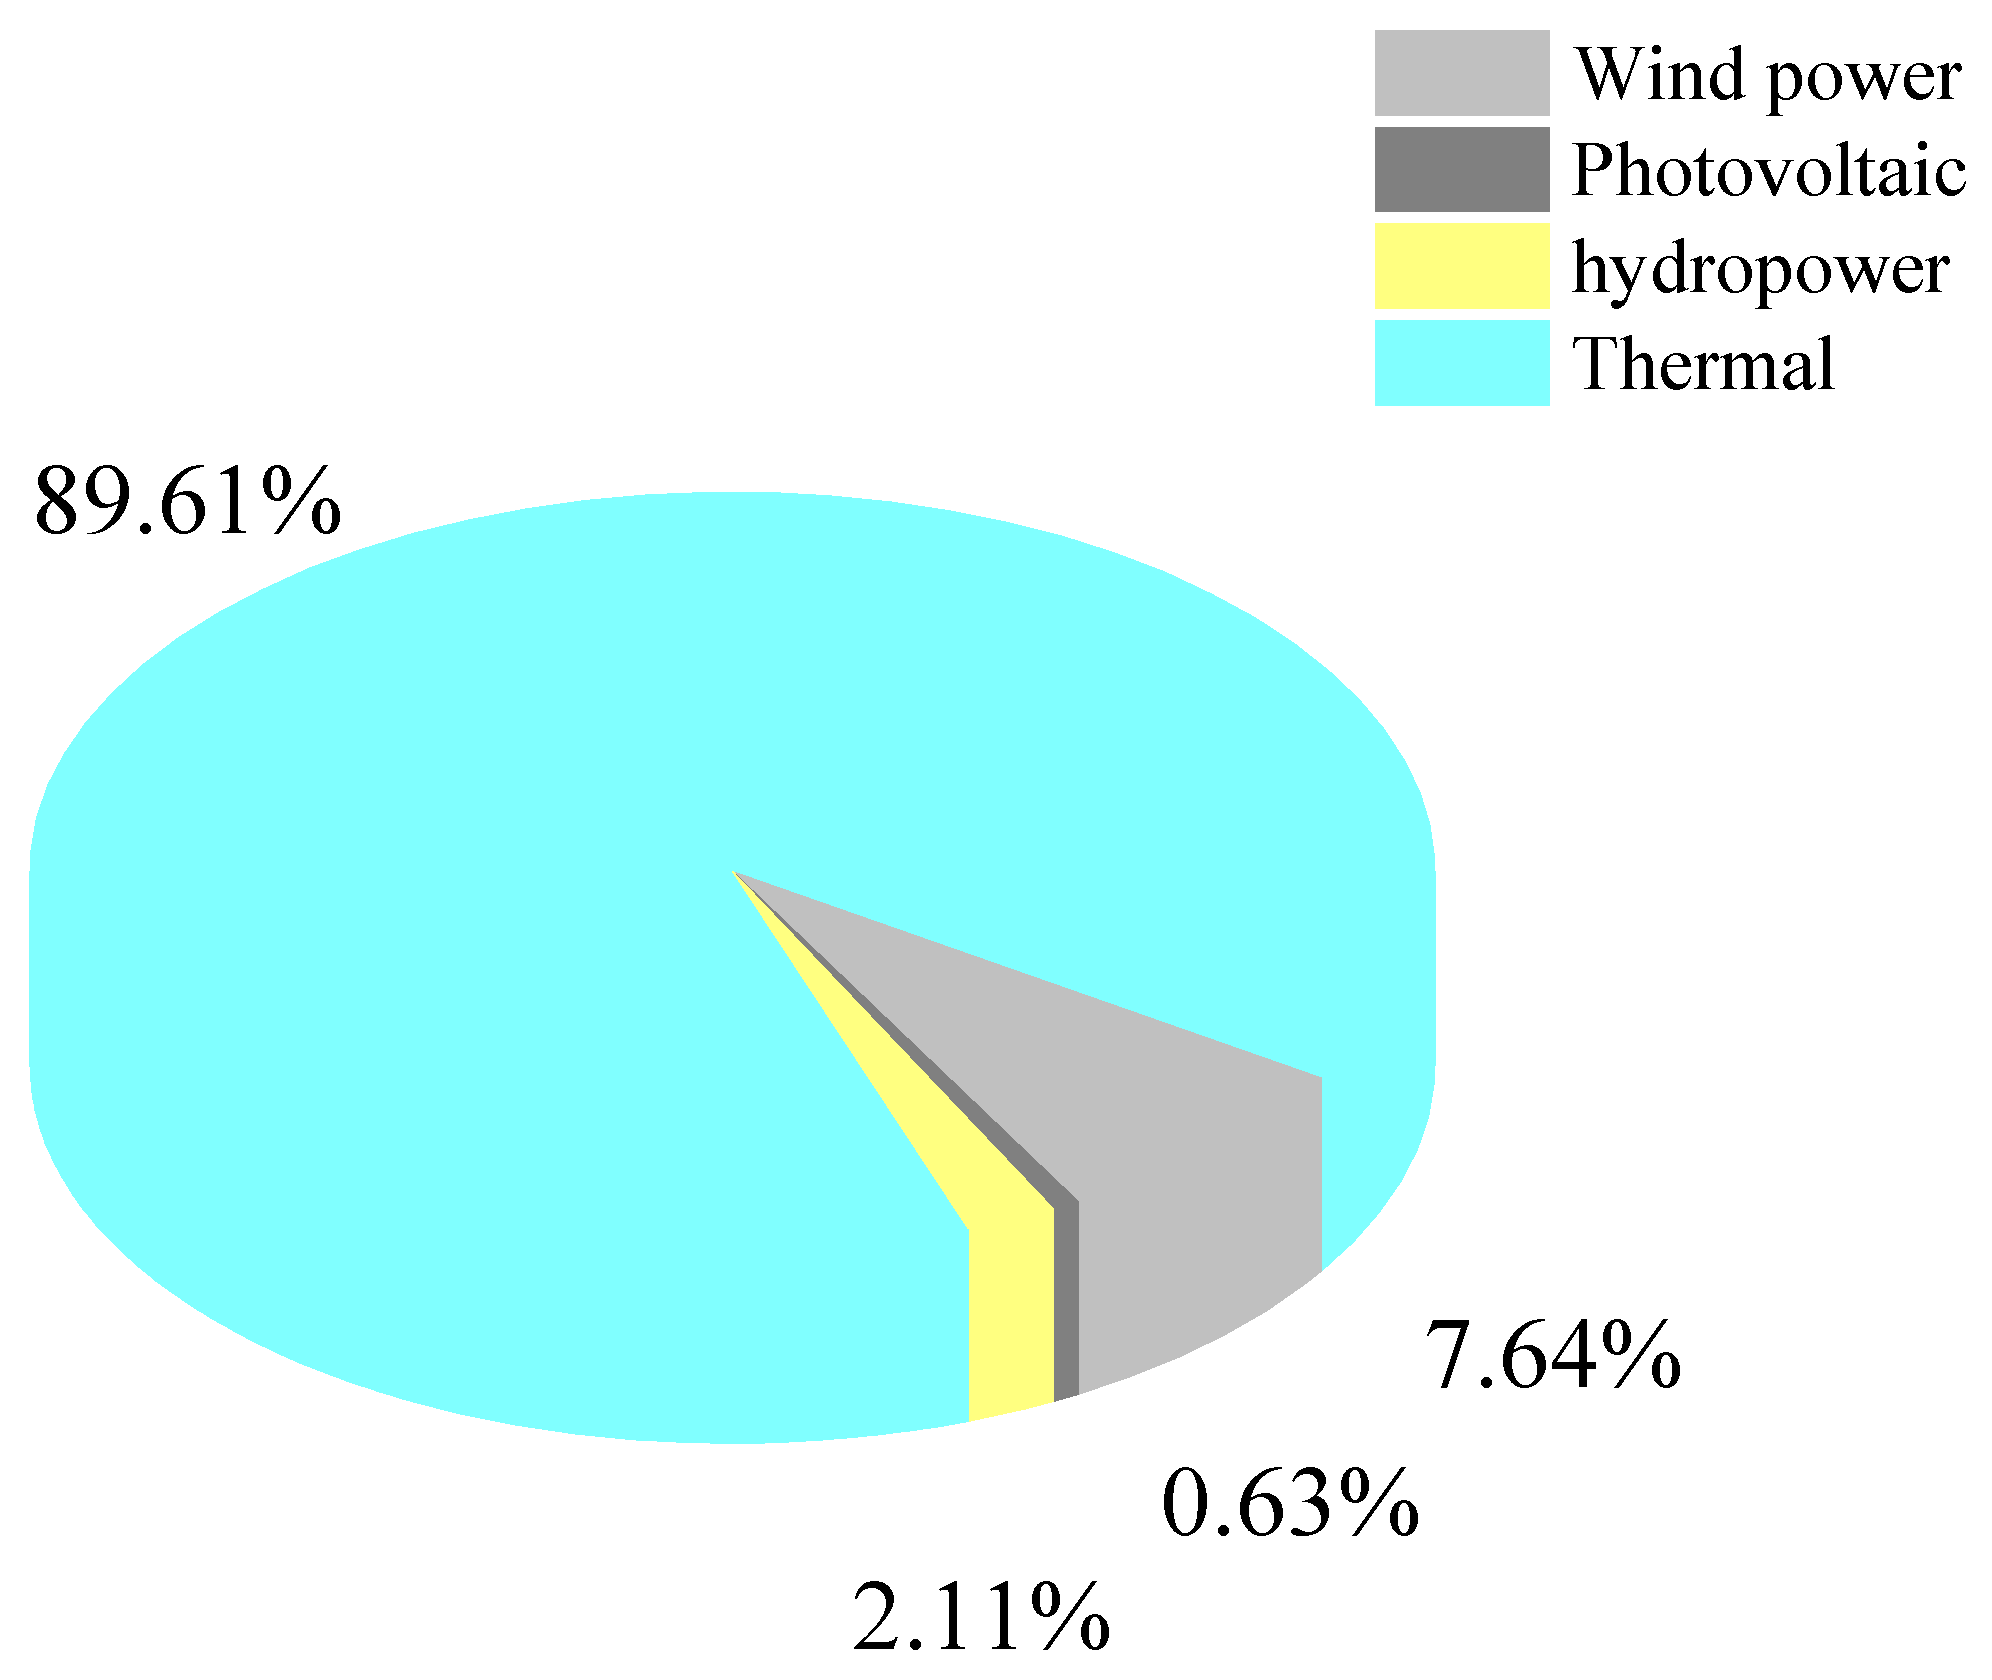
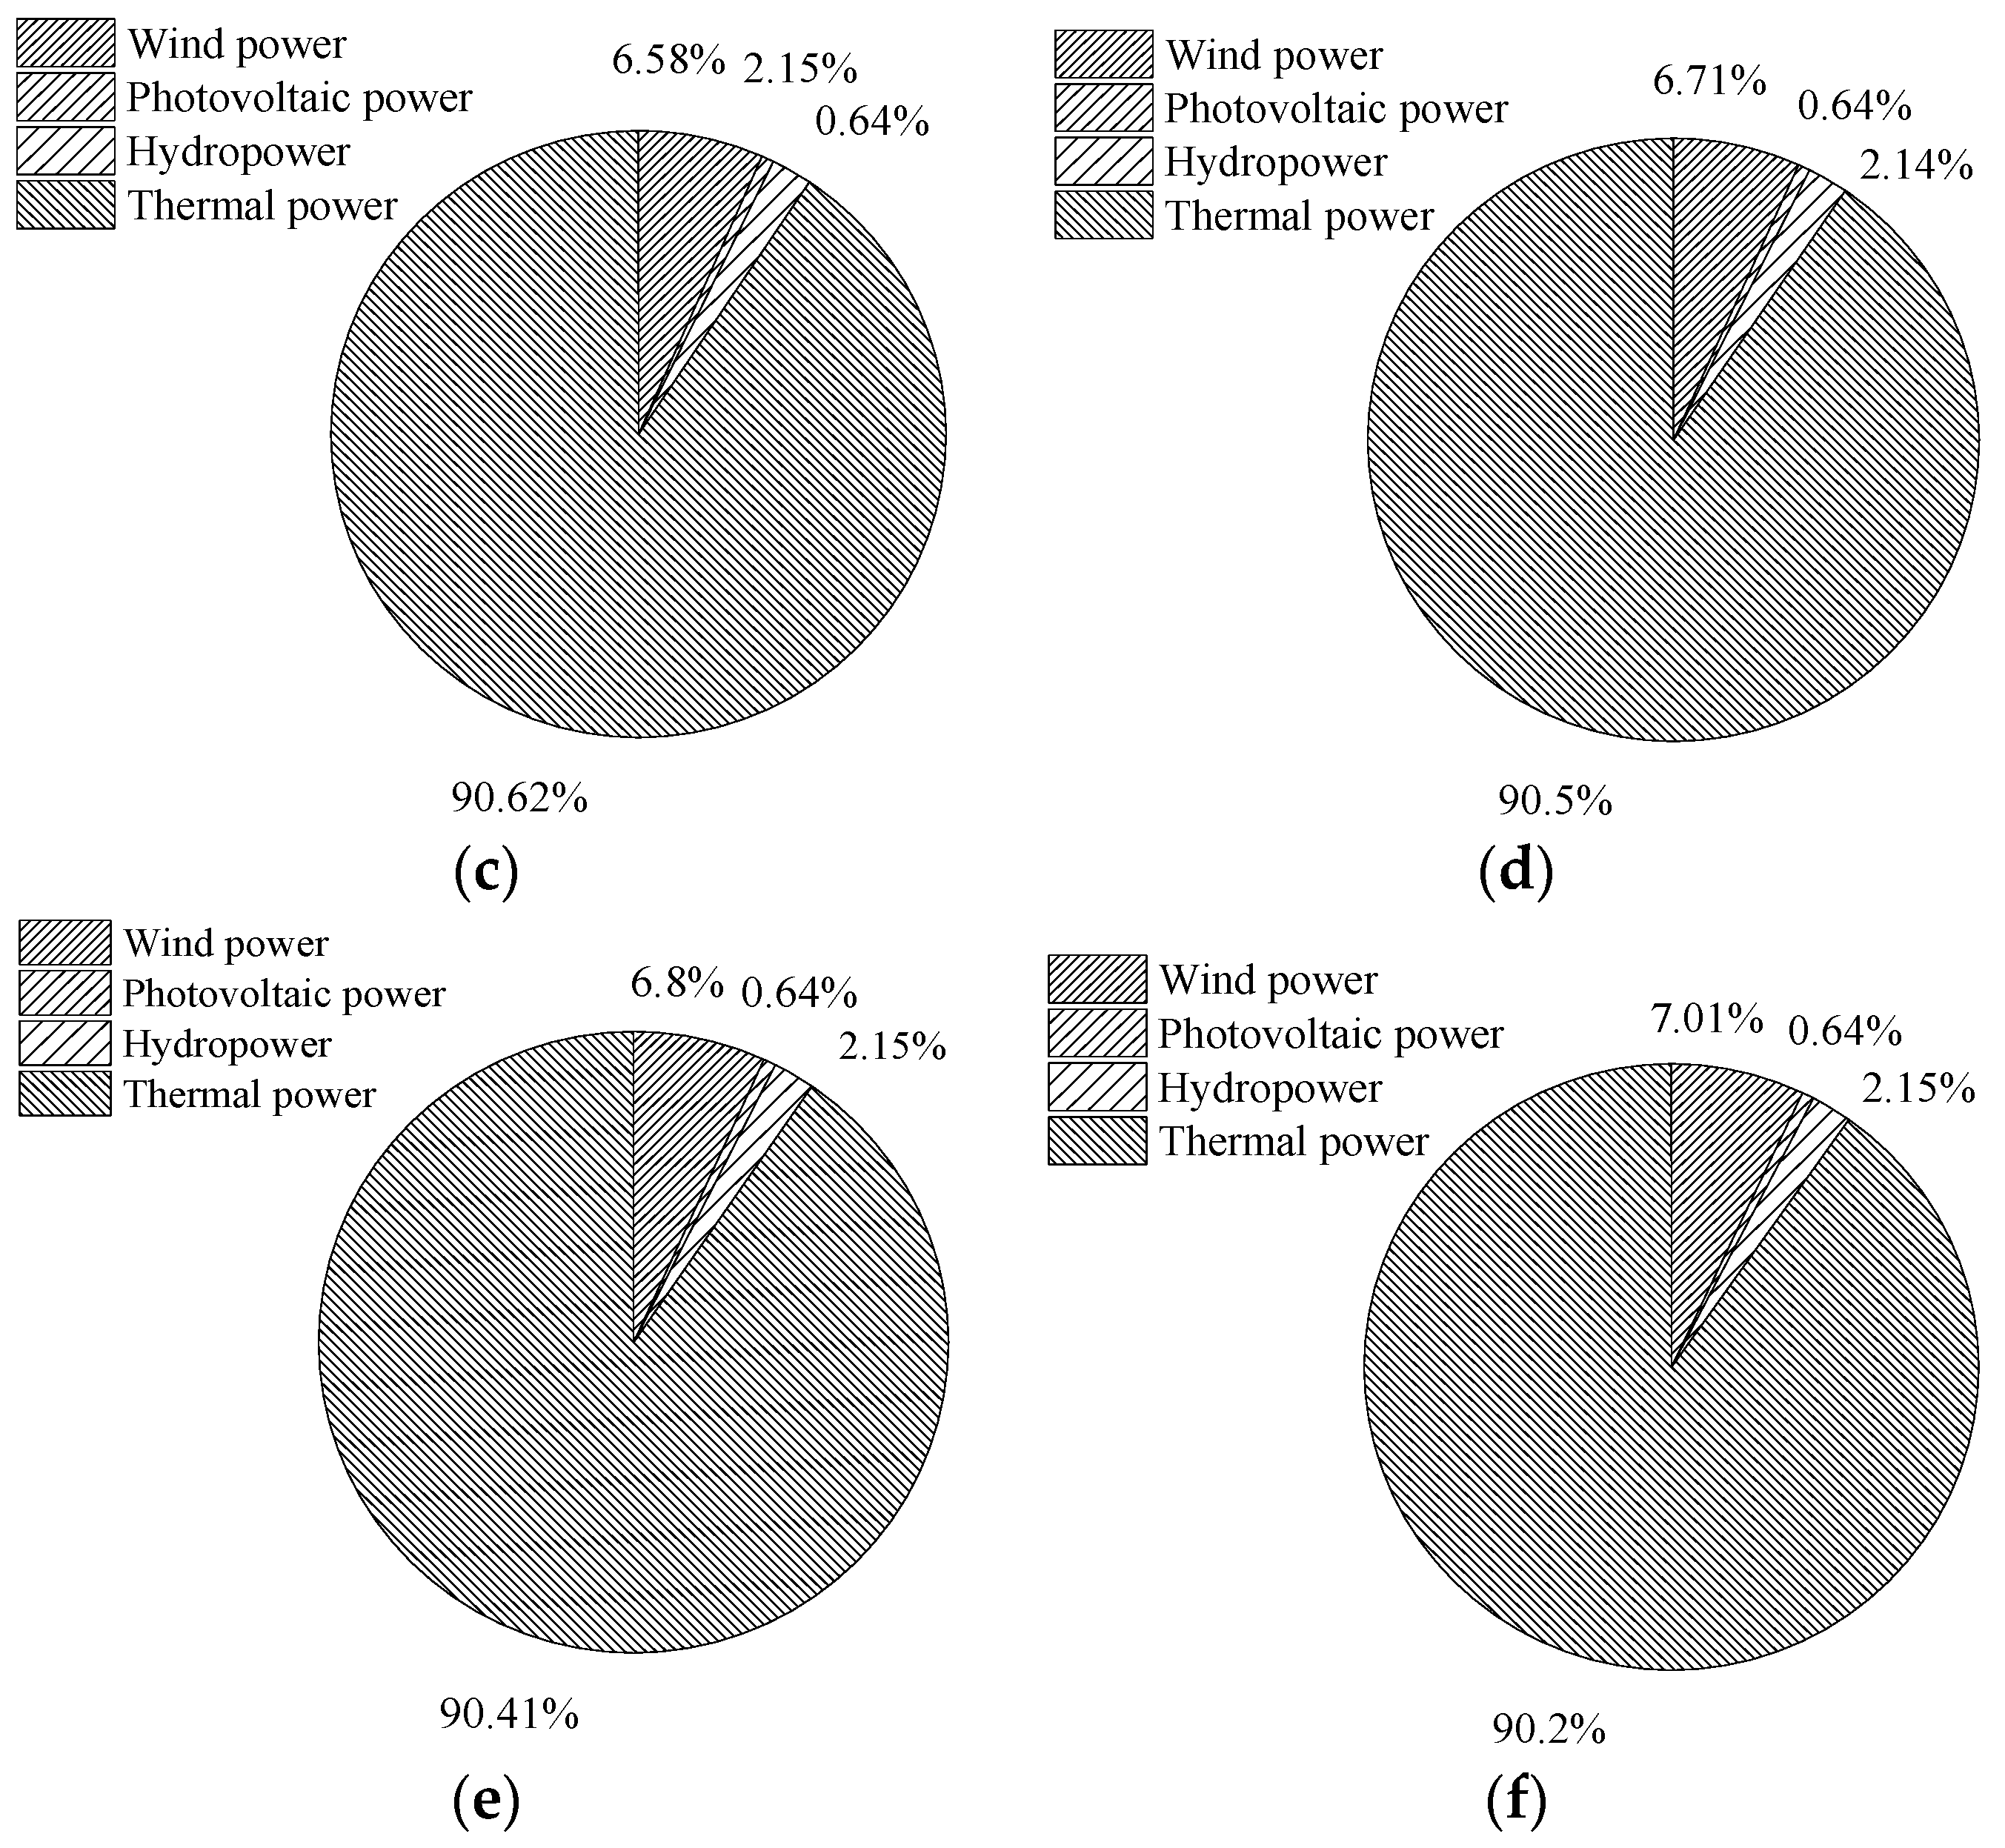
- By constructing a structure transfer model for Ningxia Province and predicting the power supply structure, it shows that the future supply structure will remain largely unchanged when regarding the equilibrium state of the area. Although the proportion of thermal on-grid power generation has declined gradually, due to the characteristics of the region’s energy structure, the overall power structure that is mainly based on thermal power will change in the short term and thermal power will continue to occupy a large proportion of the on-grid power generation. Finally, the structure of the balance of on-grid generation is: 7.644% wind power, 0.634% solar photovoltaic, 2.111% hydropower and 89.611% thermal power.
- (3)
- In order to improve the renewable energy grid electricity ratio and promote the coordinated development of renewable energy and traditional power grid, this paper has proposed optimization adjustment strategies for renewable energy power supply with regard to the three aspects of power grid development, power planning, scheduling and policy, which indicate direction for the development of renewable energy and power supply structure in the future.
Acknowledgments
Author Contributions
Conflicts of Interest
References
- Munoz, F.D.; Hobbs, B.F.; Watson, J.P. New bounding and decomposition approaches for MILP investment problems: Multi-area transmission and generation planning under policy constraints. Eur. J. Oper. Res. 2016, 248, 888–898. [Google Scholar] [CrossRef]
- Jia., Y.W.; Gao, Y.; Xu, Z.; Wong, K.P.; Lai, L.L.; Xue, Y.; Dong, Z.Y.; Jill, D.J. Powering China’s Sustainable Development with Renewable Energies: Current Status and Future Trend. Electr. Power Compon. Syst. 2015, 43, 1193–1204. [Google Scholar] [CrossRef]
- Song, Y.H.; Zhang, C.; Tan, Z.F.; Shi, Q.S. Interregional Electric Power Planning Model Based on Sustainable Development of Wind Power. J. Energy Eng. 2015, 141, 1–10. [Google Scholar] [CrossRef]
- The Notice about Wind Power Consumptive and Related Work in 2013 from National Energy Board. Available online: http://zfxxgk.nea.gov.cn/auto87/201303/t20130319_1587.htm (accessed on 16 February 2013).
- Yu, X.X.; Zhang, P.; Liu, Z.Y.; Zuo, X.H.; Zhang, K.; Tian, Z.C. Wind power development and its consumptive ability in Beijing. Electr. Power Constr. 2015, 36, 49–54. [Google Scholar]
- Xu, J.W.; Liu, Z.H. Research on the prediction and optimization of China’s energy structure based on grey system theory. Ind. Saf. Environ. Prot. 2013, 39, 59–61. [Google Scholar]
- Wang, J.Y. Wind power development in twelfth “Five-Year Plan”. Energy Res. Utilization 2012, 3, 19–20. [Google Scholar]
- Tao, Y.W.; Sun, M.; Wang, X.F. Research on China’s energy demand forecasting based on improved BP neural network. J. Shanxi Univ. Financ. Econ. 2010, 32, 3–5. [Google Scholar]
- Liu, D.H.; Yang, Y.P.; Yang, K.; Li, D.Q.; Yang, Z.P. Energy structure and pollutant emission prediction model and its application based on Markov chain. Electr. Power 2006, 39, 8–13. [Google Scholar]
- Parpas, P.; Webster, M. A stochastic multi-scale model for electricity generation capacity expansion. Eur. J. Oper. Res. 2014, 232, 359–374. [Google Scholar] [CrossRef]
- He, M.; Yang, L.; Zhang, J.S.; Vittal, V. A Spatio-Temporal Analysis Approach for Short-Term Forecast of Wind Farm Generation. IEEE Trans. Power Syst. 2014, 29, 1611–1622. [Google Scholar] [CrossRef]
- Xie, N.M.; Liu, S.F. Analysis of total energy consumption and structure prediction. Ind. Technol. Econ. 2009, 28, 46–49. [Google Scholar]
- Huang, Y.S.; Wang, Z.M.; Zhang, Y.F. Markov prediction model and its application in the analysis of power consumption structure. In Proceedings of the Seventh Academic Exchange Conference of China Operations Research Society, Qingdao, China, 16–20 October 2004; Zhang, X.S., Ed.; Global-Link Publishing: Qingdao, China, 2004; pp. 489–453. [Google Scholar]
- Lou, Y.J.; Ma, Y.M.; Han, L.F. Prediction of regional passenger transition structure based on Markov chain. Transp. Syst. Eng. Inf. 2012, 12, 1–5. [Google Scholar]
- Wang, X.; Niu, D.X. Prediction of electric energy competitiveness based on Markov chain. Mod. Electr. Power 2004, 1, 94–97. [Google Scholar]
- Zhang, X.C.; Niu, D.X.; Shen, W. Beijing city terminal energy structure prediction based on the Markov optimization model. Shaanxi Electr. Power 2008, 9, 6–9. [Google Scholar]
- Gilat, A. MATLAB. An Introduction with Applications, 5th ed.; J. Wiley & Sons: New York, NY, USA, 2015. [Google Scholar]
- Zhu, C.Z. Further discussion on the power structure of China. Sino Glob. Energy 2008, 38, 2–10. [Google Scholar]
- Li, G.L.; Zhu, H.; Lv, M. Evaluation of the importance of transportation channel nodes based on modified entropy weight and modified TOPSIS method. J. Shijiazhuang Railw. Univ. (Nat. Sci. Ed.) 2014, 1, 78–83. [Google Scholar]
- Zhang, H.L. Research on the Development of Renewable Energy Resources in China. Master’s Thesis, Jilin University, Jilin, China, 2014. [Google Scholar]
- Mourmouris, J.C.; Potolias, C. A multi-criteria methodology for energy planning and developing renewable energy sources at a regional level: A case study Thassos, Greece. Energy Policy 2013, 52, 522–530. [Google Scholar] [CrossRef]
- Chen, C.; Wang, F.; Zhou, B.; Chan, K.W.; Cao, Y.; Tan, Y. An interval optimization based day-ahead scheduling scheme for renewable energy management in smart distribution systems. Energy Convers. Manag. 2015, 106, 584–596. [Google Scholar] [CrossRef]
- Freire, L.; Street, A.; Lima, D.A.; Barroso, L.A. A Hybrid MILP and Benders Decomposition Approach to Find the Nucleolus Quota Allocation for a Renewable Energy Portfolio. IEEE Trans. Power Syst. 2015, 30, 3265–3275. [Google Scholar] [CrossRef]
- Xie, X.X.; Wang, T.; Ren, D.M. The latest development of American renewable energy quota system and its Enlightenment to China. China Energy 2012, 3, 33–37. [Google Scholar]
- Ren, D.M. Discussion on some issues concerning the introduction of the quota system for renewable energy. Renew. Energy 2007, 29, 10–13. [Google Scholar]
- Ren, D.M.; Xie, X.X. International experience in building a green certificate trading system for renewable energy. Renew. Energy 2013, 35, 12–15. [Google Scholar]
- Ren, D.M. China’s Renewable Portfolio Standards and Implementing Countermeasures. Autom. Electr. Power Syst. 2011, 35, 25–28. [Google Scholar]


| Year | Wind Power | Photovoltaic Power Generation | Hydropower | Thermal Power Generation | ||||
|---|---|---|---|---|---|---|---|---|
| Electricity (twh) | Ratio (%) | Electricity (twh) | Ratio (%) | Electricity (twh) | Ratio (%) | Electricity (twh) | Ratio (%) | |
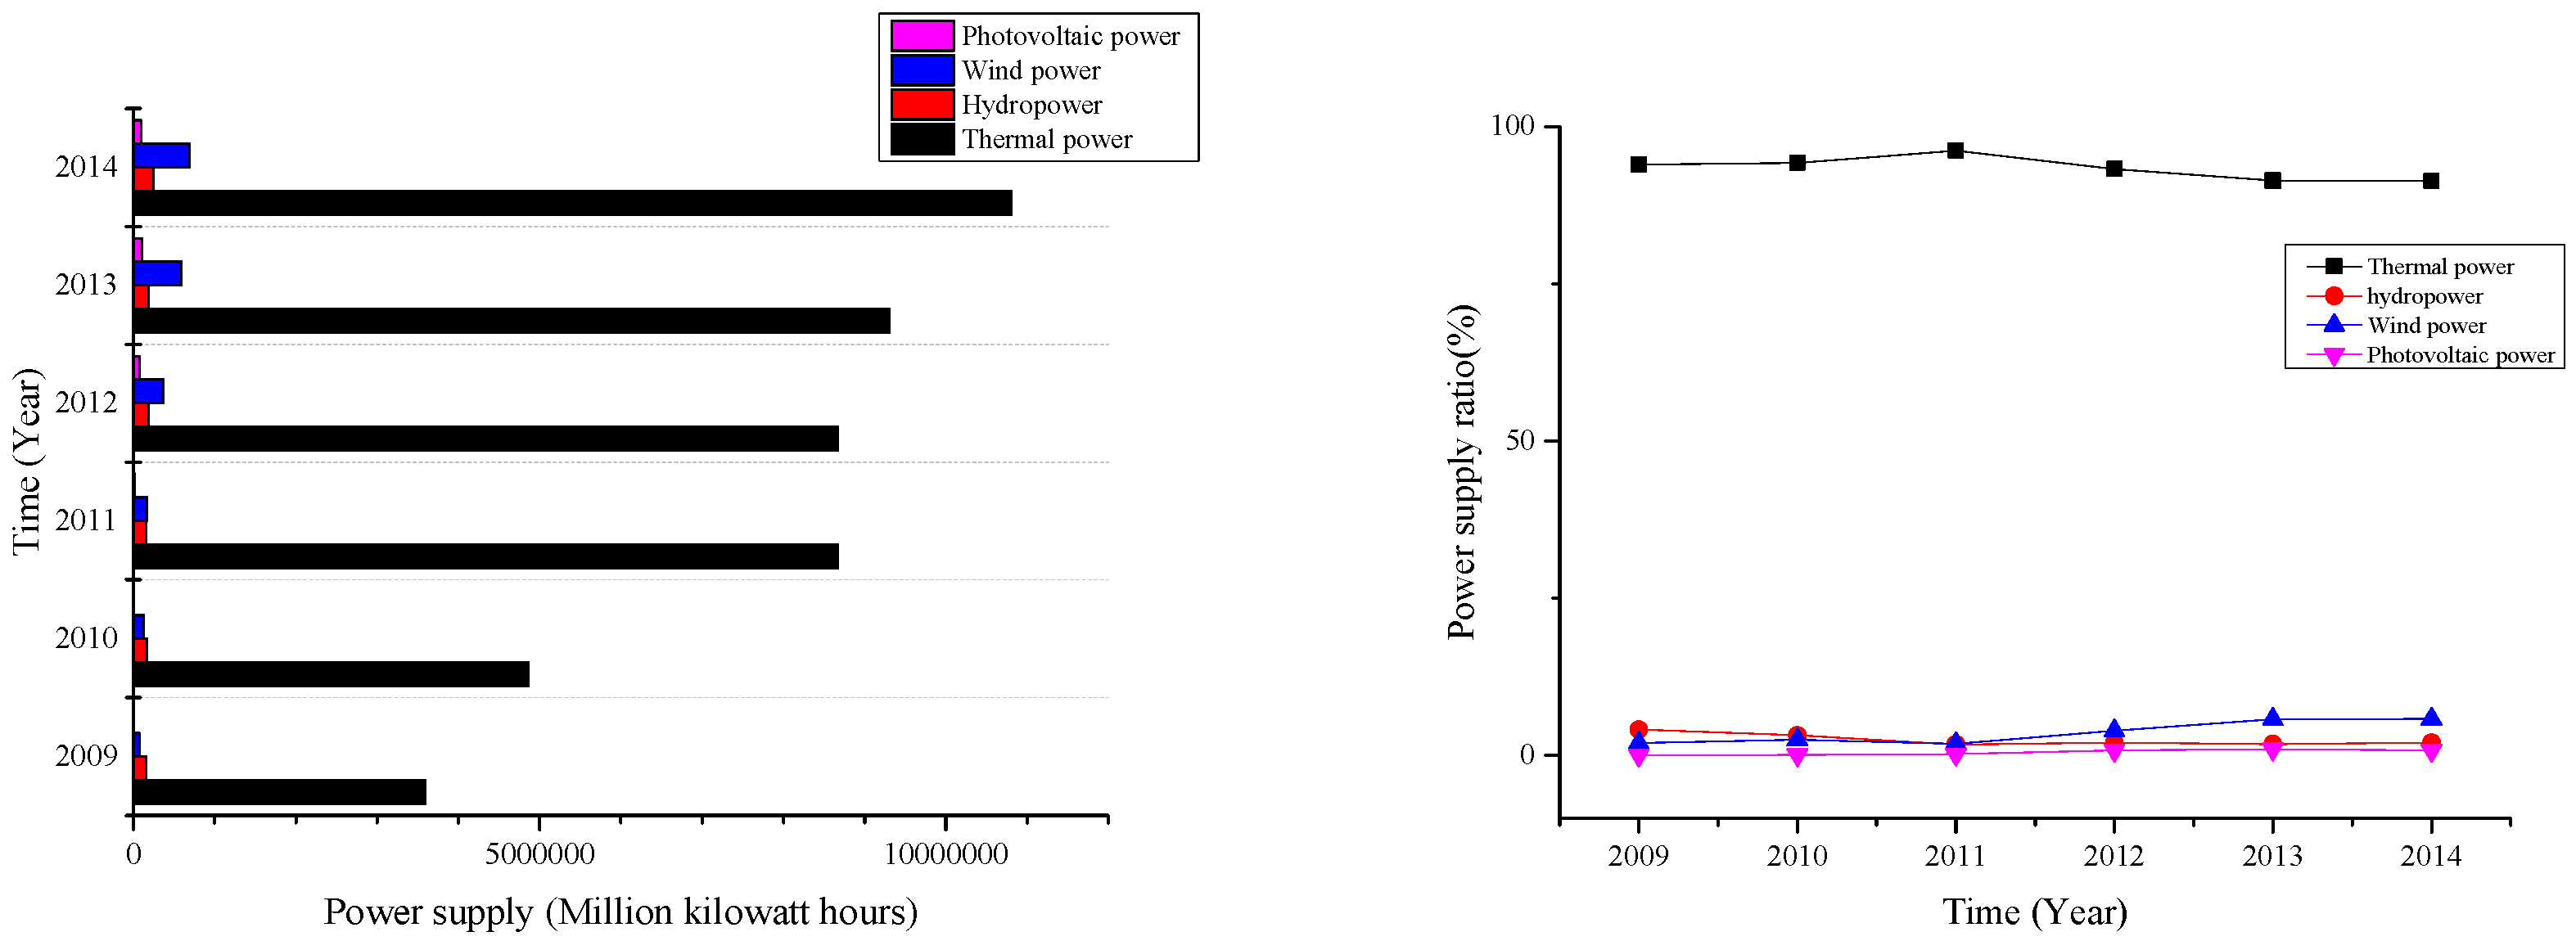
| 2009 | 358.810 | 1.976 | 15.710 | 0.001 | 7.550 | 4.113 | 0.0035 | 93.910 |
| 2010 | 485.780 | 2.482 | 16.700 | 0.113 | 12.810 | 3.237 | 0.580 | 94.168 |
| 2011 | 866.950 | 1.870 | 15.860 | 0.208 | 16.860 | 1.760 | 1.880 | 96.162 |
| 2012 | 866.950 | 3.980 | 18.850 | 0.832 | 36.630 | 2.049 | 7.650 | 93.140 |
| 2013 | 930.090 | 5.788 | 18.620 | 1.003 | 58.910 | 1.829 | 10.210 | 91.380 |
| 2014 | 1080.500 | 5.820 | 24.300 | 0.783 | 68.840 | 2.054 | 9.260 | 91.343 |
| Wind Power | Photovoltaic Power | Hydropower | Thermal Power | |||||||||
|---|---|---|---|---|---|---|---|---|---|---|---|---|
| Actual Value | Markov | Error Optimization Markov | Actual Value | Markov | Error Optimization Markov | Actual Value | Markov | Error Optimization Markov | Actual Value | Markov | Error Optimization Markov | |
| 2009 | 1.976 | 1.857 | 2.054 | 0.001 | 0.002 | 0.0012 | 4.113 | 4.136 | 3.9568 | 93.910 | 94.005 | 93.988 |
| 2010 | 2.482 | 2.294 | 2.509 | 0.113 | 0.151 | 0.124 | 3.237 | 2.257 | 3.156 | 94.168 | 95.298 | 94.211 |
| 2011 | 1.870 | 2.04 | 2.037 | 0.208 | 0.235 | 0.224 | 1.760 | 0.924 | 2.039 | 96.162 | 96.801 | 95.700 |
| 2012 | 3.980 | 3.29 | 4.016 | 0.832 | 0.872 | 0.859 | 2.049 | 1.686 | 1.833 | 93.140 | 94.152 | 93.292 |
| 2013 | 5.788 | 4.598 | 5.750 | 1.003 | 1.048 | 1.017 | 1.829 | 1.468 | 1.73 | 91.380 | 92.886 | 91.503 |
| 2014 | 5.820 | 5.739 | 5.780 | 0.783 | 0.831 | 0.794 | 2.054 | 1.154 | 1.988 | 91.343 | 92.276 | 91.438 |
| 2015 | 5.870 | 5.190 | 5.870 | 0.650 | 0.753 | 0.650 | 2.170 | 2.182 | 2.165 | 91.320 | 91.875 | 91.315 |
| 2016 | 4.250 | 6.271 | 0.658 | 0.647 | 2.873 | 2.165 | 92.219 | 90.929 | ||||
| 2017 | 4.710 | 6.582 | 0.787 | 0.644 | 2.439 | 2.153 | 92.064 | 90.630 | ||||
| 2018 | 4.618 | 6.712 | 0.899 | 0.641 | 2.677 | 2.144 | 91.806 | 90.495 | ||||
| 2019 | 5.663 | 6.798 | 0.683 | 0.638 | 2.820 | 2.152 | 90.835 | 90.415 | ||||
| 2020 | 4.520 | 7.013 | 0.726 | 0.637 | 2.623 | 2.149 | 92.131 | 90.205 | ||||
| MAPE (%) | Markov of error optimization | 3.76 | Markov | 14.81 | ||||||||
| Wind Power (%) | Photovoltaic Power Generation (%) | Hydropower (%) | Thermal Power Generation (%) | |
|---|---|---|---|---|
| Balance state | 7.644 | 0.634 | 2.111 | 89.611 |
© 2016 by the authors; licensee MDPI, Basel, Switzerland. This article is an open access article distributed under the terms and conditions of the Creative Commons Attribution (CC-BY) license (http://creativecommons.org/licenses/by/4.0/).
Share and Cite
Xu, X.; Niu, D.; Qiu, J.; Wang, P.; Chen, Y. Analysis and Optimization of Power Supply Structure Based on Markov Chain and Error Optimization for Renewable Energy from the Perspective of Sustainability. Sustainability 2016, 8, 634. https://doi.org/10.3390/su8070634
Xu X, Niu D, Qiu J, Wang P, Chen Y. Analysis and Optimization of Power Supply Structure Based on Markov Chain and Error Optimization for Renewable Energy from the Perspective of Sustainability. Sustainability. 2016; 8(7):634. https://doi.org/10.3390/su8070634
Chicago/Turabian StyleXu, Xiaomin, Dongxiao Niu, Jinpeng Qiu, Peng Wang, and Yanchao Chen. 2016. "Analysis and Optimization of Power Supply Structure Based on Markov Chain and Error Optimization for Renewable Energy from the Perspective of Sustainability" Sustainability 8, no. 7: 634. https://doi.org/10.3390/su8070634
APA StyleXu, X., Niu, D., Qiu, J., Wang, P., & Chen, Y. (2016). Analysis and Optimization of Power Supply Structure Based on Markov Chain and Error Optimization for Renewable Energy from the Perspective of Sustainability. Sustainability, 8(7), 634. https://doi.org/10.3390/su8070634