1. Introduction
WEEE (waste electrical and electronic equipment) is one of the most important sources of complex waste [
1]. In economic terms, potential revenues coming from the e-waste recycling are estimated in € 2 billion and USD 16 billion in Europe and China, respectively [
2,
3]. A great improvement in material recovery rates has been enabled by worldwide initiatives during the last decades supporting the integration of end-of-life (EoL) strategies within the value chain of companies [
4,
5]. However, current performances are still too low to be able to counteract the annual increase of generated waste, especially considering WPCBs (waste printed circuit boards), the most complex, hazardous, and valuable elements embedded in e-waste [
6,
7,
8,
9]. Basic guidelines for the reuse, recovery and recycling of WEEE have been already established and many authors analysed and compared different WEEE directives and national recovery systems [
10,
11,
12]. Their aim was the assessment of the presence of basic principles able to support the development of a circular economy based on the exploitation of both critical materials and resources recovered from WEEE. From this side, the European Commission played (and continue to play) a key role in financing several dedicated projects (e.g., Innovative hydrometallurgical processes to recover metals from WEEE including lamps and batteries (HydroWEEE), Countering WEEE Illegal Trade (CWIT), Prospecting Secondary raw materials from the Urban Mine and Mining waste (ProSUM) and Critical Raw Material Closed Loop Recovery (CRM Recovery)).
Even if the sustainability of WPCB recycling processes is a timely topic in the literature [
13,
14,
15], their economic implications are rarely analysed by the experts [
16,
17]. Given the limited set of application fields and the relevant growth of WEEE, this paper proposes a feasibility analysis on the recovery process of PCBs from WEEE trying to follow multiple aims.
First, the paper assesses the potential profitability characterizing all the phases of a typical PCB recovery process focused on WEEE, in both mobile and field configurations. Second, in order to support the obtained results, a set of alternative scenarios is analysed for each plant configuration, by taking into account the following critical variables: gold/palladium/copper market prices, gold purity level, WPCB purchasing cost, plant saturation level and opportunity cost. Third, the estimates of future profitability trends in three European nations (Germany, Italy and the U Kingdom) within the 2015–2030 period are proposed. The results could support governmental and industrial actors during the revision of current directives and the evaluation of corrective measures.
The paper is organized as follows:
Section 2 proposes a literature review about the current economic models focused on WEEE.
Section 3 presents the research framework and a description of the economic model taken into account within the paper.
Section 4 presents the main results coming from the introduction in the model of current data on WEEE.
Section 5 describes a sensitivity analysis on the main critical variables influencing decisions.
Section 6 estimates the future profitability trends in Europe. Finally,
Section 7 proposes a discussion of the results and
Section 8 presents some concluding remarks.
2. Literature Review
Current electrical and electronic equipment (EEEs) is replaced with an even faster rate creating enormous quantities of e-waste [
18]. This phenomenon is due to both the rapid technological development and the requirement of higher performances to mass electronic products. Considering that, on average, each EEE embeds at least one PCB accounting for almost 3%–5% of its overall weight, WPCB expected volumes are impressive and accountable in several million tons [
19]. Furthermore, PCBs are the most valuable elements embedded in EEEs [
20,
21,
22]. However, current WEEE directives do not adequately manage neither their recovery process nor the required purity level of output materials [
6,
23]. In addition, the existing economic models assessing the profitability of recycling plants are very few and three main issues characterize them: (i) the limited set of application fields [
24]; (ii) the absence of standard materials composition of PCBs taken into account [
16] and (iii) the focus on a particular phase of the process, considering both costs and revenue performance [
25].
Some examples of the current economic models available in the literature are introduced here and briefly discussed. A cost comparison of different PCB dismantling processes (manual versus mechanical ones) is proposed in [
26]. When the treated WPCB amount is less than 1 kton, the cost of manual dismantling is lower than the mechanical one (equal to USD 25,000 versus USD 50,000, considering 0.5 ktons of WPCBs). When 10 ktons of WPCBs are treated, the total cost of the mechanical dismantling is equal to USD 350,000, while the one for the manual dismantling is equal to USD 400,000.
The feasibility of a hydrometallurgical process for the recovery of WPCBs is evaluated in [
27]. Positive performances are reached when gold exceeds the tipping point of 500 ppm. In addition, considering 1000 ppm of gold, the payback time varies from one to three years, with 100 kg and 50 kg of WEEE per batch, respectively. The key role of gold is highlighted also by other authors [
24]. However, this dependency comes not only from the amount of precious metal characterizing a WPCB, but also from its current market price. Potential revenues are estimated to be equal to 21,500 USD/ton in a baseline scenario, becoming equal to 3800–52,700 USD/ton in alternative scenarios.
Another work evaluates the electrostatic separation, by assessing the payback time equal to 2.5 years [
28]. Sales revenues are defined as the most sensitive factor in the economic performance of the recycling system, but also feedstock stocks have a critical impact [
29].
A comparison of PCB mechanical treatment lines is evaluated in [
30]. Gross profit is estimated to be equal to 18 USD/ton with a traditional fluid bed line, 129 USD/ton with a process done in a developed country and 256 USD/ton with an automatic line.
Another comparison of economic performances from alternative treatment plants is proposed in [
25]. Gross profit is estimated to be equal to −83 USD/ton with a field plant in a developing country, −101 USD/ton with a field plant in a developed country and 14 USD/ton with an integrated mobile recycling plant. These two works analyse an hourly productivity equal to 0.3 tons of WPCBs per hour and 0.125 tons of WPCBs per hour, respectively.
A recent work tries to cover these literature gaps by proposing an economic model able to assess the profitability of a complete PCB recycling process [
17]. Net present value (NPV) is estimated to vary within the range 96,626–495,726 €/ton in a field plant (hourly productivity equal to 0.3 tons of WPCBs per hour) and within the range 52,495–276,267 €/ton in a mobile plant (hourly productivity equal to 0.125 tons of WPCBs per hour). Discounted payback time (DPBT) is equal to one year. Within the same paper, a sensitivity analysis defines the following critical variables: gold content, gold price, final purity level, WPCB purchasing cost, plant saturation level and opportunity cost. However, this last work assesses PCBs coming from the only automotive sector. This paper wants to extend the analysis to WEEE PCBs, in order to evaluate this growing market.
3. Materials and Methods
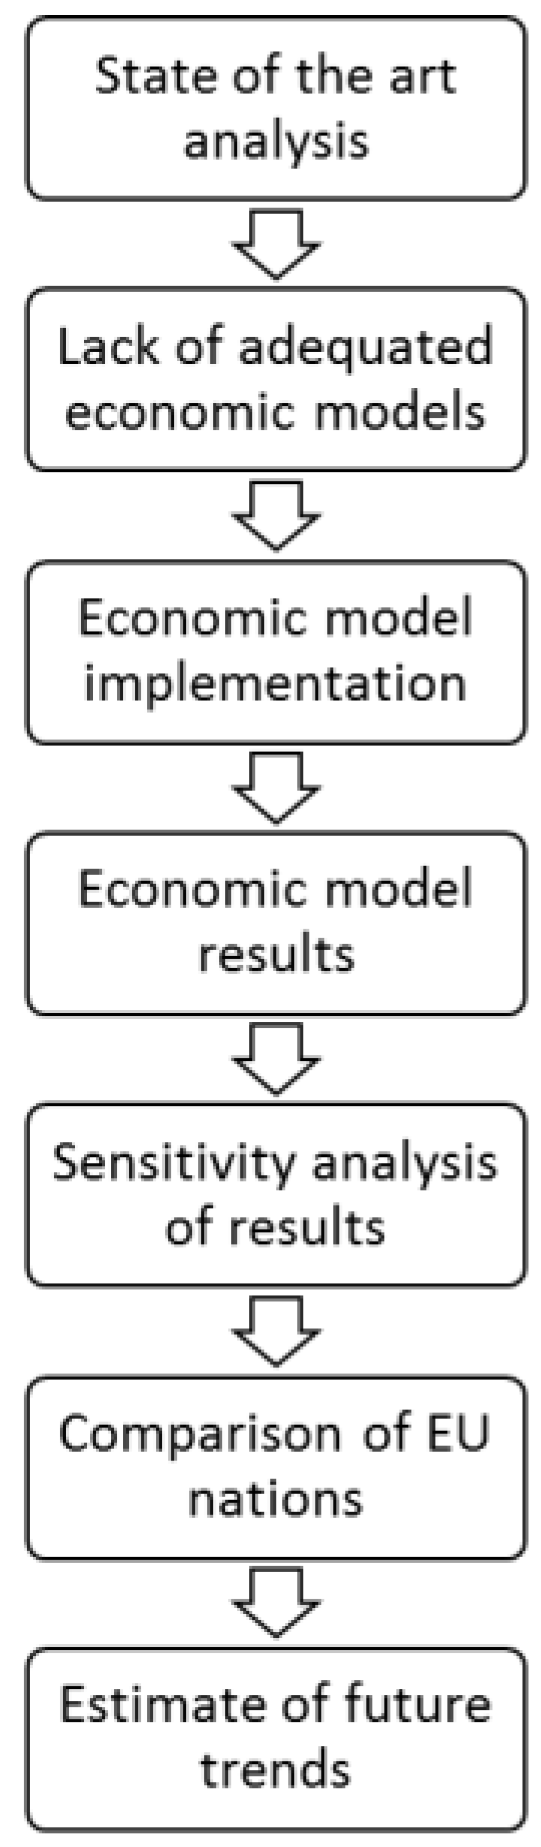
The following
Figure 1 gives a summarizing view of the structure of the paper.
Starting from a detailed state of the art analysis, the paper assesses the existing literature gaps, focusing on lacks related to the available economic models. This way, a new economic model is defined trying to fill in some of these gaps. Subsequently, the results obtained are assessed through a sensitivity analysis. In order to add value to the paper, a set of the most relevant nations in terms of e-waste generation are compared and an estimation of future trends is implemented.
3.1. WEEE Volumes
The entire work starts from the overall amount of WEEE collected in three European countries (Germany, Italy and the United Kingdom) in 2013 [
31]. The choice of these three nations depends on the fact that they represent 47% of the overall WEEE market in Europe. Subsequently, WEEE collected from households (about 87% in EU-28) are considered because of the lack of data within Eurostat about Italy and its total amount of single WEEE categories.
This lack of data is due to a different way of classification followed by Italy. According to the Italian legislation, WEEE is classified as follows: heaters and refrigerators (R1), large household appliances (R2), TV and monitors (R3), small household appliances (R4) and lighting equipment (R5) [
32]. Instead, other European countries divide WEEE into ten categories (Cat#), by following the WEEE Directive classification guideline. Among these ten groups, only four are selected because of their relevance (about 95% in EU-28) on the overall amount of WEEE volumes.
Considering the European classification the following groups are taken into account:
Cat1 WEEE represents big household appliances (e.g., fridges, washing machines and air conditioners);
Cat2 WEEE considers small household appliances (e.g., vacuum cleaners, toasters and fryers);
Cat3 WEEE represents IT and telecommunication equipment (e.g., PCs, tablets, notebooks and smartphones);
Cat4 WEEE considers consumer equipment (e.g., TVs, monitors, stereos and cameras).
Table 1 reports data about WEEE annual collected volumes in EU-28.
3.2. WPCB Recycling Process
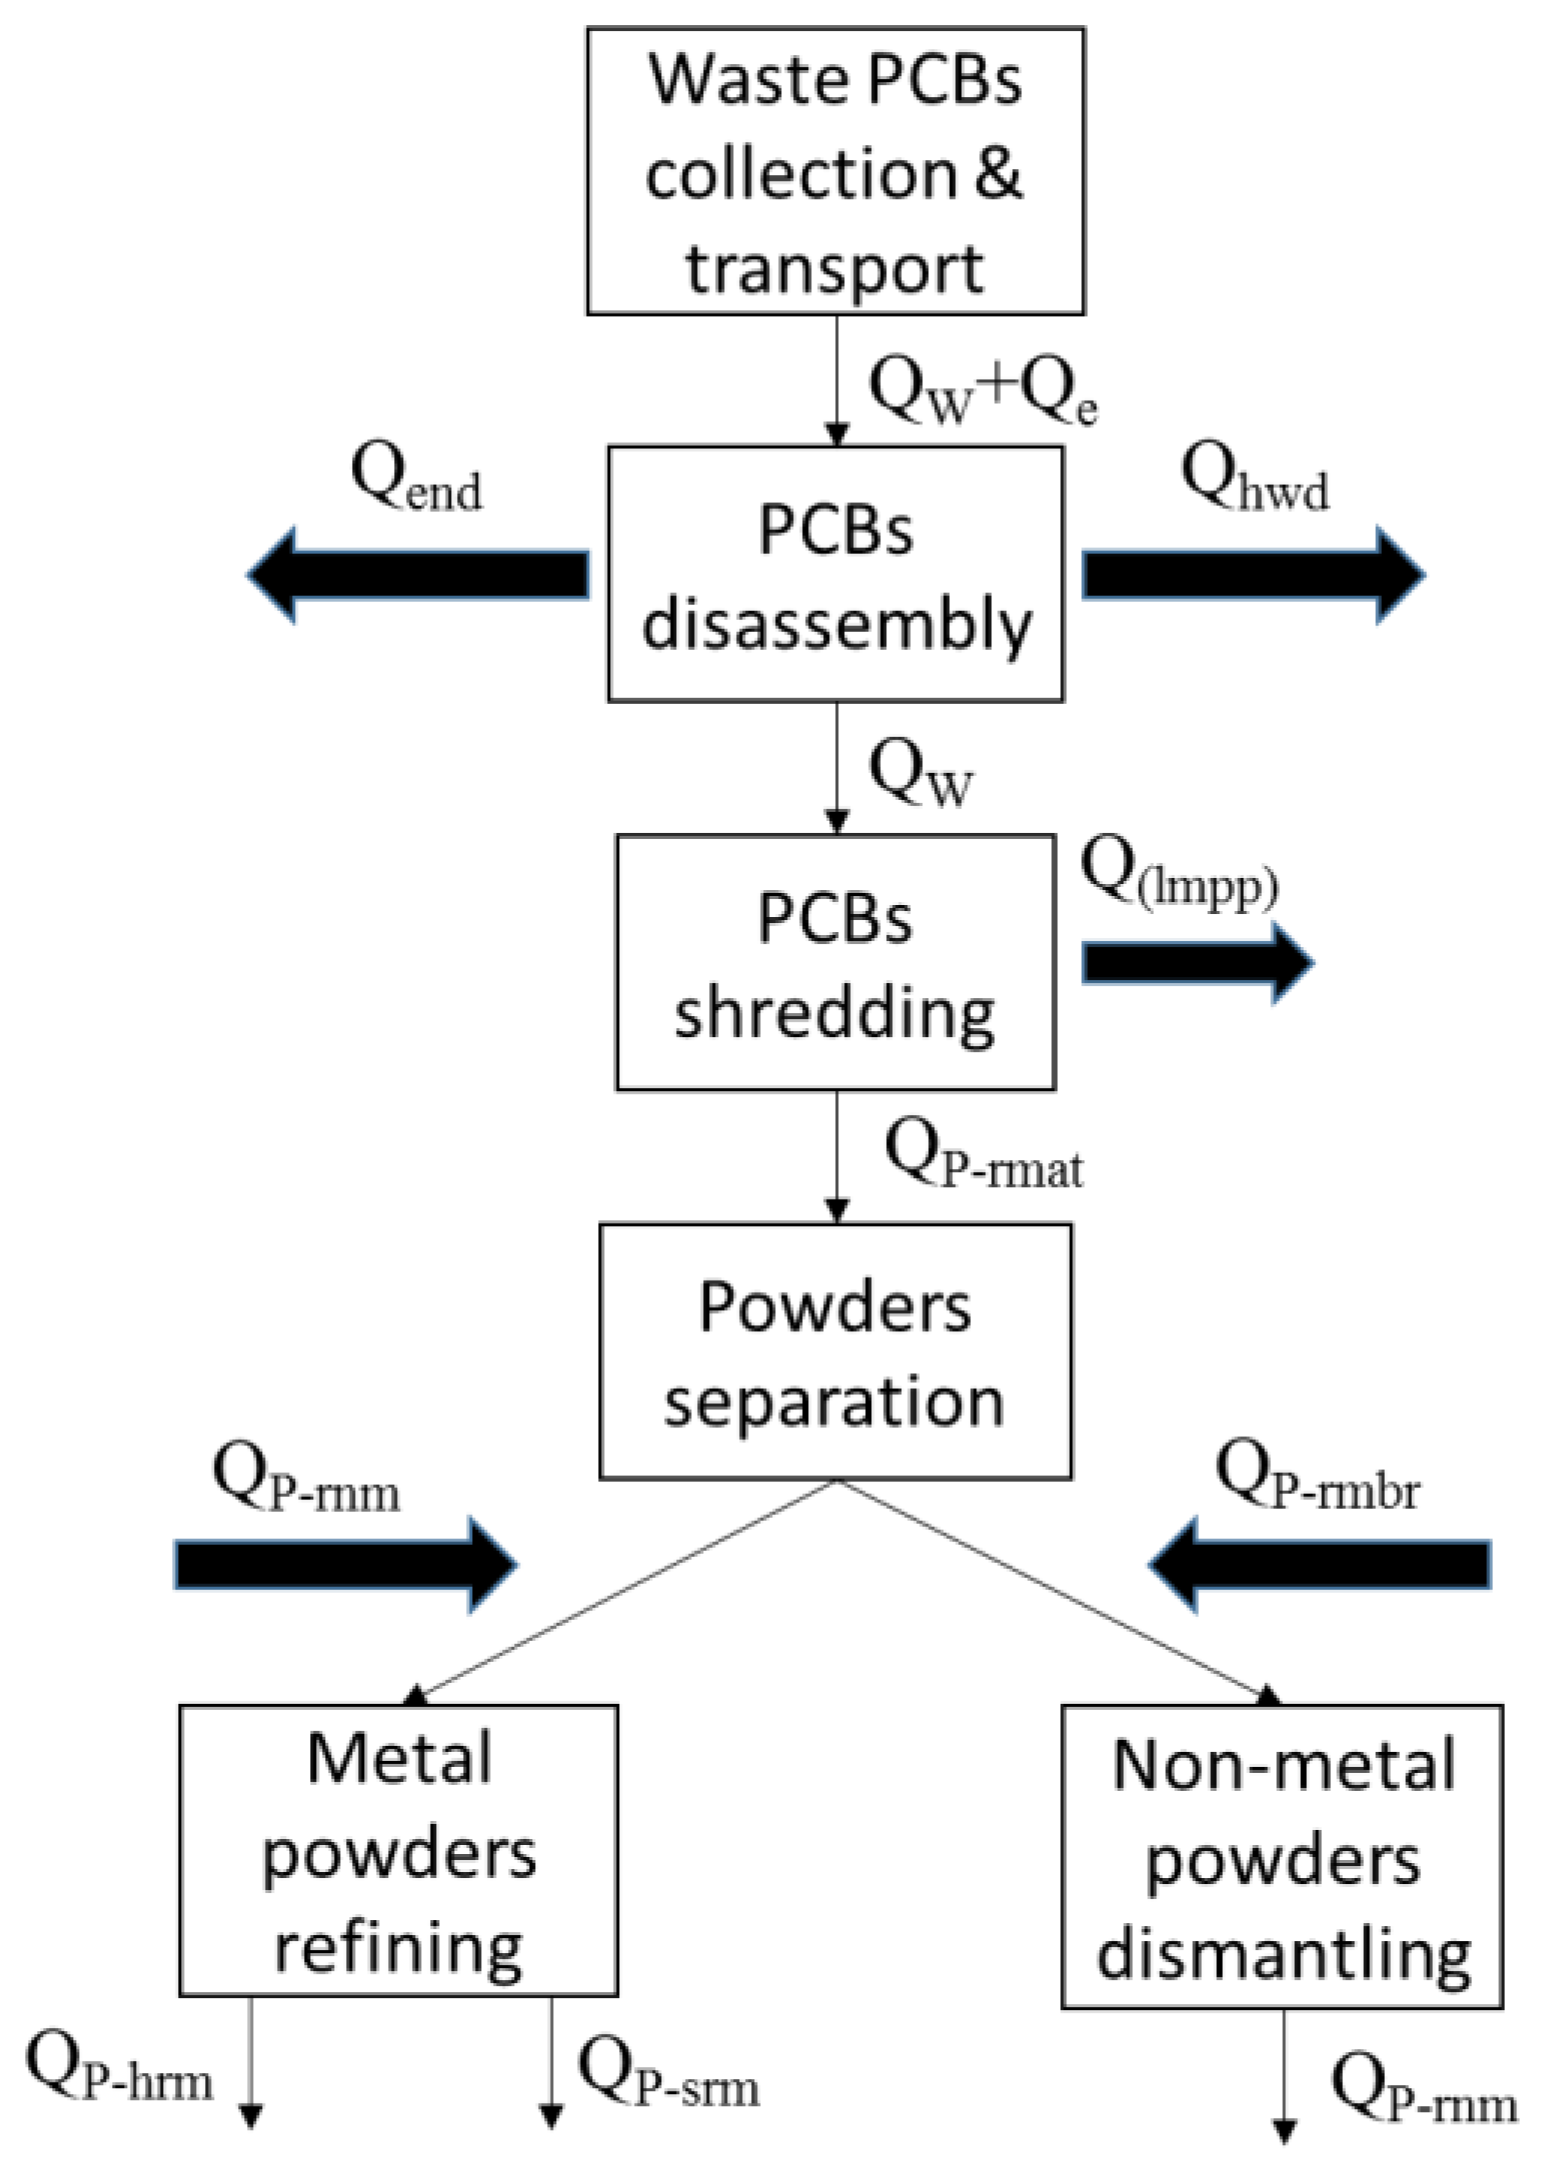
A PCB recycling process can be described as the sum of three macro phases that, starting from waste PCBs, are able to recover a set of (almost pure) raw materials. These phases can be distinguished as follows: disassembly, treatment and refining [
19,
33]—
Figure 2.
During disassembly, hazardous components (e.g., condensers or batteries containing dangerous materials) are disassembled from the main board and destined to specific treatment plants. During treatment, PCBs are crushed in micro pieces up to become a uniform powder through several technologies (e.g., shredders and grinders). Then, powders are separated in metal and non-metal ones by exploiting different physical principles (e.g., density, magnetism and weight). Finally, metal powders are refined through the available technologies (e.g., pyrometallurgy, hydrometallurgy, or a mix of them) up to becoming almost pure secondary materials [
16,
34]. Generally, pyrometallurgy is used for its wide application range and high level of efficiency. In contrast, hydrometallurgy is preferred when high purity products are needed and emissions have to be limited [
28].
Considering this paper, the refining process taken into account is the hydrometallurgical one. However, the same economic principles can be used to also assess other refining methods, without twisting the overall value of the work. Hydrometallurgy is the optimal choice to implement field and mobile plants, given both its high sustainability level in comparison to other metal refining methods and the flexibility level of related plants [
35,
36,
37].
The mobile structure presents a limited capacity but can be easily transferred from one site to another. In contrast, the field one presents a greater capacity and can be used to manage higher volumes.
Figure 2 reports a sequence of flows characterizing a PCB recovery process. Q
w + Q
e are flows of PCBs and cases in which they are embedded. Q
w are flows of PCBs entering the recovery process. Q
end are flows of cases leaving the process and Q
hwd are flows of hazardous components directed to dedicated recovery plants. Q
(lmpp) are flows of powders lost during the shredding process. Q
P-rmat are flows of powders after shredding. Q
P-rnm are flows of nonmetal powders ending into landfills. Q
P-rmbr are flows of metal powders entering the refining process. After refining, Q
P-hrm are valuable metals and Q
P-srm are low value metals, both destined to be sold in the secondary material market. Q
(lmrp) are materials lost during chemical reactions.
Two kinds of plants (based on the same constructive philosophy) are taken into account: a mobile and a field one. Their hourly productivity (p
h) is set in 0.125 tons/h and 0.3 tons/h (for mobile and field plants, respectively) [
25,
30]:
Furthermore, by considering a working period (n
d) of 240 days and eight working hours per day (n
h). According to Equation (1), the plant sizes (Q
w) are:
3.3. Economic Model
Discounted Cash Flow (DCF) is a well-known economic assessment method estimating the attractiveness of an investment opportunity and several economic indexes can be selected, as NPV and DPBT:
NPV does not consider the size of the plant. For this reason, the ratio between NPV and size of the recycling plant is proposed within this paper. A summary of the main formulas constituting the original model [
17] are reported below:
Within Equations (2)–(13), the 1°s apex identifies “disassembly”, the 2°s apex identifies “treatment”, and the 3°s apex identifies “refinement”—
Table 2.
The profitability of a recycling plant is hugely influenced by two main variables: (i) the set of materials embedded in WPCBs (available from the literature); and (ii) the plant capacity [
17].
For this reason, the total number of sets of selected scenarios evaluated within the paper are eight, or the combination of four WPCB groups (Cat1, Cat2, Cat3 and Cat4 WPCBs)—as defined in
Table 1—and two plant sizes (240 tons/year and 576 tons/year), as defined before. Finally, potential revenues coming from materials recovered by cases embedding PCBs (Q
end) are not considered within this paper.
3.4. Economic and Technical Inputs
Table 3 reports data about economic and technical inputs of the model and
Table 4 reports the initial assumptions about the materials concentration taken directly from the literature [
33]. Input data show that a mobile plant investment cost is estimated in about k€ 639, while a field plant is assumed to be about k€ 1533 [
25,
27,
30,
38]. Economy of scale is the main cause of this difference, quantified in about 29%.
The recovered materials evaluation occurs in function of historical trends of market prices, within a defined time-period. By taking into account the February 2015–February 2016 timeframe as a reference, monthly observations were gathered from the most relevant websites focused on raw materials exchanges [
39,
40]
Table 5.
After having defined the economic model structure (and related input values), all of the financial indexes useful to assess the investment are estimated in
Section 4.
4. Results
Waste recycling processes represent not only an environmental protection action, but also an economic opportunity. Here, it is possible to identify the business plan required to define the investment’s profitability.
Table 6 presents some examples.
As already presented in
Section 3, eight scenarios are analysed within this work, and it is clear that the financial feasibility is verified only for two categories of WPCBs (
Table 7).
Going into detail, positive results come from both Cat3 WPCBs (NPV equal to k€ 29,140 and k€ 6413 in field and mobile plants, respectively), and Cat4 WPCBs, but only for field plants (NPV equal to k€ 1351). DPBT follows NPV values, and it is equal to one year for Cat3 WPCBs and two years for Cat4 WPCBs. This means that cash flows allow recovery of the investments already during the initial period of activity. Field plants present a longer lifecycle than mobile plants (10 years out of five years). This aspect, starting from equal gross profits, explains the greater NPV (both in positive and negative terms). However, as explained in other papers [
25,
45], mobile facilities can represent an ideal solution for small countries or cities, where volumes are limited.
The obtained results confirm that the profitability is not always verified (see
Section 2). Furthermore, in comparison to the automotive sector, values coming from WEEE are lower, given their limited gold amount (900–4200 ppm in the automotive PCBs [
46], 20–400 ppm in WEEE PCBs). However, DPBT is confirmed by this study. About the gold relevance among revenue items, data showed in
Table 8 are significant (equal for both the plant configurations). 415 ppm of gold are estimated for Cat3 WPCBs (max value, accounting for 72% of revenues), and 20 ppm of gold are estimated in Cat2 WPCBS (min value, accounting for 32% of revenues) representing the main profitability items.
Among other materials, particularly interesting is the influence of palladium (with a high market price), and copper (present in a high percentage).
The cost distribution analysis shows that operational costs are equal to 94% of the overall costs for a field plant and 87% for a mobile one (
Table 9). These results are coherent to what proposed by other works [
17,
27].
The most relevant cost item is represented by WPCB purchasing, for both field and mobile plants (42% and 34%, respectively). This value is followed by labour costs (18% and 21%, respectively). Finally, transportation costs are equal to 6.5% in a mobile plant.
Given the structure of the presented economic model (see
Section 3.3), it is easily possible to extend the analysis to other case studies. In order to strengthen the obtained results, a sensitivity analysis comparing alternative scenarios is implemented in the next section.
5. Sensitivity Analysis
The obtained results are related to hypotheses on input variables. Hence, a strong variance of the expected economic profitability could occur. This limit can be overtaken by implementing a sensitivity analysis on the following critical variables [
19] (
Table 10 and
Table 11):
The material content, as a percentage of a WPCB total weight for all the four categories. This variable is already analysed and four WPCB categories are evaluated within this paper.
The materials market price is evaluated for three materials that, more than others, impact revenues (see
Table 8), or gold, palladium and copper. Pessimistic and optimistic scenarios are analysed, by increasing (or decreasing) the initial price by its extreme values (31,200–36,600 €/kg for gold, 13,900–24,500 €/kg for palladium and 3.9–5.7 €/kg for copper respectively).
The final purity level is applied only to gold due to its high relevance on revenues. Four pessimistic scenarios are analysed, with purity levels decreased within the range 60%–90% in comparison to the initial value of 95%.
The WPCB purchasing cost, representing the main cost item (see
Table 9). Pessimistic and optimistic scenarios are assessed, with cost variations between 1000 €/ton up to 1400 €/ton (or an offset of about 200 €/ton from the baseline scenario);
The plant saturation, in which a lower amount of WPCBs in input represents a lower hourly productivity. To this aim, five pessimistic scenarios are assessed, with saturation levels going from 50% up to 90%. For example, by considering a mobile plant, 90% of 240 tons per hour is equal to 216 tons per hour. Instead, by considering a field plant, 90% of 576 tons per hour is equal to 518 tons per hour;
The opportunity cost, able to evaluate the money value in different periods. Even in this case, an optimistic and pessimistic scenarios are assessed, with values varying from 4% up to 6%;
These values confirm that, sometimes, the profitability is not verified. In particular, field plants treating Cat4 WPCBs become unprofitable when the gold purity level falls to 80%, or when the saturation level reaches 60%. More in general:
NPV is always negative with mobile and field plants treating Cat1 and Cat2 WPCBs;
NPV is always positive with mobile and field plants treating Cat3 WPCBs;
NPV is always negative with mobile plants treating Cat4 WPCBs and almost positive with field plants (14 scenarios out of 19).
Higher values of NPV can be reached in both the plant configurations when the saturation level reaches 50% for WPCBs pertaining to Cat1 and Cat2 groups (k€ −959 and k€ −1025 , respectively, for the mobile plant, k€ −2914 and k€ −3195, respectively, for the field plant), when the gold market price reaches 36,600 €/kg for WPCBs pertaining to Cat3 group (k€ 7085 and k€ 32,019 respectively for mobile and field plants) and when the WPCB purchasing cost reaches 1000 €/ton for Cat4 group (k€ −78 and k€ 1393, respectively, for mobile and field plants).
Lower values of NPV can occur in mobile plants when the gold purity level reaches 60% for WPCBs pertaining to Cat1, Cat2 and Cat4 groups (k€ −1804, k€ −1875 and k€ −1050, respectively), and with a saturation level of 50% for WPCBs pertaining to Cat3 (k€ 2942 ). Instead, lower values of NPV are present in field plants with gold purity level of about 60% for Cat1 and Cat4 WPCBs (k€ −4905 and k€ −1374, respectively), when the WPCB purchasing cost reaches 1400 €/ton for Cat2 WPCBs (k€ −5459) and with a saturation level of 50% for Cat3 WPCBs (k€ 13,781).
The sensitivity analysis allows for analysis of several alternative scenarios, in which decision makers can evaluate different NPV values. No probabilities are assigned to each scenario, but real changes concerning the following critical variables are considered:
Secondary materials market price can be subjected to great oscillations (see trends proposed in
Table 5) reaching maximum variations for precious metals (e.g., gold and palladium).
Gold purity level could fall due to low performing technologies. In fact, the selection of the recycling process is connected to multiple parameters and technological solutions are able to favour environmental or economic performances or both [
47,
48].
WPCB purchasing costs can differ because of the different material composition of cores. This issue is not well analysed in the literature [
16,
49]. In particular, this cost can be influenced by several aspects such as: (i) supply chain dimension (short or long ones); (ii) type of PCBs (low, medium or high grade ones); and (iii) PCB volumes.
Plant saturation level is strictly linked to the historical productive capacity and the actual working hours. However, a key role is played by the difference between generated and collected volumes [
15,
50]. They depend by four aspects: (i) illegal flows; (ii) no attention of citizens towards environmental problems; (iii) absence of regulations; and (iv) inadequate number (or location) of collection centres.
Opportunity cost of capital can change because of either the effect of macro-economic conditions related to the specific nation or the nature of investors (private or public capitals) [
44].
This section proposed a more complete overview on profitability coming from mono-core plants. The subsequent section offers an assessment on the economic impact related to the recovery of these wastes in three main European WEEE markets.
6. Assessment of National Economic Potentials and European Future Trends
The development of the recycling sector concerns all the European countries. A significant amount of potential secondary raw materials is currently lost and the application of EoL strategies accelerated the transition towards a circular economy.
6.1. Economic Potential of the German, Italian and English WEEE Markets
This section evaluates the economic potential coming from the recovery of WPCBs embedded in WEEE collected from households in Germany, Italy and the United Kingdom.
Potential values are obtained by multiplying the economic value proposed in
Table 7 and the related volumes estimated in 2013. Starting from WEEE volumes from households presented in
Table 1, WPCB volumes are calculated. To this aim, the fractional weight of WPCBs (out of the overall WEEE weight) are defined. Estimated values are 0.4%, 0.5%, 13% and 11% for Cat1, Cat2, Cat3 and Cat4 WPCBs, respectively [
33].
Table 12 proposes total NPV for both the types of plants and the three countries in 2013. For example, total NPV for Germany is equal to about € 777 million by considering only field plants. This value can be calculated as follows: 0.4% × 248,618 × (−7382) + 0.5% × 76,331 × (−8354) + 13% × 116,681 × (50,590) + 11% × 132,931 × (1351) = k€ 776,601.
The profitability is always verified and it depends on both the presence of Cat3 WPCBs (49% in Germany, 38% in Italy, 78% in the United Kingdom and 48% in EU-28) and the quasi-absence of Cat1 and Cat2 WPCBs within the related fractional mix (varying from 4% up to 6%).
The European economic potential related to the recovery of WPCBs embedded in WEEE collected from households is estimated in € 3442 million in a scenario with only field plants and € 1699 million in a scenario with only mobile ones.
The United Kingdom and Germany present relevant results and they represent almost 48% of the overall European economic values. In contrast, Italy–even if constituting one of the main nations generating WEEE in Europe (see
Table 1)—has very low volumes because of the different classifications followed by its government. This way, a direct comparison with performances reached by other nations has low/no sense.
Furthermore, the selection between mobile and field plants is related to each nation. Given national WEEE volumes, WEEE mix and population density estimates within a particular territory, an evaluation about the best type of plant to be constructed is possible. Generally, mobile plants are preferred when population density (and related WEEE volumes) are low. This way, the chance to transfer the plant into different sites allows to reach a higher saturation level and to take into account different WEEE mixes. When population density (and related WEEE volumes) increases, the selection of a field plant is preferable. This way, the economy of scale allows a better distribution of costs and enables a faster recovery of the initial investment. However, these considerations are only theoretical and great relevance is associated to WEEE collection trends. These results must be verified with optimization models (both economic and environmental ones) in future research.
6.2. Future Trends in the European WEEE Market
An estimate of the potential dimension of the WEEE PCB recycling market in the near future is a useful tool for decision makers. To that aim, the overall amount of expected WEEE collected from households from 2015 up to 2030 can be predicted.
Within Eurostat, 2013 is the most updated year, presenting data for Europe; 2015 is the current year; and 2020 and 2030 are the years taken into account by Europe as reference targets. Growth rates are hypothesized to be equal to 3% per year [
19], equally increasing for each of the four WPCB categories [
17].
Table 12 proposes the expected profits coming from the correct management of these amounts of WPCBs. Minimum and maximum values are associated to mobile and field plants, respectively.
The estimated PCB volumes are obtained by considering that WPCB weights impact about 5% (on average) of the overall weight of a generic WEEE (
Table 1—[
33]). Considering an amount of WEEE equal to 2,907,222 tons in the EU-28 (see
Table 1) for the only Cat1, Cat2, Cat3 and Cat4 categories, it is possible to define the quantity of related WPCBs, estimated to be equal to 145,361 tons.
By considering the European average mix, mobile and field plant values are equal to € 11,686 per ton (obtained by dividing k€ 1,698,762 and 145,361 tons) and € 23,680 per ton (obtained by dividing k€ 3,442,084 and 145,361 tons). These values refers to 2013. Total WPCB expected NPV is equal to € 1895 million in 2015 for mobile plants (obtained by multiplying 11,686 € per ton and 162 ktons).
Furthermore, it is important to clarify that
Table 12 values refers to the first four WEEE categories (out of ten). Instead,
Table 13 refers to the overall volumes coming from all of the ten WEEE categories together and considering the percentage mix of EU-28.
Estimates on profits in 28 European countries from WEEE PCB recycling are relevant, going from € 1.79 billion to € 3.62 billion in 2013. Future trends define € 2.95 billion as minimum value and € 5.98 billion as maximum value in 2030. This difference depends on the development level of field and/or mobile plants.
In addition, 2013 data are directly dependent from Eurostat data and can give an immediate idea of the current dimension of the sector. In contrast, 2030 data are only an estimate, but they allow for comprehension of how the situation could evolve with the current expected trends. Obviously, these values will depend from the mix of mobile and field plants that will be implemented during the next years. However, quantitative data about the probability of implementation of these two kinds of plants is information absent in the literature.
Finally, these values demonstrate once again that the development of a circular economy based on the exploitation of both critical materials and resources recovered from WEEE is important and could offer interesting revenuesto industrial companies.
7. Discussion
The previous
Section 4,
Section 5 and
Section 6 represent the core part of the paper and they proceed to assess the three main objectives of the paper. Information gathered from these previous sections allow for responding to the three main targets listed in
Section 1, as follows:
The profitability assessment of PCB recovery processes;
The evaluation of alternative scenarios through a sensitivity analysis;
The estimation of future profitability trends in three selected European nations.
Considering the first point, NPV and DPBT values reported in
Table 7 show that positive results are related especially to the chance to recover only some specific types of WEEE, in particular Cat3 and Cat4. These two groups allow for recovery of high amounts of critical and precious materials and guarantee interesting revenues (at least in theory) shortening the payback time.
In addition, the use of mobile or field plants does not influence the most remunerable types of WEEE to be treated. The decision to use one or the other is only a question of potentially manageable volumes. One point favouring mobile plants is that they could enable several small medium enterprises to work together, bypassing bigger recyclers and secondary materials processes. This way, they can reach the quantities of recovered materials needed to compete in the market, whilst minimizing the investments needed.
The presented results are in line with the ones described by the experts within the scientific literature [
25,
35,
37,
45]. However, it is important to point out that a direct comparison with the results coming from the literature is not possible due to two reasons. First, the literature generally considers the recovery of an entire WEEE and not only PCBs. This way, the materials characterization can vary a lot. Second, papers describing WEEE consider all ten categories and not only the four categories taken into account in this paper.
Another element to point out is the comparison between mobile and field plant performance. It is out of the scope of this paper to decide if it is better to use either a mobile or a field plant. The aim of the authors is the only assessment of their economic indexes to support the critical decision about whether to invest in these types of plants.
Considering the second point, the role of several critical variables on the overall economic results that could be reached by the two different plants is clear. Given their lower capacity in comparison with field plants, mobile plants are more susceptible to strong variations of these variables. This means that, in the case of low WEEE volumes, the plant performance must be very high, exploiting state-of-the-art technologies and always trying to saturate the available capacity. Only in this way can companies implement mobile recovery plants protect themselves from exogenous oscillations coming from the raw materials market.
Considering the third point, data show as Italy, in comparison with Germany and the United Kingdom, needs to do a lot of work to reach the European average regarding WEEE collected volumes and improve the overall WEEE recovery chain performance. However, a direct comparison of Italy and other European countries is not completely possible, given the different WEEE classification adopted. However, even the comparison between Germany and the United Kingdom offers some interesting points of discussion.
Even if Germany presents higher WEEE volumes, the United Kingdom—thanks to a higher presence of Cat3 and Cat4 WEEE in its mix—is the European nation with the highest NPV among the three countries taken into account. This result has value whatever the type of plant taken into account. Once again, the importance of the national WEEE mix is highlighted.
Another important point related to these two nations is the presence of already established sites focused on the recovery of materials, generally owned by multinational companies, like Aurubis (Smethwick, United Kingdom), Umicore (Hoboken, Belgium), SIMS (Stratford-upon Avon, United Kingdom) and Boliden (Stockholm, Sweden). Given their dimensions, these plants, generally big field ones, are able to take into account relevant quantities of WEEE. This could represent an issue for the implementation of new plants. However, the economic impact given by these already existing plants is not measurable, given the absence of data in the literature about their physical and economic characteristics.
8. Conclusions
Great quantities of WEEE are thrown away worldwide every year. The literature defines WPCBs as the most complex, hazardous, and valuable elements in e-waste. However, the economic evaluation of recovery process of WEEE PCBs is not well analysed. This paper tries to cover this gap.
The profitability of both mobile (240 tons of powders per year) and field plants (576 of powders per year) considering four WPCB groups (large household appliances (Cat1), small household appliances (Cat2), IT and telecommunications equipment (Cat3) and consumer equipment (Cat4) are evaluated. Three main points can be discussed.
First, the recovery of materials from WEEE PCB recycling processes can be environmentally sustainable, according to the WEEE Directive, while the economic sustainability is verified only for some categories of WEEE.
In a baseline scenario, NPV is positive in both the plant configurations treating Cat3 WPCBs (equal to k€ 6413 and k€ 29,140 in mobile and field plants, respectively) and in field plants treating Cat4 WPCBs (equal to k€ 778). DPBT confirms this assessment, varying from one to two years in profitable scenarios.
From the revenue side, gold plays a key role, followed by palladium and copper. From the costs side, there are low investment costs, and the most relevant item is represented by WPCB purchasing.
The evaluation of specific products represents the following step. The material characterization of PCBs can vary significantly. A solution can be represented by multi-core plants, in which the lower profits are balanced by higher saturation levels. As highlighted within this paper, a quantitative analysis can support the choice from this side.
Second, the evaluation of alternative scenarios allows for confirmation of the obtained results. From one side, the profitability is guaranteed for Cat3 WPCBs and both the plant configurations and for Cat4 WPCBs considering field plants in several scenarios. From the other side, NPV is negative for Cat1 WPCBs and Cat2 WPCBs in both the plant configurations and for Cat4 WPCBs in mobile plants.
Saturation level, gold market price, WPCB purchasing cost and gold purity level produce the most significant variations in functions of both plant configurations and WEEE categories taken into account. This analysis is a relevant phase in an Engineering Economics framework, and it provides a snapshot that aims to reduce the subjectivity of the initial choice of inputs. However, only values defined in other scientific works are proposed within this paper.
Third, the economic potential related to the recovery of WPCBs embedded into WEEE collected from households in EU-28 is estimated in € 3619 million in a scenario with only field plants and € 1786 million in a scenario with only mobile ones in 2013. The United Kingdom and Germany represent almost 48% of these values. Germany has greater WEEE volumes than the United Kingdom, but this last country presents better economic performance due to the high presence of medium-high grade PCBs within its mix. Future trends concerning the European market show very interesting values and NPV varies from € 2952 million to € 5982 million in 2030.
Materials and metals are present in many energy and material production processes and their recoveries play a key role in the development of circular economy. Results obtained in this paper confirm the advantage in economic terms.
The recycling of WPCBs is an important topic not only in terms of waste treatment but also in terms of valuable material recovery. Natural resources are essential and critical components of the modern society. This activity increases the sustainability of a country and policy-makers, and citizens and firms can cooperate in order to make WEEE a resource and not a problem.


