
Energy Utilization Evaluation of Carbon Performance in Public Projects by FAHP and Cloud Model

Abstract
:1. Introduction
1.1. The Performance Evaluation of Public Projects
1.2. The Low-Carbon Economy Evaluation
1.3. Fuzzy Linguistic Variables and Cloud Model
1.4. Motivation
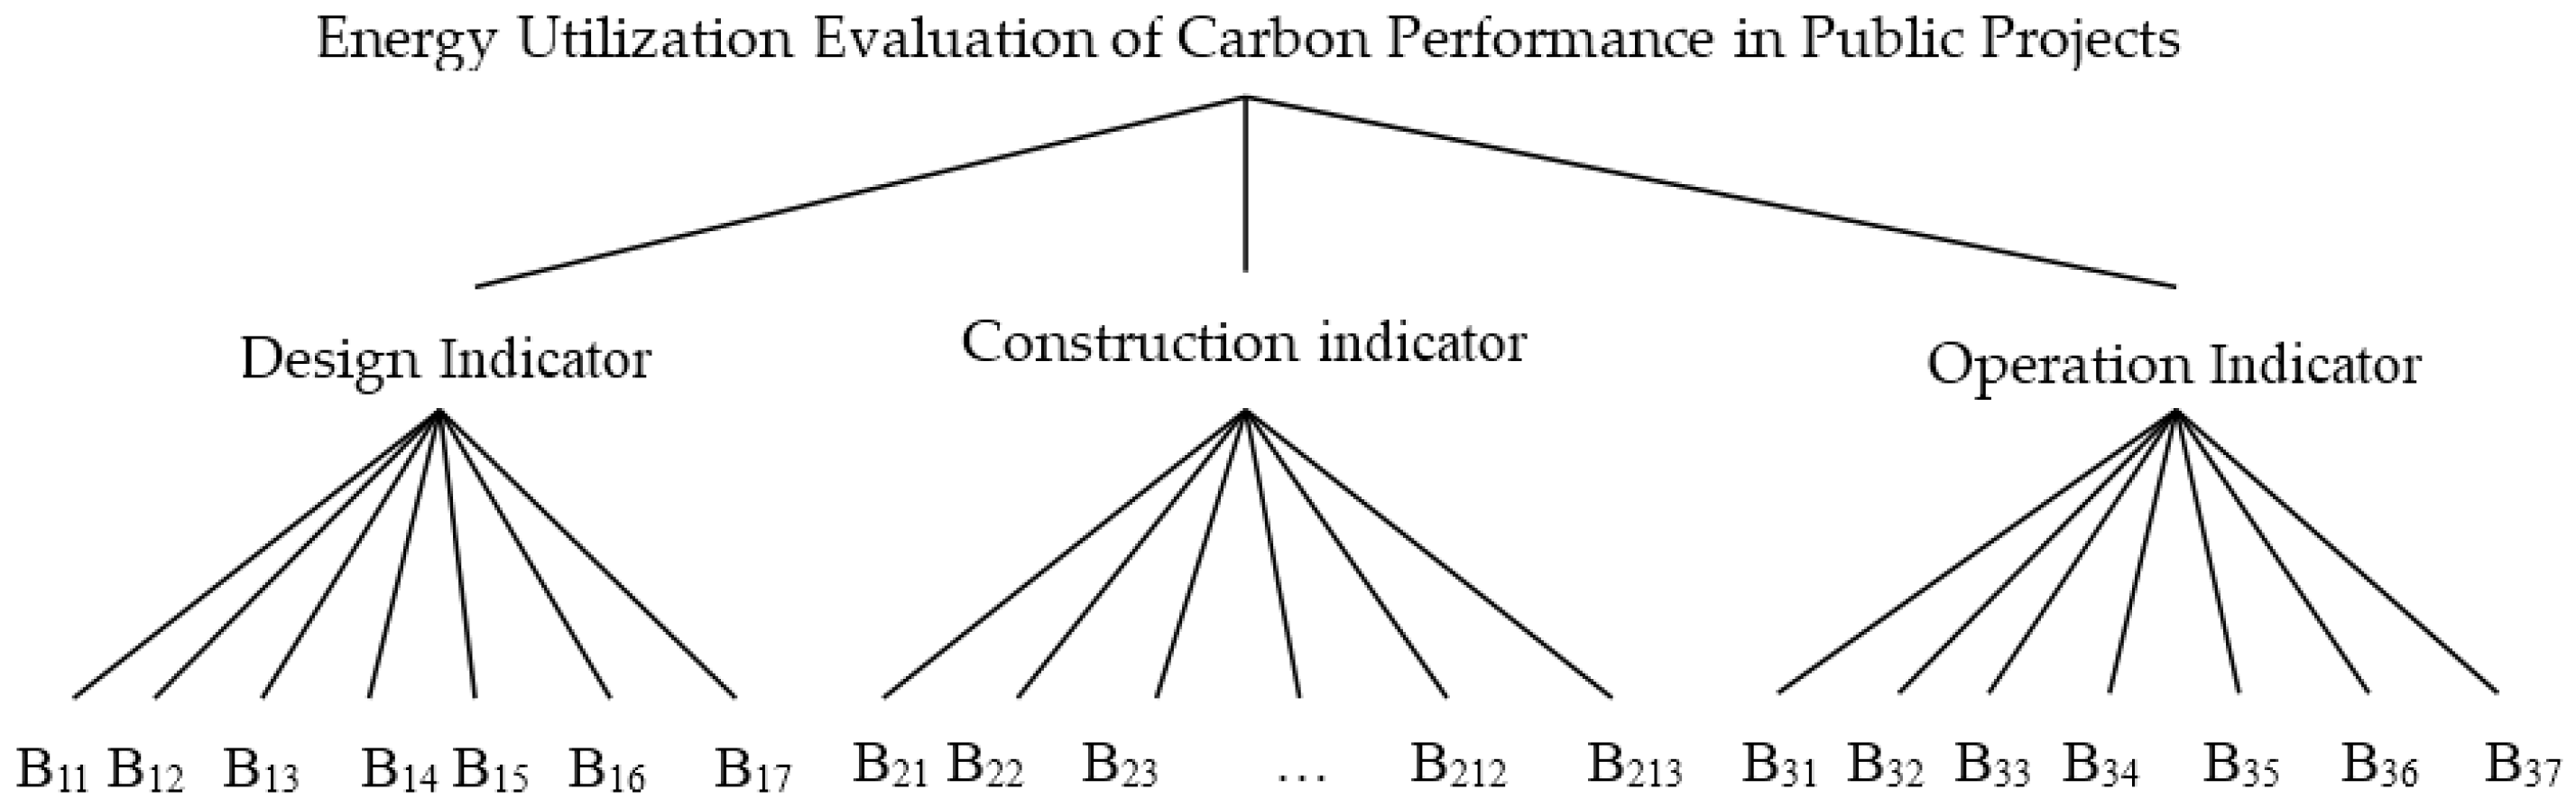
2. Indicator System
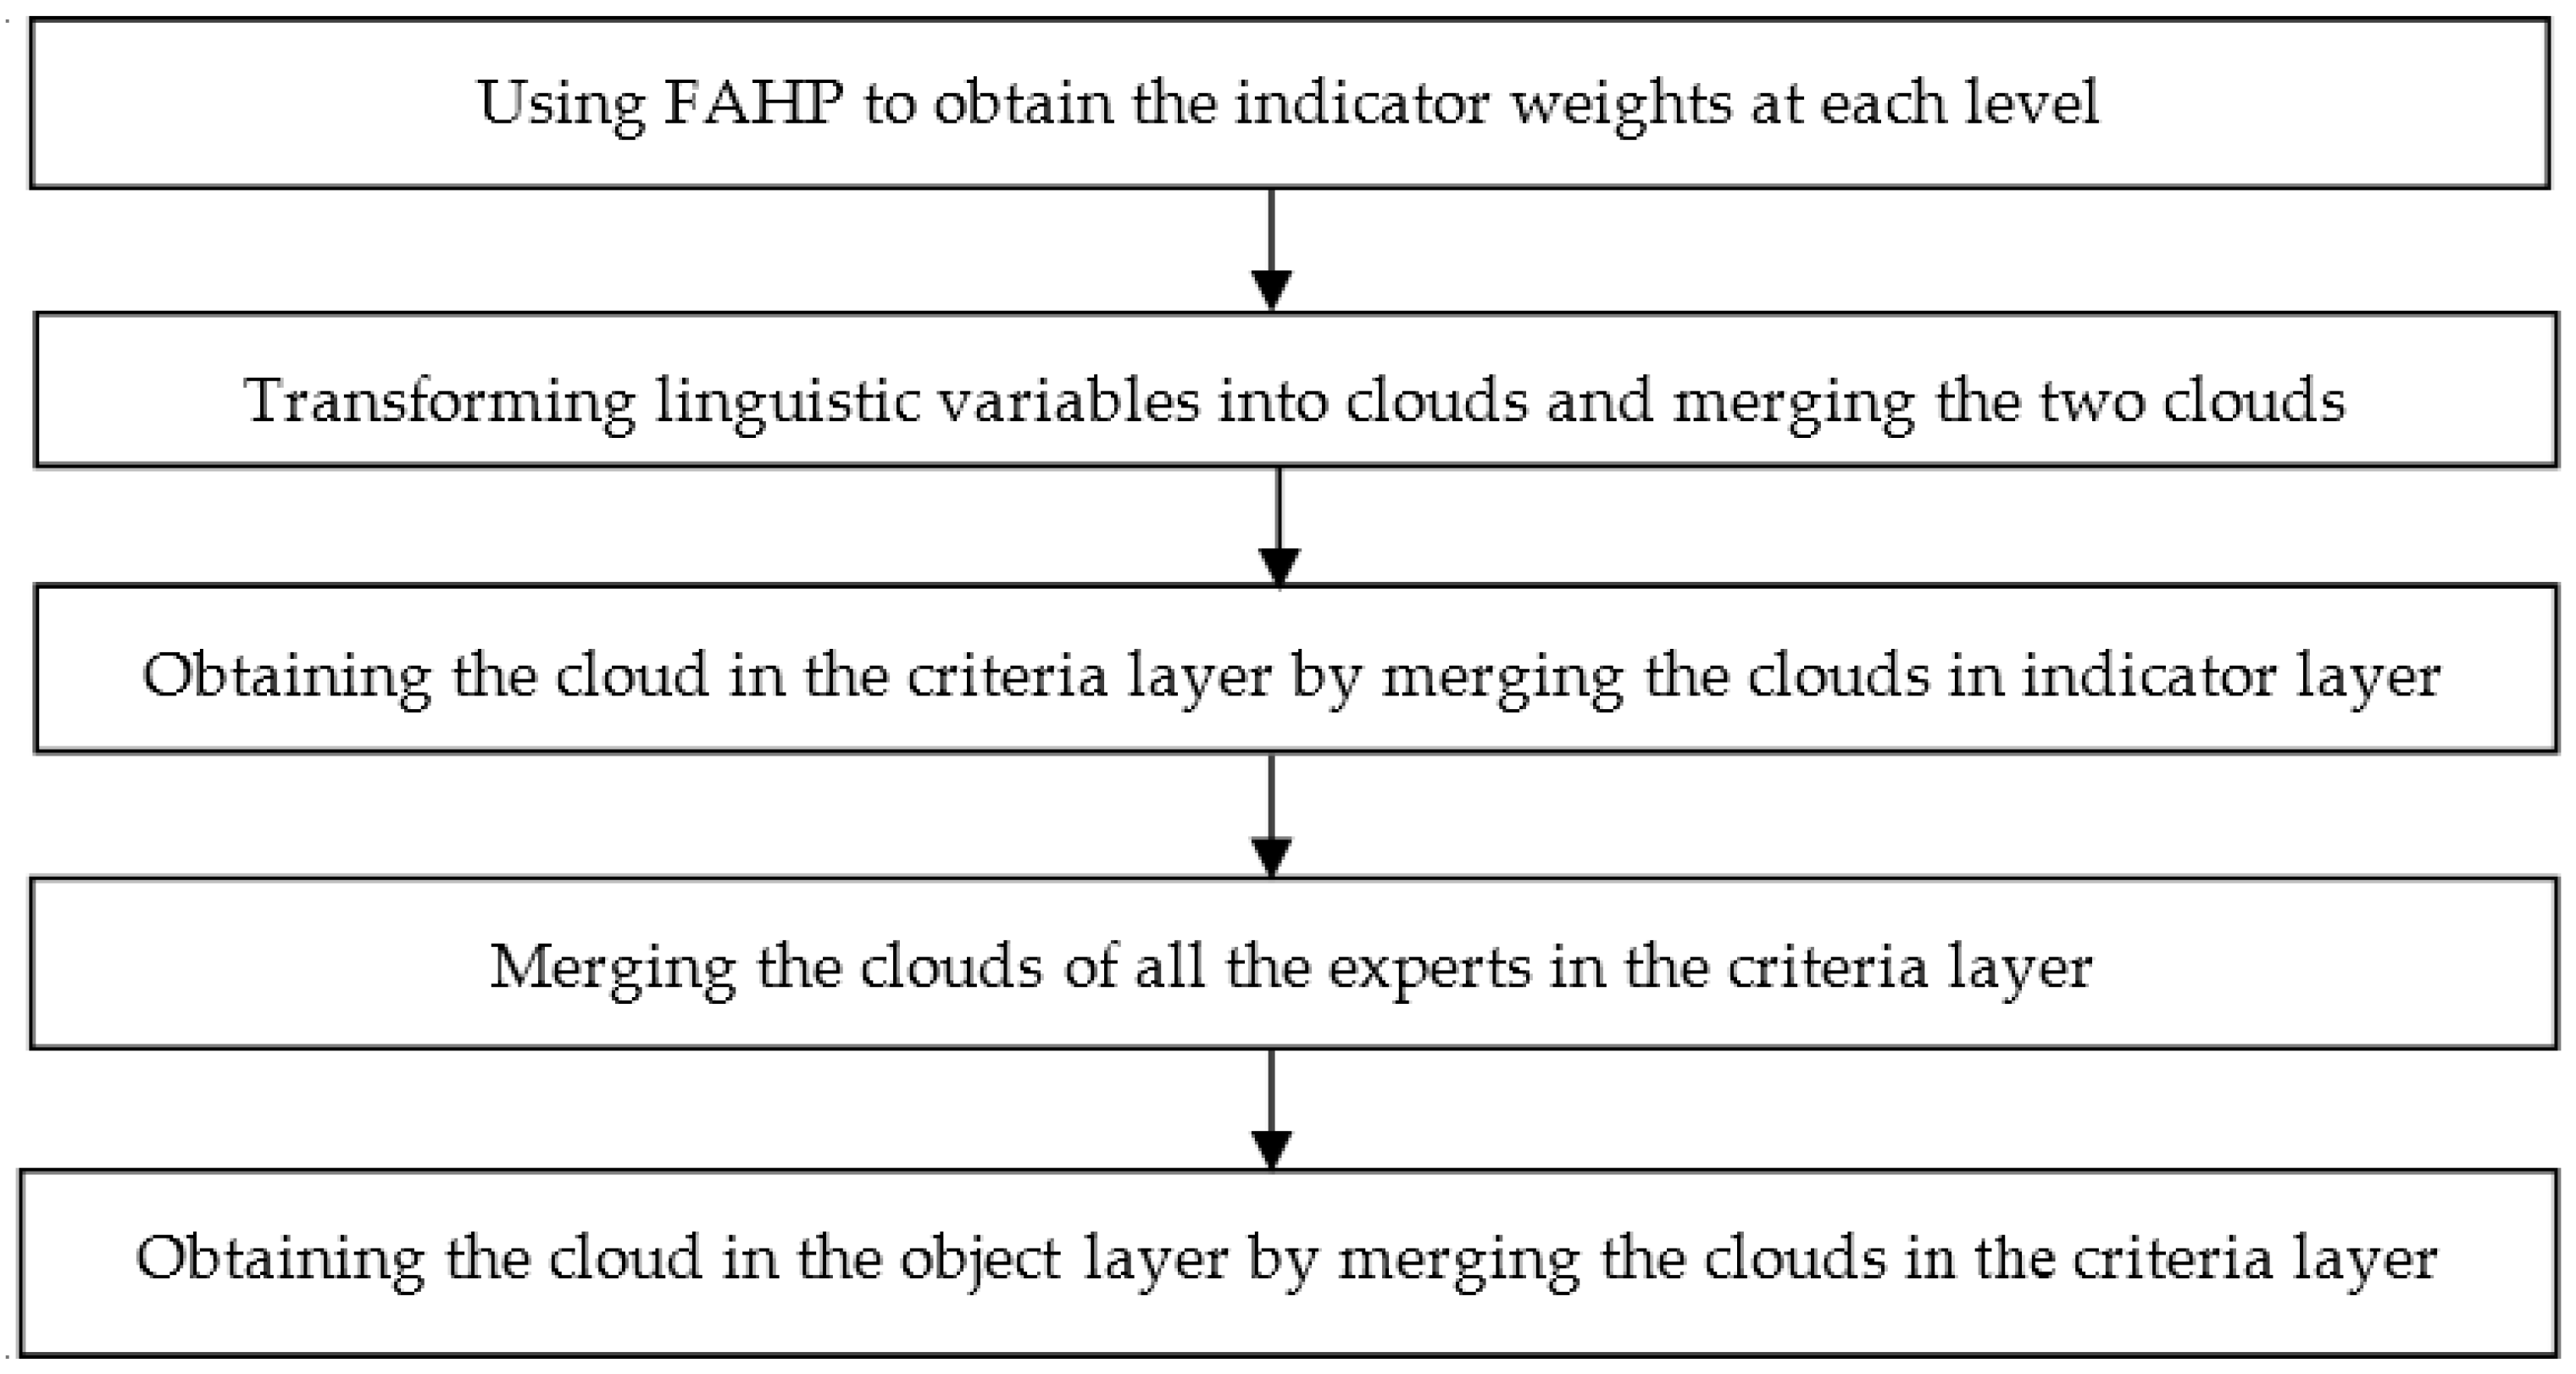
3. Methodology
3.1. FAHP Approach
3.1.1. Getting the Fuzzy Consistent Judgment Matrix
3.1.2. The Indicator Weights
3.2. Cloud Model
3.2.1. The Concept of Cloud
3.2.2. The Level of Evaluation and Numerical Property
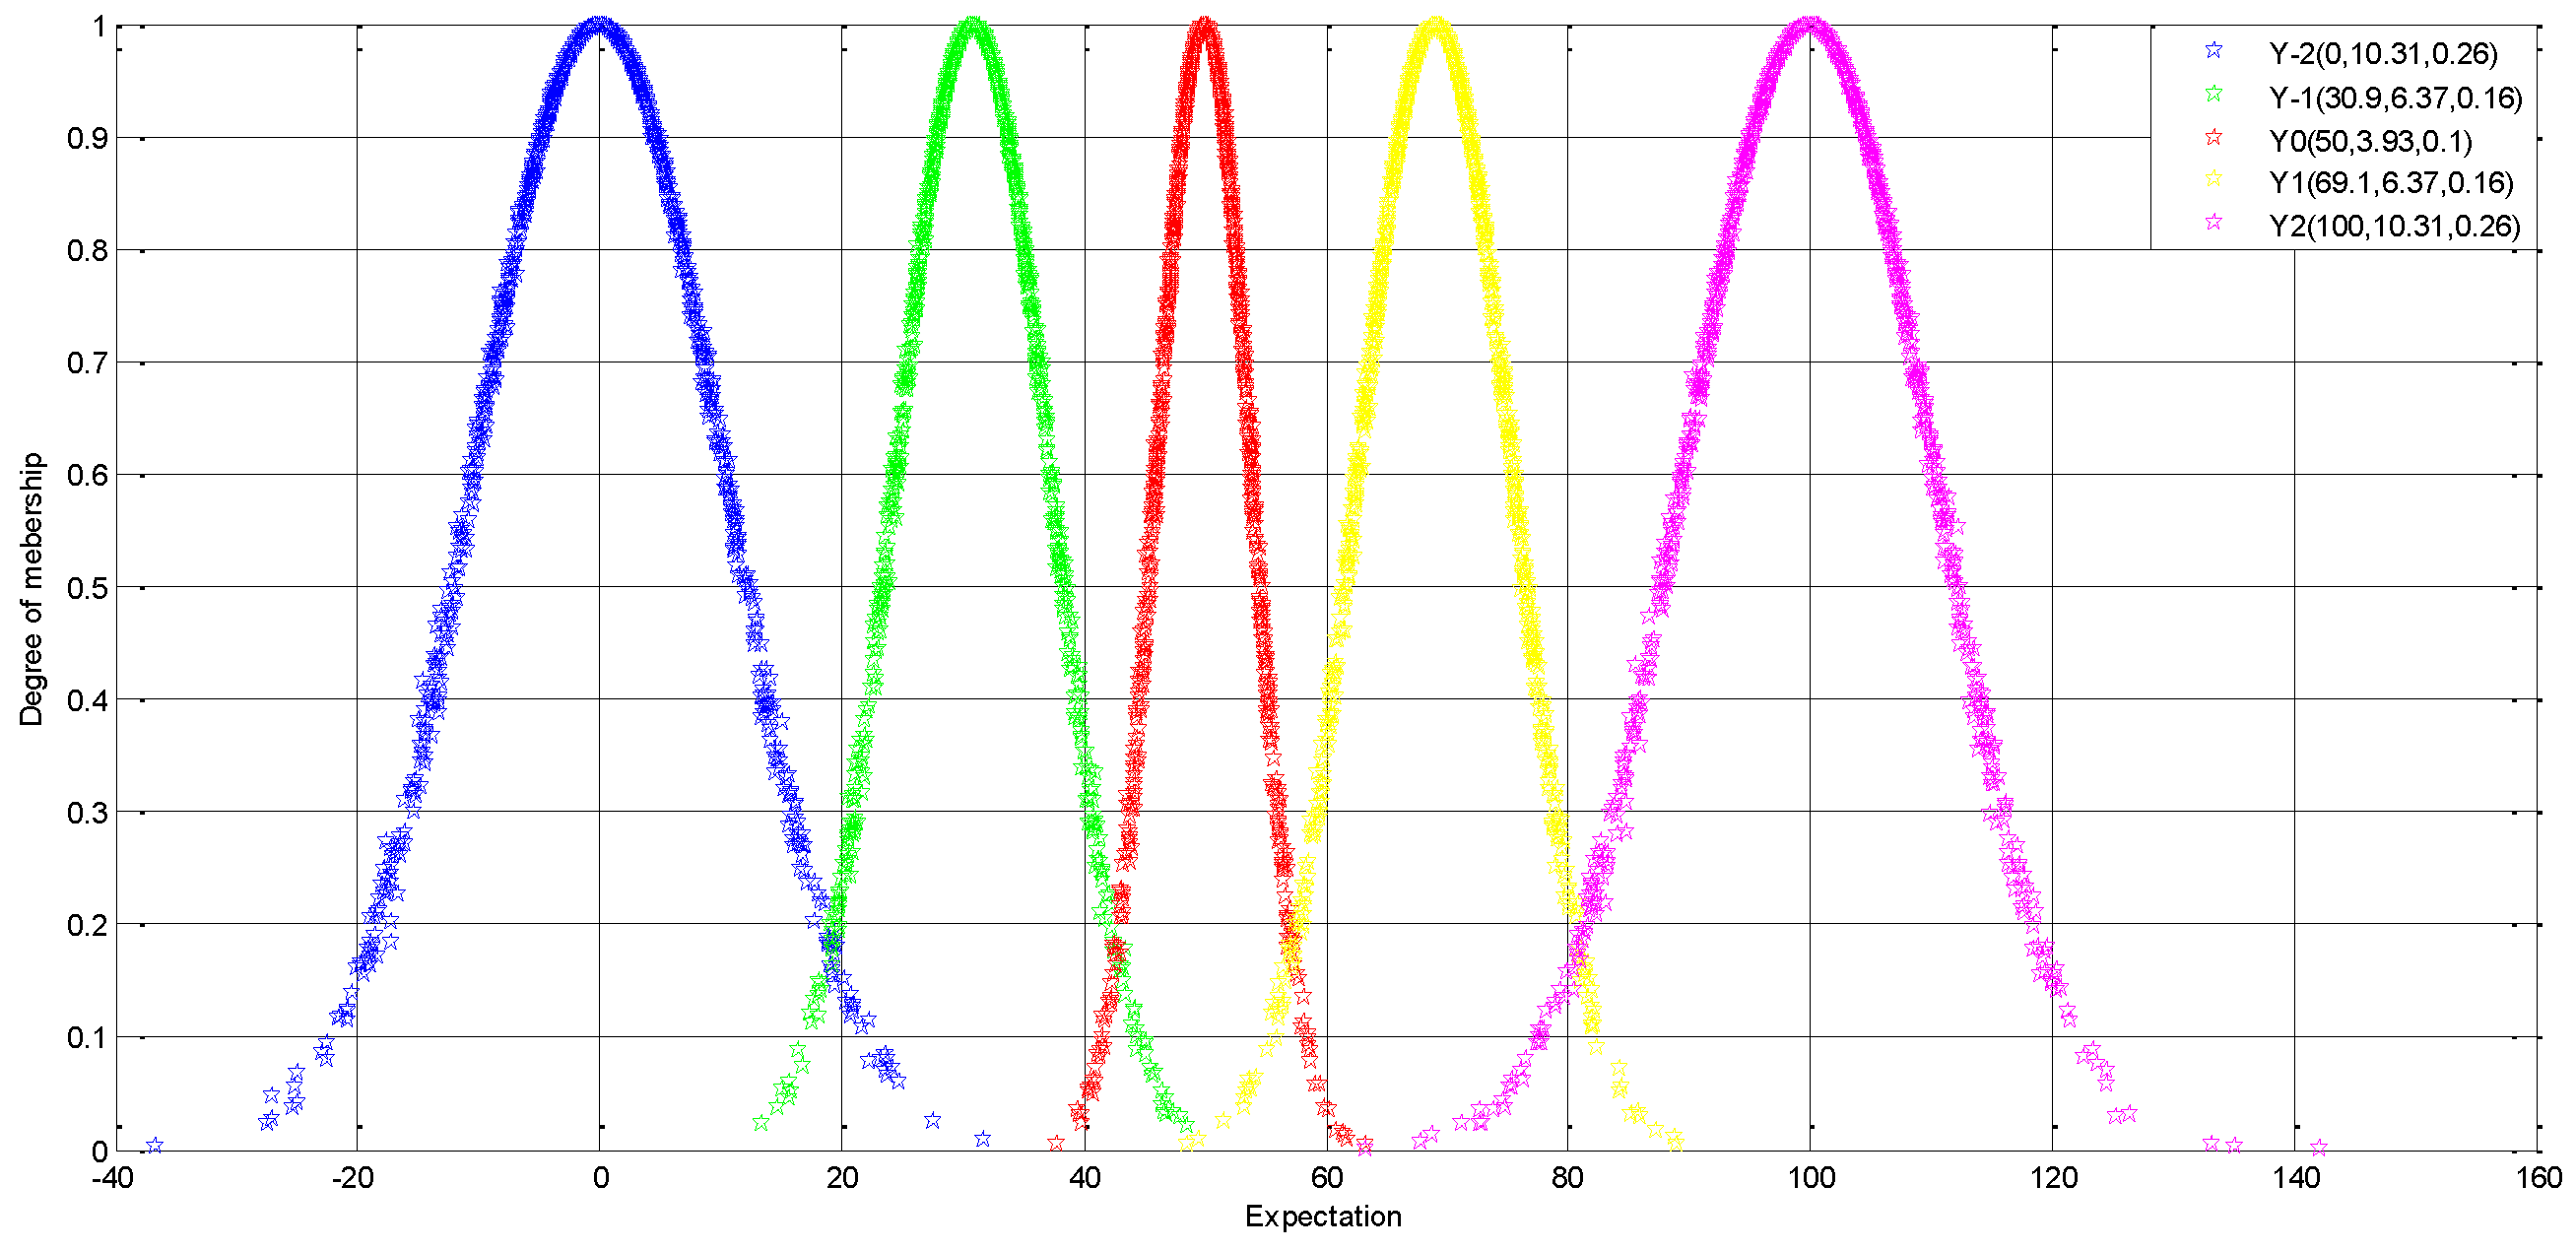
- Fuzzy linguistic variable
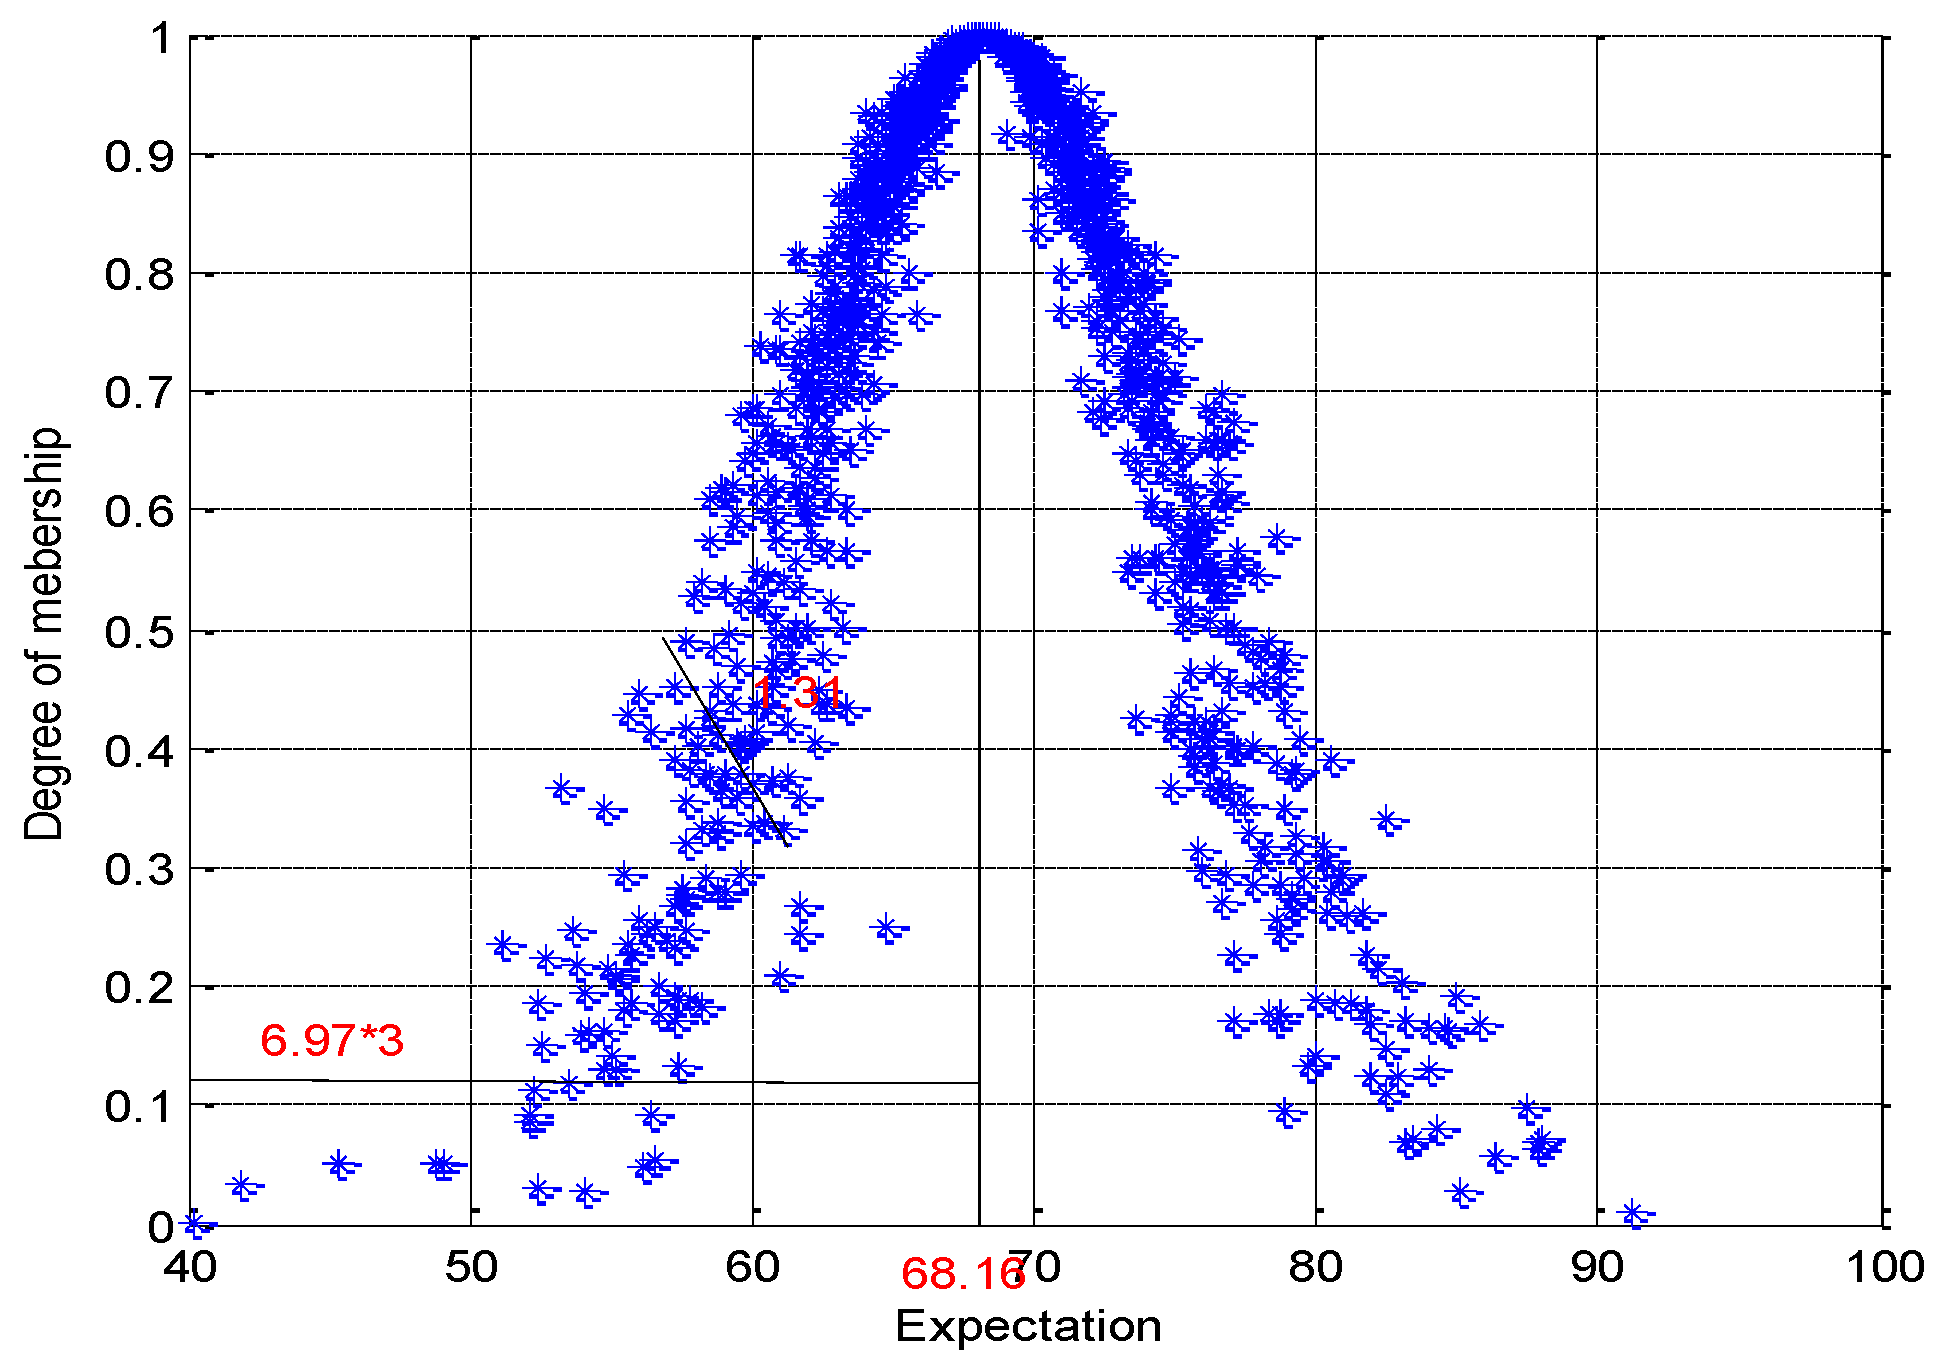
- Transforming linguistic variables into clouds
4. Empirical Results
4.1. Project Introduction
4.2. Weight Results
4.3. Evaluation Results
5. Conclusions
Acknowledgments
Author Contributions
Conflicts of Interest
References
- Global Economic Data. Macro Economy, China. 2015. Available online: http://www.qqjjsj.com/zgjjdt/45160.html (accessed on 17 May 2015).
- Lin, G.C. Urban China in transformation: Hybrid economy, juxtaposed space, and new testing ground for geographical enquiries. Chin. Geogr. Sci. 2011, 21, 1–16. [Google Scholar] [CrossRef]
- Xu, X.N. Low Carbon GDP. Southern Metropolis Daily. 3 December 2010. Available online: http://gd.news.sina.com.cn/news/2010/12/03/1060930.html (accessed on 10 July 2015).
- Cust, J. Using intermediate indicators: Lessons for climate policy. Clim. Policy 2009, 9, 450–463. [Google Scholar] [CrossRef]
- Lal, D. Methods of Project Analysis: A Review; The World Bank: Washington, DC, USA, 1974. [Google Scholar]
- Green, R.H.; Doyle, J.R.; Cook, W.D. Preference voting and project ranking using DEA and cross-evaluation. Eur. J. Oper. Res. 1996, 90, 461–472. [Google Scholar] [CrossRef]
- Rodney, H. Improving the performance of Earned Value Analysis as a construction project management tool. Eng. Constr. Arch. Manag. 2000, 7, 399–411. [Google Scholar]
- Yeung, J.F.; Chan, A.P.; Chan, D.W.; Li, L.K. Development of a partnering performance index (PPI) for construction projects in Hong Kong: A Delphi study. Constr. Manag. Econ. 2007, 25, 1219–1237. [Google Scholar] [CrossRef]
- Gabriel, A.; Rafael, A. Probabilistic control of project performance using control limit curves. J. Constr. Eng. Manag. 2007, 133, 957–965. [Google Scholar]
- Lee, S.K.; Mogi, G.; Hui, K.S. A fuzzy analytic hierarchy process (AHP)/data envelopment analysis (DEA) hybrid model for efficiently allocating energy R&D resources: In the case of energy technologies against high oil prices. Renew. Sustain. Energy Rev. 2013, 21, 347–355. [Google Scholar]
- Seung, H.H.; Myung, J.C.; Keon, S.I. Six sigma-based approach to improve performance in construction operations. J. Manag. Eng. 2008, 24, 21–31. [Google Scholar]
- Zhang, L.N.; Peng, X.J. Evaluation on Urban Low-Carbon Economy Development of Cities. Adv. Mater. Res. 2014, 850, 1339–1342. [Google Scholar] [CrossRef]
- Hai, L.Y.; Yang, X.; Han, W.H. A Study on the Index System for Evaluating Low Carbon Economy of Resource-Based Region Based on AHP. Adv. Mater. Res. 2014, 869, 935–941. [Google Scholar] [CrossRef]
- Jorgenson, A.K.; Clark, B. The relationship between national-level carbon dioxide emissions and population size: An assessment of regional and temporal variation, 1960–2005. PLoS ONE 2013, 8, 1960–2005. [Google Scholar] [CrossRef] [PubMed]
- Koji, S.; Yoshitaka, T.; Kei, G.; Yuzuru, M. Developing a long-term local society design methodology towards a low-carbon economy: An application to Shiga Prefecture in Japan. Energy Policy 2007, 35, 4688–4703. [Google Scholar]
- Zhang, J.; Zeng, W.; Wang, J.; Yang, F.; Jiang, H. Regional low-carbon economy efficiency in china: Analysis based on the super-sbm model with CO2 emissions. J. Clean. Prod. 2015, 111, 1–10. [Google Scholar] [CrossRef]
- Nieto-Morote, A.; Ruz-Vila, F. A fuzzy approach to construction project risk assessment. Int. J. Proj. Manag. 2011, 29, 220–231. [Google Scholar] [CrossRef]
- Guo, H. The Evaluation of Low-carbon Economic Development—Based on the Comprehensive Fuzzy Algorithm. Contemp. Econ. Manag. 2010, 32, 15–18. [Google Scholar]
- Shaw, K.; Shankar, R.; Yadav, S. Global supplier selection considering sustainability and carbon footprint issue: AHP multi-objective fuzzy linear programming approach. Int. J. Oper. Res. 2013, 17, 215–247. [Google Scholar] [CrossRef]
- Michael, A.B.P.; Carla, A.M.D.; Katrina, C.A.; Kathrine, G.T. Evaluating Climate Change Mitigation Options in the Philippines with Analytic Hierarchy Process (AHP). J. Chem. Eng. 2013, 13, 234–251. [Google Scholar]
- Zadeh, L.A. The concept of a linguistic variable and its application to approximate reasoning-III. Inf. Sci. 1975, 9, 43–80. [Google Scholar] [CrossRef]
- Cabrerizo, F.J.; Pérez, I.J.; Herrera-Viedma, E. Managing the consensus in group decision making in an unbalanced fuzzy linguistic context with incomplete information. Knowl. Based Syst. 2010, 23, 169–181. [Google Scholar] [CrossRef]
- Fan, Z.P.; Liu, Y. A method for group decision-making based on multi-granularity uncertain linguistic information. Expert Syst. Appl. 2010, 37, 4000–4008. [Google Scholar] [CrossRef]
- Zhu, J.J.; Wang, H.H.; Chen, Y.; Qin, L. Project evaluation method using non-formatted text information based on multi-granular linguistic labels. Inf. Fusion 2015, 24, 93–107. [Google Scholar] [CrossRef]
- Delgado, M.; Verdegay, J.L.; Vila, M.A. Linguistic decision-making models. Int. J. Intell. Syst. 1992, 7, 479–492. [Google Scholar] [CrossRef]
- Jiang, Y.P.; Fan, Z.P.; Ma, J. A method for group decision making with multi-granularity linguistic assessment information. Inf. Sci. 2008, 178, 1098–1109. [Google Scholar] [CrossRef]
- Bordogna, G.; Fedrizzi, M.; Pasi, G. A linguistic modeling of consensus in group decision making based on OWA operators. IEEE Trans. Syst. Man Cybern. A 1997, 27, 126–133. [Google Scholar] [CrossRef]
- Xu, Z.S. A method based on fuzzy linguistic assessments and linguistic ordered weighted averaging (OWA) operator for multi-attribute group decision making problems. Syst. Eng. 2002, 20, 79–82. [Google Scholar]
- Tan, C.; Wu, D.D.; Ma, B. Group decision making with linguistic preference relations with application to supplier selection. Expert Syst. Appl. 2011, 38, 14382–14389. [Google Scholar] [CrossRef]
- Herrera, F.; Herrera-Veda, E.; Martinez, L. A fusion approach for managing multi-granularity linguistic term sets in decision making. Fuzzy Sets Syst. 2000, 114, 43–58. [Google Scholar] [CrossRef]
- Yang, W.; Chen, Z. New aggregation operators based on the Choquet integral and 2-tuple linguistic information. Expert Syst. Appl. 2012, 39, 2662–2668. [Google Scholar] [CrossRef]
- Wang, J.Q.; Wang, D.D.; Zhang, H.Y.; Chen, X.H. Multi-criteria group decision making method based on interval 2-tuple linguistic information and Choquet integral aggregation operators. Soft Comput. 2015, 19, 389–405. [Google Scholar] [CrossRef]
- Li, D.; Cheung, D.; Shi, X. Uncertainty Reasoning Based on Cloud Models in Controllers. Comput. Math. Appl. 1998, 35, 99–123. [Google Scholar] [CrossRef]
- Li, D.Y.; Du, Y. Uncertainty Artificial Intelligence; National Defense Industry Press: Beijing, China, 2005. [Google Scholar]
- Wang, J.Q.; Wang, P.; Wang, J.; Zhang, H.Y.; Chen, X.H. Atanassov’s Interval-Valued Intuitionistic Linguistic Multi-criteria Group Decision-Making Method Based on the Trapezium Cloud Model. Trans. Fuzzy Syst. 2015, 23, 542–554. [Google Scholar] [CrossRef]
- Li, D.; Du, Y. Artificial Intelligence with Uncertainty; Chapman & Hall/CRC Press: Boca Raton, FL, USA, 2007. [Google Scholar]
- Li, D.; Liu, C.; Gan, W. A new cognitive model: Cloud model. Int. J. Intell. Syst. 2009, 24, 357–375. [Google Scholar] [CrossRef]
- Feng, Y.Q.; Wang, H.L.; Cao, M.K. Intelligent decision support system based on cloud model. In Proceeding of the 2006 Chinese Control and Decision Conference, Tianjin, China, 27 July 2006; pp. 1081–1084.
- Yan, C.S.; Li, Y.J. Analysis of dynamic consumer detailed segmentation model based on cloud model. J. Harbin Inst. Technol. 2007, 39, 299–302. [Google Scholar]
- Zhang, J.; Zhang, J.A.; Sun, P. Trust evaluation model based on cloud model for C2C electronic commerce. Comput. Syst. Appl. 2010, 19, 83–87. [Google Scholar]
- Qin, K.; Xu, K.; Liu, F.; Li, D. Image segmentation based on histogram analysis utilizing the cloud model. Comput. Math. Appl. 2011, 62, 2824–2833. [Google Scholar] [CrossRef]
- Wang, J.Q.; Lu, P.; Zhang, H.Y.; Chen, X.H. Method of multi-criteria group decision-making based on cloud aggregation operators with linguistic information. Inf. Sci. 2014, 274, 177–191. [Google Scholar] [CrossRef]
- Zhang, A.P.; Zhang, X.H. Method of multi-attribute decision making on linguistic interval information. Comput. Eng. Appl. 2011, 47, 156–158. [Google Scholar]
- Zhang, Z.; Guo, C.H. A method for multi-granularity uncertain linguistic group decision making with incomplete weight information. Knowl. Based Syst. 2012, 26, 111–119. [Google Scholar] [CrossRef]
- Bao, G.Y.; Lian, X.L.; He, M.; Wang, L.L. Improved two-tuple linguistic representation model based on new linguistic evaluation scale. Control Decis. 2010, 25, 780–784. [Google Scholar]
- Fu, B.; Li, D.G.; Wang, M.K. Review and prospect on research of cloud model. Appl. Res. Comput. 2011, 28, 420–426. [Google Scholar]
- Jim, W.; Rob, B.; David, O.; Michele, S. Lessons from China: Building technological capabilities for low carbon technology transfer and development. Clim. Chang. 2015, 131, 387–399. [Google Scholar]
- Qian, Y.; Cong, B.L. An optimization model of machining process route for low carbon manufacturing. Int. J. Adv. Manuf. Technol. 2015, 80, 1181–1196. [Google Scholar]
- Kuo, T.C.; Chen, H.M.; Liu, C.Y. Applying multi-objective planning in low-carbon product design. Int. J. Precis. Eng. Manuf. 2014, 15, 241–249. [Google Scholar] [CrossRef]
- Zhang, Z.Q.; Qu, J.S.; Zeng, J.J. A quantitative comparison and analysis on the assessment indicators of greenhouse gases emission. J. Geogr. Sci. 2008, 18, 387–399. [Google Scholar] [CrossRef]
- Chomaitong, S.; Perera, R. Adoption of the low carbon society policy in locally-governed urban areas: Experience from Thai municipalities. Mitig. Adapt. Strateg. Glob. Chang. 2014, 19, 1255–1275. [Google Scholar] [CrossRef]
- Saaty, T.L. Making and validating complex decisions with the AHP/ANP. J. Syst. Sci. Syst. Eng. 2005, 14, 1–36. [Google Scholar] [CrossRef]
- Pipatprapa, A.; Huang, H.-H.; Huang, C.H. A Novel Environmental Performance Evaluation of Thailand’s Food Industry Using Structural Equation Modeling and Fuzzy Analytic Hierarchy Techniques. Sustainability 2016, 8, 246. [Google Scholar] [CrossRef]
- Calabrese, A.; Costa, R.; Menichini, T. Using Fuzzy AHP to manage Intellectual Capital assets: An application to the ICT service industry. Expert Syst. Appl. 2013, 40, 3747–3755. [Google Scholar] [CrossRef]
- Shaw, K.; Shankar, R.; Yadav, S.S.; Thakur, L.S. Supplier selection using fuzzy AHP and fuzzy multi-objective linear programming for developing low carbon supply chain. Expert Syst. Appl. 2012, 39, 8182–8192. [Google Scholar] [CrossRef]
- Lu, Y.J. Weight calculation method of fuzzy analytical hierarchy process. Fuzzy Syst. Math. 2002, 16, 79–85. [Google Scholar]
- Li, D.Y.; Meng, H.J.; Shi, X.M. Membership clouds and membership cloud generators. Comput. Res. Dev. 1995, 32, 15–20. [Google Scholar]
- Xu, Z.S. A direct approach to group decision making with uncertain additive linguistic preference relations. Fuzzy Optim. Decis. Mak. 2006, 5, 21–32. [Google Scholar] [CrossRef]
- Wang, H.L.; Feng, Y.Q. On multiple attribute group decision making with linguistic assessment information based on cloud model. Control Decis. 2005, 20, 679–685. [Google Scholar]
- Wang, J.Q.; Peng, J.J.; Zhang, H.Y.; Liu, T.; Chen, X.H. An uncertain linguistic multi-criteria group decision-making method based on a cloud model. Group Decis. Negot. 2015, 24, 171–192. [Google Scholar] [CrossRef]


| Indicator | Indicator Description |
|---|---|
| Reasonable arrangement degree of energy recycling system | There is a scientific planning in the construction phase for the project’s energy recycling. |
| The utilization rate of renewable energy | The utilization rate of renewable energy = The utilization of renewable energy/The utilization of total energy |
| The equipment efficiency | The effective availability of the equipment. |
| The utilization rate of resource recycling | The rate of recyclable material = The amount of recyclable materials/The total amount of all materials. |
| Energy saving construction method and technology | Whether the energy saving construction method and technology are used in the process of the projects construction or not. |
| The utilization degree of renewable energy technology | The more we use the renewable energy technology in the projects, the more carbon dioxide emissions we can reduce to meet the requirements of low-carbon economy development. |
| The energy consumption in the construction and transportation process | In order to save the energy consumption, we adopt the proximity principle for energy use in the construction process. |
| The amount of energy power saving in the project(kilowatt) | The amount of power saving after the project completed. Saving 1 kilowatt hour of power = reducing 0.997 kg carbon dioxide emissions = reducing 0.272 kg “carbon” emissions |
| The amount of coal saving in the project (kg) | The amount of coal saving after the project completed. Saving 1 kg of standard coal = reducing 2.493 kg carbon dioxide emissions = reducing 0.68 kg “carbon” emissions |
| The amount of gasoline saving in the project | Saving one liter of gasoline = reducing 2.3 kg carbon dioxide emissions = reducing 0.627 kg “carbon” emissions |
| The amount of diesel saving in the project | The amount of diesel saved after the project completed. Saving one liter of diesel = reducing 2.63 kg carbon dioxide emissions = reducing 0.717 kg “carbon” emissions |
| The utilization rate of waste recycling | The waste recycling in the project = The amount of waste reduced by recycling the waste in the project/the total weight in the construction and demolition of the project |
| The utilization of combustible gas recycling | Combustible gas produced during the project should be recycling, the situation of the repeated use. |
| The re-utilization degree of extra heat and pressure | Re-use situation of the residual pressure and waste heat in this project. |
| Highly-efficient utilization of water resources | According to “making the best use of high quality water, and saving low quality water” principle. |
| The utilization rate of recycling water resources | In order to realize sewage recycling use, and improve the recycling utilization of water resources, energy-saving innovation technology for sewage disposing is used. |
| High-carbon emission energy utilization | The utilization of energy with high-carbon emission should be minimized. |
| The carbon-dioxide emission reduced | The amount of carbon-dioxide emissions reduced. |
| The coefficient of energy carbon emission in the project | The coefficient of energy carbon emission = carbon emission/energy consumption, the index is used to check out whether the structure of energy in the project meets the requirements of low-carbon economy development. |
| The saving degree of resources utilization in the process | The utilization degree of low carbon materials in the project, and the level of using low-carbon technologies. |
| Environment conservation | The waste-disposing situation in the operation process, and the complaints from the surrounding residents. |
| The rate of planting in the project | The rate of planting = planting area in the project/total area of the project, the bigger the planting area are, the more the carbon dioxide can be absorbed by the vegetation. |
| Environmental noise | To check out the level of the environment noise after the project completed, the environmental noise should be minimized. |
| Project impact in the natural landscape | To check out whether the project influences the local natural landscape, and whether the influence is positive or negative. |
| Emissions of sewage pollution in the project | After the standard disposal, sewage emissions in the implementation should be minimized. |
| Emissions of waste pollution in the project | After the standard disposal, waste emissions in the implementation should be minimized. |
| Emissions of exhaust gas in the project | After the standard disposal, exhaust gas emissions should be minimized. |
| Scale | Definition | Illustration |
|---|---|---|
| = 0.9 | Absolutely more important | is absolutely more important than |
| = 0.8 | Much more important | is much more important than |
| = 0.7 | More important | is more important than |
| = 0.6 | Slightly more important | is slightly more important than |
| = 0.5 | Equally important | is as important as |
| Reverse comparison |
| Criteria Layer Weight | Indicator Weight | Comprehensive Weight |
|---|---|---|
| (0.12) | 0.0504 | |
| (0.16) | 0.0672 | |
| (0.07) | 0.0294 | |
| (0.24) | 0.1008 | |
| (0.09) | 0.0378 | |
| (0.13) | 0.0546 | |
| (0.19) | 0.0798 | |
| (0.14) | 0.0462 | |
| (0.05) | 0.0165 | |
| (0.07) | 0.0231 | |
| (0.05) | 0.0165 | |
| (0.05) | 0.0165 | |
| (0.11) | 0.0363 | |
| (0.06) | 0.0198 | |
| (0.09) | 0.0198 | |
| (0.06) | 0.0198 | |
| (0.09) | 0.0297 | |
| (0.08) | 0.0264 | |
| (0.07) | 0.0231 | |
| (0.11) | 0.0363 | |
| (0.16) | 0.0400 | |
| (0.13) | 0.0325 | |
| (0.12) | 0.0300 | |
| (0.08) | 0.0200 | |
| (0.19) | 0.0475 | |
| (0.10) | 0.0250 | |
| (0.22) | 0.0550 |
| Indicators | The Assessment Results of Expert 1 | Comprehensive Cloud | Indicator Weights |
|---|---|---|---|
| (100,10.31,0.37) | 0.12 | ||
| (78.64,7.12,0.31) | 0.16 | ||
| (44.11,4.67,0.19) | 0.07 | ||
| (69.10,6.37,0. 23) | 0.24 | ||
| (78.64,7.12,0.31) | 0.09 | ||
| (69.10,6.37,0.23) | 0.13 | ||
| (55.89,4.40,0.19) | 0.19 | ||
| (69.10,6.37,0.23) | 0.14 | ||
| (55.89,4.40,0.19) | 0.05 | ||
| (55.89,4.40,0.19) | 0.07 | ||
| (44.11,4.67,0.19) | 0.05 | ||
| (69.10,6.37,0.23) | 0.05 | ||
| (69.10,6.37,0.23) | 0.11 | ||
| (55.89,4.40,0.19) | 0.06 | ||
| (78.64,7.12,0.31) | 0.09 | ||
| (55.89,4.40,0.19) | 0.06 | ||
| (69.10,6,37,0.16) | 0.09 | ||
| (55.89,4.40,0.19) | 0.08 | ||
| (78.64,7.12,0.31) | 0.07 | ||
| (69.10,6,37,0.16) | 0.11 | ||
| (55.89,4.40,0.19) | 0.16 | ||
| (55.89,4.40,0.19) | 0.13 | ||
| (50.00,3.93,0.10) | 0.12 | ||
| (55.89,4.40,0.19) | 0.08 | ||
| (78.64,7.12,0.31) | 0.19 | ||
| (50.00,3.93,0.10) | 0.10 | ||
| (69.10,6,37,0.16) | 0.22 |
© 2016 by the authors; licensee MDPI, Basel, Switzerland. This article is an open access article distributed under the terms and conditions of the Creative Commons Attribution (CC-BY) license (http://creativecommons.org/licenses/by/4.0/).
Share and Cite
Li, L.; Fan, F.; Ma, L.; Tang, Z. Energy Utilization Evaluation of Carbon Performance in Public Projects by FAHP and Cloud Model. Sustainability 2016, 8, 630. https://doi.org/10.3390/su8070630
Li L, Fan F, Ma L, Tang Z. Energy Utilization Evaluation of Carbon Performance in Public Projects by FAHP and Cloud Model. Sustainability. 2016; 8(7):630. https://doi.org/10.3390/su8070630
Chicago/Turabian StyleLi, Lin, Fangfang Fan, Li Ma, and Ziran Tang. 2016. "Energy Utilization Evaluation of Carbon Performance in Public Projects by FAHP and Cloud Model" Sustainability 8, no. 7: 630. https://doi.org/10.3390/su8070630
APA StyleLi, L., Fan, F., Ma, L., & Tang, Z. (2016). Energy Utilization Evaluation of Carbon Performance in Public Projects by FAHP and Cloud Model. Sustainability, 8(7), 630. https://doi.org/10.3390/su8070630