Article

The Effects of Five Forms of Capital on Thought Processes Underlying Water Consumption Behavior in Suburban Vientiane

1
Department of Civil Engineering, Faculty of Engineering, The University of Tokyo, 4-6-1 Komaba, Meguro, Tokyo 153-8505, Japan
2
Institute of Industrial Science, The University of Tokyo, 4-6-1 Komaba, Meguro, Tokyo 153-8505, Japan
3
Faculty of Water Resources, National University of Laos, Ban Tadthong, Sikottabong District, Vientiane, Lao PDR
4
Soukphasith Survey-Design and Construction Sole Co., Ltd., Ban Nong Neing, Xaysetha District, Vientiane, Lao PDR
*
Author to whom correspondence should be addressed.
Sustainability 2016, 8(6), 538; https://doi.org/10.3390/su8060538
Submission received: 29 February 2016 / Revised: 11 May 2016 / Accepted: 1 June 2016 / Published: 6 June 2016
(This article belongs to the Section Environmental Sustainability and Applications)

Abstract

:
A community’s water supply is one of its most important infrastructures, as sufficient quality and quantity of water are as much prerequisites for human life as economic development. The rapid urbanization predicted for developing countries will cause serious water shortages in densely populated areas. The Lao People’s Democratic Republic (PDR) is taking precautions by planning and developing their water supply infrastructure to ensure reliable supply of water. We used the five capitals model of sustainable livelihoods to capture how a household makes a living and analyzed the effects of five forms of capital (natural, physical, human, financial, and social) on water consumption behaviors from the perspective of the residents’ livelihood. We conducted a survey to gain an understanding of the thought processes behind water consumption behavior in two villages in suburban Vientiane. The results indicated that natural and physical capital delayed connections to the water supply. Financial capital stimulated the purchase of high-quality water in preference to a connection to the water supply. This lack of connection is not necessarily sustainable in the near future, considering ongoing urbanization. Furthermore, this possibility presents a difficult problem, as residents do not usually acknowledge it. To accomplish sustainable development goals, this gap should be overcome.

1. Introduction

Water resources, and the range of water-related services provided, underpin poverty reduction, economic growth and environmental sustainability [1]. Sufficient and safe water should be made available to meet every person’s basic needs, and to enable healthy lifestyles [1]. As a basic human right to fulfill the minimum needs for living, 50 L of clean water per person per day is required [2]. In terms of human health, access to improved water sources substantially reduces the rates of morbidity and the severity of diseases related to insalubrious water [3]. Both water quality and quantity are important for decreasing the risk of such diseases [4].
Halving the population without access to improved sources of water near the household was set as one of the targets of the Millennium Development Goals (MDGs) [5]. Nearly 80% of the people without access to improved sources of water are concentrated in three regions: sub-Saharan Africa, Eastern Asia, and Southern Asia [6]. As of 2012, however, 11% of the world’s population still had no access to improved water sources [5], and a large number of people lacked the minimum water necessary for living. In addition, one of the targets of the UN’s Sustainable Development Goals (SDGs) is to achieve universal and equitable access to safe and affordable drinking water for all by 2030 [7].
After the minimum need for water is met, water demand for domestic use increases with the level of economic development, up to a certain point [8]. Therefore, a city’s water requirements depend on its prosperity as well as its population. However, the amount of available water likewise influences population capacity. Especially in urban areas, water for domestic use is supplied by the available water supply infrastructure, so the quantity and quality of water determine the population capacity.
Urbanization is one of the biggest issues facing humankind in the 21st century. According to the UN, virtually all of the world’s population growth by 2050 will be concentrated in urban areas [9]. This growth is predicted to occur mainly in the urban areas of middle and low-income countries [10]. The bulk of this population will be concentrated in smaller urban settlements of fewer than 100,000 people, although large urban agglomerations of 10 million or more have also increased in number and expanded. Residents in such small urban settlements tend to be unable to receive basic public services such as piped water, waste disposal, and electricity [11].
Rapid urbanization is anticipated in Southeast Asia, South Asia, and Africa, the same regions lacking access to improved sources of water. More water supply infrastructure will be necessary in the near future to increase the population capacity of urbanizing areas. In addition, from the perspective of economic development, adequate quality and quantity of water are basic conditions for development. In such areas, local governments and aid agencies intend to construct water supply infrastructure. Construction of such infrastructure is often at the center of urban master plans for development, and is set as one of the goals by aid agencies for cities in developing countries.
These activities have enabled those living in big cities to have access to water supplies. In suburban areas, however, natural resources such as groundwater are still available, rendering water supplies less essential. There are also many other reasons that they may not do so, including deficiencies in piped water quality, pressure, and availability [12]. Some poor residents in Cape Town, South Africa simply cannot afford to connect to the water supply, though they are living in an urban area [13].
These unresolved situations regarding adequate water can cause many problems. For example, in Jakarta, the capital of Indonesia, there is a chronic shortage of water. The urban poor do not have access to the water supply, and therefore must either buy water from a vendor at surprisingly high prices or pump excessively from underground aquifers, which causes land subsidence [14]. As a result, these individuals cannot get the minimum amount of water for living, leading to high rates of disease and poverty. In the case of Bangladesh, the lack of a clean water supply has forced residents to use groundwater contaminated by natural arsenic. Water with arsenic has an insidious effect on residents’ health. Not only safe water itself but also education about the dangers of arsenic is thought to be important in the formulation of a solution [15]. This has been reported in many Asian countries [16].
In this study, the target area was set to Lao People’s Democratic Republic (PDR), which is one of the least-developed countries globally [17] and a place where, in the near future, rapid urbanization is expected to occur. The ratio of people with access to improved sources of water was 72% in 2012 [18]. Supplying water is one of the most effective ways to improve this situation, especially in urbanizing areas.
The Vientiane Water Supply Company is a publicly owned enterprise that supplies water to the Vientiane capital. It was established in 1959, and has since constructed new plants and extended the area supplied [19]. In 1962, the Lao Water Supply Company was established and made responsible for supplying the entire country, including Vientiane, with water [20]. The water source for Vientiane is the Mekong River and groundwater; it is not significantly polluted, although water in the river and its tributaries becomes turbid during the rainy season [20]. According to a Japan International Cooperation Agency (JICA) report [21], the condition of the water supply in Vientiane has been confounded because of an increasing demand for water resulting from population growth, raised living standards, and the expansion of industrial and residential areas. Vientiane has set a target to increase the coverage ratio of the water supply in its urban area to 80% by 2020. To achieve this target, the government of Lao PDR has requested that the government of Japan and JICA cooperate with the water supplier [21].
Although the water supply service is expanding its service area, it does not cover the whole Vientiane Capital area. The proportion of households connected to the water supply is 50%. The rest draw water from private wells. The water supply authority in Vientiane Capital has tried to raise the connection ratio, and is constructing a new facility and new channels covering unconnected areas.
Residents without water supply services use groundwater mainly for domestic purposes. In many areas, they also use groundwater for drinking [22]. In general, groundwater is preferred for drinking because of its good microbial quality [23]. However, the use of groundwater for drinking is also the cause of certain diseases due to pollution by surrounding sources, such as latrines [24].
In an effort to break away from its designation as one of the least developed countries, the government of Lao PDR set the goal of raising the coverage ratio of the water supply. Urbanization and economic growth in Lao PDR are predicted to be on a level with those of other countries in Southeast Asia, such as Indonesia and Bangladesh.
To avert problematic situations in the near future, the purpose of this study was to gain insight into the thought processes of residents with regard to their water consumption behaviors, including their connection to the water supply. A greater understanding of these thought processes in urbanizing areas will promote better water resource management and water supply infrastructure planning. Water supply was defined as the water quantity and service provided by a public utility.

2. Methods

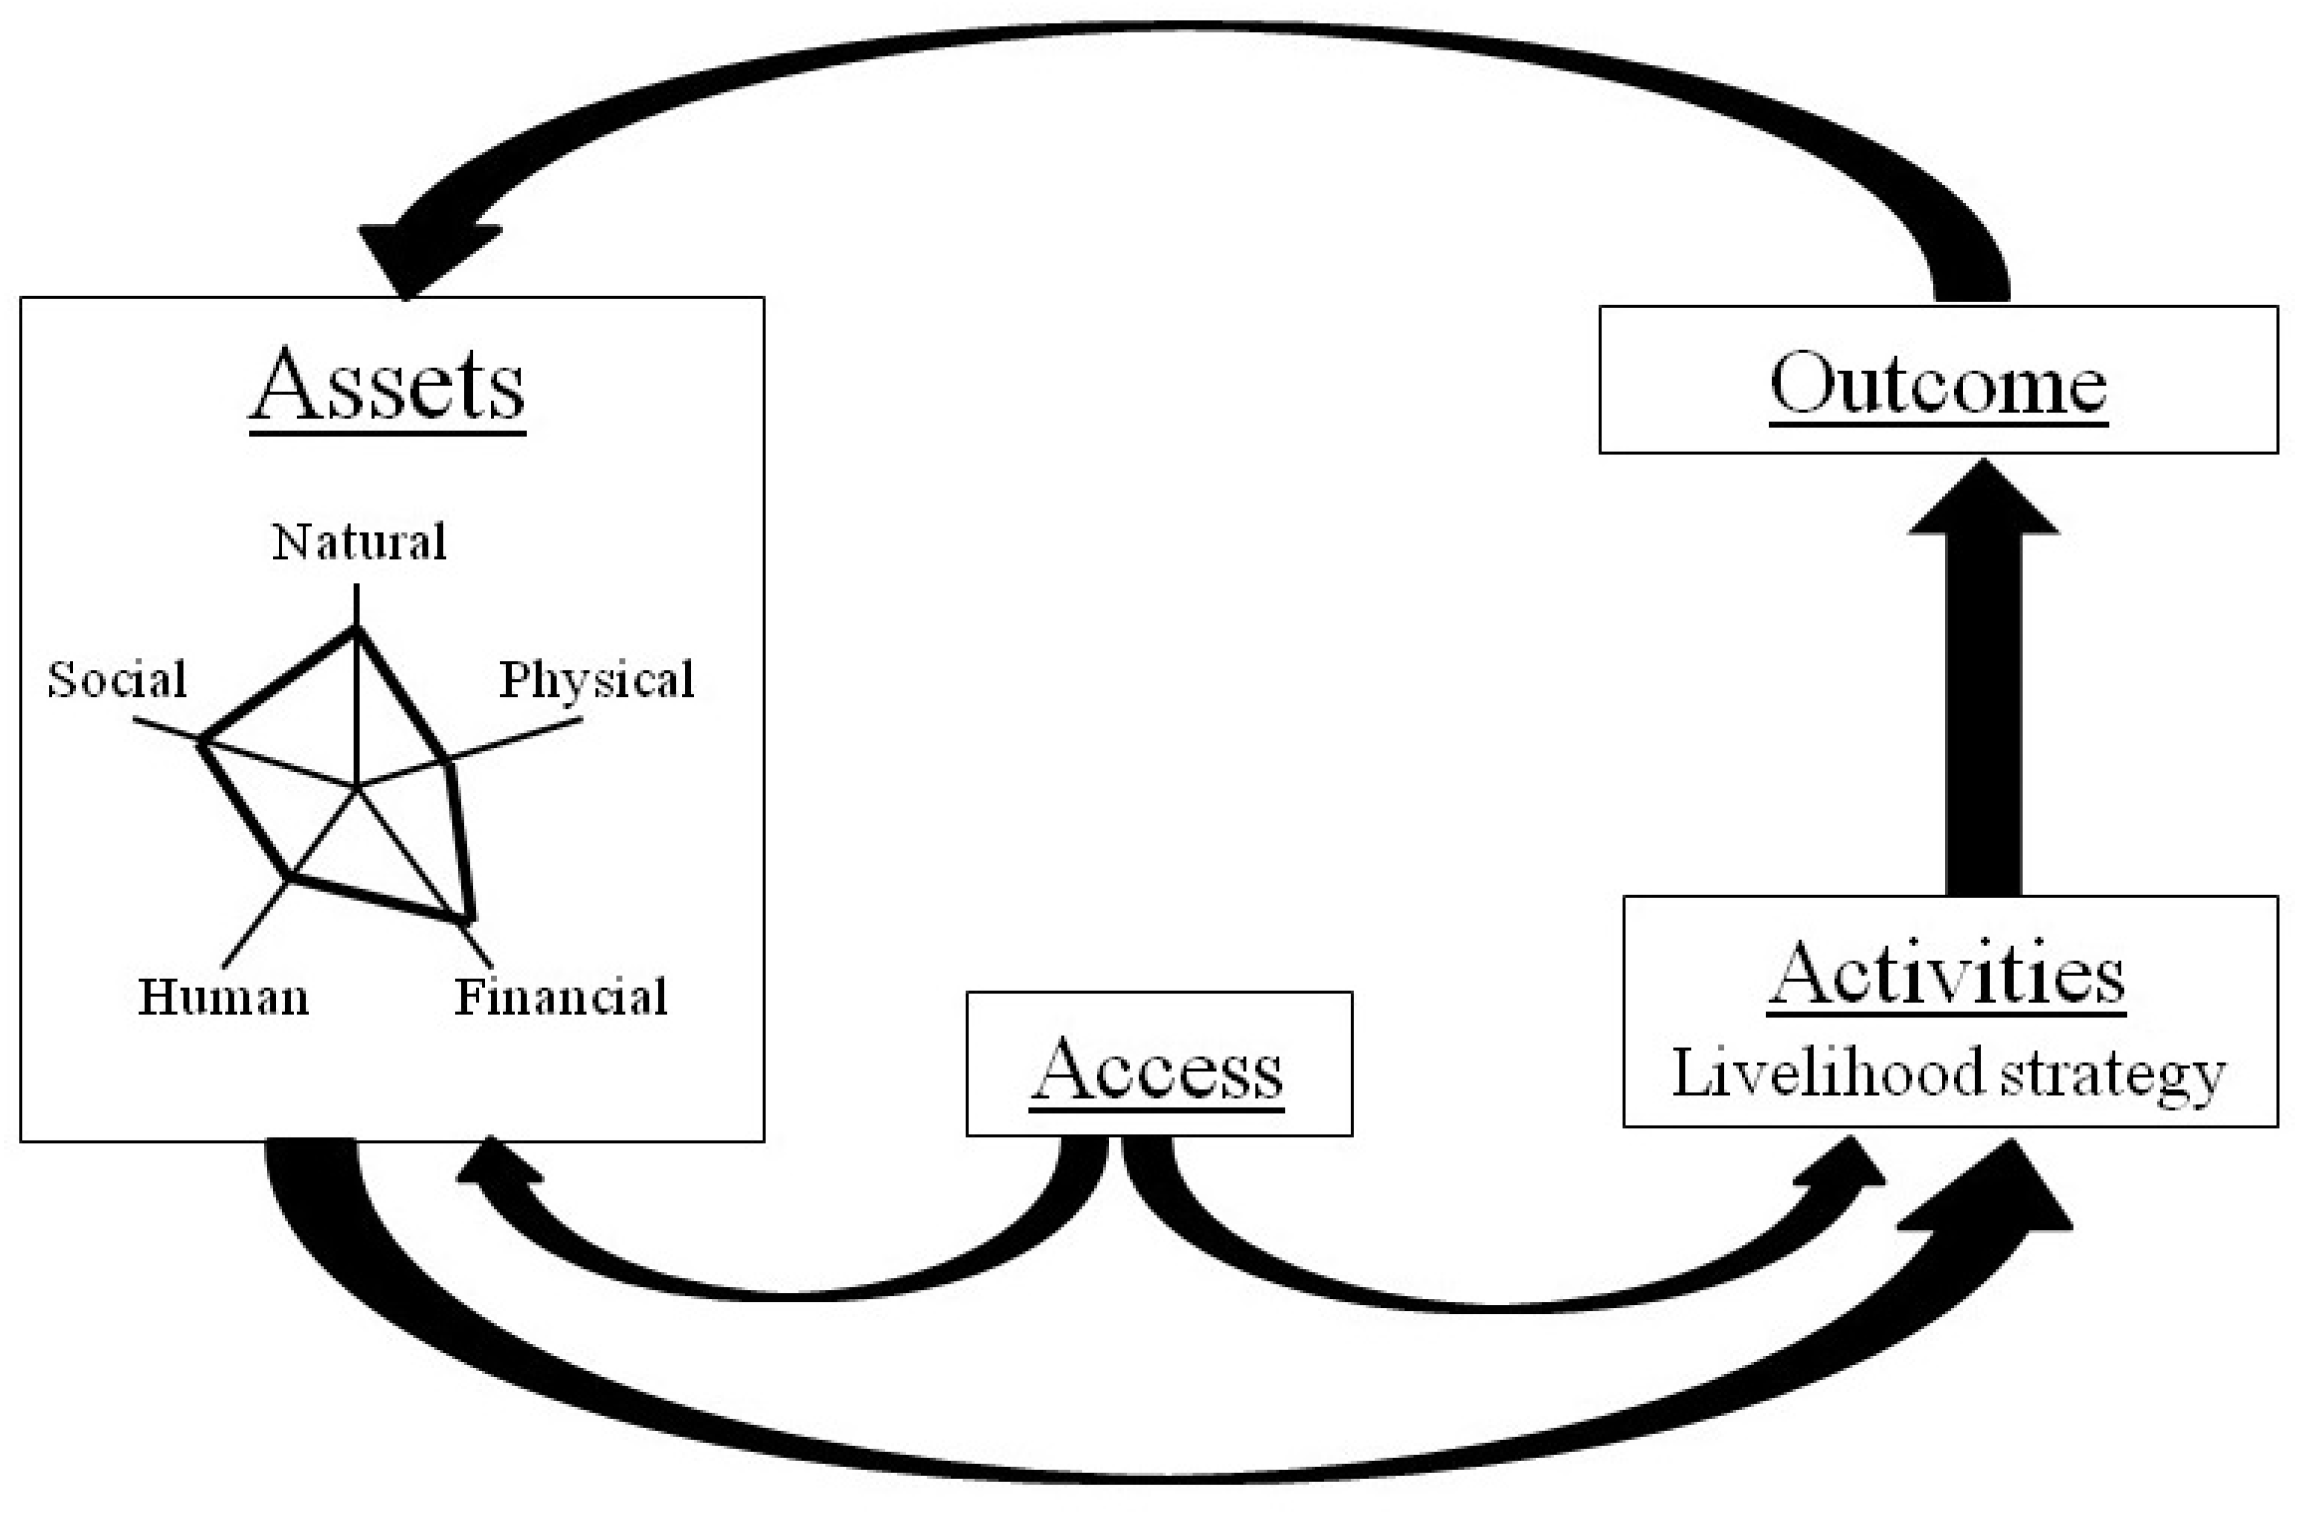
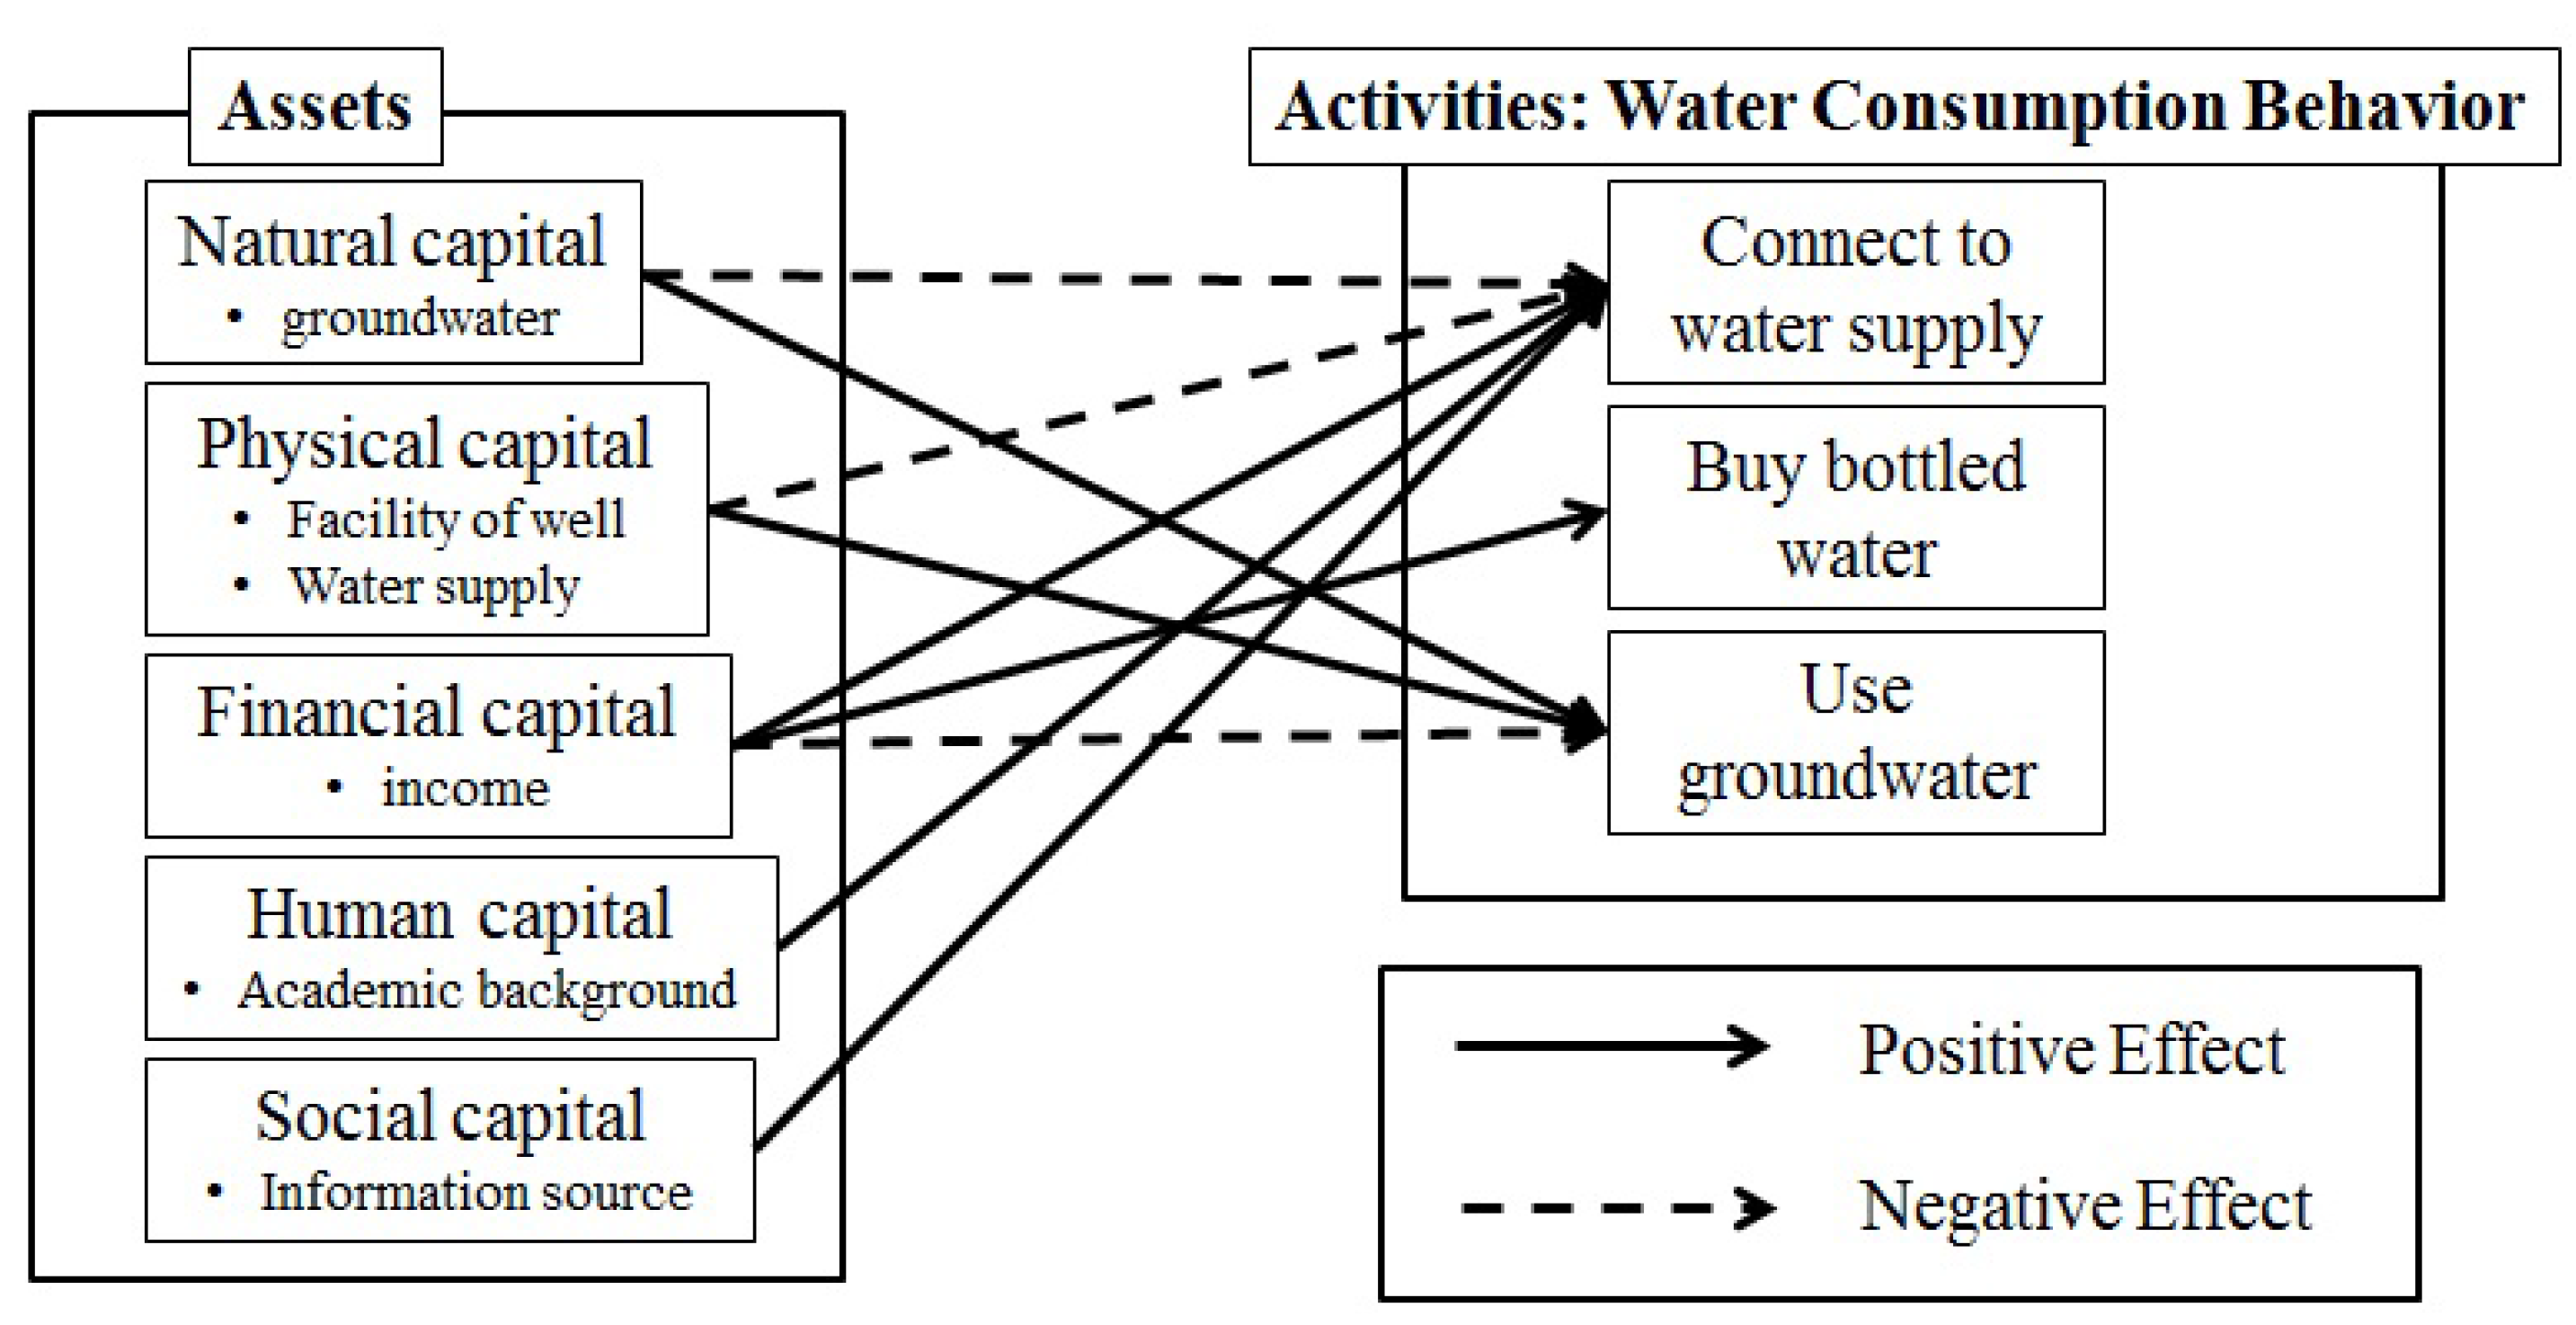
2.1. Sustainable Livelihood Framework

We attempted to reveal the thought processes of residents using the sustainable livelihood framework [25]. The framework analyzes how a household makes a living. There are many existing definitions of the sustainable livelihood framework, and several have been developed since the 1990s [26]. Concepts of capability and entitlement, developed by Amartya Sen [27,28], have been integrated into the livelihood framework [29]. However, some definitions containing these concepts confuse processes and outcomes. Ellis modified Chamber and Conway’s framework to make accessible an overriding concept [25].
According to Ellis [25], the livelihood framework is based on three concepts: assets, activities, and access. Assets are things that a household has and that it uses to develop a strategy for making a living. Assets consist of five forms of capital: natural, physical, financial, human, and social capital. Activities are livelihood strategies by which households make a living or enhance their assets. Access restricts households from some assets and activities (Figure 1). For example, people do not use some assets that are potentially available because of some local customs. We employed Ellis' definition, which considers assets, activities, and access separately, so that we could correctly capture capital that is potentially available but actually unused.
The livelihood framework has recently been employed in many studies across academic disciplines (e.g., [30,31,32]), ranging from evaluations of the effectiveness of development to analysis of an individual’s actual state of living. For example, Cohen and Sullivan applied the sustainable livelihood framework to their assessment of the multiple dimensions of water and poverty [33].

2.2. Conducting the Survey

We chose two villages in which to study the conditions of urbanization and water supply. The two villages are located in northern suburban Vientiane (Figure 2). The study area in the northeast is the village of Nataum and that in the western area is the village of Nonphanhang. The demographical characteristics of these villages are listed in Table 1. Approximately 10,000 people live in the villages. These villages have been developing rapidly because they are close to the center of Vientiane. These villages were chosen because the construction of water supply infrastructure has extended the coverage zone into the peripheral areas of the villages.
We conducted a questionnaire survey to collect data on basic profiles, the five forms of capital, and water consumption behaviors. To design the questionnaire, we formulated hypotheses about the relationship between water consumption behaviors and each form of household capital (Figure 3). These hypotheses were formulated based on findings of previous studies [25,33,34,35], our preliminary survey, and the characteristics of each form of capital. The details of the findings are explained in the following paragraphs. Regarding the choice of water source as a livelihood strategy, assessing the five types of capital reveals the thought processes behind water consumption behavior.
Water supply is categorized as a type of physical capital, which can substitute for natural capital [25]; for this reason, we hypothesized that with rich natural capital (availability of groundwater) and physical capital (existence of a facility for pumping groundwater), residents would be able to use groundwater and would be hesitant to connect to the water supply.
A characteristic of financial capital is its high substitution for other capitals [25]. Financial capital is stored in the form of cash, credit, and cattle. In this study, we asked residents about their income and expenditure to assess their financial state. Connection to the water supply costs households money, so we established the hypothesis that the higher a household’s income is, the more likely it is to connect to the water supply. Typically, more bottled water is consumed in high-income countries [33]. Therefore, we also hypothesized that a rich household would be more likely to use bottled water. According to these hypotheses, the water supply or bottled water would replace groundwater as the domestic water source.
Appropriate hygiene education contributes to residents’ increased consumption of water for multiple purposes [34]. Therefore, we established the hypothesis that households whose members had higher education levels would be more likely to install a water supply to improve sanitation.
Social capital can be divided into three components: network structure, trust and reciprocity and resources [35]. We hypothesized that the availability of information as a result of the network structure would be a limitation to connection to the water supply.
The questionnaire was composed of various sections to elicit the following information.
  • The first part included a basic household profile, such as the address, demographics, academic backgrounds, employment, and economic status. This part indicated a household’s natural, human, and financial capital. The address was used to determine the availability of groundwater.
  • The second part consisted of information about the household water sources and how water from each source was used for various purposes. This part aimed to explain household water consumption behaviors.
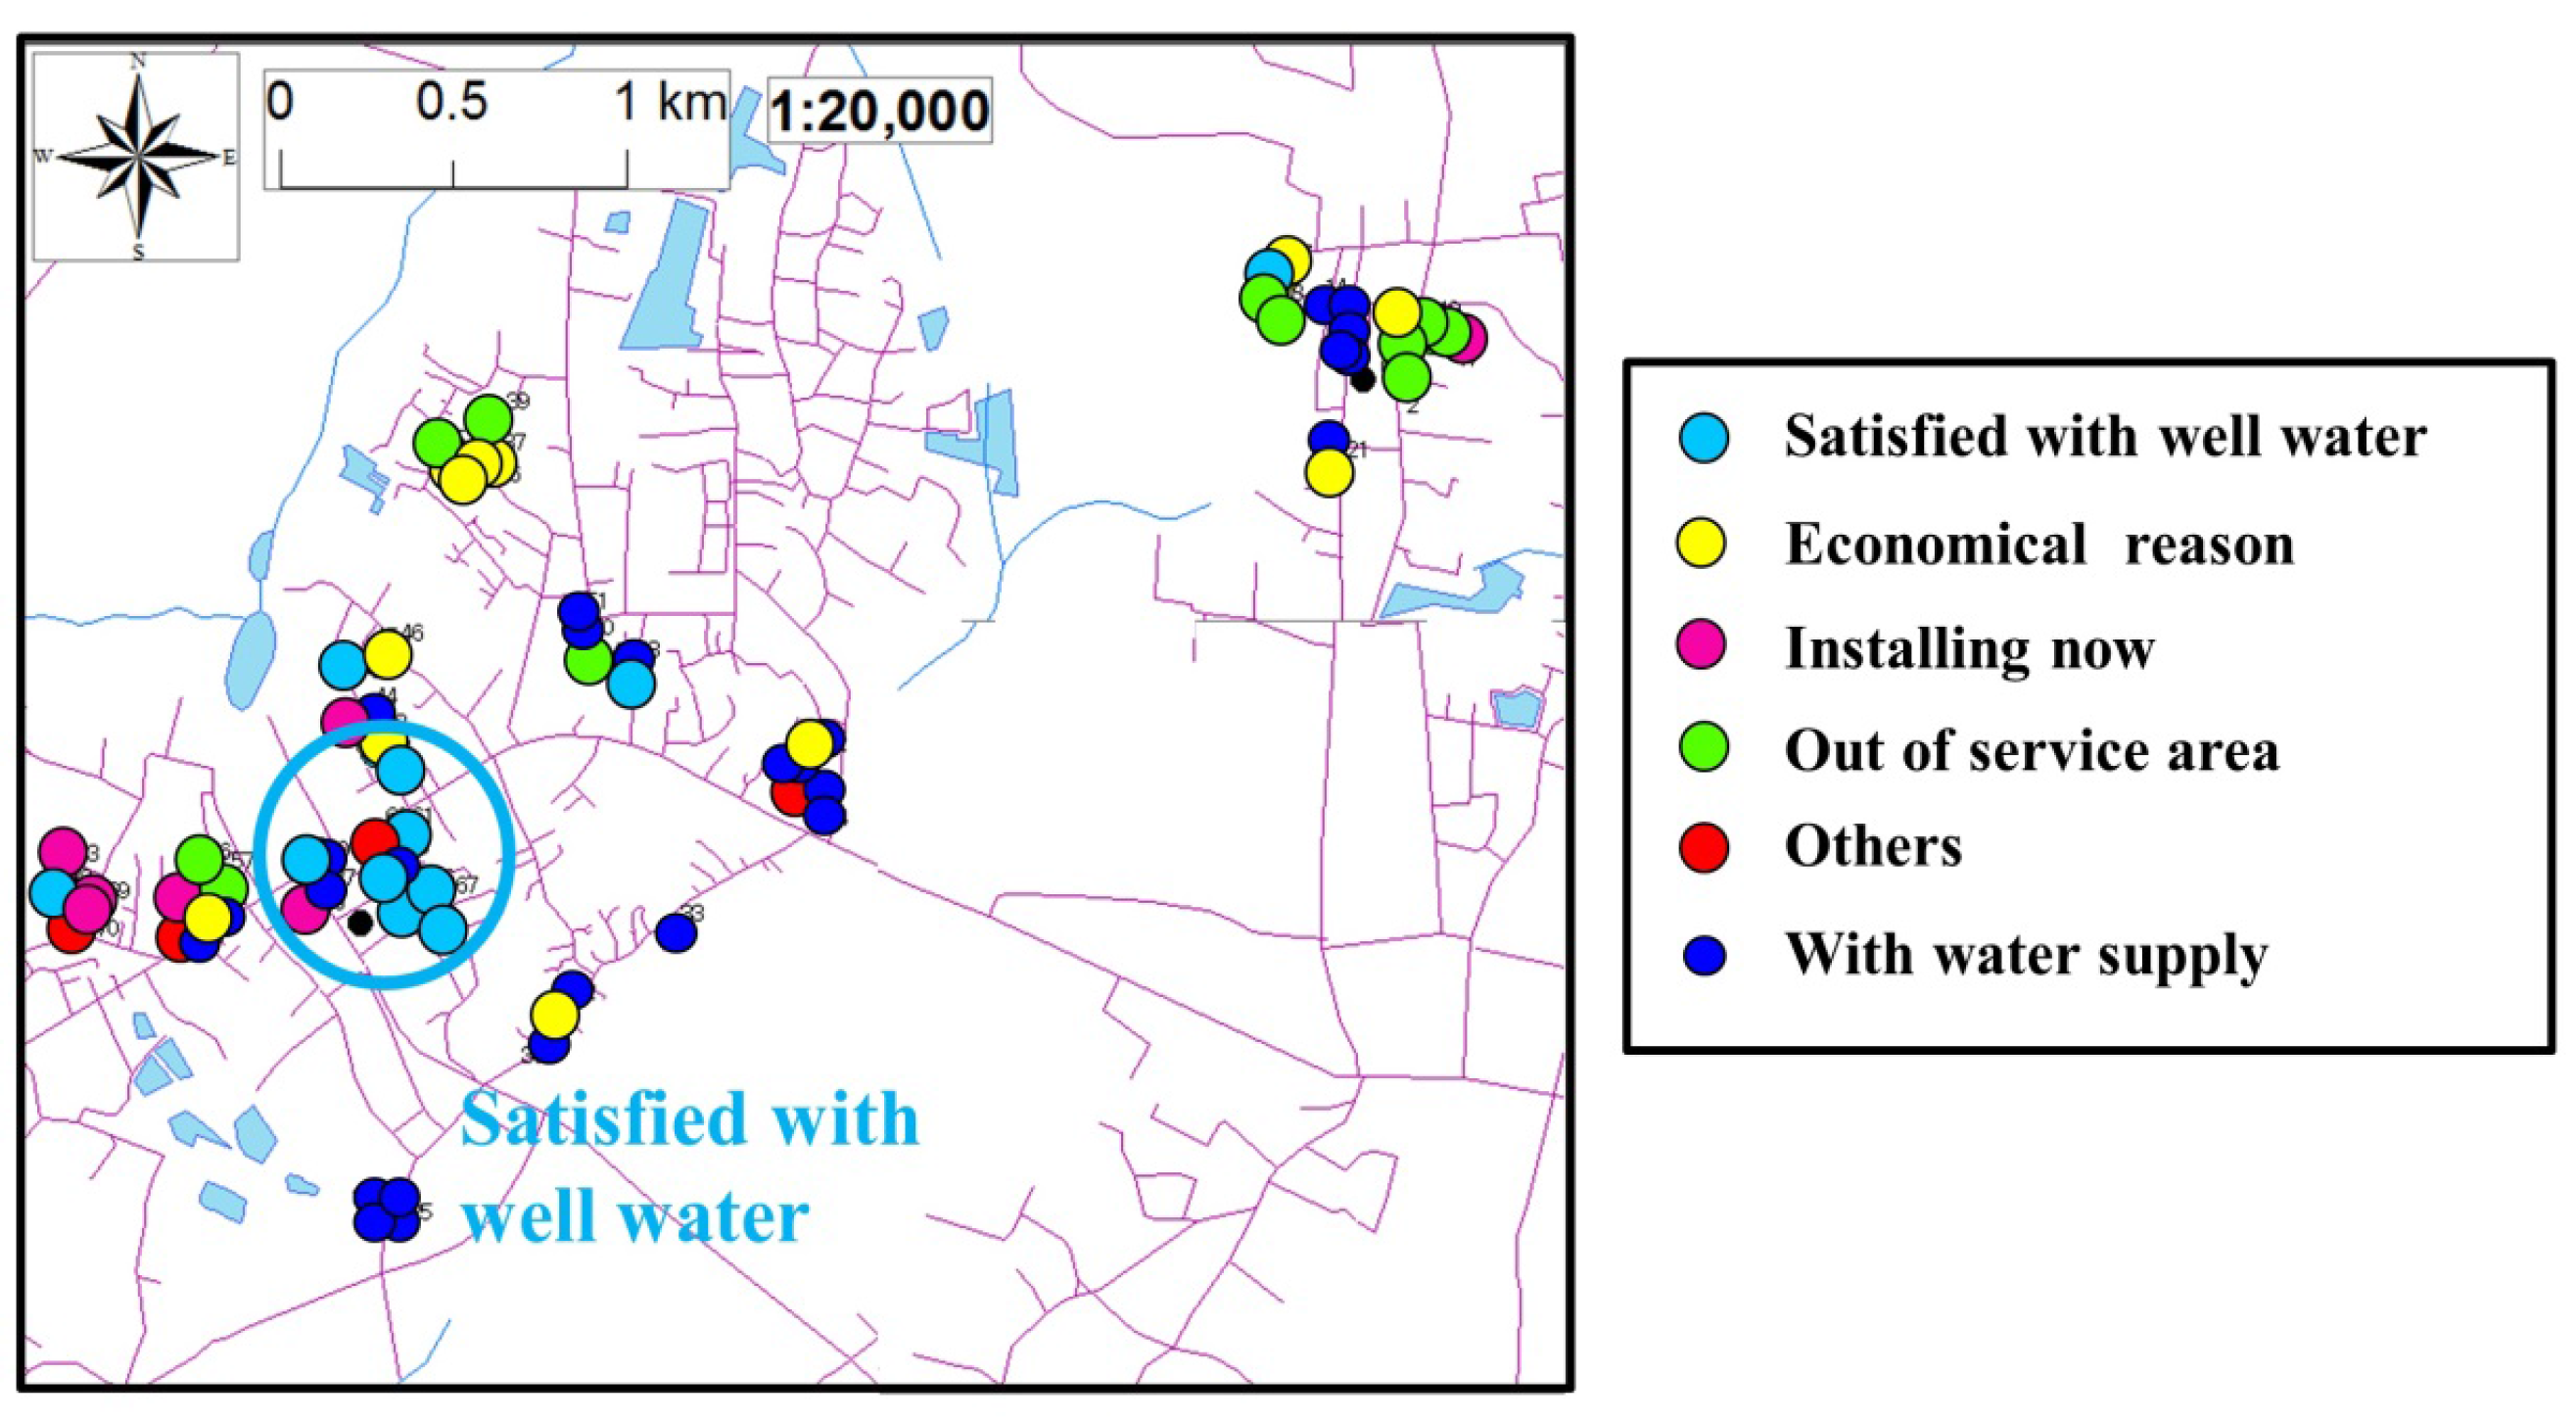
  • The third part considered the household situation with regard to water supply, such as the stability of water pressure, the monthly fee for the connection, installation cost, and reasons for not connecting to the water supply, as appropriate.
  • The fourth part consisted of information about water availability from each source. In the survey area, various water sources were used, and they had different characteristics, such as quality, price, and stability.
  • The final part asked about the household’s access to information about the water supply infrastructure. This part revealed the social capital of the household.
We conducted the questionnaire survey during 15–18 January 2014. Two teams trained our research group members; they included an interviewer and interpreter fluent in both English and Lao, and a village officer who introduced a sampled household. The interviewer and interpreter were recruited from the National University of Laos, and university personnel introduced our survey teams to the village heads. We explained the purposes for our study and the methodology to them. They enjoined the officer to take us to households. The teams visited households and elicited information directly.

2.3. Sampling Method

The sampling method and sampling rate were designed by reference to those described by Onwuegbuzie and Collins [36]. First, we defined 16 blocks around the target villages; the blocks were spatially distributed using road and elevation maps, based on the sampling scheme of maximum variation. The blocks were established to capture the effect of differences in natural capital. We asked village officers to introduce us to three or more households in each block; the minimum number of samples from each block was determined based on the subgroup sampling design. We collected four to nine samples from each block to equalize the sampling rate to the village populations.
A total of 82 samples were collected; 21 were from households belonging to Nataum village, and 61 from households in Nonphanhang village (Table 1). Fifty-one percent of interviewees were men, and 49% were women.

3. Results and Discussion

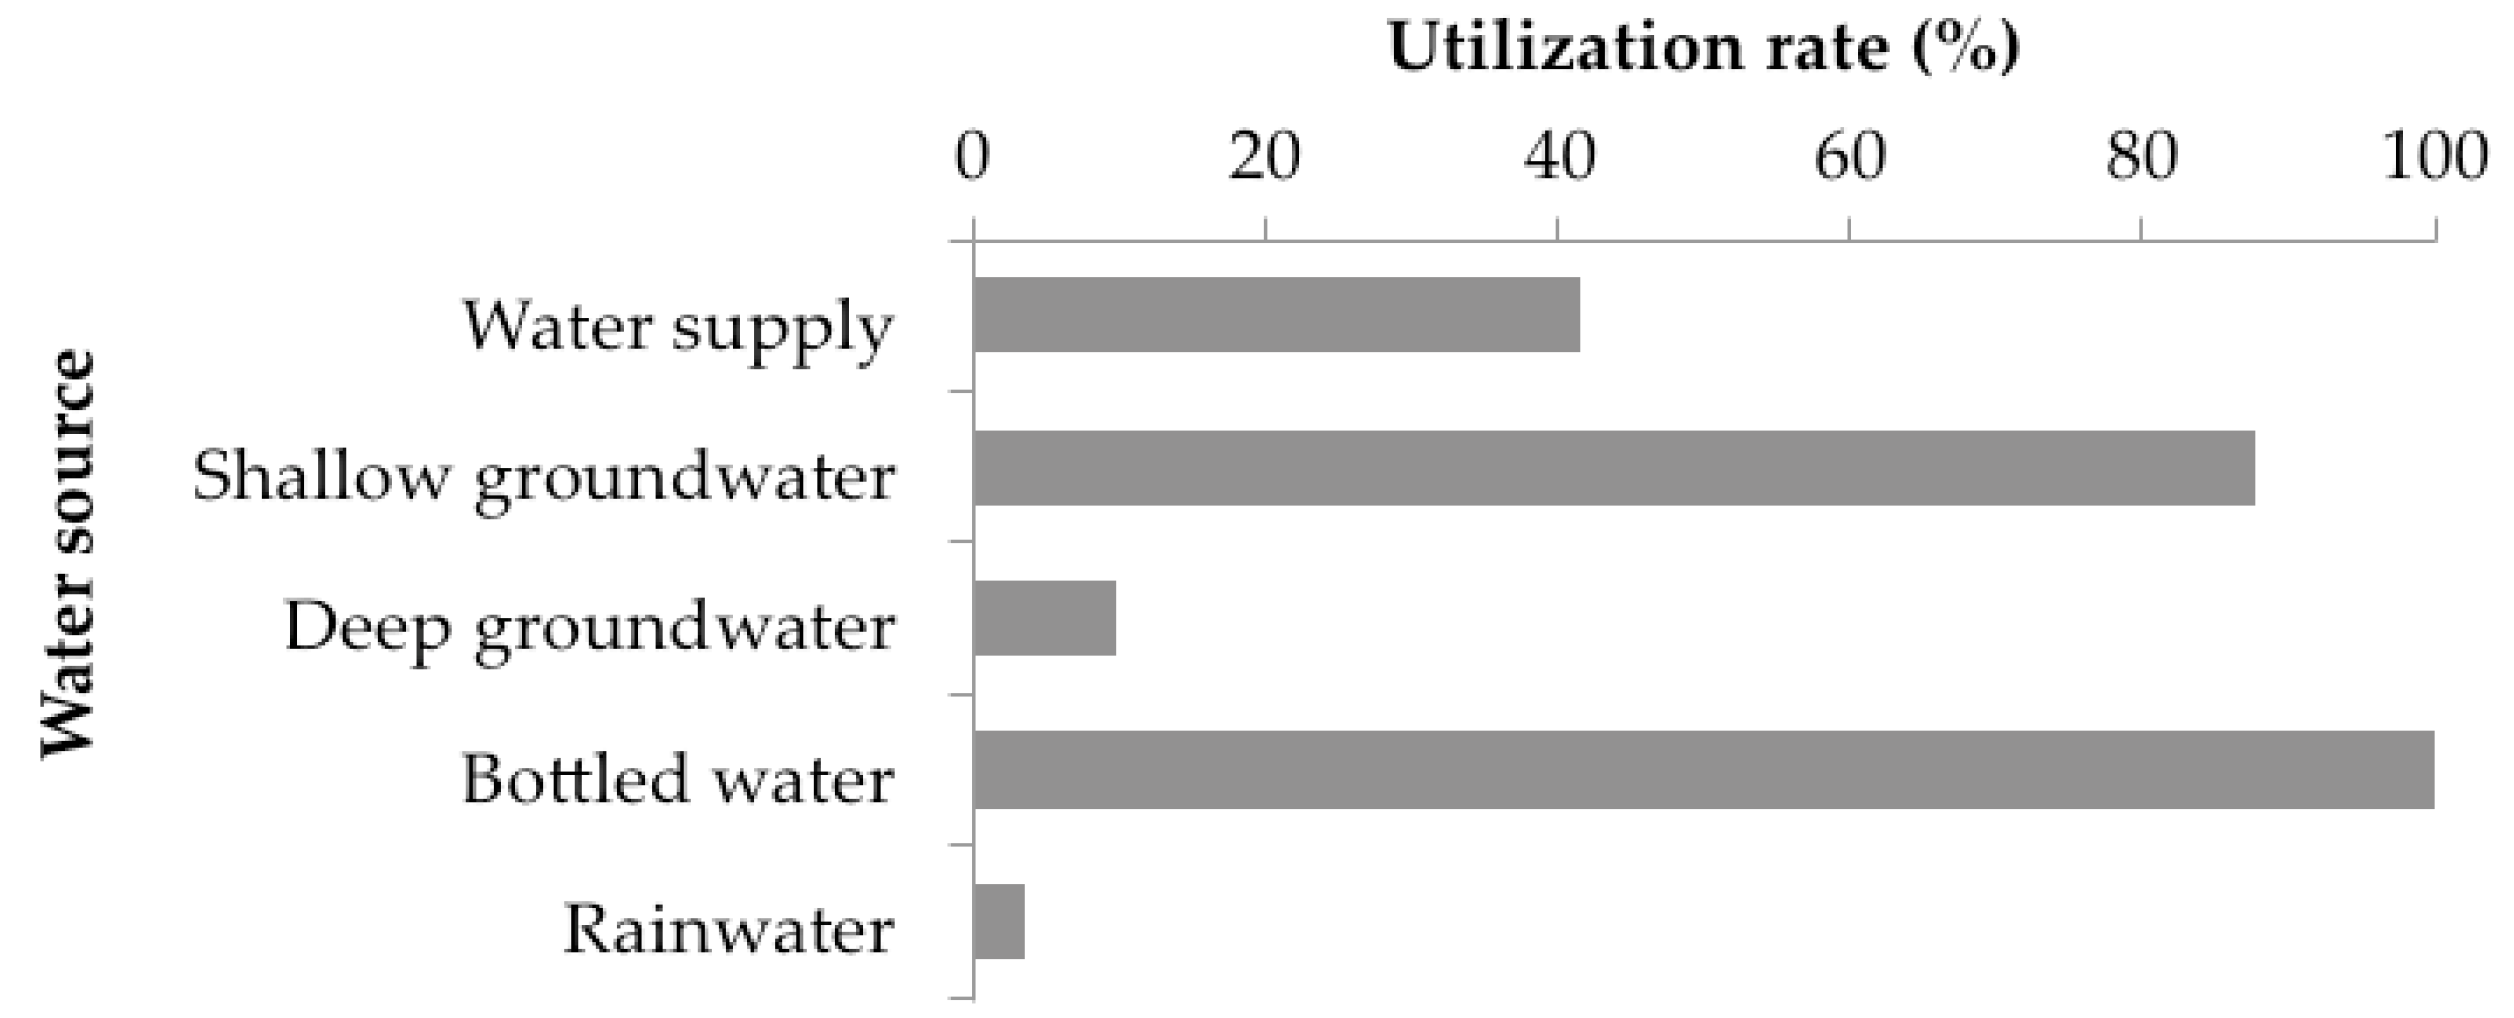
3.1. Water Consumption Behavior in the Survey Area

Without reliable access to an adequate and stable supply of water, residents usually have various sources of water to avoid the risk posed by the unavailability of a single source [12]. Suburban Vientiane is no exception. Many sources of water are used: the water supply, groundwater, bottled water, river water, and rainwater. The pattern of water usage differs somewhat among the households. Most households generally used water from two or three sources.
Figure 4 shows the utilization rate of each water source. Bottled water, delivered by a delivery service, was used in all households. The bottled water was processed in a factory from groundwater, and bottles were reused. Overall, 40% of households received water supply services. Rainwater was used by 3.7% of households. Residents also used two geological formations containing water: deep wells and shallow wells. Lao people distinguish deep from shallow wells by using different words. Deep groundwater is clear, cool, and stable but contains a bit of salt. It is drawn from a confined aquifer thirty to fifty meters below the surface through a thin pipe. It was used by about 10% of households. On the other hand, the shallow wells are not stable in the dry season and are sometimes turbid. Shallow groundwater is drawn from an unconfined aquifer less than 10 m below the surface through a concrete pipe about one meter in diameter. In most households, an electric pump is used to bring water from both aquifers, although one household using a shallow well did not have a pump. Shallow wells were used by about 88% of households. Rainwater was used in only three households, although much precipitation occurs in the rainy season, and water shortages sometimes occur in the dry season.
Our results confirmed the findings reported by Madanat and Humplick [12]; both showed that the residents diversified their sources of water to ensure that their needs were met when the quality, pressure, and availability of a water supply were insufficient.
Residents used each water source for a particular purpose, as shown in Table 2. All households used bottled water for drinking, but while 66% of households used bottled water for cooking, 20% of households used bottled and a water supply or groundwater, and 14% of households did not use bottled water for cooking.

3.2. Natural and Physical Capital and Connection to the Water Supply

First, we hypothesized that both natural and physical capital delay the connection to a water supply. Greater natural and physical capital would mean that a household would be likely to have a high quality well and pump (instrument). Results of the survey indicated that 41% of households had a connection to the water supply, whereas 59% of households did not. Figure 5 presents the spatial distribution of households without a connection to the water supply as well as the reason that there was no connection. There was a tendency for households that cited a particular reason for a lack of connection to be concentrated in the same place. For example, residents giving the rationale that household members were “satisfied with a private well” were concentrated in the blue circle in Figure 5. We asked them about their satisfaction with the quality of groundwater. The results revealed that residents living in this area were subjectively satisfied with the groundwater, meaning that they were both satisfied with the quality of the groundwater itself (natural capital) and had a facility for pumping it (physical capital). Therefore, we speculated that greater natural and physical capital deprived a household of motivation to connect to the water supply.
This action can be explained by the sustainable livelihood framework, in which each form of capital can substitute for other forms [25]. The water supply is categorized as physical capital, the groundwater resource itself is categorized as natural capital, and the facility for pumping it is categorized as physical capital. Water supply works serve as a substitution for groundwater usage, so if residents have a rich groundwater source, they need not connect to the water supply.

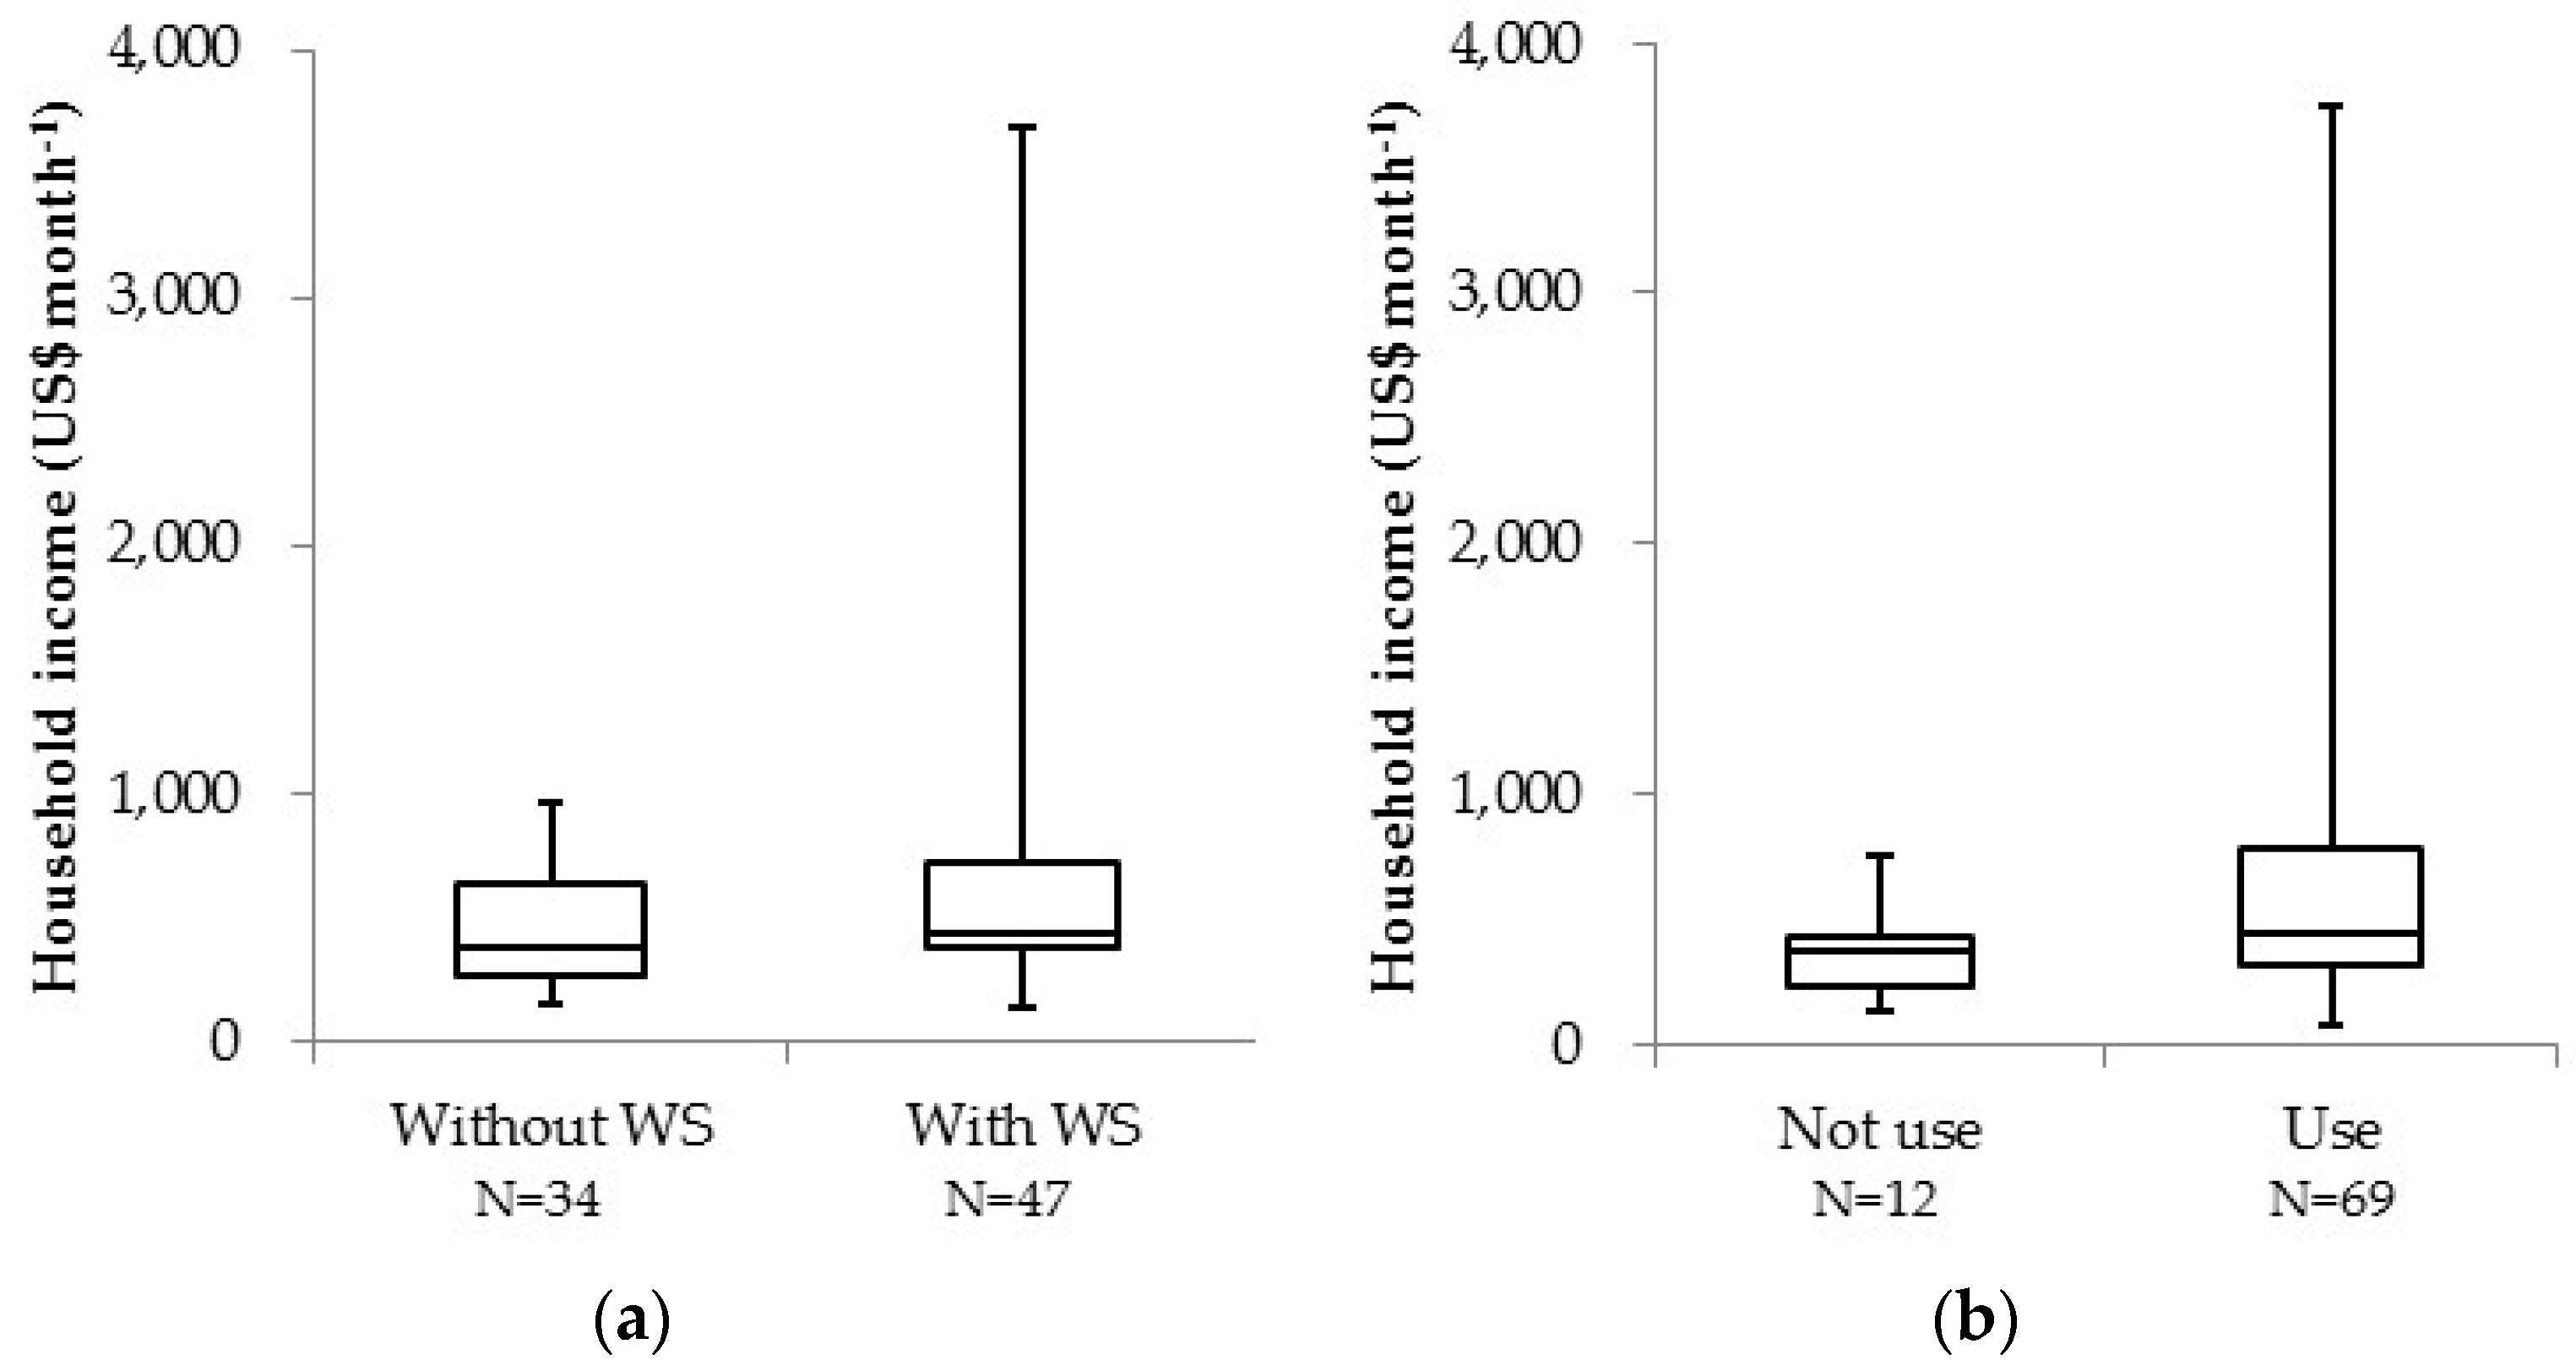
3.3. Financial Capital and Connection to the Water Supply

We hypothesized that rich financial capital encourages a connection to the water supply due to the cost of this connection. To estimate financial capital, we asked questions in the survey regarding economic status.
The association of household income with a connection to the water supply was assessed. Two clusters of household income are shown in Figure 6a; one cluster is the income distribution of households who have a supply of water, the other is the income distribution of households who do not. We applied the Mann–Whitney U-test [37], which is a non-parametric test that can be used effectively for small samples [38], to determine the significance of the difference between the two clusters’ mean household incomes. Results of the U-test showed no significant difference between the two clusters, indicating that a connection to the water supply was not related to household income. This was interpreted as indicating that residents did not necessarily install the water supply, even if it provided an adequate quantity of water and they could afford it. On the other hand, quality of water was compared to the income of households using or not using bottled water for cooking; the distribution is shown in Figure 6b. Here, there was a significant difference between the two clusters.
As discussed in Section 3.2, the water supply serves to replace groundwater usage; residents regarded the quality of the water supply as subpar or not significantly different from that of groundwater, whereas they considered bottled water to be of high quality. These relationships, shown in Figure 6, suggest that residents with high financial capital invest in water quality rather than quantity. This result is consistent with Mu et al. [39], whose research indicated that households’ source-choice decisions were not influenced by household income. The preference for quality over quantity is also present with respect to food. According to Behrman and Deolalikar [40], an increase in income does not result in a substantial improvement in nutrient intake. Subramanian and Deaton [41] indicated that a 10% increase in food expenditure is associated with a 5% increase in calorie consumption and a 5% increase in the price paid per calorie in Maharashtra state in western India. We found a similar pattern with respect to water usage.
One can easily imagine that financial capital is closely related to access to water and that lack of access to water interferes with time for education or other activities [42], which then escalates the economic divide. However, this study found that high income did not necessarily mean connecting to the water supply but had, rather, an impact on the quality of water used. Of course, there were some households who gave an economic reason for their lack of connection to the water supply; this did not mean, however, that the cost of connection to the water supply was impossibly high, but that the cost was higher than the residents' willingness to pay. It was thought that a willingness to pay was affected by various factors, such as the accessibility of natural resources.

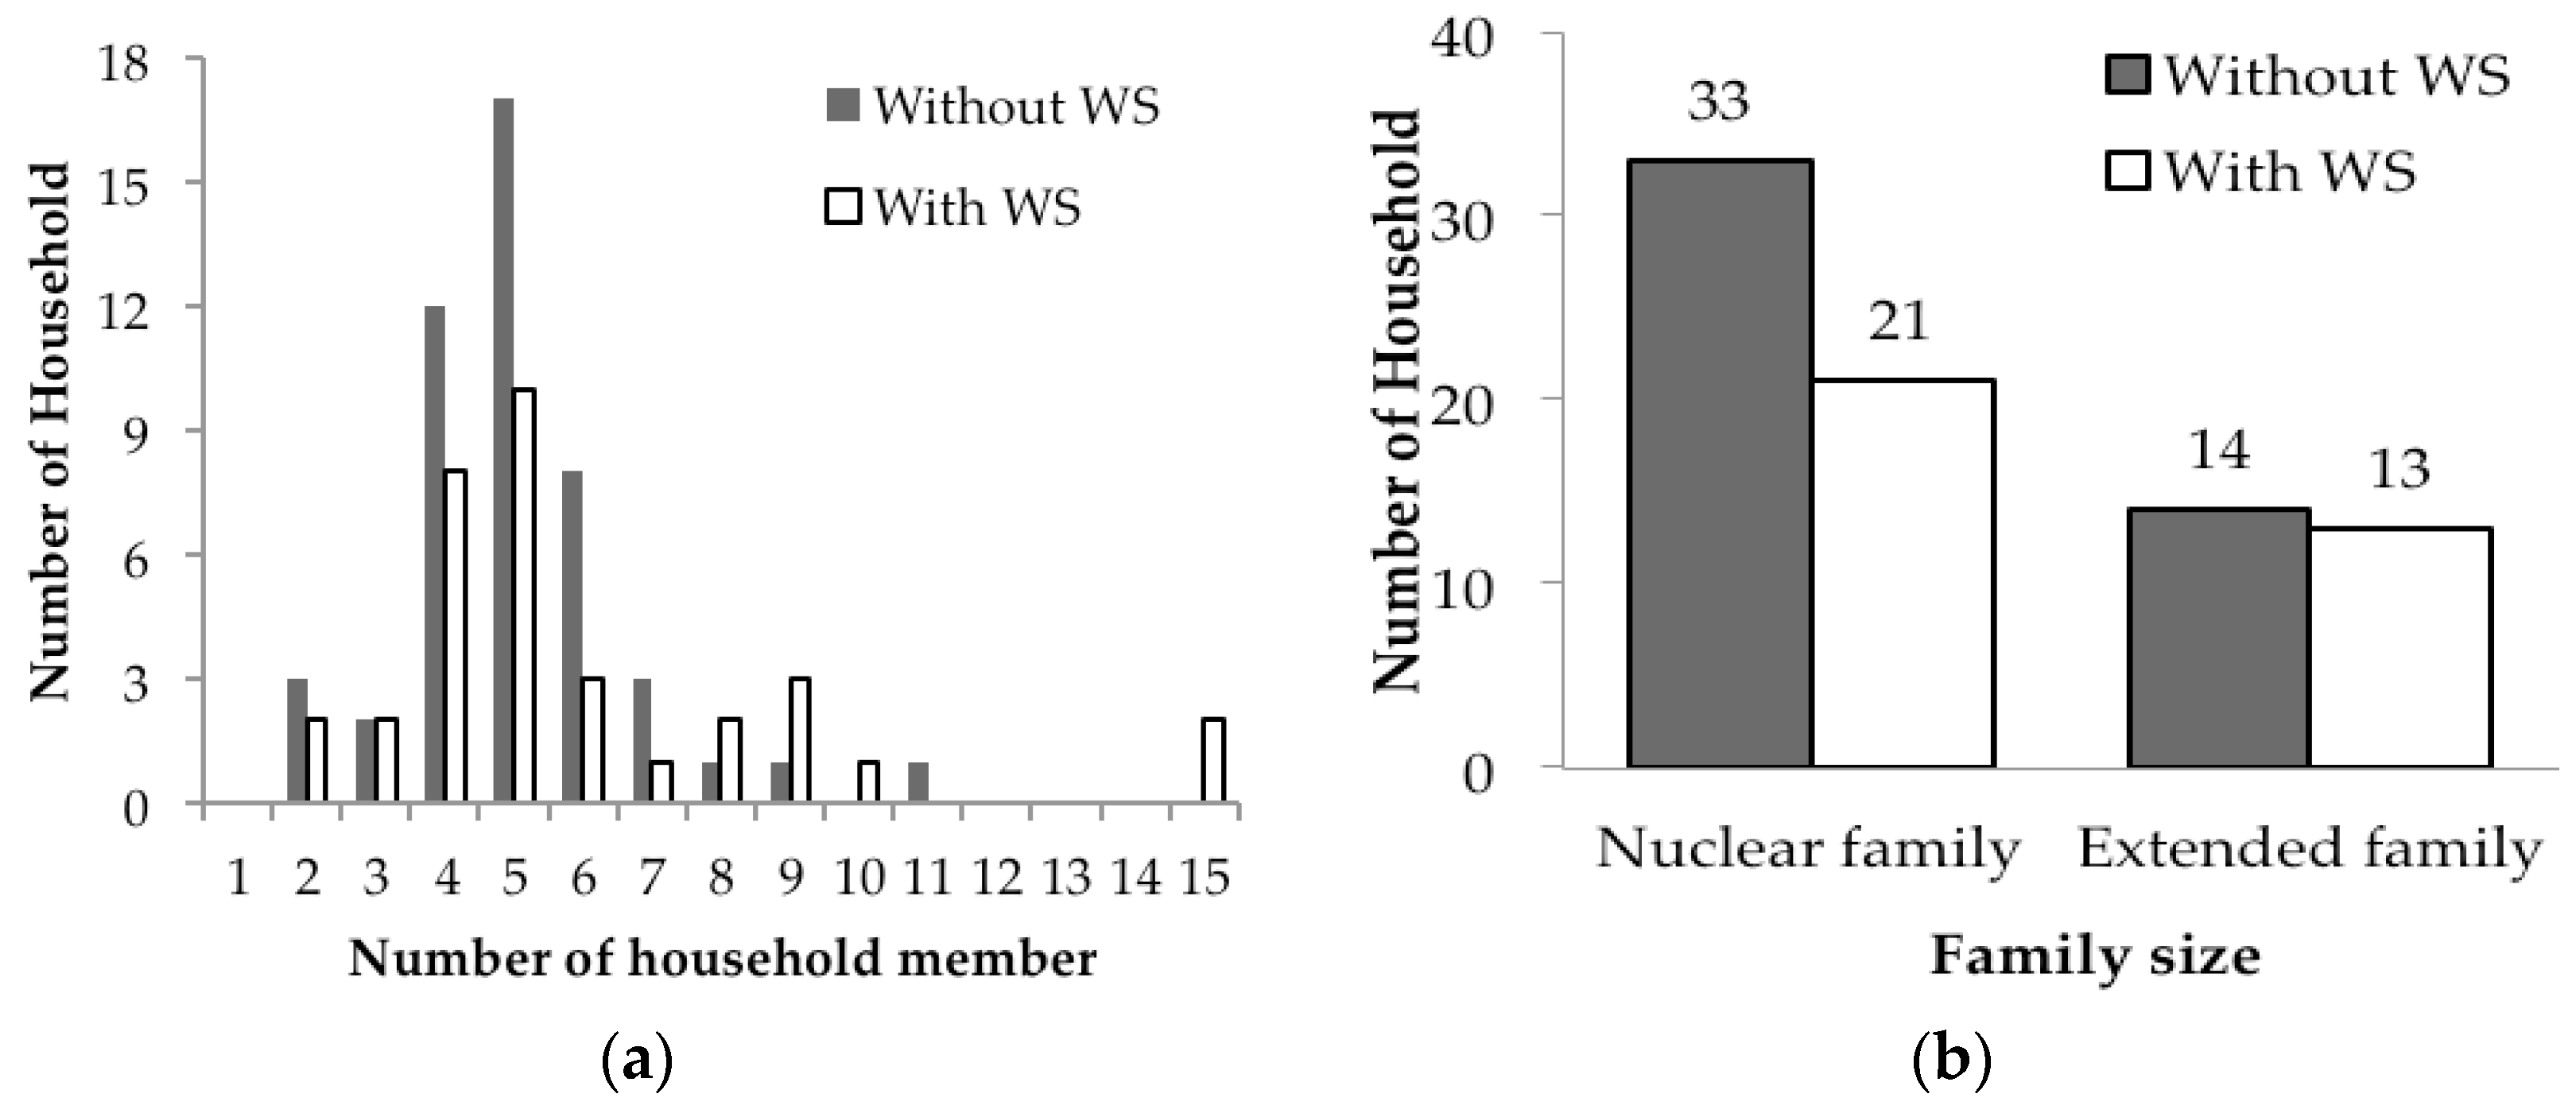
3.4. Human Capital and Connection to the Water Supply

Human capital for a household has two dimensions; the quality of human capital, e.g., education level and health [25]. The second is the quantity of human capital, i.e., the number of household members. It is well known that a better understanding of the risks of using insalubrious water has an important effect on the activity of choosing cleaner water. Therefore, human capital in the form of education about water sanitation is necessary for this understanding [43].
In terms of the former, namely the quality of human capital, we observed a few households using rainwater. These households’ heads had a high academic background. This result indicates that higher education enabled them to act against local conventions, which stated that rainwater is not pure. On the other hand, rainwater is commonly used domestically in northeast Thailand, where the culture is said to be similar to that in Lao PDR [44].
As for the latter variable, namely the quantity of human capital, according to Figure 7a, households with a large number of members tended to connect to the water supply. Welch’s t-test, performed to examine this tendency, showed that it was significant (p = 0.07). Subsequently, we separated the households into two categories: nuclear family and extended family. The definition of a nuclear family was a household composed of one or two generations, for example, parents and their children; an extended family was defined as a household composed of three or more generations. Figure 7b shows the results. Extended families were more likely to connect to the water supply compared to nuclear families.
The reason for this tendency was the limited amount of water that could be obtained from one well in the dry season. Because larger families needed more water, they tended to connect to the water supply.

3.5. Social Capital and Connection to the Water Supply

Social capital has three components: network structure, trust and reciprocity, and resources [35]. We hypothesized that the availability of information as a result of the network structure would be a limitation to connection to the water supply. One survey item asked about the source of information on the water supply and found that 70% of households received information from village officers, 19% received it from neighbors, and the others did not remember the source of information. We found no significant relationship between the source of information and connection to the water supply. This indicated that officers play a role in transmitting information about public services in the area. This is likely because Lao PDR is a socialist country, so governmental organizations are dominant in any situation.
The survey did not reveal any discrimination against or exclusion of poor people among the sample households belonging to various income classes, though it should be noted that we could not access the “real” poor population due to the sampling method. Through the interviews, we found a case of cooperation among residents. One household that had only a shallow well that dried up during the dry season was allowed to use a neighbor’s deep well, which did not dry up. In another case, a small group of four households cooperated with each other to connect to the water supply, and asked the officer to extend the water pipe to their living area. These cases imply that trust and reciprocity, which form one component of social capital, affected water consumption behavior in the survey area; however, this was not proven quantitatively.

4. Conclusions

This study focused on water consumption behavior in an urbanizing area where a water supply is being constructed. A questionnaire survey was conducted to elucidate the behaviors of residents and the reasoning behind those behaviors. We recruited 82 respondents in the two villages chosen as the survey area.
Results revealed that richer natural and physical capital delayed connections to the water supply, and greater financial capital stimulated the purchase of high-quality water rather than simply a connection to the water supply. In terms of human capital, there was a greater tendency for bigger families to connect to the water supply when compared to nuclear families. Social capital seemed to play a role in helping households cooperate with each other and to work well together in the survey area. As stated above, this study confirmed that a variety of factors involved in each form of capital affected residents’ thought processes regarding water consumption behaviors.
Access to water resources has been a vital condition for making a living or developing a community since the pre-industrial era. Whether residents can access a natural resource such as groundwater remains important, especially in less-developed countries like Lao PDR. Nevertheless, as both water and electrical infrastructures become more widespread, the importance of access to a water resource has been reduced to the choice of housing location.
As explained in the first chapter, in urban areas of developing countries, insufficient water supply infrastructure is a serious problem. Although the present condition in Vientiane is not serious so far, in the near future, rapid economic growth is likely to accelerate urbanization. The survey area has witnessed recent population growth, and residential land use has expanded. This causes deterioration in the quality of natural resources and reduction in per capita natural resources. Population and economic growth will cause increases in residential water usage and human sewage, which could lead to groundwater contamination, thereby suggesting the necessity of a sewage system. Since residents do not usually acknowledge this problem, it is necessary to construct water infrastructure to fulfill these concealed demands. The difficulty posed by this problem arises from the gap between the demands of residents and the solutions available to address them.

Acknowledgments

This research was supported by the Japan Society for the Promotion of Science KAKENHI, Grant-in-Aid for Scientific Research (16H06291), Green Network of Excellence-environmental information funded by the Ministry of Education, Culture, Sports, Science and Technology, Japan, and the Environment Research and Technology Development Fund (1E-1104) of the Ministry of the Environment, Japan. This work was also supported by the Research Grant Project from Mitsui & Co., Ltd. Environment Fund named ”Sustainability and Well-Being—Four Concepts of Capitals and their Limitation”.

Author Contributions

Tatsuya Makino conceived the research and conducted the analysis of data; Tatsuya Makino, Keigo Noda, Hiromasa Hamada and Kazuo Oki conducted the questionnaire survey in Lao PDR.; Keigo Noda, Kazuo Oki and Taikan Oki supervised the research; Keoduangchai Keokhamphui and Hiromasa Hamada arranged and supported our questionnaire survey in Lao PDR. All authors discussed and interpreted the results of analyses; Tatsuya Makino wrote the paper with contributions from all authors.

Conflicts of Interest

The authors declare no conflict of interest.

Abbreviations

The following abbreviations are used in this manuscript:
Lao PDRLao People’s Democratic Republic
MDGsMillennium Development Goals
UNUnited Nations
SDGsSustainable Development Goals
JICAJapanese International Cooperation Agency
WSWater Supply
WHOWorld Health Organization
UNICEFUnited Nation’s Children’s Fund

References

  1. United Nations World Water Assessment Programme. The United Nations World Water Development Report 2015: Water for a Sustainable World; UNESCO: Paris, France, 2015; p. 2. [Google Scholar]
  2. White, G.F.; Bradley, D.J.; White, A.U. Drawers of Water: Domestic water use in east Africa. Bull. World Health Organ. 2002, 80, 63–73. [Google Scholar] [PubMed]
  3. Esrey, S.A.; Potash, J.B.; Roberts, L.; Shiff, C. Effects of improved water supply and sanitation on ascariasis, diarrhea, dracunculiasis, hookworm infection, schistosomiasis, and trachoma. Bull. World Health Organ. 1991, 69, 609–621. [Google Scholar] [PubMed]
  4. Gleick, P.H. Basic water requirements for human activities: Meeting basic needs. Water Int. 1996, 21, 83–92. [Google Scholar] [CrossRef]
  5. United Nations. The Millennium Development Goals Report 2014; United Nations: New York, NY, USA, 2014; pp. 43–45. [Google Scholar]
  6. WHO; UNICEF. Meeting the MDG Drinking-Water and Sanitation Target: The Urban and Rural Challenge of the Decade; UNICEF: New York, NY, USA, 2006; p. 8. [Google Scholar]
  7. United Nations. Report of the Open Working Group of the General Assembly on Sustainable Development Goals; United Nations: New York, NY, USA, 2014; p. 14. Available online: http://unidocs.org/A/68/970 (accessed on 19 February 2016).
  8. Otaki, Y.; Otaki, M.; Aramaki, T.; Sakura, O. Residential water demand analysis by household activities. In Proceedings of the 2nd International Conference on Efficient Use and Management of Urban Water Supply-Efficient, Tenerife, Spain, 2–4 April 2003; Available online: http://paginas.fe.up.pt/~mjneves/publicacoes_files/data/es/ponencias/por_autor/pdf/10053.pdf (accessed on 4 June 2016).
  9. United Nations Department of Economic and Social Affairs. World Urbanization Prospects: The 2014 Revision; United Nations: New York, NY, USA, 2014; p. 11. [Google Scholar]
  10. Cohen, B. Urban Growth in Developing Countries: A Review of Current Trends and a Caution Regarding Existing Forecasts. World Dev. 2004, 32, 23–51. [Google Scholar] [CrossRef]
  11. Montgomery, M.R.; Stren, R.; Cohen, B.; Reed, H.E. Cities Transformed: Demographic Change and Its Implications in the Developing World; National Academies Press: Washington, DC, USA, 2003; pp. 4–16. [Google Scholar]
  12. Madanat, S.; Humplick, F. A model of household choice of water supply systems in developing countries. Water Resour. Res. 1993, 29, 1353–1358. [Google Scholar] [CrossRef]
  13. Smith, L.; Hanson, S. Access to water for the urban poor in Cape Town: Where equity meets cost recovery. Urban Stud. 2003, 40, 1517–1548. [Google Scholar] [CrossRef]
  14. Hadipuro, W. Indonesia’s water supply regulatory framework: Between commercialization and public service? Water Altern. 2010, 3, 475–491. [Google Scholar]
  15. Nickson, R.; McArthur, J.; Burgess, W.; Ahmed, K.M.; Ravenscroft, P.; Rahmann, M. Arsenic poisoning of Bangladesh groundwater. Nature 1998, 395, 338–338. [Google Scholar] [CrossRef] [PubMed]
  16. Chanpiwat, P.; Sthiannopkao, S.; Cho, K.H.; Kim, K.W.; San, V.; Suvanthong, B.; Vongthavady, C. Contamination by arsenic and other trace elements of tube-well water along the Mekong River in Lao PDR. Environ. Pollut. 2011, 159, 567–576. [Google Scholar] [CrossRef] [PubMed]
  17. United Nations. Committee for Development Policy Report on the Seventeenth Session; United Nations Economic and Social Council: New York, NY, USA, 2015; pp. 14–17. Available online: http://www.un.org/en/development/desa/policy/cdp/cdp_ecosoc/E_2015_33_en.pdf (accessed on 4 June 2016).
  18. WHO; UNICEF. Progress on Drinking Water and Sanitation 2014; United Nations: New York, NY, USA, 2014; p. 61. [Google Scholar]
  19. Thammavongsa, S. Vientiane Water Supply System and Development Plans for Improvement. People-Centred Approaches to Water and Environmental Sanitation. In Proceedings of the 30th WEDC International Conference, Vientiane, Lao PDR, 25–29 October 2004; Water, Engineering and Development Centre: Loughborough, UK, 2004; pp. 637–640. Available online: http://wedc.lboro.ac.uk/resources/conference/30/Thammavongsa.pdf (accessed on 4 June 2016). [Google Scholar]
  20. Asian Development Bank. Water in Asian Cities: Utilities Performance and Civil Society Views; Asian Development Bank: Manila, Philippines, 2004; p. 66. [Google Scholar]
  21. Japanese International Cooperation Agency. The Study on Vientiane Water Supply Development Project in Lao People’s Democratic Republic: Final Report Vol. 2.. Main Report: Master Plan; Japan International Cooperation Agency: Nihon Suido Consultants Co.: Tokyo, Japan, 2004; p. 1. Available online: http://open_jicareport.jica.go.jp/618/618/618_112_11751260.html (accessed on 21 February 2016).
  22. Ministry of Health and Lao Statistics Bureau. Lao Social Indicator Survey 2011–12; Ministry of Health and Lao Statistics Bureau: Vientiane, Lao PDR, 2012; pp. 21–27. Available online: https://dhsprogram.com/pubs/pdf/FR268/FR268.pdf (accessed on 21 February 2016).
  23. Schmoll, O.; Howard, G.; Chilton, J.; Chorus, I. (Eds.) Protecting Groundwater for Health: Managing the Quality of Drinking-Water Sources; IWA Publishing: London, UK, 2006; pp. 7–8.
  24. Fengthong, T.; Dethoudom, S.; Keosavanh, O. Drinking Water Quality in the Lao People’s Democratic Republic. In Seminar on the Environmental and Public Health Risks due to Contamination of Soils, Crops, Surface and Groundwater from Urban, Industrial and Natural Sources in Southeast Asia, Hanoi, Vietnam, 10–12 December 2002; Available online: http://publications.iwmi.org/pdf/H033492.pdf (accessed on 4 June 2016).
  25. Ellis, F. Rural Livelihood Diversity in Developing Countries: Evidence and Policy Implications; Overseas Development Institute: London, UK, 1991; pp. 4–51. [Google Scholar]
  26. Solesbury, W. Sustainable Livelihoods: A Case Study of the Evolution of DFID Policy; Overseas Development Institute: London, UK, 2003; pp. 3–13. [Google Scholar]
  27. Nussbaum, M.; Sen, A. The Quality of Life; Clarenton Press: Oxford, UK, 1993; pp. 30–53. [Google Scholar]
  28. Sen, A. Human capital and human capability. World Dev. 1997, 25, 1959–1961. [Google Scholar] [CrossRef]
  29. Chambers, R.; Conway, G. Sustainable Rural Livelihoods: Practical Concepts for the 21st Century; Institute of Development Studies: Brighton, UK, 1992; p. 4. [Google Scholar]
  30. Sullivan, C.A.; Meigh, J.R.; Giacomello, A.M.; Fediw, T.; Lawrence, P.; Samad, M.; Molte, S.; Hutton, C.; Allan, J.A.; Schulze, R.E.; et al. The water poverty index: Development and application at the community scale. In Natural Resources Forum; Blackwell Publishing Ltd.: Oxford, UK, 2008; pp. 189–199. [Google Scholar]
  31. Merrey, D.J.; Drechsel, P.; de Vries, F.P.; Sally, H. Integrating “livelihoods” into integrated water resources management: Taking the integration paradigm to its logical next step for developing countries. Reg. Environ. Chang. 2005, 5, 197–204. [Google Scholar] [CrossRef]
  32. Cohen, A.; Sullivan, C.A. Water and poverty in rural China: Developing an instrument to assess the multiple dimensions of water and poverty. Ecol. Econ. 2010, 69, 999–1009. [Google Scholar] [CrossRef]
  33. Gleick, P.H. The Myth and Reality of Bottled Water. In The Biennial Report on Freshwater Resources: 2004–2005; Island Press: Washington, DC, USA, 2015; pp. 17–43. Available online: http://pacinst.org/wp-content/uploads/2013/04/myth_and_reality.pdf (accessed on 24 April 2016).
  34. Hoque, B.A.; Juncker, T.; Sack, R.B.; Ali, M.; Aziz, K.M. Sustainability of a water, sanitation and hygiene education project in rural Bangladesh: A 5-year follow-up. Bull. World Health Organ. 1996, 74, 431–437. [Google Scholar] [PubMed]
  35. Glanville, J.L.; Bienenstock, E.J. A Typology for Understanding the Connections Among Different Forms of Social Capital. Am. Behav. Sci. 2009, 52, 1507–1530. [Google Scholar] [CrossRef]
  36. Onwuegbuzie, A.J.; Collins, K.M. A typology of mixed methods sampling designs in social science research. Qual. Rep. 2007, 12, 281–316. [Google Scholar]
  37. Mann, H.B.; Whitney, D.R. On a test of whether one of two random variables is stochastically larger than the other. Ann. Math. Stat. 1947, 18, 50–60. [Google Scholar] [CrossRef]
  38. Nachar, N. The Mann-Whitney U: A Test for Assessing Whether Two Independent Samples Come from the Same Distribution. Tutor. Quant. Methods Psychol. 2008, 4, 13–20. [Google Scholar]
  39. Mu, X.; Whittington, D.; Briscoe, J. Modeling village water demand behavior: a discrete choice approach. Water Resour. Res. 1990, 26, 521–529. [Google Scholar] [CrossRef]
  40. Behrman, J.R.; Deolalikar, A.B. Will developing country nutrition improve with income? A case study for rural South India. J. Polit. Econ. 1978. [Google Scholar] [CrossRef]
  41. Subramanian, S.; Deaton, A. The demand for food and calories. J. Polit. Econ. 1996. [Google Scholar] [CrossRef]
  42. WWAP (United Nations World Water Assessment Programme). Poverty and social equity. In The United Nations World Water Development Report 2015: Water for a Sustainable World; United Nations Educational, Scientific and Cultural Organization: Paris, France, 2015; pp. 19–22. [Google Scholar]
  43. Nyong, A.O.; Kanaroglou, P.S. A survey of household domestic water-use patterns in rural semi-arid Nigeria. J. Arid Environ. 2001, 49, 387–400. [Google Scholar] [CrossRef]
  44. Pinfold, J.V.; Horan, N.J.; Wirojanagud, W.; Mara, D. The bacteriological quality of rainjar water in rural northeast Thailand. Water Res. 1993, 27, 297–302. [Google Scholar] [CrossRef]
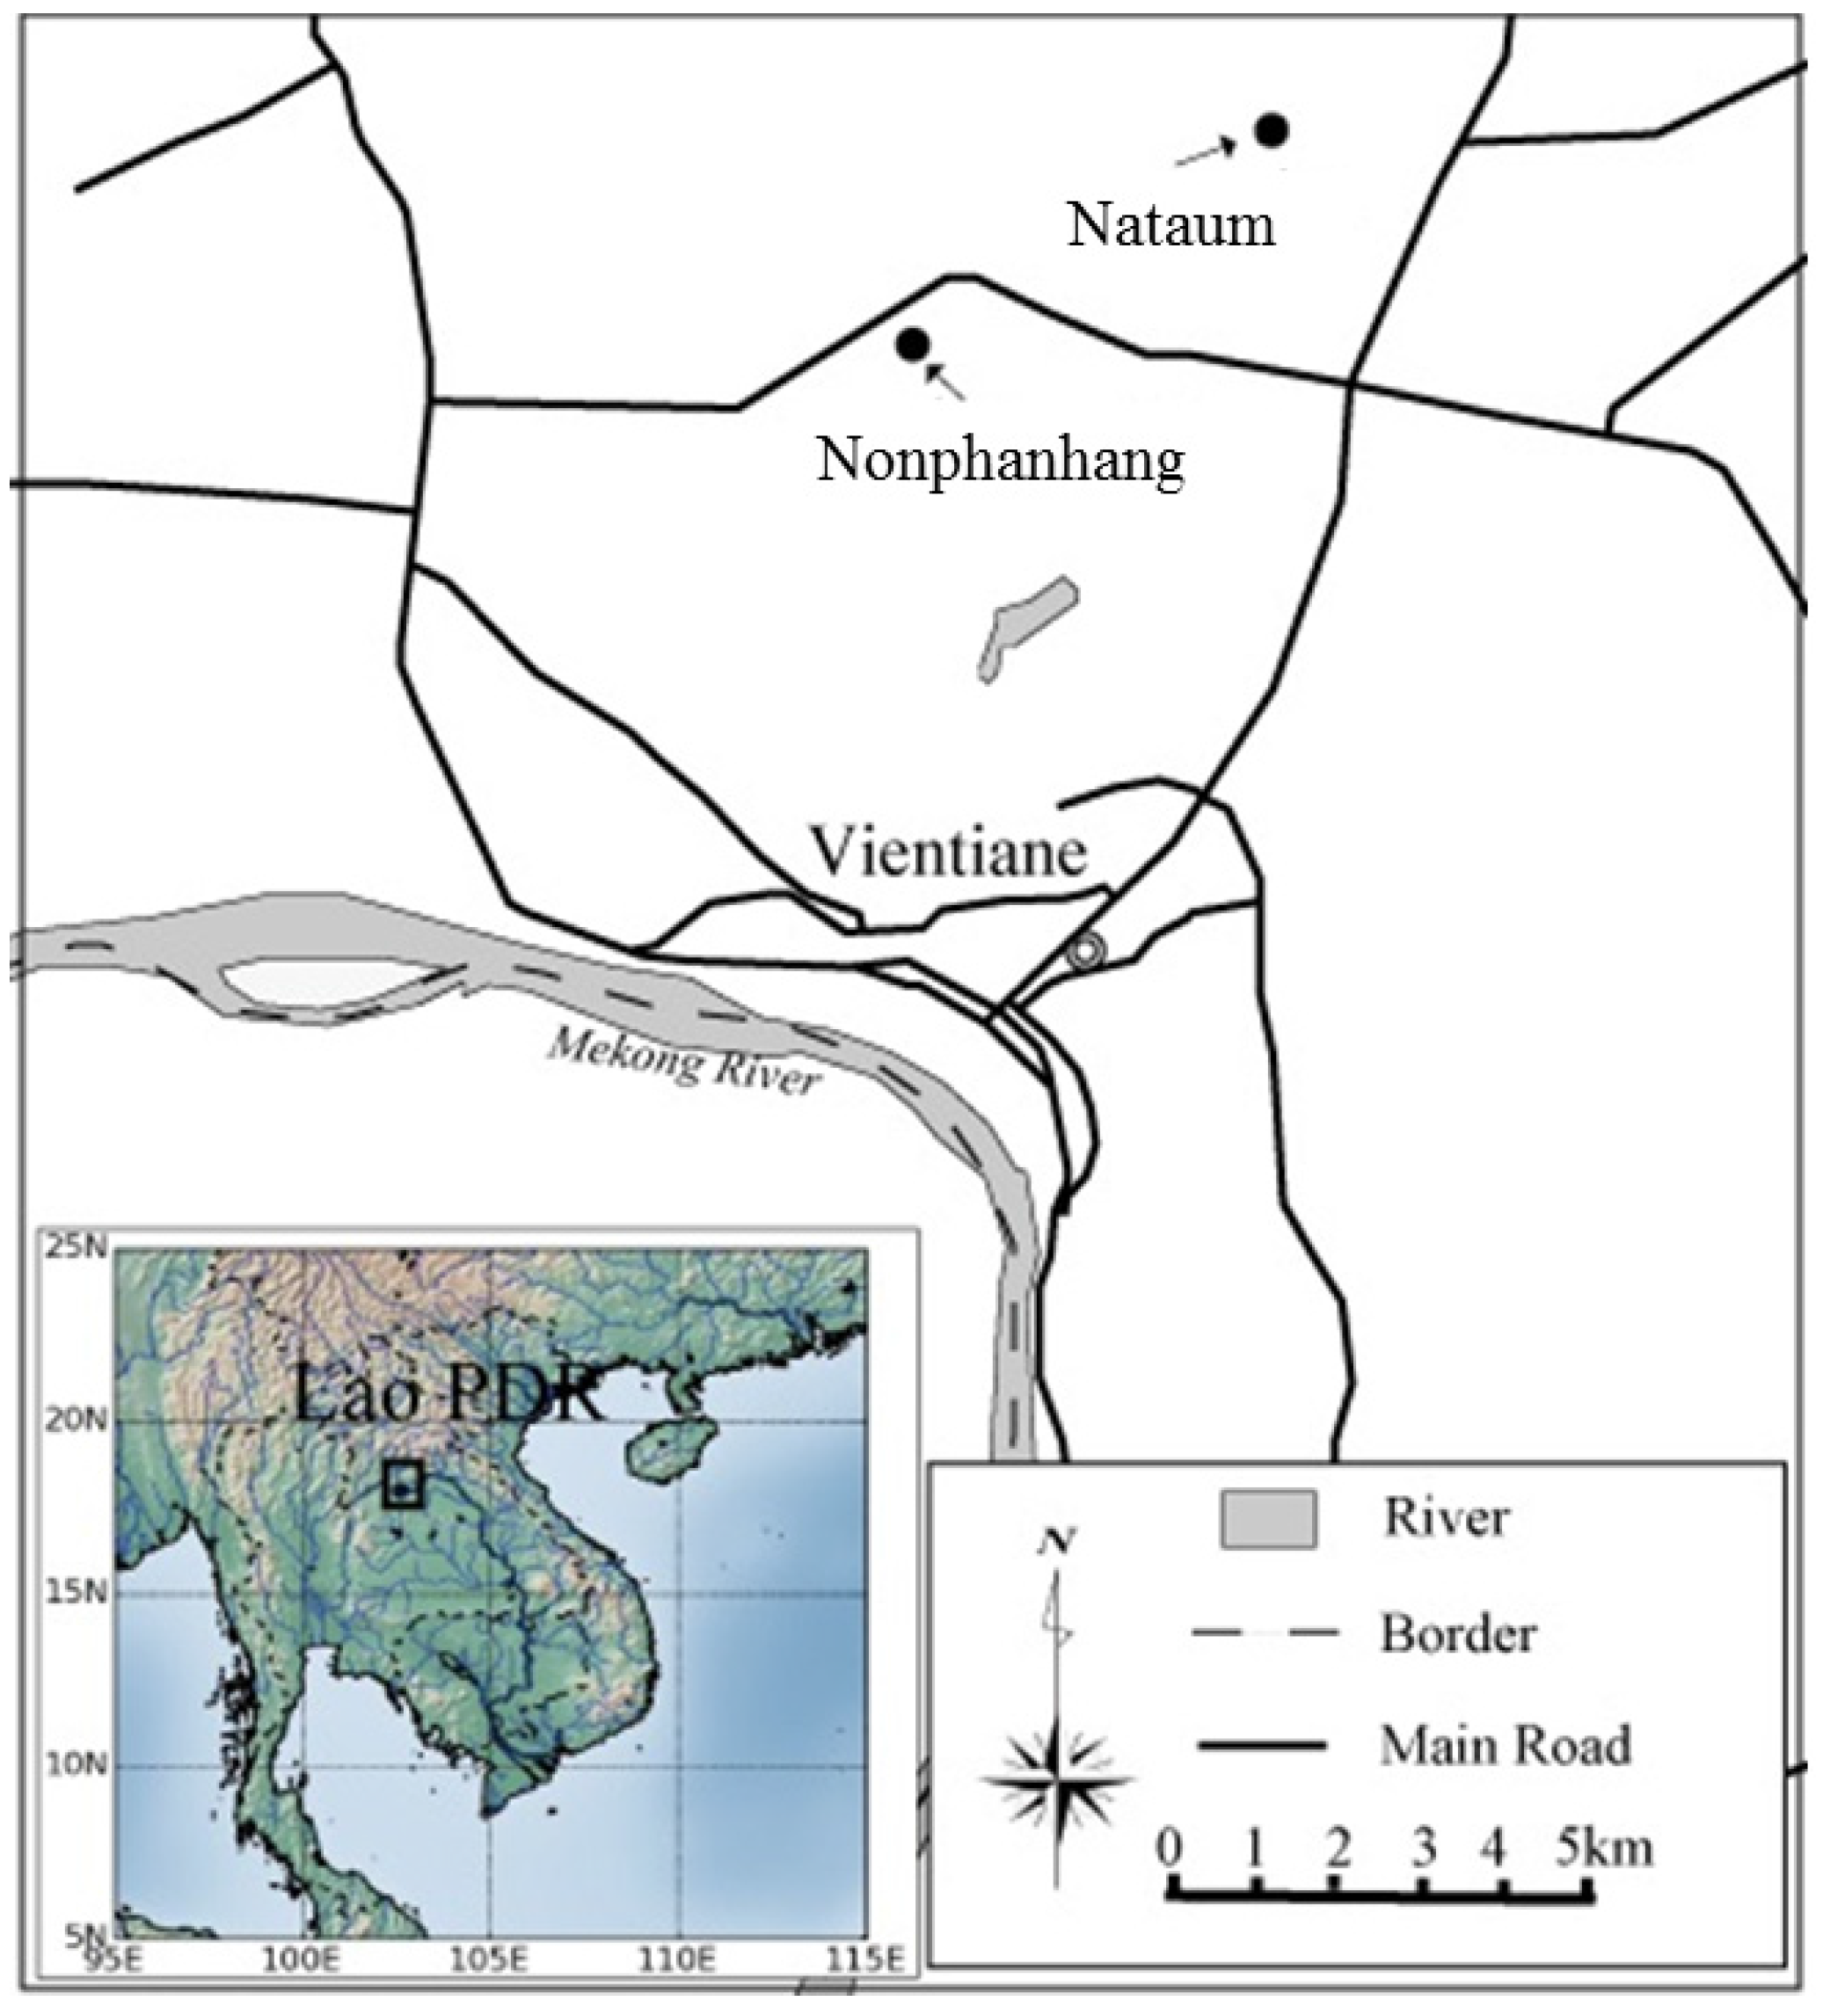
Figure 1. The sustainable livelihood framework [25].
Sustainability 08 00538 g001
Figure 2. Locations of Lao People’s Democratic Republic, Vientiane, and the survey area.
Sustainability 08 00538 g002
Figure 3. Hypotheses about relationships between water use and household capital.
Sustainability 08 00538 g003
Figure 4. Utilization rates of water sources (multiple answers allowed).
Sustainability 08 00538 g004
Figure 5. Reasons for lack of connection to the water supply. The upper right cluster represents households in Nataum village, and the left cluster represents Nonphanhang villange. Nataum village is located on higher ground, compared to Nonphanhang village, but both villages are on the natural levees of old rivers, several meters higher than surrounding unpopulated areas. The circled area on the right is slightly lower than the natural levee and has been urbanized recently.
Sustainability 08 00538 g005
Figure 6. (a) household income and connection to the water supply (WS); (b) household income and usage of bottled water for cooking (Use/Not use). The vertical axis represents household income. The box shows the range from 25% to 75% in the cluster. The bar represents the range from 0% to 100% in the cluster. The right cluster in (a) represents households connected to the water supply, and the left cluster represents households without water supply. The right cluster in (b) represents households using bottled water for cooking, and the lower cluster represents households not using bottled water for cooking. A significant difference was found between the two clusters in (b) (p < 0.01), but not between those in (a).
Sustainability 08 00538 g006
Figure 7. Relationship between water supply (WS) installation and quantity of human capital in each family, according to the number of household members (a) and family size (b).
Sustainability 08 00538 g007
Table 1. Characteristics of target villages.
VillageNataumNonphanhang
Population23237485
Households4851498
Sampled households2161
Table 2. Characteristics of water use in Vientiane.
SourcePurposeCharacteristics
Water supplyCooking, shower, washingUnstable in some location, installation cost
Deep and Shallow groundwaterCooking, shower, washing, gradeningUnable in the end of dry season
Bottled waterDrinking, cookingA bit expensive, clean
RainwaterGardening, drinkingAvailable mainly in rainy season

