Next Article in Journal
Evaluating the Impact of China’s Rail Network Expansions on Local Accessibility: A Market Potential Approach
Previous Article in Journal
Macro Micro Studio: A Prototype Energy Autonomous Laboratory
 
 
Erratum published on 1 September 2016, see Sustainability 2016, 8(9), 880.
Article

Quantitative Study on the Dynamic Mechanism of Smart Low-Carbon City Development in China

1
Institute of Geographic Science and Natural Resources Research, 11A, Datun Road, Chaoyang District, Beijing 100101, China
2
University of Chinese Academy of Sciences, 19 A, Yuquan Road, Shijingshan District, Beijing 100049, China
3
Xinjiang University, 14 Shengli Road, Urumqi 830046, China
*
Author to whom correspondence should be addressed.
Sustainability 2016, 8(6), 507; https://doi.org/10.3390/su8060507
Submission received: 3 March 2016 / Revised: 12 May 2016 / Accepted: 19 May 2016 / Published: 26 May 2016

Abstract

:
With the development of new generation technology and the low-carbon economy, the smart low-carbon city has become one of the academic hotspots. Many studies on it have begun; however, the dynamic mechanism is rarely involved. Therefore, this paper uses the Technique for Order Preference by Similarity to an Ideal Solution (TOPSIS) method to creatively take a quantitative study on a Chinese smart low-carbon city’s dynamic mechanism. The results show that: (1) the three main dynamics of smart low-carbon city development in China are institutional and cultural conditions, facilities and functions conditions and economy and industry conditions, but the overall utility is relatively low; (2) the level of the dynamic operation mechanism of the Chinese smart low-carbon city is distinct between regions, indicating a diminishing spatial law from east to west and differences within regions; (3) the imbalance of the comprehensive dynamic mechanism and the operation status between smart low-carbon cities is prominent, showing a decreasing urban scale law of from big to small and differences within each scale, and a descending administration hierarchy law from high to low and differences within each class; (4) seven basic development patterns can be obtained, and most of the cities belong to the external strong/internal weak mode, which basically matches with its development realities. Finally, general policy recommendations and countermeasures of optimization and improvement are proposed.

1. Introduction

Cities, as places of capital allocation and resource concentration, places and key areas of wealth generation, the interactive nodes of technology application and knowledge aggregation, the centers of cultural innovation, and the leaders of social, political and economic development, have acquired unprecedented development and prosperity with the impetus of the Industrial Revolution and brought the human world into an urban age. Although urban life on Earth has been greatly improved, over-exploitation of energy and resources, massive destruction of natural ecosystems, worsening pollution of various kinds, great environment and climate changes, and a series of “urban diseases” have appeared [1], which have, in many ways, deteriorated the coordinated development of the human-natural system. In order to keep human society on track for a sustainable and healthy development, many countries have started to embrace the concepts of sustainability and low-carbon economy. Meanwhile, the arrival of a new generation of the information technology, featuring the Internet, cloud computing and big data, promotes the interaction between the concept of low-carbon development (involving low energy consumption, high efficiency and low pollution) and the concept of smart development (involving the integration of big data management network platforms and the spatial information operational monitoring model and visualization systems). This not only provides a creative opportunity and effective way for future sustainable urban development, but also makes the smart low-carbon city increasingly the focus of research attention [2,3,4]. To this end, researchers have actively expanded relative theoretical and empirical studies, and obtained a lot of achievements in related concepts and connotations, measurement evaluations, development paths [5,6,7,8,9], etc. However, on the whole, precise studies of smart low-carbon city development are still in their early infancy, far from forming a complete theoretical system. Furthermore, studies concerning the development factors for its occurrence, the dynamic mechanism, the typical patterns and comprehensive measurement evaluation are very few. Hence, it is necessary to further study and explore relevant contents to make up for this deficiency and fill in research gaps. Therefore, in light of the new development trend around the world, the strategic background of China’s harmonious societal construction, as well as the promotion of a new type of urbanization and urban sustainable development, this paper aims to study the development and evolutionary dynamic mechanism of a smart low-carbon city from a quantitative viewpoint to enrich the relevant research field.
According to current research and practice, the development of the smart low-carbon city is propelled both by the pulling force of urbanization and the propulsion force of external elements, as well as the internal changes within its own system. Generally, scholars have studied the dynamics of smart low-carbon city development from three different perspectives:
(1)
From a qualitative perspective, researchers have considered population migration and agglomeration [10], transportation technology developments and improving conditions [11], economic structure changes [12,13], policies of institutional change and innovation [14,15], clusters of industrial technology and business [16,17], spillovers of intellectual capital and technology [18,19], and economic and financial globalization [20] as both traditional and new driving forces of smart low-carbon city development. Meanwhile, some specific factors, such as major projects of urban construction and emergent incidents [21], urban planning and development strategies and demolition [14,22], new district construction and regional integration [23], as well as marketing and brand-building of a city [24,25], also influence the process of smart low-carbon city development.
(2)
From a quantitative perspective, with the introduction of econometrics and systems engineering methods, time-series data and panel data are used by researchers to quantify the comprehensive analysis of the dynamic mechanism of smart low-carbon city development to expand the knowledge of relevant fields. By using vector autoregression (VAR) models [26], spatial lag panel models [27], linear regression models, logistic regression models [28], innovation-driven models, system dynamics models [29], factor-driven models, urban income-expenditure balance models and other quantitative methods, many scholars have evaluated the impact of different kinds of elements on smart low-carbon city development. For example, with the help of regression analysis, Headey [30] has used exploratory factor analysis to study how distinct factors affect economic growth and to what extent they can influence urban development by exploring nine categories including social and economic capacity, financial and private transactions, geographic features, government control scale, government control quality, trade and government consumption, trade fluctuations, resources and policy rationality, price distortion and urban bias. In China, scholars have investigated the quantitative relationship between various kinds of factors and smart low-carbon city development, including urban land and spatial expansion [31], the industrialization level, transport services and infrastructure development, social fixed investment, technology and innovation, ecological carrying capacity and socio-cultural education [32,33], etc.
(3)
From an empirical perspective, researchers have tried to further the research on the dynamic evolution process and mechanisms through case studies. For example, a study on the Brazilian Amazon region by Simmons and others [34] showed that long-lasting intense land conflicts and a lack of secondary and tertiary industry supports cannot establish an effective dynamic mechanism for urban development. A study on major countries and regions in East Asia by McGee [35] found that land reform and technological innovation, utilization of foreign investment, improvement of transportation infrastructure and progressive industrialization can promote urban development. In China, researchers have explored domestic urban development in different regions at distinct scales from different levels and standpoints. For example, some scholars suggested that in the Yangtze River Delta and Pearl River Delta regions, the rapid development of local enterprises, the adequate supply of nonagricultural labor, policies and system innovations, transnational and inter-regional capital investment, industrialization and informatization, and the promotion of modern culture and education were major impetuses for smart low-carbon city development [36,37]. For the city of Beijing, researchers have thought that its dynamic mechanism included not only positive factors of location advantage, natural resource endowment and industrial structure, but also negative ones such as an oversized population, eco-environmental deterioration and policy implementation [38]. For a prefecture-level city such as Yantai, researchers have suggested that a demand system containing economic development and income level, commodity consciousness, education level, geographical environment and macroeconomic policy was the fundamental driving force of urban development [39].
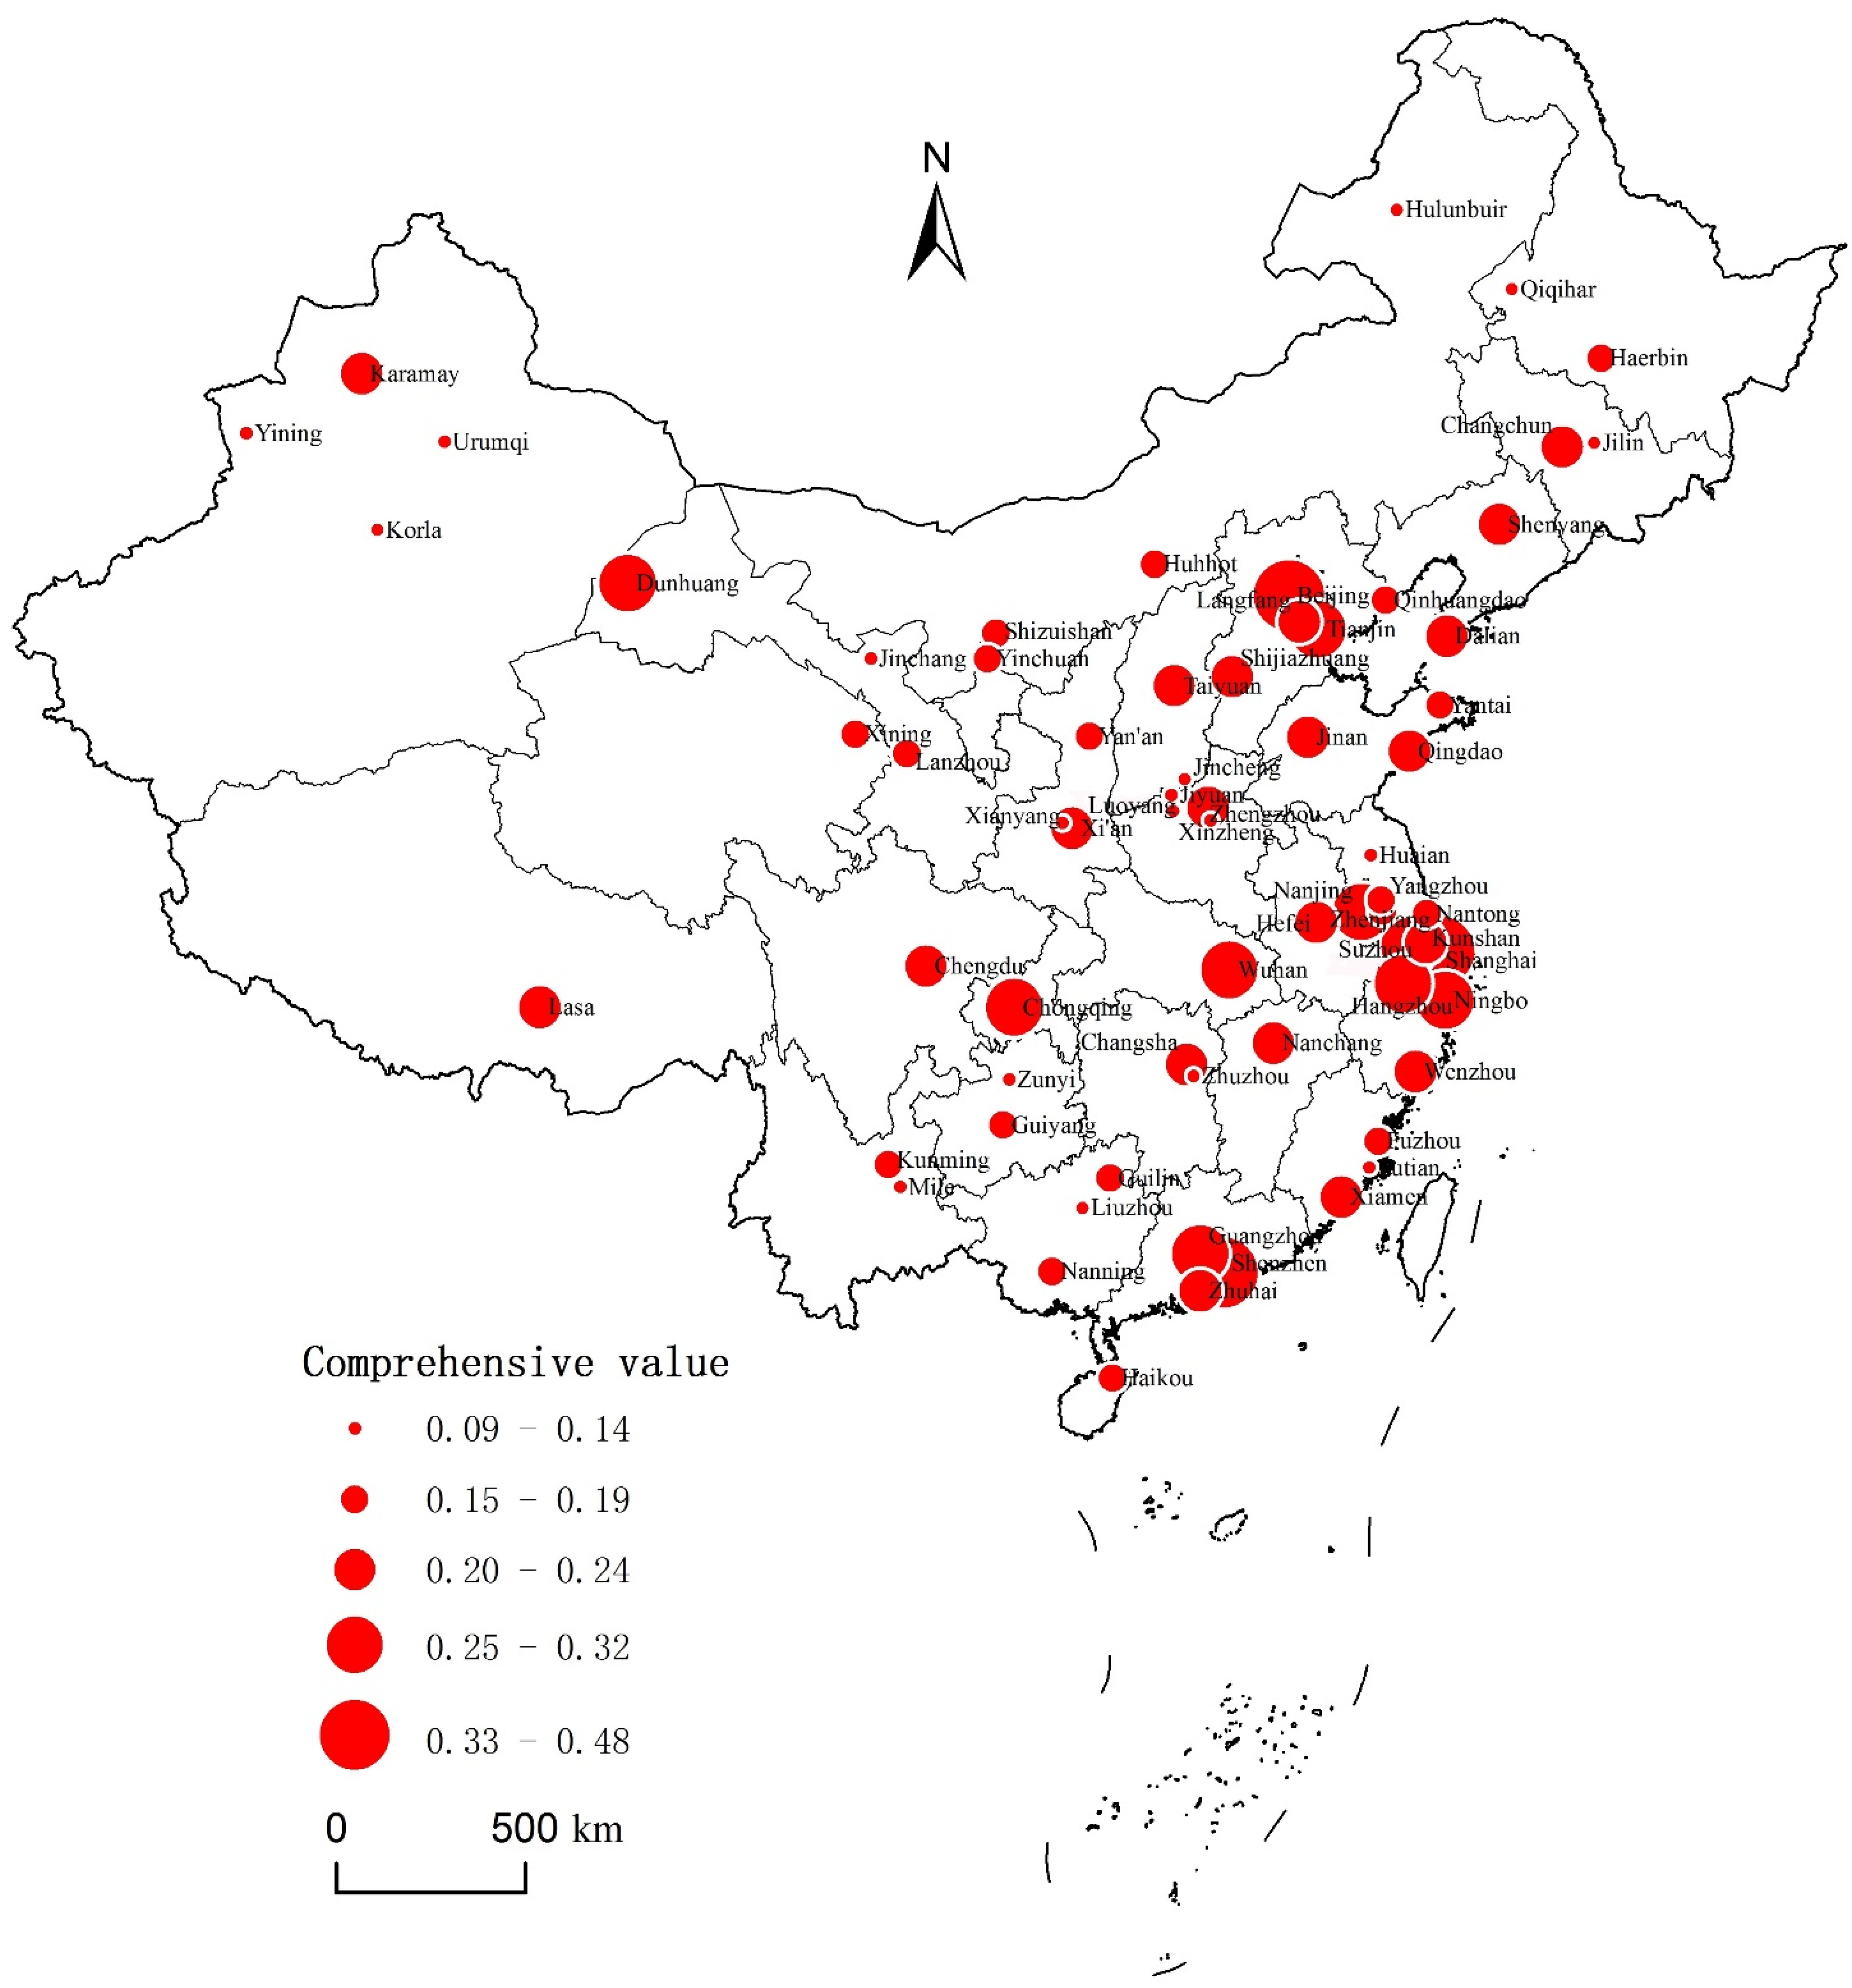
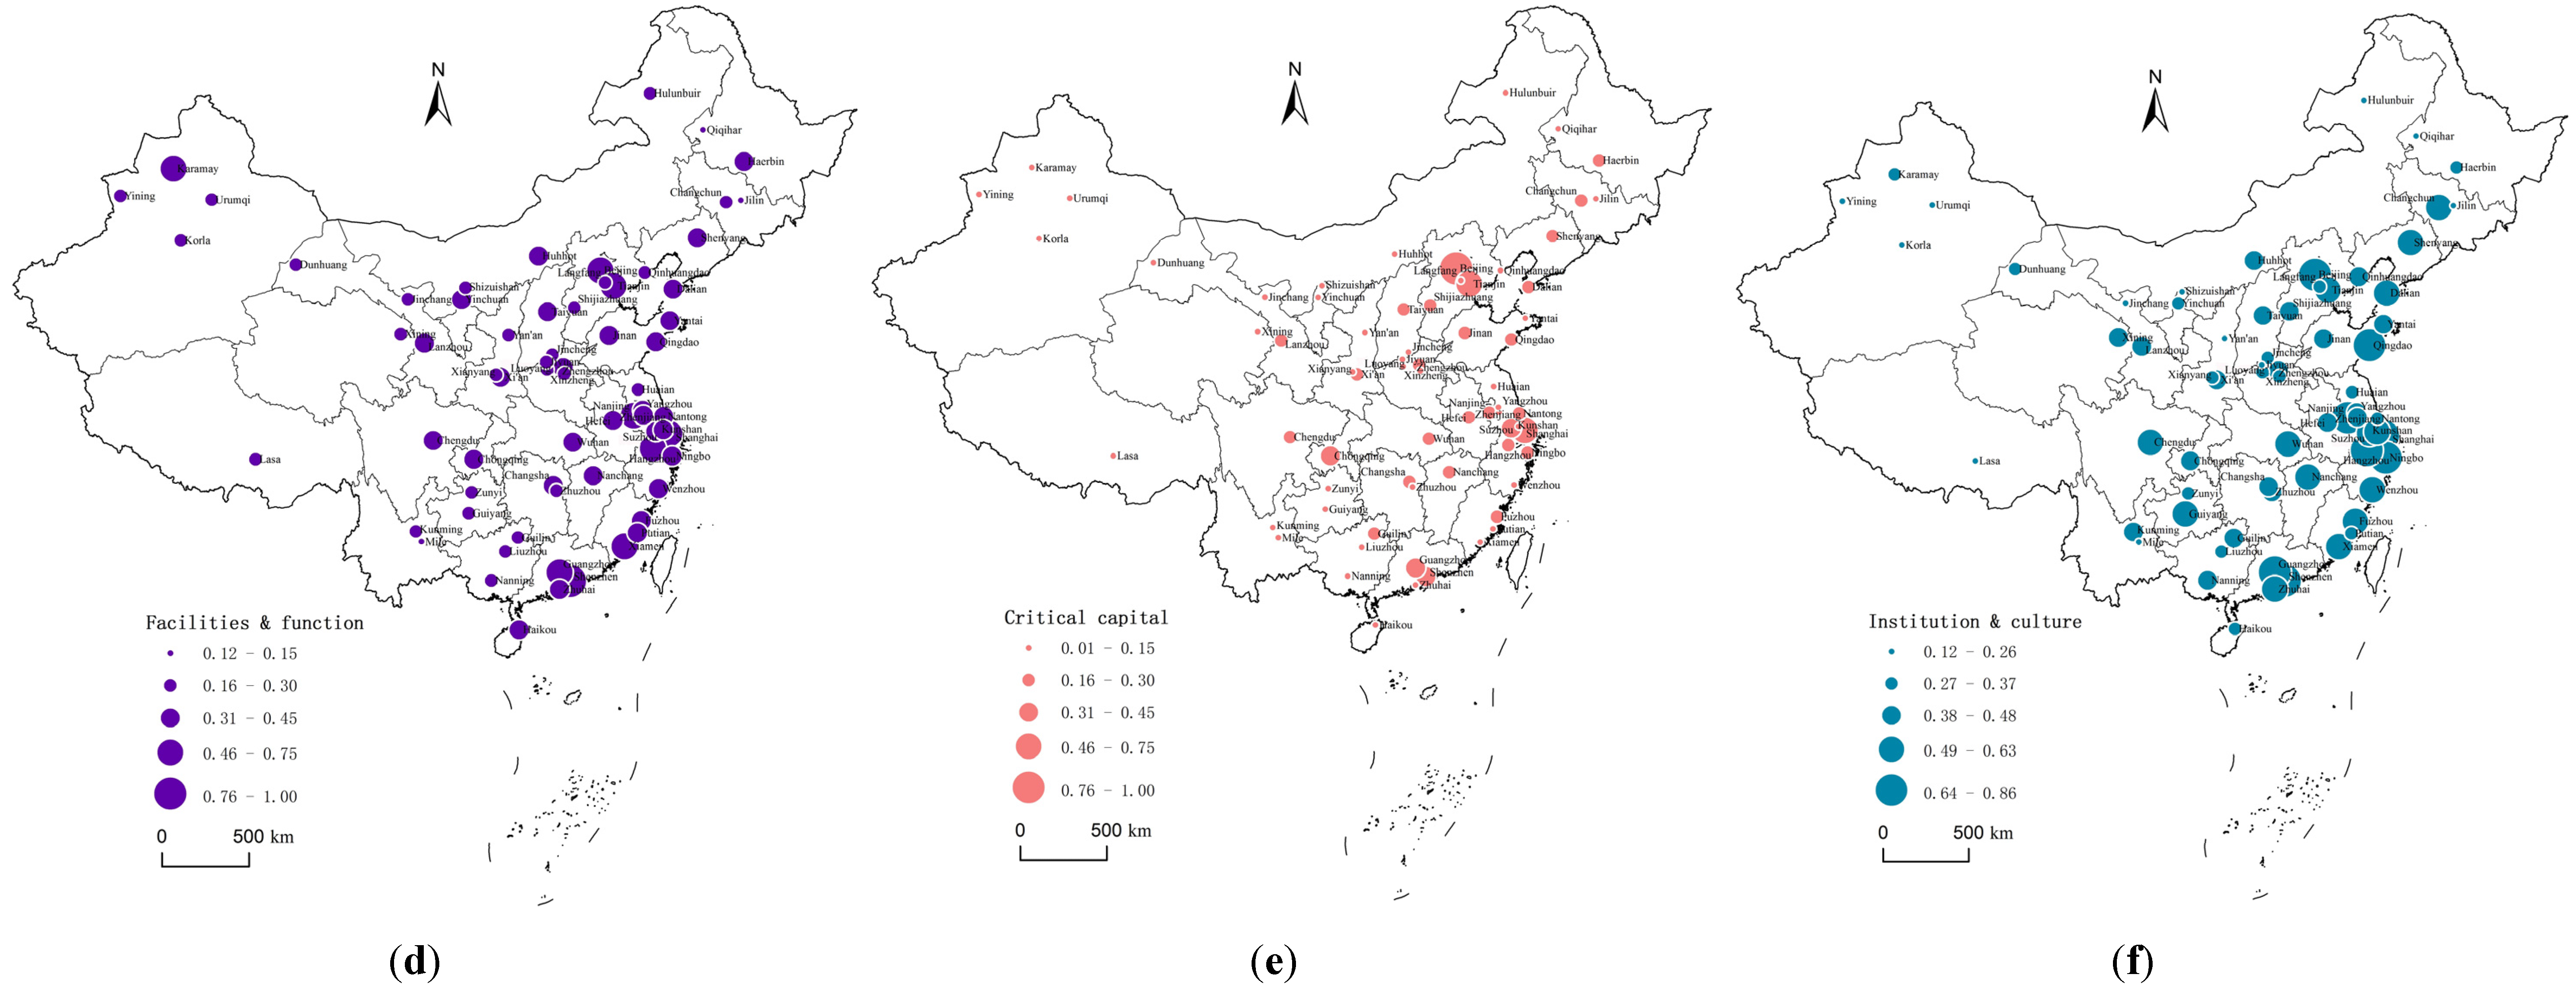
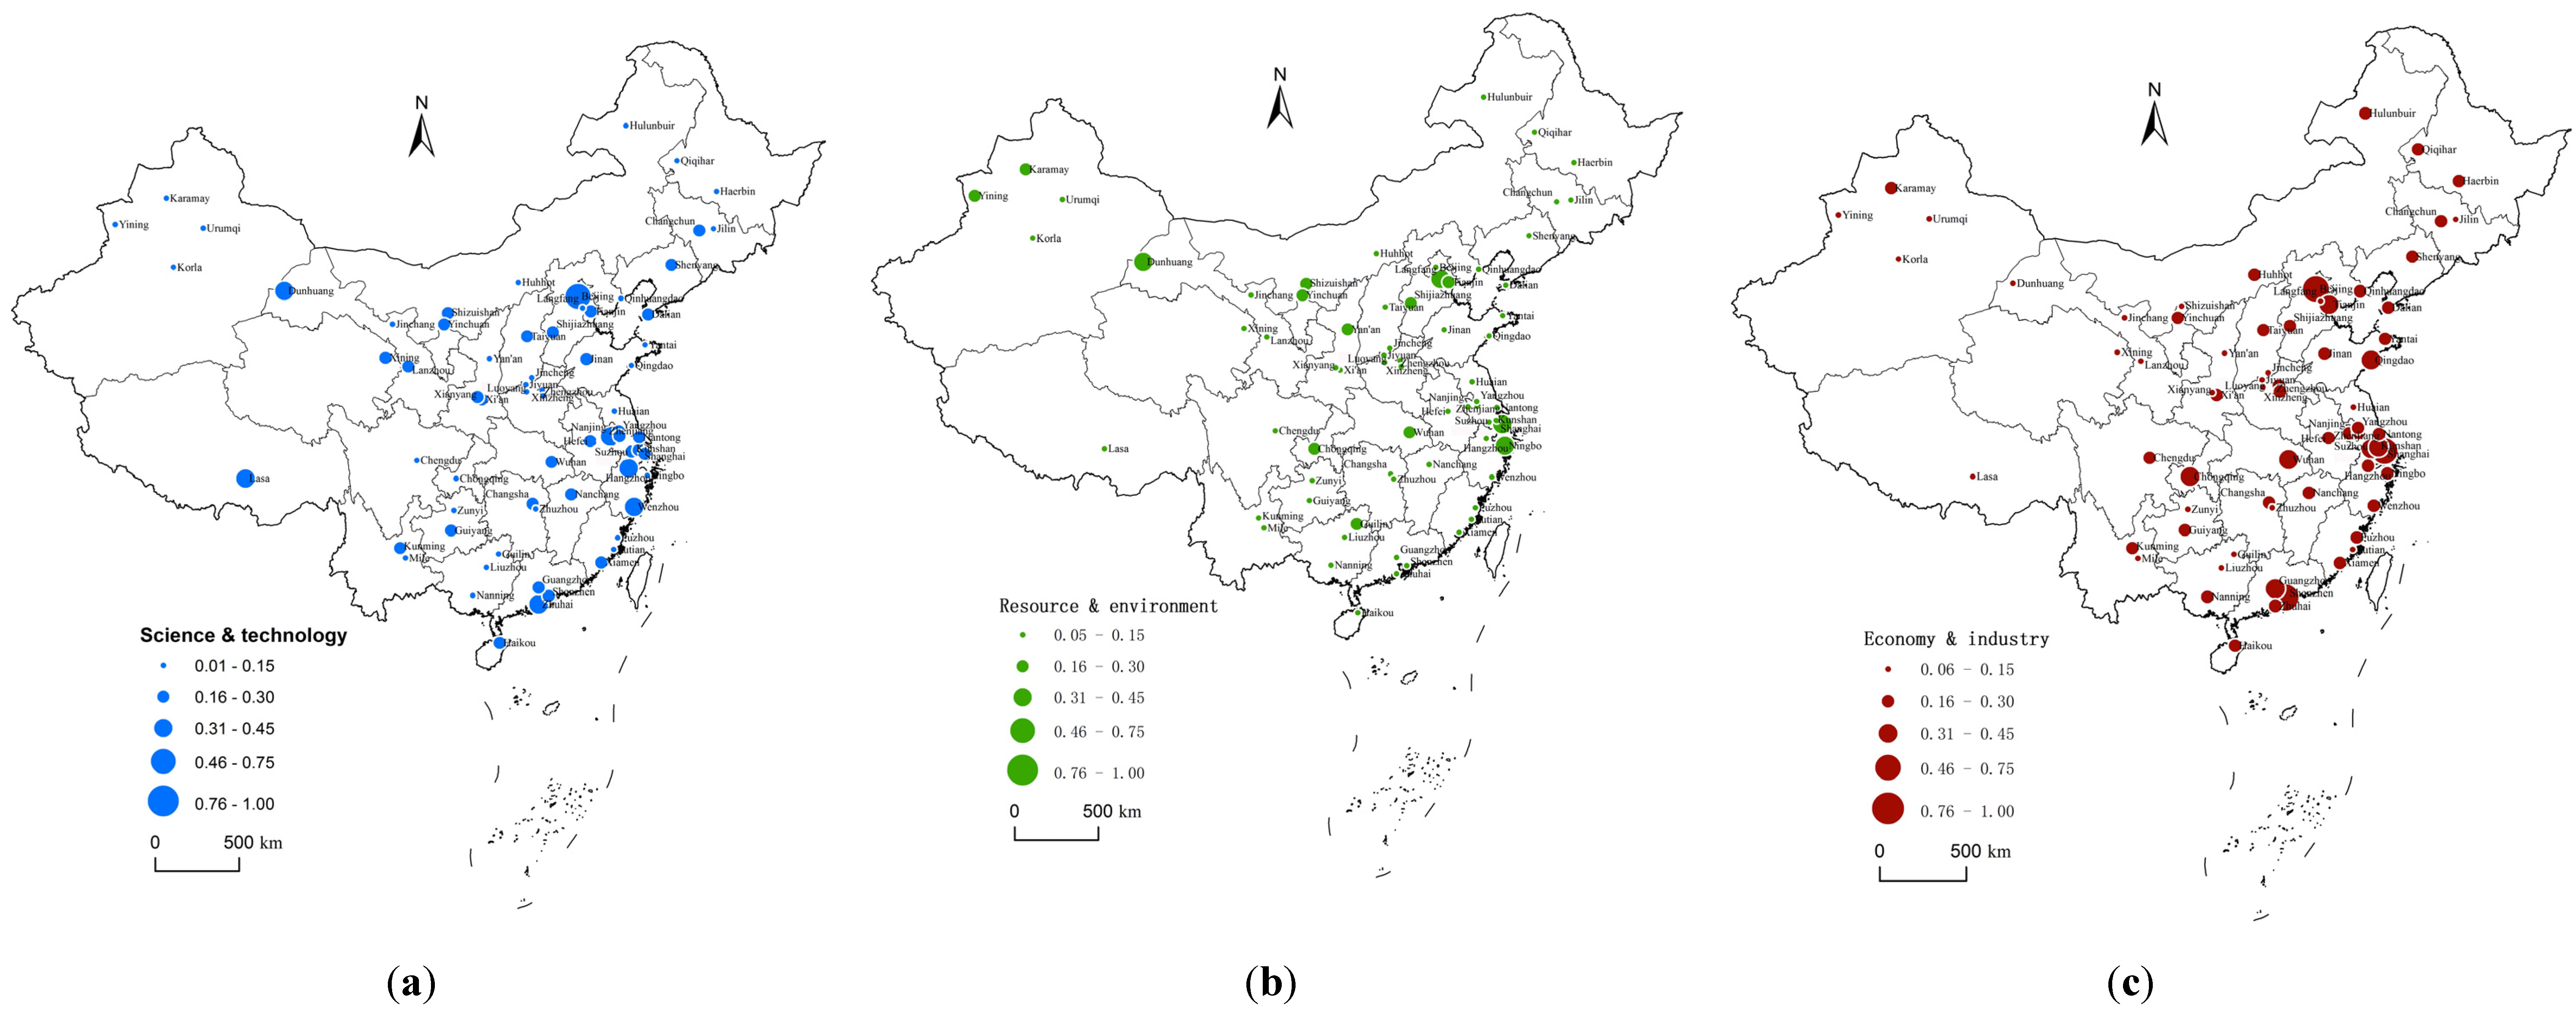
On the whole, the development of smart low-carbon cities is an adaptation process of dynamic evolution, which is propelled by the continuous interaction of internal and external flows of matter and energy. By learning from existing studies, this paper tries to creatively use the merits of the solution from the Technique for Order Preference by Similarity to an Ideal Solution (TOPSIS) method to build a quantitative framework of a smart low-carbon city’s dynamic mechanism from internal and external systems including science and technology conditions, resources and environmental conditions, economic industrial conditions, infrastructure and functions conditions, key capital conditions, and institutional and cultural conditions to discover the dynamics of smart low-carbon city development in China and fill the blank of the smart low-carbon city area.

2. Materials and Methods

2.1. Materials

2.1.1. Research Objectives

At present, more than 400 cities in China have announced their smart low-carbon city strategies and plans, covering 95% of the sub-provincial and above-level cities and more than 75% of the prefecture-level cities. Taking into account the representativeness of the sample, the availability of statistics, the feasibility of study and the comparability of results, this paper selected four municipalities, 15 sub-provincial cities, 17 other capital cities, 26 prefecture-level cities and six county-level cities as research subjects based on the lists of the national low-carbon pilot cities, the national ecological garden cities, the national smart pilot cities, the national new-type urbanization pilot cities, the Sino-European green smart pilot cities and the Sino-American low-carbon ecology pilot cities. In accordance with the administrative level and urban size, the specific samples of the study can be checked in Table 1 and Table 2.

2.1.2. Data Sources

The statistics of this empirical analysis are mainly obtained from the China Statistical Yearbook (2014) [40], the China City Statistical Yearbook (2014) [41] and the China Urban Construction Statistics Yearbook (2014) [42], combined with specific statistical data released in local statistical yearbooks, the local statistical bulletins, local government websites and relevant departments’ websites. Meanwhile, other related professional data are acquired from the website of the Ministry of Science and Technology, the website of the Ministry of Environmental Protection, the website of the China Securities Regulatory Commission, the website of the National Tourism Administration, the China Environmental Yearbook (2014) [43], the Almanac of the Chinese Listed Companies (2014) [44], the Report on China’s Innovative City Development [45], the Report on the Performance Evaluation of China’s Government Website (2013) [46], the Chinese Cultural Relics Statistical Yearbook (2014) [47] and the Report on China’s Green Development Index (2014) [48] etc.
In this study, due to the broad professional fields and geographical scope, very few data were difficult to find and collect. Hence, considering the integrity and availability, the paper chose the year 2013 to ensure the actuality of calculation. Concerning missing data, the provincial or urban average score or zero would be used in processing. Then, the above methodology can be applied to measure the dynamic mechanism and development status of Chinese smart low-carbon cities. In the quantitative analysis, because there were some negative indicators in the resource and environmental conditions, it is postulated that the greater the value (i.e., resource and environmental conditions are worse), the stronger the dynamic of the smart low-carbon city development.

2.2. Methods

2.2.1. Index System

Based on relevant research and construction practice, this paper mainly uses theoretical analysis and frequency statistics analysis of existing literature, policy documents, studies and construction standards guidance, as well as expert advice and discussions to construct a quantitative analysis framework of the dynamic mechanism of smart low-carbon city development with 59 major indicators in mainly regards: First, endogenous power, including science and technology conditions which are considered the internal core driving forces, the resource and environmental conditions which are the inherent fundamental driving forces, and the economy and industry conditions which are the foremost internal foundations. Second, the exogenous stimuli, including the facilities and functions conditions which are the prior external preconditions, the critical capital conditions which are the key external driving forces and the institutional and cultural conditions which are the important external supports (Table 3).

2.2.2. Methodology

Due to the flexibility and convenience of sample data selection, TOPSIS is considered here to explore the dynamic mechanism of smart low-carbon cities. The TOPSIS method is an effective decision-making technology and scientific method that is often used in the systems engineering field. This method was introduced by Hwang and Yoon in 1981 [49], and has been successfully applied in many areas such as land use planning, material selection evaluation, project investment, health, etc. As one of the comprehensive evaluation methods of a multi-objective decision with limited plans, TOPSIS calls for no special sample requirements, which suggests it can be applied to both a small set of data and a large set of statistics. Meanwhile, compared to other similar methods, the algorithm is relatively simple and flexible as it fully uses the information of the original data and is consistent with the facts of objective quantitative results. This method significantly improves the scientific accuracy and operability of multi-objective decision analysis. TOPSIS has been used in many decision problems and is more practical in actual decision-making situations. Hence, we choose it to explore the development dynamics of smart low-carbon cities. In this method, through the normalization of the original data matrix, the optimal outcome (ideal solution) and the worst outcome (negative ideal solution) can be picked out; then, by calculating the distance between each evaluation outcome and the ideal or negative ideal solution, the approach degree and its order can be obtained, which would be the basis for evaluation [49]. The specific steps are as follows:
(1)
Establish the feature matrix with the same trend. Generally, the original low-priority indicators are usually converted to high-priority ones through the reciprocal method; i.e., a low-priority indicator Xij (i = 1, 2…, m; j = 1, 2…, n) should be converted to a high-priority one via the formula X’ij = 1/Xij. Additionally, the original medium-type indicators can be converted to high-priority ones with the formula X’ij = |Xij − standard median value|. The same trend feature matrix of original data is:
D = [ X 11 ... X 1 j ... X 1 n ....................... X i 1 ... X i j ... X i n ....................... X m 1 ... X m j ... X m n ] = [ D 1 ( X 1 ) ............ D i ( X j ) ............. D m ( X n ) ]
(2)
Build the standardized matrix. The same trend feature matrix of original data can be normalized with the following formula:
a i j = X i j / i = 1 m X i j 2
Then build the standardized matrix related to the normalized vector aij as follows:
A = [ a 11 , a 12 , a 13 , ... , a 1 n ....................... a i 1 , a i 2 , a i 3 , ... , a i n ....................... a m 1 , a m 2 , a m 3 , ... , a m n ]
(3)
Construct the standardized weighting matrix. Considering the requirements of TOPSIS and the property of some indicators, the weight (wij) here is given as the same number to get the standardized weighting matrix:
Z = [ w 11 a 11 , w 12 a 12 , w 13 a 13 , ... , w 1 n a 1 n ......................................................... w i 1 a i 1 , w i 2 a i 2 , w i 3 a i 3 , ... , w i n a i n .......................................................... w m 1 a m 1 , w m 2 a m 2 , w m 3 a m 3 , ... , w m n a m n ]
(4)
Determine the ideal and the negative ideal solutions. According to the above results, the optimal vector Z+ and the worst vector Z can be obtained:
Z + = ( Z i 1 + , Z i 2 + , Z i 3 + , Z i 4 + , ... , Z i n + )
Z = ( Z i 1 , Z i 2 , Z i 3 , Z i 4 , ... , Z i n )
(5)
Calculate the distance. Generally, the n-dimensional Euclidean distance is calculated to acquire the distance between each outcome and the ideal solution Di+ and the distance between each outcome and the negative ideal solution Di separately:
D i + = j = 1 n ( Z i j Z j + ) 2
D i = j = 1 n ( Z i j Z j ) 2
where Zij is the standardized weighting value of the i-th outcome’s j-th indicator, and Di+ is the closeness degree of each outcome with its ideal solution, which indicates that the smaller it is, the closer is it to the outcome, and the better the plan is.
(6)
Calculate the optimal approach degree. Lastly, the approach degree between all the quantitative indicators and the optimal solution can be calculated:
C * = D i / ( D i + + D i )
where C* is in the range [0, 1], within which if the research object is closer to 1, it shows a relatively great level of activity, and if the object is closer to 0, it approaches the worst solution. Generally, there is little possibility for the worst and best outcomes.
(7)
Conduct the priority ordering analysis. According to the C* value, all the research objectives should be arranged in descending order to obtain the optimal solution and analyze the overall situation. If the C* values are the same, the one with the smaller Di+ performs better.

3. Results

3.1. Results of Overall Dynamics

By measuring the optimal approach degree of driving force utility, it can be observed that although the activeness of each driving force diverged in different cities, the difference of the comprehensive optimal approach degree between cities was not particularly large, and the overall optimal approach degree of driving force utility was low. For instance, Beijing, ranking first, had an optimal approach degree of driving force utility which just exceeded 0.478; Shanghai, taking the second place, had an optimal approach degree of driving force utility less than 0.473. The optimal approach degree of driving force utility of the last city, Mile, was just close to 0.09, and most cities’ optimal approach degrees of driving force utility were found between 0.12 and 0.26 (Table 4). This suggested that the overall driving force of smart low-carbon city development did not perform very well in promoting and facilitating the sample cities’ smart low-carbon development. For the majority of sample cities, the activeness of the institutional and cultural conditions was the highest, then the facilities and functions conditions; the activeness of the economy and industry conditions and the science and technology conditions was moderate, and that of the critical capital conditions was relatively weak, with the resource and environmental conditions being the lowest. Hence, it can be seen that the activeness of the institutional and cultural conditions, the facilities and functions conditions and the economy and industry conditions performed better than other driving forces in the process of Chinese smart low-carbon city development, indicating that these three were the main dynamic types of smart low-carbon city construction and development. In particular:
(1)
There were relatively great differences in the optimal approach degree of driving force utility between cities on the science and technology conditions, and the overall optimal approach degree was on the low side which showed a weak influence on smart low-carbon city development. For example, Beijing, ranking first, had an optimal approach degree just near 0.6 (0.566); Lhasa, taking second place, had an optimal approach degree less than 0.4 (0.36776); the optimal approach degree of the last city, Mile, was less than 0.01 (0.0099); and most cities’ optimal approach degrees were found between 0.06 and 0.28.
(2)
There were relatively small differences in the optimal approach degree of driving force utility between cities on the resource and environment conditions, and the overall optimal approach degree was also on the low side, showing a weak influence on smart low-carbon city development; however, it had a more significant difference in regional characteristics. For example, Shanghai, ranking first, had an optimal approach degree close to 0.4 (0.3996); Ningbo, taking second place, had an optimal approach degree just over 0.36 (0.3658); the optimal approach degree of the last city, Xinzheng, approximated 0.05 (0.045); and most sample cities’ optimal approach degrees were found between 0.06 and 0.2.
(3)
The difference in the optimal approach degree of driving force utility on the economy and industry conditions was less, and the overall optimal approach degree was at the medium level, suggesting a relatively strong impact on smart low-carbon city development. For example, the optimal approach degree of Shenzhen, ranking first, approximated 0.62 (0.619); Shanghai, taking second place, had an optimal approach degree close to 0.6 (0.598); the optimal approach degree of the last city, Jinchang, was near 0.06 (0.058); and most sample cities’ optimal approach degrees were found between 0.1 and 0.28.
(4)
The difference in the optimal approach degree of driving force utility on the facilities and functions conditions was relatively great, and the overall optimal approach degree was at the higher level, suggesting a significant impact on smart low-carbon city development. For example, the optimal approach degree of Shenzhen, ranking first, approximated 0.8 (0.795); Shanghai, taking second place, had an optimal approach degree above 0.65 (0.658); the optimal approach degree of the last city, Qiqihar, was just over 0.11 (0.117); and most sample cities’ optimal approach degrees were found between 0.18 and 0.44.
(5)
There were great differences in the optimal approach degree of driving force utility between cities on the critical capital conditions, and the overall optimal approach degree was on the low side, which indicated a weak influence on smart low-carbon city development. For example, the optimal approach degree of Beijing, ranking first, approximated 0.8 (0.797); Shanghai, taking second place, had an optimal approach degree above 0.68 (0.68462); the optimal approach degree of the last city, Mile, was just over 0.01 (0.013); and most cities’ optimal approach degrees were found between 0.06 and 0.26.
(6)
The difference in the optimal approach degree of driving force utility on the institutional and cultural conditions was greater, and the overall optimal approach degree was at a higher level, which was influential for smart low-carbon city development. For example, the optimal approach degree of Beijing, ranking first, exceeded 0.86 (0.862); Shanghai, taking second place, had an optimal approach degree of more than 0.78 (0.78220); the optimal approach degree of the last city, Mile, was less than 0.12 (0.118); and most sample cities’ optimal approach degrees were found between 0.2 and 0.6.
According to the value of the comprehensive optimal approach degree of driving force utility, by analyzing the operation s of the dynamic mechanism of smart low-carbon city development, a five-layer dynamic operation matrix on Chinese smart low-carbon city development can be derived (Table 5). From the matrix it can be seen that none of the sample cities has reached the status “Excellent” with regard to its comprehensive dynamics; the top two cities, Beijing and Shanghai, were only just reached the status “Good”. The majority of sample cities’ comprehensive dynamics were in the “Low” and “Poor” statuses, and only 44.12% of the samples exceeded the average value (0.199). Hence, the overall dynamics of Chinese smart low-carbon city development are still underpowered, and they performed poorly in promoting smart low-carbon city construction, and the operation status was relatively poor.

3.2. Results of Regional Differences

According to the calculations, regional differences in the dynamic mechanism of Chinese smart low-carbon city development can be observed (Figure 1). In the northeastern and middle regions of China, the institutional and cultural conditions, the facilities and functions conditions and the economy and industry conditions were three main dynamic types in pushing smart low-carbon city construction, and the other three were influential only for a few cities. The overall optimal approach degrees were both on the low side; few cities showed a poor dynamic operation status, which indicated a limited effect on smart low-carbon city development. In the eastern region, the institutional and cultural conditions and the facilities and functions conditions were the two fundamental dynamic types, with great impact from the economy and industry conditions and the science and technology conditions. Most cities had a relatively good optimal approach degree, but there were great differences within this area, indicating a regional imbalance. In the western region, in addition to the top two key dynamics—the institutional and cultural conditions and the facilities and functions conditions—the driving and stimulating role of the science and technology conditions should also not be ignored. Although few cities showed a better dynamic operation status, the overall optimal approach degree remained low and its impact on facilitating smart low-carbon city development was weak. Hence, the level of the dynamic operation mechanism of China’s smart low-carbon city development was distinct between different economic regions, and the overall dynamic operation status in the eastern region was significantly better than that of the other three economic regions. Generally, the better the regional foundation and economic and social development, the better the comprehensive dynamic operation status and the higher the cities rank, which indicates a diminishing spatial change law from the east to the west and differences within regions (Figure 2).

3.3. Results of City Type Differences

3.3.1. Differences in City Scale

Based on the calculated results, the urban scale differences in the dynamic mechanism of Chinese smart low-carbon city development can be investigated (Figure 1). For the supercities, the most powerful driving forces included the institutional and cultural conditions, the critical capital conditions and the facilities and functions conditions; furthermore, the overall optimal approach degree performed better which suggests a strong development dynamic. However, the operation status had not reached the level “Excellent”, and still has some room for improvement. For the megacities, the top two dynamic types were the institutional and cultural conditions and the facilities and functions conditions, while the economy and industry conditions and the critical capital conditions also played an important role. However, the overall optimal approach degree was on the low side, indicating a great potential for future development. For the big cities, the two foremost impetuses were still the institutional and cultural conditions and the facilities and functions conditions; at the same time, the economy and industry conditions, the resource and environment conditions and the science and technology conditions have begun to expand their influence. However, the overall optimal approach degree was lower, suggesting a further enhancement of these dynamics on smart low-carbon city development. For the medium-sized cities, besides the fundamental dynamic types of the institutional and cultural conditions and the facilities and functions conditions, the stimulating role of the resource and environmental conditions and the economy and industry conditions should also be noticeable. Nonetheless, the overall optimal approach degrees of most medium-sized cities were low and greater effort should be made to improve and strengthen their influence. For the small cities, the impact from the institutional and cultural conditions and the facilities and functions conditions decreased slightly, while the support from the science and technology conditions and the pressure from the resource and environmental conditions became more important. The overall optimal approach degree was low, which suggest room for great enhancement and improvement. Hence, the level of the dynamic operation mechanism of China’s smart low-carbon city development was divergent at different urban scales, and the bigger the city size and the better the development foundation, the higher the overall optimal approach degree and its ranking, showing a decreasing urban scale change law from the big to the small and differences within each scale as well as a descending administration hierarchy change law from the high to the low and differences within each scale (Figure 2).

3.3.2. Differences on Administrative Division

On the basis of the calculated results, the administration hierarchy differences in the dynamic mechanism of Chinese smart low-carbon city development can be explored (Figure 1). For the municipalities, the foremost dynamics included the institutional and cultural conditions and the critical capital conditions, with a better overall optimal approach degree that strongly propelled the development of smart low-carbon cities. For the sub-provincial cities, the leading dynamics were the institutional and cultural conditions and the facilities and functions conditions, while the economy and industry conditions and the science and technology conditions also played an important role. However, the overall optimal approach degree did not reach the medium level and the expected promoting effect has not been brought into full play. For the other capital cities, the major dynamic types were the institutional and cultural conditions and the facilities and functions conditions. Meanwhile, the economy and industry conditions and the science and technology conditions gradually stepped into the top of the list. However, the overall optimal approach degree was at a lower level that showed a weaker influence on smart low-carbon city development. For the prefecture-level cities, besides the two basic dynamics of the institutional and cultural conditions and the facilities and functions conditions, the resource and environmental conditions and the science and technology conditions should also be noticeable. However, the overall optimal approach degree performed poorly and suggested little impact on pushing smart low-carbon city development forward. For the county-level cities, in addition to the traditional two main dynamics of the institutional and cultural conditions and the facilities and functions conditions, the influences of the resource and environmental conditions and the economy and industry conditions have also gained significance. Nonetheless, the overall optimal approach degree was no doubt the lowest and the dynamic operation status was poor, requiring the most effort to upgrade in the future. Hence, the level of the dynamic operation mechanism of China’s smart low-carbon city development was different in accordance with the administration hierarchy. On the whole, the higher the city’s administration level, the more sufficient its dynamics and the better its comprehensive dynamic operation status, suggesting a descending administration hierarchy change law from the high to the low and differences within each level (Figure 2).

4. Conclusions and Discussion

On the basis of the above quantitative studies, it can be concluded that the development of Chinese smart low-carbon cities was affected by six major driving forces and the coupling interactions between them. In general, the integrated mechanism can be expressed as follows: the development of the smart low-carbon city is affected by internal and external factors. On the one hand, the interaction of science and technology innovation and the low-carbon economy is the internal core driving force, environmental change and resource depletion pressure are the inherent fundamental driving forces, and economic and financial development and industrial structure growth are the internal foundations. On the other hand, the optimization and upgrading of urban functions and development transformation are the external preconditions, the high quality human capital and adequate financing capital are the key external driving forces, and the socio-cultural environment and institutional reform and innovation are the important external supports. As a non-equilibrium dynamic system, the general rules for smart low-carbon city development are: it rises rapidly with the core of the interactive innovation, progress and application between science and technology and the low-carbon economy, and is driven gradually by institution innovation and reform, high quality human capital, adequate supply of capital and social, cultural and environmental improvement. Then, it steps into the mature stage where the wealth generation and creating capacity based on science and technology innovation are the powerful internal driving forces, which is indeed a non-linear, spiral, integrated, continuous dynamic system chain driven by layers of interlocking partial circularity. Overall, the quantitative measurement results suggest that: (1) the three major dynamics in China’s smart low-carbon city development are institutional and cultural conditions, facilities and functions conditions, and economy and industry conditions, though the overall optimal approach degree of driving force utility is relatively low, indicating a not-fully-played effect of promotion and facilitation; (2) the level of the dynamic operation mechanism of China’s smart low-carbon city development is distinct between different economic regions, indicating a diminishing spatial change law from the east to the west and differences within regions; (3) the imbalance of the comprehensive dynamic mechanism and the operation status between China’s smart low-carbon city is more prominent, showing a decreasing urban scale change law from the big to the small and differences within each scale, as well as a descending administration hierarchy change law from the high to the low and differences within each class.
Meanwhile, according to the main driving forces and their influence in the quantitative dynamic mechanism analysis, seven basic development patterns can be obtained (Table 6): (1) The internal strong mode (IS) which means all the top three driving forces of the smart low-carbon city are internal elements, indicating a strong endogenous motivation; (2) the external strong mode (ES) which means all the top three driving forces of the smart low-carbon city are external elements, indicating a strong exogenous motivation; (3) the both strong mode (BS) which shows the top two driving forces of the smart low-carbon city are internal and external elements with higher value, indicating strong endogenous and exogenous motivations; (4) the internal strong/external weak mode (ISEW) which indicates that in the top three driving forces of the smart low-carbon city, the top two are internal elements and the third one is an external element, indicating strong endogenous but weak exogenous motivation; (5) the external strong/internal weak mode (ESIW) which suggests that in the top three driving forces of the smart low-carbon city, the top two are external elements and the third one is an internal element, indicating strong exogenous but weak endogenous motivation; (6) the both weak (BW) mode which means the top two driving forces of the smart low-carbon city are internal and external elements with lower value, indicating weak endogenous and exogenous motivations; (7) the balance steady mode (BaS) which shows the top two driving forces of the smart low-carbon city are internal and external elements with medium value, indicating a relatively balanced impact of endogenous and exogenous motivations. While the internal strong mode includes type I with a better overall optimal approach degree and type II with a lower overall optimal approach degree, the external strong mode also contains type I with a better overall optimal approach degree and type II with a lower overall optimal approach degree, and the balance steady mode has both strong BaS and weak BaS. In this study, five modes appear in the samples where 38 of them are the ESIW mode, six of them are the ES II mode and one is the ES I mode (Shanghai), seven of them are the BW mode, 14 of them are the weak BaS mode and two are the strong BaS mode (Suzhou and Kunshan). Consequently, most Chinese smart low-carbon cities belong to the external strong/internal weak mode, some of them belong to the weak balance steady mode, and few of them belong to the strong balance steady mode. The institutional and cultural factors led by the government are the main content and path of the development patterns. In other words, the main development pattern of China’s smart low-carbon cities at present is driven by external factors and it basically matches with the cities’ development realities and stages.
In summary, this paper reveals five basic characteristics of Chinese smart low-carbon city development: First, the relevance of urban scale and the dynamic development mode is limited. Second, regional differences in the development mode are more obvious. Third, the fundamental mode is mainly driven by external factors. Fourth, there are some differences in the nature of the dynamic modes. Last, the development is definitely in its early infancy and large-scale construction is on the way. Therefore, considering the current status of Chinese smart low-carbon city development and its future progress, general policy recommendations and countermeasures of optimization and improvement are proposed: (1) actively encourage scientific and technological innovation and expand the application of appropriate smart low-carbon technologies to advance the pace of smart low-carbon industries and improve industrial chain efficiency; (2) focus on promoting industrial upgrading and propel the formation of a smart low-carbon industrial system, while strengthening the capability of financial services to ensure the material foundations for smart low-carbon city development; (3) improve the ecological environment continuously and realize the urban spatial optimization through appropriate policies and practical measures to protect the basis of smart low-carbon cities; (4) accelerate infrastructure construction and improve all kinds of urban services and functions, such as ah smart transportation, a green energy supply system, a smart disaster prevention and mitigation system and a smart governance system; (5) guide the promotion of the smart low-carbon concept and establish the cultural value of smart low-carbon development while completing and improving relevant policies such as economic policy, land policy, innovation policy, industry policy and human capital introduction policy and systems to ensure the long-term development of smart low-carbon cities.
Smart low-carbon city development and construction is an important part of China’s new-type urbanization strategy, as well as a novel pattern of China’s urban modernization, which calls for progressive and comprehensive realization. Therefore, the main steps of the corresponding optimization should include the following: First, through the diagnosis of the practical foundation of smart low-carbon city development, including the analysis of natural conditions, resources and location advantages, the total amount of the economy, industry structure, the distribution and total amount of key capitals, and institutional and cultural ambience, etc., the city can propose the preliminary development vision. Second, by identifying the relevant elements of smart low-carbon city development, including the factors of production, related industrial and facilities conditions, market demand, development of competitiveness and external opportunities and challenges, analyze and determine whether the proposed vision is consistent with the city’s own capability. Third, based on the above work, the orientation and position of the city can be settled and clarified, including the core contents, main paths and direction. Finally, according to scientific and rational proposals and planning, the city can start its sequential construction and take appropriate corrective measures in a timely manner according to the actual situation changes to ensure the correctness of the development direction.
In this paper, 68 typical smart low-carbon cities are considered for quantitative research to analyze the dynamic mechanism of Chinese smart low-carbon city development, from which the basic development patterns and the further optimization countermeasures are put forward. Since the research is a novel design and investigation, there are inevitably some shortages. Therefore, further study should be taken to complete and perfect the index system and method and to improve the quantitative research framework to identify the features and development rules of Chinese smart low-carbon city development, and widely expand its range of applicability and good operability.

Acknowledgments

Thanks are due to Fang Chuanglin for the funding support from the project supported by the State Key Program of National Natural Science of China (Grant No. 71433008) and to Ma Haitao for valuable discussion.

Author Contributions

Bo Pang conceived and designed the research and performed the experiments, as well as analyzed the data and wrote the paper; Haimeng Liu contributed analysis tools and provided technique support; and Chuanglin Fang provided useful ideas. All authors have read and approved of the final manuscript.

Conflicts of Interest

The authors declare no conflict of interest.

Appendix

Table A1. The optimal approach degree of driving force utility outcomes of sample cities.
CityScience and TechnologyResource and EnvironmentEconomy and IndustryFacilities and FunctionCritical CapitalInstitution and CultureComprehensive Value
Beijing0.5660.0900.4990.5420.7970.8620.479
Shanghai0.2190.4000.5980.6580.6850.7820.473
Shenzhen0.2550.0700.6190.7950.4210.7740.375
Tianjin0.2300.1730.3710.4690.4620.5250.317
Chongqing0.0770.2890.3330.3510.4470.4210.311
Ningbo0.1440.3660.2230.4360.1980.7430.306
Suzhou0.2610.1190.4430.4430.3330.5310.296
Guangzhou0.2010.0810.4170.4590.3020.7440.283
Hangzhou0.3020.0940.2730.4970.2830.7330.279
Dunhuang0.3050.3390.0690.2120.0440.3670.269
Nanjing0.3030.0820.2700.4700.2630.6670.267
Wuhan0.2660.1520.3220.4280.2370.5930.262
Wenzhou0.3340.1440.1590.3640.1220.5090.244
Qingdao0.1480.0990.3540.3780.2010.7210.240
Chengdu0.1320.1120.2840.3440.2960.5960.237
Langfang0.0790.3340.1280.2950.0800.3530.237
Xi’an0.2490.1020.2170.3490.2600.4420.226
Zhuhai0.3080.0510.1970.3880.1440.5580.226
Kunshan0.2220.0520.3680.3560.1300.5200.223
Shijiazhuang0.2170.2450.1710.2580.1560.3800.221
Dalian0.1760.1000.2190.3840.2610.6260.220
Xiamen0.1890.0670.2430.4910.1490.5730.216
Changsha0.2330.1040.2450.3640.2030.3850.213
Lhasa0.3680.0640.0950.1970.0750.2240.211
Taiyuan0.2420.1110.1930.3510.1690.4480.206
Jinan0.2010.1180.2120.3390.1910.4760.203
Karamay0.1360.2190.1710.4570.0690.3120.202
Zhengzhou0.1430.1080.2980.3250.1720.4540.201
Nanchang0.1870.0920.2440.3000.1970.5380.200
Shenyang0.1810.1000.2340.3080.1760.5350.200
Changchun0.1990.0970.1870.3000.1770.5970.197
Hefei0.1790.1090.1960.3140.2200.4080.195
Nantong0.1740.1190.2360.3580.1540.3380.192
Zhenjiang0.1920.0810.2450.3300.1490.4010.189
Yangzhou0.1950.0780.1910.3770.1110.4500.185
Haerbin0.1240.1450.2260.3110.1510.3710.183
Shizuishan0.2570.1770.1210.1920.0340.2000.182
Lanzhou0.2000.1260.1060.3200.1600.3850.179
Yinchuan0.1840.1640.1810.3220.0680.3020.179
Fuzhou0.1190.0880.1750.3600.1710.5050.178
Guiyang0.1630.0970.1950.2950.1240.5570.177
Haikou0.2080.0740.1640.3500.1180.3540.175
Kunming0.1700.0940.2140.2750.1490.4170.175
Huhhot0.1430.1120.1710.3010.1470.3950.166
Yantai0.0800.0800.2190.3220.1430.4550.166
Qinhuangdao0.0870.1320.1810.2870.1390.4150.162
Nanning0.1280.1150.1520.2950.1170.4480.160
Guilin0.0990.1550.1120.2020.1580.4500.157
Xining0.1770.1230.0690.2400.1040.3830.152
Yan’an0.0180.2220.1290.1640.0590.1990.149
Xianyang0.1550.0930.1380.2340.1110.3250.143
Zhuzhou0.0880.0780.1370.2870.1270.3920.140
Urumqi0.1350.1230.1440.2330.0690.2600.138
Huaian0.1130.1000.1440.2720.0870.2800.135
Luoyang0.0860.1150.1120.2750.0990.3140.135
Putian0.0850.0660.1300.3460.0640.2700.134
Yining0.0300.1730.1390.1980.0230.1820.131
Xinzheng0.0900.0450.2050.2170.0400.3470.128
Liuzhou0.0770.1030.0770.2440.0820.3680.124
Jincheng0.0960.0990.1070.2010.0900.3410.122
Zunyi0.0870.1220.1400.1540.0720.2830.122
Qiqihar0.0730.1270.1610.1170.0710.2610.121
Korla0.0290.1390.1480.1600.0650.1760.116
Jinchang0.1370.1040.0580.1720.0830.2050.113
Jilin0.1100.1030.1280.1490.0640.1830.110
Hulunbuir0.0390.1020.1540.2070.0430.1460.107
Jiyuan0.0670.1050.0980.1960.0390.2360.103
Mile0.0100.1250.0770.1340.0130.1180.090

References

  1. Fang, C.L. The China New-Type Urbanization Report; Science Press: Beijing, China, 2014. [Google Scholar]
  2. Antrobus, D. Smart Green Cities: From Modernization to Resilience? Urban Res. Pract. 2011, 4, 207–214. [Google Scholar] [CrossRef]
  3. Kim, S.A.; Shin, D.Y.; Choe, Y.; Seibert, T.; Walz, S.P. Integrated Energy Monitoring and Visualization System for Smart Green City Development: Designing a Spatial Information Integrated Energy Monitoring Model in the Context of Massive Data Management on a Web Based Platform. Autom. Constr. 2012, 22, 51–59. [Google Scholar] [CrossRef]
  4. Zhang, N.; Chen, W.P. Research of Symbiosis Mechanism between Smart City and Low-carbon City. Based on the Perspective of ICT. J. Syst. Sci. 2014, 22, 53–55. Available online: http://www.cnki.com.cn/Article/CJFDTotal-XTBZ201401012.htm (accessed on 2 March 2016). [Google Scholar]
  5. Winters, J.V. Why Are Smart Cities Growing? Who Moves And Who Stays. J. Reg. Sci. 2011, 51, 253–270. [Google Scholar] [CrossRef]
  6. Zygiaris, S. Smart City Reference Model: Assisting Planners to Conceptualize the Building of Smart City Innovation Ecosystems. J. Knowl. Econ. 2012, 4, 217–231. [Google Scholar] [CrossRef]
  7. Shen, Q.J. A Study on Fundamentals of Planning and Building Smart-ecological City. Urban Plan. Forum 2013, 34, 14–22. [Google Scholar] [CrossRef]
  8. Zhang, L.; Ren, L.X. The Double Helix Linkage Mechanism of City Smartness and Low-carbon Innovation. Sci. Technol. Progress Policy 2014, 31, 30–35. [Google Scholar] [CrossRef]
  9. Pang, B.; Fang, C.L. Smart Low-carbon City: Progress and Prospect. Prog. Geogr. 2015, 34, 1135–1147. [Google Scholar] [CrossRef]
  10. Glaeser, E.L.; Kohlhase, J.E. Cities, regions and the decline of transport costs. Papers Reg. Sci. 2003, 83, 197–228. [Google Scholar] [CrossRef]
  11. Yu, L.Q.; Zhang, J.S. On Rail Transit’s Role in Low-carbon Urbanization. China Open. Herald 2009, 5, 26–30. [Google Scholar] [CrossRef]
  12. Mao, G.X. The response and feedback of urbanization to the hi-tech industry cluster. World Reg. Stud. 2006, 15, 9–15. [Google Scholar] [CrossRef]
  13. Ma, S.T.; Han, Y.L. An Empirical Analysis of Relationship between Urbanization and Industrial Structure in Xinjiang. Finance & Economics of Xinjiang 2011, 15, 16–22. [Google Scholar] [CrossRef]
  14. Forte, F.; Girard, L.F.; Nijkamp, P. Smart Policy, Creative Strategy and Urban Development. Stud. Reg. Sci. 2006, 35, 947–963. [Google Scholar] [CrossRef]
  15. Henderson, J.V.; Wang, H.G. Urbanization and city growth: The role of institutions. Reg. Sci. Urban Econ. 2007, 37, 283–313. [Google Scholar] [CrossRef]
  16. England, R.W. Natural capital and the theory of economic growth. Economics 2000, 34, 425–431. [Google Scholar] [CrossRef]
  17. Wu, Q.; Fan, L.Y. Dynamic Mechanism, Difficulties and Paths of Low Carbon City Construction in China. Urban Stud. 2012, 19, 17–21. [Google Scholar] [CrossRef]
  18. Shapiro, J.M. Smart Cities: Quality of Life, Productivity, and the Growth Effects of Human Capital. Rev. Econ. Stat. 2005, 88, 324–335. [Google Scholar] [CrossRef]
  19. Aslesen, H.W.; Isaken, A. Knowledge Intensive Business Services and Urban Industrial Development. Serv. Ind. J. 2007, 27, 321–338. [Google Scholar] [CrossRef]
  20. Wang, J.; Fang, C.L. New-Type driving forces of urban agglomerations development in China. Geogr. Res. 2011, 30, 335–347. [Google Scholar] [CrossRef]
  21. Liu, Y.M. Influence and Reflection of Public Crisis Emergency on Urban Development. Heilongjiang Soc. Sci. 2007, 6, 145–146. [Google Scholar] [CrossRef]
  22. Crawford, J.; French, W. A Low-carbon Future: Spatial Planning’s Role in Enhancing Technological Innovation in the Built Environment. Energy Policy 2008, 36, 4575–4579. [Google Scholar] [CrossRef]
  23. Cai, W.L.; Shen, L. The Practice of New Area and New Development Concept. Areal Res. Dev. 2008, 27, 11–14. [Google Scholar] [CrossRef]
  24. Alexa, L.E. Urban Marketing and Its Impact over the Competition between Cities. Manag. Market. J. 2010, Suppl. 1, S39–S42. Available online: http://www.mnmk.ro/documents/2010special/4LidiaAlexa-UrbanmarketingFFF.pdf (accessed on 2 March 2016). [Google Scholar]
  25. Wang, Q.W. The Drive of City Marketing on Scientific Urban Development. Technoeconomics Manag. Res. 2011, 11, 77–80. [Google Scholar] [CrossRef]
  26. Wang, R.P.; Feng, X.H. Study on Comprehensive Level and Ideal impetus of Urbanization in Xinjiang. Chin. J. Agric. Resour. Reg. Plan. 2013, 34, 56–61. [Google Scholar] [CrossRef]
  27. Yi, S.; Li, C.; Han, J.B. Urbanization driving force of China: Based on Spatial Lag Panel Data Model Analysis. Inq. Econ. Issues 2014, 6, 9–17. [Google Scholar] [CrossRef]
  28. Li, C.L.; Liu, M.; Hu, Y.M.; Xu, Y.Y.; Sun, F. Driving forces analysis of urban expansion based on boosted regression trees and Logistic regression. Acta Ecol. Sin. 2014, 34, 727–737. [Google Scholar] [CrossRef]
  29. Liu, W.; Chen, C.F.; Huan, H.Q.; Feng, X. Research on low-carbon city development based on system dynamics model. Environ. Pollut. Control 2014, 36, 86–91. [Google Scholar] [CrossRef]
  30. Headey, D.D. The Principal Components of Growth in the Less Developed Countries. Kyklos 2008, 61, 568–598. [Google Scholar] [CrossRef]
  31. Li, L.; Sato, Y.; Zhu, H.H. Simulating Spatial Urban Expansion Based on a Physical Process. Landsc. Urban Plan. 2003, 64, 67–76. [Google Scholar] [CrossRef]
  32. Deutz, P.; Gibbs, D. Industrial Ecology and Regional Development: Eco-Industrial Development as Cluster Policy. Reg. Stud. 2008, 42, 1313–1328. [Google Scholar] [CrossRef]
  33. Deng, X.Z.; Huang, J.K.; Rozelle, S. Economic growth and the expansion of urban land in China. Urban Stud. 2010, 47, 813–843. [Google Scholar] [CrossRef]
  34. Simmons, C.S.; Perz, S.P.; Pedlowski, M.A.; Texeira Silva, L.G. The Changing Dynamics of Land Conflict in the Brazilian Amazon: The Rural-Urban Complex and its Environmental Implications. Urban Ecosyst. 2002, 6, 99–121. [Google Scholar] [CrossRef]
  35. Mcgee, T.G. Managing the rural–urban transformation in East Asia in the 21st century. Sustain. Sci. 2008, 3, 155–167. [Google Scholar] [CrossRef]
  36. Chen, W.; Song, W.X.; Yang, G.S. Urbanization trend, dynamics and state in Yangtze River Delta. Bull. Chin. Acad. Sci. 2013, 28, 28–38. [Google Scholar] [CrossRef]
  37. Zheng, M.P. FDI, Technical Efficiency and Urban Development Differences: Based on Empirical Analysis of 25 Cities in the Yangtze River Delta. Oper. Manag. 2014, 3, 74–77. Available online: http://www.cnki.com.cn/Article/CJFDTotal-JYGU201403032.htm (accessed on 2 March 2016). [Google Scholar]
  38. Zhou, W.; Yuan, C.; Zhang, F.F.; Yuan, T. The dynamics mechanism analysis of town development of Beijing. Resour. Ind. 2004, 6, 43–46. [Google Scholar] [CrossRef]
  39. Li, S.T.; Suig, C. Discussion on motive power of towns in Yantai. Yantai Norm. Univ. J. 2001, 17, 203–207. [Google Scholar] [CrossRef]
  40. National Bureau of Statistics of China (NBSC). China Statistical Yearbook 2014; China Statistics Press: Beijing, China, 2014. (In Chinese)
  41. National Bureau of Statistics of China (NBSC). China City Statistical Yearbook 2014; China Statistics Press: Beijing, China, 2014. (In Chinese)
  42. National Bureau of Statistics of China (NBSC). China Urban Construction Statistics Yearbook 2014; China Statistics Press: Beijing, China, 2014. (In Chinese)
  43. National Bureau of Statistics of China (NBSC). China Environmental Yearbook 2014; China Statistics Press: Beijing, China, 2014. (In Chinese)
  44. China Securities Regulatory Commission (CSRC). Almanac of the Chinese Listed Companies 2014; China Economy Press: Beijing, China, 2014. (In Chinese)
  45. Fang, C. Report on China’s Innovative City Development; Science Press: Beijing, China, 2011. (In Chinese) [Google Scholar]
  46. China Software Testing Center (CSTC). The Report on the Performance Evaluation of China’s Government Website. Available online: http://2013wzpg.cstc.org.cn/jxpg2013/zbg/pgbg_detail.jsp?id=124570 (accessed on 12 February 2016; in Chinese).
  47. National Bureau of Statistics of China (NBSC). Chinese Cultural Relics Statistical Yearbook; Cultural Relics Press: Beijing, China, 2014. (In Chinese)
  48. National Bureau of Statistics of China (NBSC). Report on China’s Green Development Index; Science Press: Beijing, China, 2013. (In Chinese)
  49. Lai, Y.J.; Liu, T.Y.; Hwang, C.L. TOPSIS for MODM. Eur. J. Oper. Res. 1994, 76, 486–500. [Google Scholar] [CrossRef]
Figure 1. The optimal approach degree of driving force utility of smart low-carbon city.
Sustainability 08 00507 g001
Figure 2. The optimal approach degree of different kinds of driving force utility of smart low-carbon cities: (a) Science and technology; (b) resource and environment; (c) economy and industry; (d) facilities and functions; (e) critical capital; and (f) institution and culture.
Sustainability 08 00507 g002aSustainability 08 00507 g002b
Table 1. Samples of smart low-carbon city research.
CategoryRegionCity
MunicipalityNortheast-
EastBeijing, Tianjin, Shanghai
Middle-
WestChongqing
Sub-provincial cityNortheastShenyang, Dalian, Harbin, Changchun
EastQingdao, Jinan, Nanjing, Hangzhou, Ningbo, Xiamen, Guangzhou, Shenzhen
MiddleWuhan
WestChengdu, Xi’an
Other capital cityNortheast-
EastShijiazhuang, Fuzhou, Haikou, Nanning
MiddleHohhot, Taiyuan, Zhengzhou, Hefei, Nanchang, Changsha
WestGuiyang, Kunming, Lanzhou, Xining, Lhasa, Yinchuan, Urumqi
Prefecture-level cityNortheastQiqihar, Jilin
EastLangfang, Qinhuangdao, Yantai, Huaian, Yangzhou, Nantong, Suzhou, Zhenjiang, Wenzhou, Putian, Zhuhai, Guilin, Liuzhou
MiddleHulunbuir, Jiyuan, Luoyang, Jincheng, Zhuzhou
WestJinchang, Yan’an, Zunyi, Xianyang, Shizuishan, Karamay
County-level cityNortheast-
EastKunshan
MiddleXinzheng
WestYining, Korla, Dunhuang, Mile
Table 2. Division of smart low-carbon city samples based on urban scale.
Urban Scale ClassCitySample Size
Super city-Shanghai, Beijing, Chongqing, Tianjin, Guangzhou, Shenzhen6
Megacity-Wuhan, Chengdu, Nanjing, Xi’an, Shenyang, Hangzhou, Harbin7
Big cityType IJinan, Zhengzhou, Changchun, Dalian, Suzhou, Qingdao, Kunming, Xiamen, Ningbo, Nanning, Taiyuan, Hefei, Changsha, Wenzhou, Guiyang, Urumqi16
Type IIFuzhou, Shijiazhuang, Huaian, Lanzhou, Nanchang, Nantong, Yaitai, Haikou, Hohhot, Jilin, Putian, Luoyang, Kunshan, Zhuhai, Qiqihar, Liuzhou, Yanzhou, Yinchuan, Zhenjiang, Xining, Xianyang, Zunyi, Zhuzhou, Qinhuangdao 24
Medium cityGuilin, Langfang, Xinzheng, Jiyuan, Korla, Yining6
Small cityType IJincheng, Yan’an, Shizuishan, Karamay, Hulunbuir, Lhasa, Mile, Jinchang8
Type IIDunhuang1
Table 3. The index system of the dynamic mechanism of smart low-carbon city development.
CategoryNo.IndicatorUnit
Science and Technology X1National Key Laboratoriesnumber/one million people
X2National Research Centers of Engineering Technologynumber/one million people
X3Higher Education Institutionsnumber/one million people
X4National High-Tech Industrial Development Zonesnumber/one million people
X5National Technology Business Incubatorsnumber/one million people
X6National Innovative Enterprisesnumber/one million people
X7Granted Invention Patentsnumber/one million people
X8Research & Development (R & D) Institutions/Number of the Industrial Enterprises above Designated Size%
X9Contracted Exchange Volume in Technical Market10,000 yuan
Resource and EnvironmentX10Energy Intensitytons of standard coal/10,000 yuan
X11Energy Consumption Elasticity%
X12Water Consumption/Gross Domestic Product (GDP)m3/10,000 yuan
X13Chemical Oxygen Demand (COD) Emissions10,000 tons
X14Sulphur Dioxide (SO2) Emissions10,000 tons
X15Number of Days of Good Air QualityNumber of days
X16Average Value of Regional Environmental Noise of Urban Area Decibel (dB)
X17Forest Coverage%
X18Direct Economic Losses Caused by Natural Disasters100 million yuan
X19Frequency of Environmental Emergenciesnumber of times
Economy and IndustryX20Gross Domestic Product (GDP) of City100 million yuan
X21Economic Density100 million yuan/km2
X22Local Public Financial Revenue10,000 yuan
X23Ratio of Investment to Output%
X24Industrial Total Asset‘s Contribution Rate%
X25Proportion of Tertiary Industry%
X26High-tech Industry Output/Total Industrial Output%
X27Exports of High-Tech Products/Total Exports%
X28Total Retail Sales of Consumer Goods10,000 yuan
X29Overall Labor Productivityyuan/person
Facilities and FunctionsX30Internet Penetration Rate%
X31Mobile Phone Penetration Ratenumber/100 people
X32Books in Public Librarynumber/100 people
X33Decontamination Rate of Urban Refuse%
X34Density of Drainage Pipeline in Built-up Areakm/km2
X35Green Coverage Rate of Built-up Area%
X36Building of Basic Database of Smart Low-carbon Cityscore
X37Smart Livelihood Service Systemscore
X38Smart Low-carbon Operation and Managementscore
X39Cloud Computing Platform Constructionscore
X40Smart Medical System Constructionscore
Critical CapitalX41People Employed10,000 people
X42Research & Development (R & D) Personnel10,000 people
X43Registered Urban Unemployment Rate%
X44Student Enrollment of Higher Education Institutionsnumber /10,000 people
X45Fiscal Expenditure for Science and Technology10,000 yuan
X46Fiscal Expenditure for Education10,000 yuan
X47Density of Research & Development (R & D) Fund Input%
X48Actual Utilization of Foreign Capital10,000 dollars
X49Foreign and Domestic Currency Deposits of Financial Institutions100 million yuan
Institution and CultureX50Innovative Reform of Urban System and Mechanismscore
X51Security Level of Smart Low-carbon Development score
X52Degree of Perfection of Related Regulations and Standardsscore
X53Level of Urban Modern Governacescore
X54Urban Credit Environmentscore
X55Transparency and Incorruption of City Governmentscore
X56Urbanizaiton Level%
X57Opening Degree of Cityscore
X58Activeness of Smart Low-carbon City Constructionscore
X59Popularization of Smart Low-carbon Lifestylescore
Table 4. The optimal approach degree of driving force utility (C*) of sample cities.
CityC*RankCityC*RankCityC*Rank
Beijing0.479 1Hohhot0.166 44Zhuhai0.226 18
Tianjin0.317 4Taiyuan0.206 25Guilin0.157 48
Shanghai0.473 2Zhengzhou0.201 28Liuzhou0.124 59
Chongqing0.311 5Hefei0.195 32Hulunbuir0.107 66
Shenyang0.200 30Nanchang0.200 29Qiqiha0.121 62
Dalian0.220 21Changsha0.213 23Jilin0.110 65
Qingdao0.240 14Guiyang0.177 41Jiyuan0.103 67
Jinan0.203 26Kunming0.175 43Luoyang0.135 55
Nanjing0.267 11Lanzhou0.179 38Jincheng0.122 60
Hangzhou0.279 9Xining0.152 49Zhuzhou0.140 52
Ningbo0.306 6Lhasa0.211 24Jinchang0.113 64
Xiamen0.216 22Yinchuan0.179 39Yan’an0.149 50
Guangzhou0.283 8Urumqi0.138 53Zunyi0.122 61
Shenzhen0.375 3Langfang0.237 16Xianyang0.143 51
Harbin0.183 36Qinhuangdao0.162 46Shizuishan0.182 37
Changchun0.197 31Yantai0.166 45Karamay0.202 27
Wuhan0.262 12Huaian0.135 54Kunshan0.223 19
Chengdu0.237 15Yangzhou0.185 35Xinzheng0.128 58
Xi’an0.226 17Nantong0.192 33Yining0.131 57
Shijiazhuang0.221 20Suzhou0.296 7Korla0.116 63
Fuzhou0.178 40Zhenjiang0.189 34Dunhuang0.269 10
Haikou0.175 42Wenzhou0.244 13Mile0.090 68
Nanning0.160 47Putian0.134 56---
Table 5. Dynamic operation level of smart low-carbon city development.
C*LevelStatusMain Cities
[0.75, 1.0]First echelonExcellent-
[0.45, 0.75)Second echelonGoodBeijing, Shanghai
[0.3, 0.45)Third echelonMediumShenzhen, Tianjin, Chongqingm Ningbo
[0.15, 0.3)Fourth echelonLowSuzhou, Guangzhou, Hangzhou, Dunhuang, Nanjing, Wuhan, Wenzhou, Qingdao, Chengdu, Langfang, Xi’an, Zhuhai, Kunshan, Shijiazhuang, Dalian, Xiamen, Changsha, Lhasa, Taiyuan, Jinan, Karamay, Zhengzhou, Nanchang, Shenyang, Changchun, Hefei, Nantong, Zhenjiang, Yangzhou, Harbin, Shizuishan, Lanzhou, Yinchuan, Fuzhou, Guiyang, Haikou, Kunming, Hohhot, Yaitai, Qinhuangdao, Nanning, Guilin, Xining
[0, 0.15)Fifth echelonPoorYan’an, Xianyang, Zhuzhou, Urumqi, Huaian, Luoyang, Putian, Yining, Xinzheng, Liuzhou, Jincheng, Zunyi, Qiqihar, Korla, Jinchang, Jilin, Hulunbuir, Jiyuan, Mile
Table 6. Main development patterns of smart low-carbon city in China pertaining to the following modes: internal strong (IS); external strong (ES); both strong (BS); internal strong/external weak (ISEW); external strong/internal weak mode (ESIW); both weak (BW); balance steady (BaS).
CityPatternCityPatternCityPatternCityPattern
BeijingESIWChengduES IIYinchuanESIWJilinWeak BaS
TianjinES IIXi’anES IIUrumqiWeak BaSJiyuanWeak BaS
ShanghaiES IShijiazhuangWeak BaSLangfangWeak BaSLuoyangESIW
ChongqingES IIFuzhouESIWQinhuangdaoESIWJinchengESIW
ShenyangESIWHaikouWeak BaSYantaiESIWZhuzhouESIW
DalianES IINanningESIWHuaianWeak BaSJinchangWeak BaS
QingdaoESIWHohhotESIWYangzhouESIWYan’anBW
JinanESIWTaiyuanESIWNantongWeak BaSZunyiWeak BaS
NanjingESIWZhengzhouESIWSuzhouStrong BaSXianyangESIW
HangzhouESIWHefeiES IIZhenjiangESIWShizuishanBW
NingboESIWNanchangESIWWenzhouESIWKaramayESIW
XiamenESIWChangshaWeak BaSPutianESIWKunshanStrong BaS
GuangzhouESIWGuiyangESIWZhuhaiESIWXinzhengESIW
ShenzhenESIWKunmingESIWGuilinESIWYiningWeak BaS
HarbinWeak BaSLanzhouESIWLiuzhouESIWKorlaWeak BaS
ChangchunESIWXiningESIWHulunbuirBWDunhuangBW
WuhanESIWLhasaBWQiqiharBWMileBW

