With regard to objective measures, Moore [
7] and Heindl [
41] provide evolutionary and comparative outlines of fuel poverty definitions, starting from the 10% expenditure on all energy services suggested by Boardman [
2]. For the reasons stated in the previous sub-sections, this was later changed to account for the
needed expenditure rather than the actual expenditure. In addition, some analyses also chose to assess household income both before housing costs as well as after (the logic being that housing costs, such as mortgage payments or rent, do not constitute income that can be spent elsewhere). Another adjustment that can be made to the measurement is to equivalise income according to household structure and size. This is done to reflect the fact that, for example, a couple with children needs to have a higher income compared to a couple without children in order to enjoy an equivalent standard of living. A distinct definition of fuel poverty presented by Moore [
7] is based on “minimum income standards” (MIS) and states that a household is fuel poor if its residual net income (after housing costs and after all other minimum living costs (MIS)) is not sufficient to cover its required fuel costs.
Subjective measures of energy poverty refer to various methods of collecting self-assessments of whether households regard themselves as being affected by fuel poverty. This can be done, for example, by asking respondents whether they feel that they can afford to purchase energy services that satisfy all their heating, lighting and cooking needs or whether they feel that they are able to heat their homes adequately [
43]. As with most questionnaire based surveys, this approach has its limitations. However, it does offer two distinct advantages compared to the objective measures. First, the results of such a study can be used to assess and compare energy poverty measurements across several countries without having to identify compatible data sources regarding patterns of household energy expenditure and income—as seen in the case of Eurostat’s Statistics on Income and Living Conditions (SILC) surveys. Second, by combining a subjective approach with an objective measurement of the same population sample, it may be possible to identify households that feel fuel poor, but who do not spend a disproportionate amount on energy services because they are rationing their consumption [
43]. Dubois [
6] considers this type of fuel poor household to be particularly difficult to identify.
Bouzarovski [
4] mentions a third type of approach based on actually monitoring the use of energy services in the home (light level, temperature,
etc.) and comparing the values with a given standard. This type of measurement could be implemented using the “geographical identification as a proxy” approach presented by Dubois [
6], which would require the collection of data from a sample of households within a similar set of dwellings from a distinct geographical unit (e.g., eight story panel apartment blocks built between 1960–1980 from a specific quarter of a city). The results could then be generalized to provide an approximate assessment of energy poverty within that geographical area. However, the practical difficulties of monitoring energy service use within the home mean that this method is likely the least feasible out of all options presented.
Finally, a high-level assessment of energy poverty at a national level could be performed based on multiple dimensions or an aggregated indicator that covers several macro indicators following the examples provided by Chester and Morris [
12], Tirado Herrero and Bouzarovski [
44] and Wang, Wang, Li and Wei [
18]. Such assessments could be adjusted to make use of readily available statistics, but their accuracy may be limited.
3.1. Proxy Indicators of Energy Poverty
A report published for the benefit of the European Commission in 2015 by a European think tank provides a useful review of energy poverty and vulnerable energy consumer issues across the EU [
36]. Building on the significant, but somewhat divergent body of research on the topic, the INSIGHT_E report provides a list of indicators that have been or that could be used in order to gauge the extent of the energy poverty phenomenon within EU member states.
The identified indicators are grouped into several categories:
income (including data on the share of population at risk of poverty);
energy consumption (the idea being that the amount and type of energy used by households can generate vulnerability especially in the face of price fluctuations);
energy prices (including aspects related to how the energy markets function at the national level);
tenure status and other housing characteristics (including type of dwelling and the use of central heating versus room heating systems); and
well-being and material depravation (low quality housing, arrears on utility bills, inability to keep the home adequately warm or cold).
These indicators, while not directly identifying the phenomenon of energy poverty, represent components of its overall magnitude. Given the lack of clarity and uniformity in defining energy poverty (discussed in the previous section), some researchers have proposed using a combination of such proxy indicators in order to measure and compare energy poverty in a consistent way across various countries or regions [
44,
45].
The method exemplified by Nussbaumer, Bazilian, Modi and Yumkella [
45] would be preferred for a more accurate assessment. In this case, the authors decide on a set of proxy indicators to be used and assign a weight and a deprivation threshold for each. A large sample of the population is assessed individually and it is established whether a person can be identified as being energy poor or not. This method of multidimensional evaluation of individuals provides a more accurate image regarding fuel poverty at a national level compared to the compounding of macro indicators, such as “share of population at risk of poverty” and “share of population unable to maintain adequate warmth in the home”. The latter is prone to errors caused by uncertainty regarding the size of the overlap between the various indicators (
i.e., it is not clear whether a narrow share of the population is severely deprived or whether a larger share is moderately deprived).
However, the type of analysis performed by Nussbaumer, Bazilian, Modi and Yumkella [
45] requires detailed data regarding the living conditions of individuals within the population across several countries. While it may be possible to implement a targeted large scale survey across the entire European Union in the future, the data required for the current analysis is not available. The best identified alternative given this context is exemplified by Tirado Herrero and Bouzarovski [
44], who use three proxy indicators: percentage of people “unable to keep their homes adequately warm” (referred from now on as
Not warm), “having arrears in utility bills” (
Arrears) and “living in a home with a leaking roof, or the presence of damp and rot” (
Leaks) in order to calculate a compound “Energy poverty index”.
3.2. The Compound Energy Poverty Indicator (CEPI)
In order to generate an assessment of energy poverty across all 28 EU member states (as well as three other European countries) based on the indicators discussed by Pye, Dobbins, Baffert, Brajković, Grgurev, Miglio and Deane [
36], we examined several potential data sources and decided to base our analysis on Eurostat in order to insure methodological consistency and to leverage its European focus. Several indicators were selected based on our research focus and grouped into two categories: EP indicators and EP pressure factors. The former will be included in a multidimensional indicator of EP, while the latter will be discussed in the following subsection. Starting from the example of Tirado Herrero and Bouzarovski, we selected indicators related to arrears on utilities, poor dwelling quality and the self-assessed inability to maintain the home adequately warm. In addition, we identified two more variables that are also self-assessed and directly related to the conceptual definition of energy poverty by Bradshaw and Hutton [
24], as quoted from in
Section 2.1: “share of population living in a dwelling not comfortably cool during summer time” (referred as
Not cool) and “share of population considering their dwelling as too dark” (
Dark).
With regard to including Not Cool in the indicator, it is worth noting that its use does not mean that the absence of air conditioning or other heat mitigation solutions (shaded building, insulating materials, etc.) in hot places (e.g., Southern European countries) automatically indicates energy poverty. Because the Not cool measure is self-reported, it means that people are catalogued as having an increased level of energy poverty if they actually state that their home cannot be made comfortably cool. Thus, it may be that even in the absence of air conditioning or other heat mitigation solutions, people may feel healthy and reasonably comfortable during summer, meaning that they are not catalogued as energy poor. However, if their health or general well-being is affected by the inability to cool the home, then they are considered to be affected by EP to some extent (i.e., this is just one component of CEPI).
The next step in designing the indicator was to establish an adequate weighting for each component. Again, following the example provided by Tirado Herrero and Bouzarovski, we propose that the three self-assessed variables that refer to inadequate living conditions receive a total weight of 0.6 (of which Not warm 0.3, Not cool 0.2 and Dark 0.1) given their direct relationship with the conceptual definition of EP. A relatively higher weight is attributed to Not warm followed by Not cool because these are considered to be fundamental needs that need to be met by a dwelling in order to reduce mortality and morbidity rates among inhabitants in the short to medium term, while Dark is likely to have a significant impact in the medium to long term. The other two indicators, Arrears and Leaks, are considered to have a more indirect connection with EP and have been given a weight of 0.2 each. The weights were chosen so that .
A comparison between the proposed Compound Energy Poverty Indicator (CEPI) and the “Energy poverty index” of Tirado Herrero and Bouzarovski is presented in
Table 1.
Recognizing the somewhat subjective nature of our weighting approach, we emphasize that CEPI is only a conceptual proposal and the values assigned to each indicator are indicative. However, these were not arbitrarily assigned—as seen in
Table 1, they follow a similar pattern compared to the Energy poverty index and were fine-tuned through a series of in-depth interviews on the topic of EP with five Romanian academics specialized in the study of poverty, sustainable development and human capital.
An ad-hoc sensitivity analysis was also performed, consisting in alternatively increasing/decreasing the values of each weight by 10% and 20% in order to observe how the EU-28 CEPI value changes. The results showed a variation of the EU-28 value between −1% and +1% in the 10% shift scenario and a −2.1% to +1.9% variation in the 20% shift scenario. This seems to indicate that the CEPI values are relatively robust and would change significantly only if a fundamental redesign of the indicator is made (i.e., assigning the highest weight to Arrears).
Thus, the proposed compound indicator is illustrated in Equation (1):
The data for the five components was extracted from Eurostat [
46] and covers all 28 EU member states, as well as Switzerland, Norway and Iceland. Given that the data for
Not cool only covers the year 2012, this is the time of reference used for all other indicators. A more updated version of CEPI could be calculated provided new reliable data becomes available.
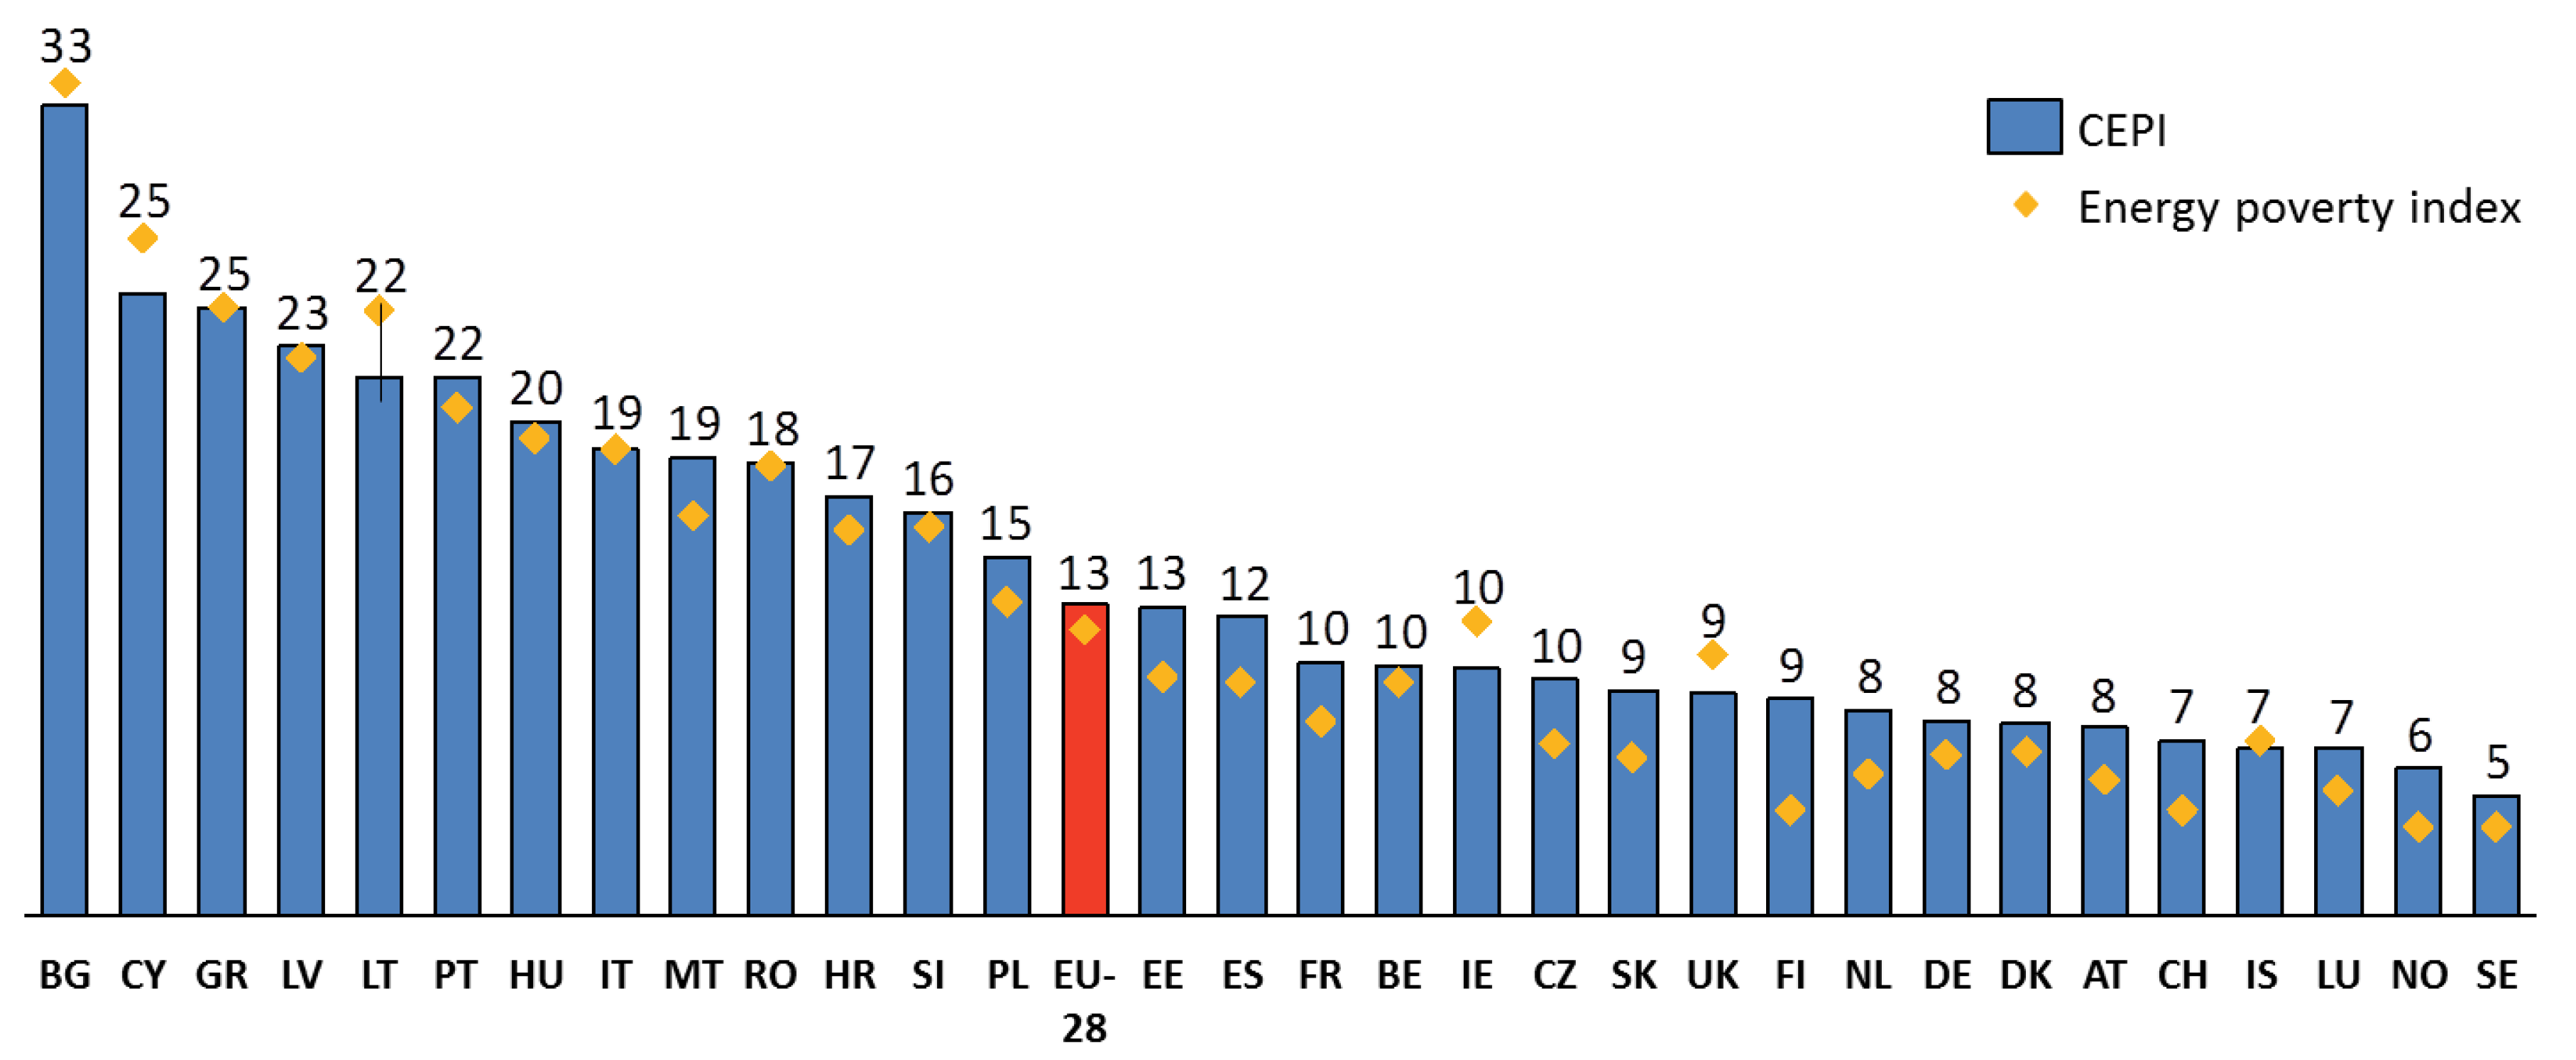
Figure 1 shows that Bulgaria is the country most affected by EP, while Sweden and Luxembourg are the EU members least affected. The EU-28 average is surpassed primarily by states from Southern and Eastern Europe. Due to the limitations specific to the method of compounding macro indicators (discussed in the previous subsection), the CEPI values should not be interpreted as “share of population affected by EP”. However, we expect that any “share of population affected by EP” values would establish a similar order among the EU member states as seen in
Figure 1.
Given the similarities that exist between the two, the CEPI results do not differ significantly from the Energy poverty index (
Figure 1 shows estimative results using data for the same year as CEPI). Notable differences above the EU-28 average consist only in Latvia and Lithuania and Malta and Romania, respectively, switching places within the hierarchy. When looking below the EU-28 average, several hierarchy changes can be observed, particularly in the case of Ireland, the United Kingdom and Finland. Bulgaria remains the most affected country and the gap between it and the following country (Cyprus) is significantly larger when CEPI is used. Sweden is indicated as the least affected country in the EU.
CEPI seeks to provide a standardized measurement of EP across Europe. However, the multitude of factors that determine the presence of this phenomenon and of nuances which influence its definition, some limitations need to be considered with regard to the results of the analysis. Firstly, applying a uniform weighting for
Not cool and
Not warm across all European countries can lead to an underestimation of EP in places where these components of CEPI have a lower impact on households. For example, maintaining a home comfortably cool during the summer in Ireland and the United Kingdom is an issue far less expensive to address compared to South European states. A similar logic can be applied in the case of
Not warm in the latter category of countries. In order to compensate for this limitation, that the weighting of these variables could be differentiated among clusters of countries (e.g., South, North, and Central) or even individual states, depending on how relevant the problem is for the specific geographical region. In order to provide an objective adjustment of weights, this should be performed based on historical recorded temperatures (using a combination of average yearly temperature as well as high/low values, as recorded during summer/winter). Such an approach has not been identified in the existing literature and may produce different results compared to those seen in
Figure 1.
Second, the CEPI weights do not directly consider the cost of resolving lighting, heating and cooling issues. It is clear that implementing an adequate heating solution for a household is far more expensive compared to resolving the issue of improper light. This issue is partly addressed by having a larger weight for Not warm and Not cool compared to Dark. However, the values could be further improved by taking into consideration the average life-cycle cost (acquisition, installation, maintenance, operation and dismantling/replacement over a set period of time, such as 40 years) of a heating, air conditioning and lighting solution for a home.
Finally, as discussed by Brunner, Spitzer and Christanell [
19], EP can be difficult to identify in certain circumstances (e.g., when people try to avoid the stigma of being labeled as poor, when people have become accustomed to living in conditions that may be perceived as inadequate by the society in general, as well as other situations that depend on socio-cultural and psychological factors). Macro indicators and high-level data such as those included in CEPI cannot detect these specific situations. Thus, if a country has a low CEPI, it does not necessarily imply that the level of EP is very low or insignificant.
3.3. CEPI Pressure Factors
As mentioned above, our review of the Eurostat database based on the suggestions outlined by Pye, Dobbins, Baffert, Brajković, Grgurev, Miglio and Deane [
36] has led to the identification of several variables that measure certain risks or pressure factors that could affect the evolution of the EP issue within a country. This section includes a more detailed description of these indicators and discusses the relationship that exists between them and CEPI. Finally, a CEPI prediction model based on these variables is provided.
3.3.1. Selecting and Calculating the Pressure Factors
After a survey of the existing literature on the topic, six variables were selected as EP pressure factors. Data on some of these is available directly from Eurostat, while others have been calculated based on several indicators or alternative data sources as well as researcher intuition. The current subsection provides a short description of each indicator and presents the approach used in their calculation or valuation.
Tenure Status (Tenant)
The indicator is based on the “Distribution of population by tenure status” provided by Eurostat. The total population is split into four categories that indicate what proportions (% of the residents) are owners or tenants. This is considered to be an EP pressure factor due to the fact that tenants are very likely to lack the motivation to invest in improving the energy efficiency of their temporary home—leading to a higher than necessary consumption of energy and an increased risk of EP. In addition, the owners of rented dwellings are also unlikely to invest in energy efficiency improvements, unless these would allow them to generate more revenue from tenants.
Aside from motivation, owners who have a mortgage on the property or tenants paying rent at market prices may lack the financial resources for home improvements compared to owners without mortgages and, respectively, tenants with reduced or free rent—further increasing EP risk. Taking into consideration the different risk levels determined by the tenure status (discussed above), we have assigned the following weights for each category of occupant:
Tenant, rent at market price (% of population)—1
Tenant, rent at reduced price or free (% of population)—0.7
Owner, with mortgage or loan (% of population)—0.2
Owner, no outstanding mortgage or housing loan (% of population)—0.1
Thus, the valuation of
Tenant is based on a weighted average as presented in Equation (2):
Given that the sum of the four variables in Equation (2) is 100 (representing 100% of the population), we chose to divide the weighting results by the sum of the weights (). This maintains the indicator value in the 0–100 range for interpretation purposes.
Considering the valuation approach discussed above, we expect that a higher value of Tenant can be associated with a higher value of CEPI. Thus, the null hypothesis that we will seek to disprove is: “there is no correlation between Tenant and CEPI”.
Type of Dwelling (Dwelling)
The indicator is based on the “Distribution of population by dwelling type” provided by Eurostat. The total population is split into four categories that indicate what proportions (% of the residents) inhabit a certain type of dwelling. This is considered to be an EP pressure factor due to the expected higher heating/cooling cost associated with detached houses
versus various types of grouped residences due to higher exposure to the environment (leading to lower thermal efficiency). Given the increased need for energy consumption of detached or semi-detached houses, the EP risk is considered to be higher compared to flats or other types of residences (which have a higher thermal efficiency). Thus, the indicator values are calculated using weights for the various types of dwellings, an approach similar to that presented for
Tenant:
Thus, the valuation of
Tenant is based on a weighted average as presented in Equation (3):
Given that the sum of the four variables in Equation (2) is 100 (representing 100% of the population), we chose to divide the weighting results by the sum of the weights (). This maintains the indicator value in the 0–100 range for interpretation purposes.
Considering the valuation approach discussed above, we expect that a higher value of Dwelling can be associated with a higher value of CEPI. Thus, the null hypothesis that we will seek to invalidate is: “there is no correlation between Dwelling and CEPI”.
People at Risk of Poverty or Social Exclusion (RiskPov)
This indicator is based on the “People at risk of poverty or social exclusion” provided directly by Eurostat. It is used to assess one of the five headline targets of the “Europe 2020 headline indicators” (part of the Europe 2020 Strategy) and it is calculated by combining three specific social conditions: share of population at-risk-of-poverty after social transfers (income poverty), share of population that are severely materially deprived and share of population living in households with very low work intensity.
This indicator was selected as an EP pressure factor given the already established connection between “risk of poverty” and energy poverty [
44]. We have opted for the broader “People at risk of poverty or social exclusion” indicator given its higher significance at the EU level—the target geography of the current study. With regard to interpretation, it is expected that a higher level of
RiskPov is associated with a higher CEPI value. As was the case for the previous indicators, the null hypothesis that we will seek to disprove is: “there is no correlation between
RiskPov and CEPI”.
Heating System Efficiency (RoomHeat)
This indicator is based on the “Share of dwellings with central heating systems (collective and individual heating)” provided by Enerdata [
47] as part of the ENTRANZE project (co-funded by the Intelligent Energy Europe Programme). The indicator groups dwellings into four groups, depending on the type of heating system that they employ: individual central heating, collective central heating (excluding district heat), district heating and room heating. Its selection as an EP pressure factor is based on the fact that central heating systems have a better energy efficiency compared to room heating.
In general, the most efficient form of central heating is considered to be district, followed by collective, although this is not always true, especially in some Eastern European countries, such as Romania [
36]. Due to this issue and in order to preserve the objectivity of the indicator, weights were not assigned to differentiate between the four categories of heating systems. Instead, the analysis directly considers the share of dwellings that use room heating as being at risk of EP.
As there was no data available for three EU member states, the indicator values were calculated as an average for countries with a similar cultural and/or geographical context. Specifically, the value for Belgium was calculated as an average of room heating use in the Netherlands and Luxembourg, for Estonia we used Latvia and Lithuania and for Portugal we used Spain, Italy and Greece.
We expect that there is a direct relationship between RoomHeat and CEPI, meaning that the null hypothesis (“there is no correlation between RoomHeat and CEPI”) would be disproved.
Residential Consumption of Energy (Cons)
This indicator is calculated as a ratio between the yearly residential consumption of energy (all forms of energy converted to Gigajoules) reported for each EU member state and the projected size of the population also reported by Eurostat at a country level. Initially, we sought to adjust the total population figure to better reflect residential population by taking into consideration various factors, including homelessness. However, the adjustments were not made due to the lack of reliable data as well as the limited significance of distorting factors (e.g., homelessness affects an estimated 0.01%–0.43% of the population according to Eurostat). As discussed by Pye, Dobbins, Baffert, Brajković, Grgurev, Miglio and Deane [
36], a higher level of energy consumption increases household vulnerability to price increases and could thus be correlated to a higher risk of EP. The null hypothesis that we will seek to disprove is: “there is no correlation between
Cons and CEPI”.
Affordability of Energy (Afford)
This compound indicator represents an additional original contribution of the paper, with applications in research beyond the topic of energy poverty. It was included in the analysis in order to compare the national EP risk generated by residents not being able to purchase a sufficient amount of energy (either due to low incomes or high energy prices). Eurostat data show that electricity and gas are two forms of energy most frequently encountered in the EU for residential usage. Yearly and biannual price and consumption figures are available for each member state. The prices refer to average costs per unit of energy (kWh) for an average household and include all taxes and levies in order to have a more accurate cross-country comparison from the perspective of the end user.
With regard to income, we have decided to use the mean equivalized net income per household. Equivalized incomes (also discussed in the previous sections) are frequently used in the study of energy poverty and are considered to provide a more accurate measure of household income. Both income and energy prices are expressed in Euros.
In order to calculate the affordability of energy, the mean equivalized net income per household is divided by the average price for one unit (kWh) of energy, as seen in Equation (4):
where
The average energy price is calculated based on the average yearly prices for electricity and gas taking into consideration the share of each “fuel type” in the total residential consumption (see Equation (5)). The purpose of this adjustment is to avoid over or underestimation of the importance of gas or electricity prices within each member state’s specific market.
where
rgas/el = share of gas/electricity in consumption
Consgas/el = consumption of electricity/gas (kWh)
Pgas/el = price of electricity/gas (Euro/kWh)
The value of Afford shows how many units (kWh) of country specific energy an average household can afford to purchase in each EU member state. We expect that Afford is inversely correlated with CEPI in the sense that the less energy the average household can acquire, the higher the EP risk at the national level. The null hypothesis that we will seek to disprove is: “there is no correlation between Afford and CEPI”.
We recognize that the weights for Tenant and Dwelling have been somewhat subjectively assigned (based on researcher intuition and motivated above). However, after testing several alternative valuations (maintaining the same hierarchy for the four categories) we have determined that the results of the econometric analysis are not significantly affected. With regard to the other four indicators, their values are objectively determined and thus are less exposed to reliability errors.
3.3.2. Correlations between the Pressure Factors and CEPI
Performing a correlation analysis is the first step in verifying the above mentioned null hypotheses regarding the relationship between CEPI and the six pressure factors and, subsequently, constructing the prediction model. The nature of the relationships observed between the indicators and CEPI (
i.e., the relationship is monotonic, but non-linear) means that an analysis based on the Spearman coefficient should be used. Due to the fact that the year of reference for the CEPI components was 2012, the same year has been used to define the 28 member states across the six EP pressure factors.
Table 2 illustrates the bivariate correlations between all the coefficients.
As seen in
Table 2, a strong and significant correlation exists between
CEPI and most of the identified pressure factors. In the case of
Dwelling, a correlation with
CEPI cannot be identified. This suggests that the type of dwelling that people live in (detached house, semi-detached house, and flat) does not determine an increased risk of energy poverty.
The significant correlations identified between
CEPI and
RiskPov,
RoomHeat and
Afford respectively are in line with our expectations and with the ideas expressed by other researchers, which were presented and discussed in previous sections. According to Pallant [
48], the statistical significance of the correlation depends on the sample size, with a higher risk that strong correlations may not be significant when a small sample size exists (<30 cases). Given that the analysis only looks at the 28 member states for a single year, it is noteworthy that these three correlations are significant at a very low level of
p.
The negative correlation between
Cons and
CEPI means that a high level of energy consumption per capita can be associated with a lower intensity of energy poverty. This suggests that, while an increased level of price vulnerability may exist for households consuming a large amount of energy, higher levels of consumption per capita are specific to those countries less affected by EP. Thus,
Cons cannot be used as a predictor variable, but it can indicate an EP risk for income poor households in low EP countries. For example, in Finland, a country with a high energy consumption per capita, the proportion of income poor people suffering from cold homes and arrears on utilities is two times higher compared to the overall population (three times higher in the case of Norway) [
46], and it is these people who are most vulnerable in the face of energy price instability.
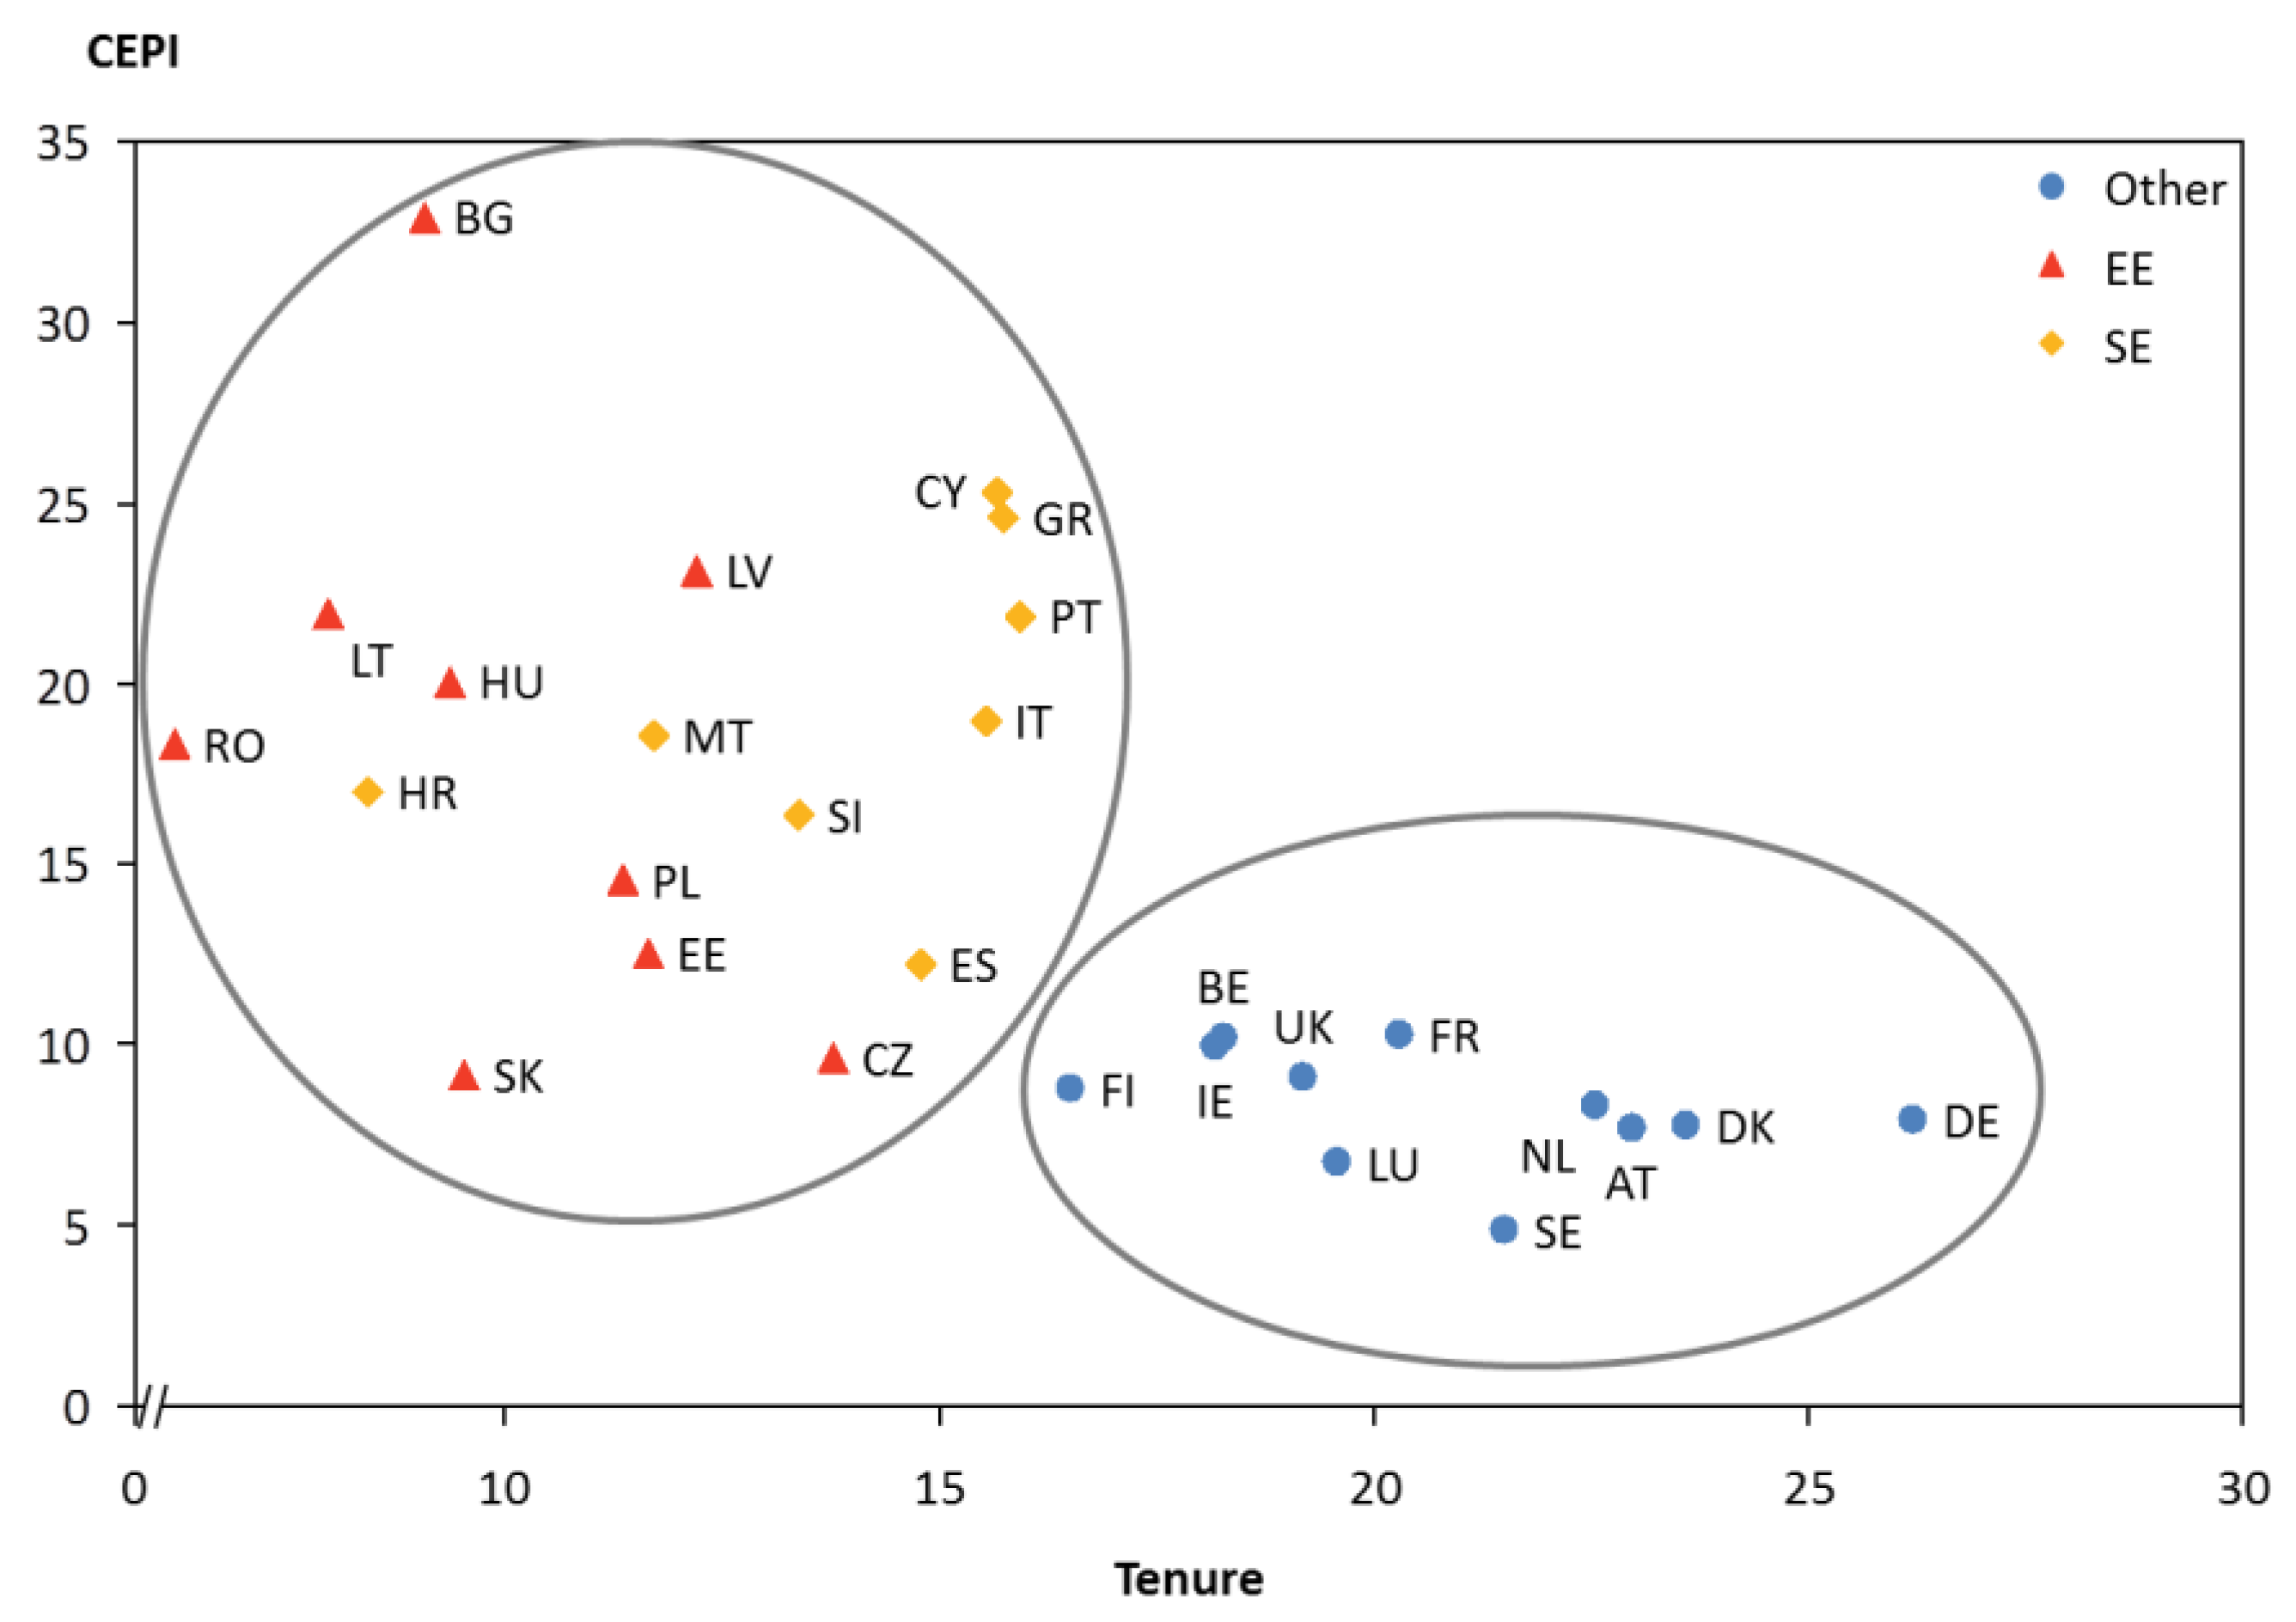
The negative correlation between
Tenant and
CEPI is also counterintuitive and suggests that EP is higher in countries where the share of population that rents homes is low. After further exploring this issue, we have determined that a geographical clustering exists within the
CEPI–Tenant relationship in the sense that countries from Southern and Eastern Europe (for the purpose of this analysis, “Eastern Europe” includes those countries which were part of the USSR or under its sphere of influence) tend to have both a lower
Tenant score and a higher
CEPI score. An illustration of the clustering is provided in
Figure 2.
These results suggest that the tenure status of the population can be correlated to a specific of socioeconomic context that exists in Southern and Eastern European countries. Our preliminary analysis suggests that material depravation and generally unfavorable economic conditions can be correlated to a higher percentage of the population being owners and not tenants. Thus, it is likely that the connection between
CEPI and
Tenant may be caused by a third variable. In the case of Southern European states, this may be related to the economic crisis and the associated long term effect of the housing market bubble. The data illustrate the situation that existed in 2012, a period (along with 2013) with the highest recorded unemployment rates since 2002 in Southern Europe [
46], putting pressure on the ability of households to afford paying mortgages in the years to come. The full implications of the relationships that exist between these variables should be explored in future research.
A partial correlation analysis shows that the null hypothesis of “no correlation between
CEPI and
Tenant” cannot be disproved when controlling for the share of the population affected by “severe material depravation” (
Depravation), as seen in
Table 3. Given that the latter indicator is one of the three components included in the methodology through which
RiskPov is calculated, it is clear that
Tenant cannot be included in the modeling.
3.3.3. CEPI Pressure Factor Model Iterations
The CEPI forecasting model uses a multiple linear regression to establish to what extent and how energy poverty (as determined by CEPI) can be explained and determined based on the discussed pressure factors. However, some of the predictor variables will need to be eliminated in order to meet the requirements specific to the chosen regression model.
As seen in the previous subsection, Dwelling cannot be included in the analysis, as it does not correlate significantly with the dependent variable. In addition, Tenant has also been eliminated, as discussed above. This leaves RiskPov, Afford, RoomHeat and Cons as potential predictors within the model.
After conducting preliminary analyses to ensure that the assumptions of the regression model are not violated, the initial model iteration included all four variables. The resulting model explains 75.3% of the variance of CEPI,
F (4, 23) = 17.55,
p < 0.001. Within the model, only
RiskPov was statistically significant (beta = 0.61
p < 0.001). This could be partially explained by the small sample size (
N = 28—the EU member states), which does not meet the recommendation of having at least 15 cases for each independent variable [
49].
The sample size issue could be addressed by reducing the number of predictors. This means that at least two of the indicators would need to be excluded from the model (in order to reach a minimum sample requirement of 30).
After running a series of iterations with all possible combinations, the best alternative model identified explains 71.2% of the variance in CEPI,
F (2, 25) = 30.94,
p < 0.001 and includes two predictors, both of which are statistically significant:
RiskPov (beta = 0.68,
p < 0.001) and
Afford (beta = −0.25,
p = 0.068).
Table 4 provides a comparative illustration of the two models discussed above.
Based on the results of the analysis, we consider that the reduced model represents the safer option with regard to forecasting CEPI and predicting the size and direction of the impact of possible pressure factors. In addition, the change in R2 between the two is not very large. However, the full model is more likely to provide useful insights into which macro indicators can be used to study or even predict risks and trends in the evolution of the energy poverty issue at a national and regional level.


 ,
, 

