Article

A Hybrid Method of Analyzing Patents for Sustainable Technology Management in Humanoid Robot Industry

1
Department of Industrial Management Engineering, Korea University, Seoul 02841, Korea
2
Korea Intellectual Property Strategy Agency, Seoul 02841, Korea
3
Graduate School of Management of Technology, Korea University, Seoul 02841, Korea
*
Author to whom correspondence should be addressed.
Sustainability 2016, 8(5), 474; https://doi.org/10.3390/su8050474
Submission received: 30 April 2016 / Revised: 9 May 2016 / Accepted: 9 May 2016 / Published: 12 May 2016
(This article belongs to the Section Economic and Business Aspects of Sustainability)

Abstract

:
A humanoid, which refers to a robot that resembles a human body, imitates a human’s intelligence, behavior, sense, and interaction in order to provide various types of services to human beings. Humanoids have been studied and developed constantly in order to improve their performance. Humanoids were previously developed for simple repetitive or hard work that required significant human power. However, intelligent service robots have been developed actively these days to provide necessary information and enjoyment; these include robots manufactured for home, entertainment, and personal use. It has become generally known that artificial intelligence humanoid technology will significantly benefit civilization. On the other hand, Successful Research and Development (R & D) on humanoids is possible only if they are developed in a proper direction in accordance with changes in markets and society. Therefore, it is necessary to analyze changes in technology markets and society for developing sustainable Management of Technology (MOT) strategies. In this study, patent data related to humanoids are analyzed by various data mining techniques, including topic modeling, cross-impact analysis, association rule mining, and social network analysis, to suggest sustainable strategies and methodologies for MOT.

1. Introduction

A humanoid refers to a robot that resembles a human body. Humanoids have been constantly developed in order to provide various types of services as well as to perform work that is difficult for humans [1]. Humanoids were previously applied for simple repetitive or hard work that required significant human power. However, intelligent service robots for home, entertainment, and personal use have been developed actively these days to provide necessary information and enjoyment [2]. That is, they have been studied to make them resemble human behavior. Developed countries, such as the United States and Japan, have already started studying humanoids in order to dominate the robot market. A humanoid is more ideal than other types of service robots because of its unique aspects, such as its ability to communicate or interact. It is a multi-purpose worker, which makes it more efficient, as it can replace a number of special purpose robots. It would be possible to develop machines that function like a robot if a humanoid is able to handle tools or vehicles. It is better to develop a multi-functional humanoid than to develop several robots specialized for a certain purpose in terms of cost and efficiency. The application of humanoids can be making a humanoid that can handle vehicles or other types of tools.
This would imply that humanoid technology could be extended to the autonomous vehicle area. Moreover, there has been an increasing number of studies on the policies and laws for the introduction of robots [3]. It is expected that humanoids with artificial intelligence will be much more convenient for our society and its applications will appear in the near future. Thus, it is necessary to develop the strategies for sustainable management of technology (MOT) in order to predict and deal with the latent problems that may be caused by the introduction of humanoid technology. Thus, we propose sustainable humanoid MOT strategies in this paper. The development of humanoid is related to various types of technologies such as electronics, machinery, Artificial Intelligence (AI) and biotechnology. The sub-technologies of humanoid are advanced, having influence on each other. For the sustainable management of humanoid technologies, it is required to develop an effective methodology for evaluating the influence of a kind of sub-technology on the other sub-technologies as it is advanced with time [4]. Successful R & D on humanoids is possible only if it is in accordance with the changes of the market and society [5]. A cross-impact matrix is a kind of forecasting methodology that assumes future events influence on each other [6]. It is a possibility-based analyzing method that calculates the probability that when an event occurs, another event also occurs due to the influence of the event. Gordon and Hayward (1968) studied technology forecasting with cross impact analysis in order to improve the limitation of the technology forecasting based on Delphi method [7]. In the cross-impact matrix proposed in this paper, the cross-impact is given as a probability evaluated from a qualitative analysis done by a domain expert. Thus, forecasting methods were dependent on the opinions of the domain expert. However, a qualitative analysis requires too much time and cost, and it could be too subjective [8]. To improve this, quantitative forecasting methodologies need to be developed for technology forecasting. Technology forecasting can be performed with patents, known to be reliable data. A patent contains bibliographic information such as application data, applicant, international patent classification, and technological information such as title, abstract, and claims [9,10]. Currently, a quantitative patent analysis is mainly performed for obtaining basic statistics about bibliographic information and technological information is qualitatively analyzed by domain experts. A quantitative analysis, such as a statistical analysis or a data mining technique, requires a structured dataset, which is not applicable for a patent’s technological information such as texts or pictures. It is currently possible to analyze unstructured data quantitatively by transforming unstructured data to structured data by using text-mining techniques. This method allows examining the technological information that has not been analyzed by domain experts [11,12,13,14]. This paper proposes a sustainable MOT strategy by applying data mining techniques to structured patent data related to humanoid technology. First, a cross-impact matrix is generated using association rule mining and a keyword analysis and the topic model is utilized to classify sub-technologies. Second, a patent analysis method using a weighted network is suggested and then the relationships between sub-technologies are visualized in order to predict the development trend of humanoid technology. In addition, an applicant analysis is performed to understand the technology market share of leading companies in the humanoid industry and the results are used to visualize the status of the technology market share by constructing a bipartite network. Finally, we suggest a sustainable MOT strategy through the two network graphs.

2. Related Work

2.1. Cross-Impact Matrix

A cross-impact matrix is a theory of predicting the future based on the fact that upcoming events influence on each other and can be used to forecast the development trend of humanoid technology [6]. A cross-impact analysis is a scenario-based analysis that produces a cross-impact matrix corresponding to a target technology. The cross impact is calculated as a conditional probability of the occurrence of an event given that its related event occurred.
Gordon (1968) proved the validity of the cross-impact matrix by carrying out a case study on a set of 28 events related to Minuteman missile arrangement [7]. Jeong and Kim (1997) proposed a method for extracting a core technology considering the cross impacts of technologies using a cross-impact matrix, the values of which were determined by experts’ qualitative evaluation [15]. Choi et al. showed the relationship among different Information and Communications Technologies (ICT) technologies through a patent analysis that calculated the quantitative cross impacts of the technologies classified according to International Patent Classification (IPC) codes [16]. Thorleuchter et al. showed the relationship between the diverse defense technologies through R & D-based and patent-based cross-impact analyses [17]. However, these two papers on quantitative cross-impact analysis dealt with the criteria for patent and R & D classification that were determined by the domain experts. Therefore, this study applies cross-impact analysis on humanoid robot technology that does not include an expert’s subjective technology evaluation by using a quantitative analysis technique such as a topic model.

2.2. Topic Models

A topic model is an algorithm that extracts specific topics from a group of unstructured documents [18]. It is operated by selecting a topic from clustered keywords having similar meaning within the group. There are several topics in a document group that are comprised of multiple keywords, and it leads to the extraction of specific keywords.
Zhang et al. (2016) studied technology forecasting by using a topic model with the United States National Science Foundation award data [19]. We extract the sub-technologies of a humanoid by applying Latent Dirichlet allocation (LDA), which is a topic model algorithm [18]. The relationship between each patent and sub-technology are identified using keywords of high frequency, term frequency-inverse document frequency (TF-IDF), and co-keyword analysis.

2.3. Association Rule Mining

Association rule mining is also known as a market basket analysis. This algorithm has been used to analyze the purchasing patterns of market customers from their baskets. There are three measurement parameters to show the relationships among different items in the basket, support, confidence, and lift. Support is defined as the proportion of item A and B at the same time. It explains the importance of an association rule between the two items [20].
S u p p o r t ( A B ) =   P ( A B ) = #   o f   T r a n s a c t i o n s   c o n t a i n   I t e m   A   a n d   I t e m   B   a t   t h e   s a m e   t i m e   #   o f   A l l   T r a n s a c t i o n s
Confidence is the proportion of transaction that contains item A that also contains item B; thus, it shows the possibility of purchasing item B when purchasing item A.
C o n f i d e n c e ( A B ) = P ( A B ) P ( A ) =   S u p p o r t ( A B ) #   o f   T r a n s a c t i o n   c o n t a i n   I t e m   A
Lift is defined as the observed confidence over the ratio of transactions containing item B. If a particular rule has a lift of 1, it implies that two items are independent. The two items have a positive relation when the lift is over 1, whereas they have a negative relation when the lift is below 1.
Lfit  ( A B ) = P ( A B ) P ( A ) × P ( B ) =   Confidence ( A B ) #  of Transaction contain Item B
Shih et al. (2008) applied the association rule mining to analyze patent and R & D trends of the Thai semiconductor industry [21]. Kim et al. (2011) also applied the association rule mining to analyze the relationship among different ICT technologies by measuring their cross impacts [22].
This study uses transactions as patent documents and items as sub-technologies to apply the association rule mining. The impact of each sub-technology is measured by confidence. Then, a confidence-based cross-impact matrix is constructed. However, the loss of information is inevitable because the patent analysis based on the association rule mining cannot consider the patents having just one classification. Thus, we need to compensate the loss of information by performing the keyword analysis and comparing its result with that of the cross-impact analysis.

2.4. Co-Keyword Analysis

Co-keyword analysis refers to a method for evaluating the relationships between documents according to the co-occurrence of words. Lee and Jeong (2008) suggested a strategic diagram regarding a robot technology by performing a co-keyword analysis on the national R & D data of Korea [23]. Rip and Courtial (1984) extracted the relationships between sub-technologies and analyzed the changes of the technologies over time [24].
In this study, we extract representative keywords from each sub-technology and patent document, and then derive the relationship between the patent documents and topics. Then, a cross-impact matrix is constructed with the measured impact of each sub-technology by using keyword frequency from the patent documents in each topic.

2.5. Social Network Analysis

Social network analysis is an information visualization method that represents relationships (e.g., friends, relatives, transactions, common interest, etc.) as nodes and edges. It has recently been applied in not only sociology but also other various fields of study. It is especially known as an efficient method to visualize the relationships among technologies.
Otte and Rousseau (2002) studied information science with social network analysis by using publication, citation, co-citation, and co-author in order to extract the relationship among information scientist, and visualized a network graph [25]. Yoon et al. applied natural language processing on collected patent data to extract properties and functions automatically [26]. They analyzed the technology trend of silicon-based thin film solar cells by using properties and function as nodes and suggested an invention property-function network that used co-occurrence as links.
We visualize the relationships between sub-technologies based on a weighted network, whose strength (cross impact) is shown by the thickness of edge. Especially, a bipartite network is used to show the relationships among n node groups (applicants) and other m node groups (sub-technologies). Then, we suggest a sustainable MOT strategy by using the two network graphs.
Each research dealt with the core technology extraction, the technological trends, understanding the relationships of technologies and their visualization based on the quantitative analyses. The previous studies which used the cross-impact analysis included subjective judgments because they utilized the tech-trees already determined in other reports or defined the technologies according to the opinions of domain experts. In order to improve objectiveness, we extracted and classified the specific technologies from patent documents using a quantitative approach based on Topic model. The current methods of evaluating the cross impact mainly used Association rule mining. It is inevitable that there is some loss of information when the relationships between technologies are analyzed by Association rule mining because it cannot consider the patents having just one technology classification. To overcome the limitation, the research used both Association rule mining and Co-keyword analysis to understand the relationships among technologies and tried to achieve improvement in the results by the combination. At last, the result of experiment can be understood by constructing a social network graph.

3. Hybrid Topic Model for Sustainable Technology Management

3.1. Sustainable Technology Management for Humanoids

We have seen the current level of AI in humanoids from a challenge match between Google Deepmind Alphago and Lee Sedol [27]. The challenge match has shown that AI has reached a high level of technology, which is higher than expected. Thus, it is strongly necessary to prepare sustainable MOT strategies, as a high level of AI is potentially beneficial as well as dangerous to human beings. Stanford University has observed the development of AI technology and its direction of change for hundred years, and they also studied how humanoids would influence on human life, work, and communication [28]. With the development of AI technology, humanoid technology is also being advanced rapidly. As humanoids can be applied to various fields, there are difficulties in predicting their influences on human life and determining the R & D direction. Therefore, it is necessary to develop sustainable MOT strategies in R & D of humanoid technology.
Sustainable MOT strategies enable monitoring the R & D trend of humanoid technology over time as well as suggesting flexible MOT strategies by understanding the technology market and environment analysis [29,30].

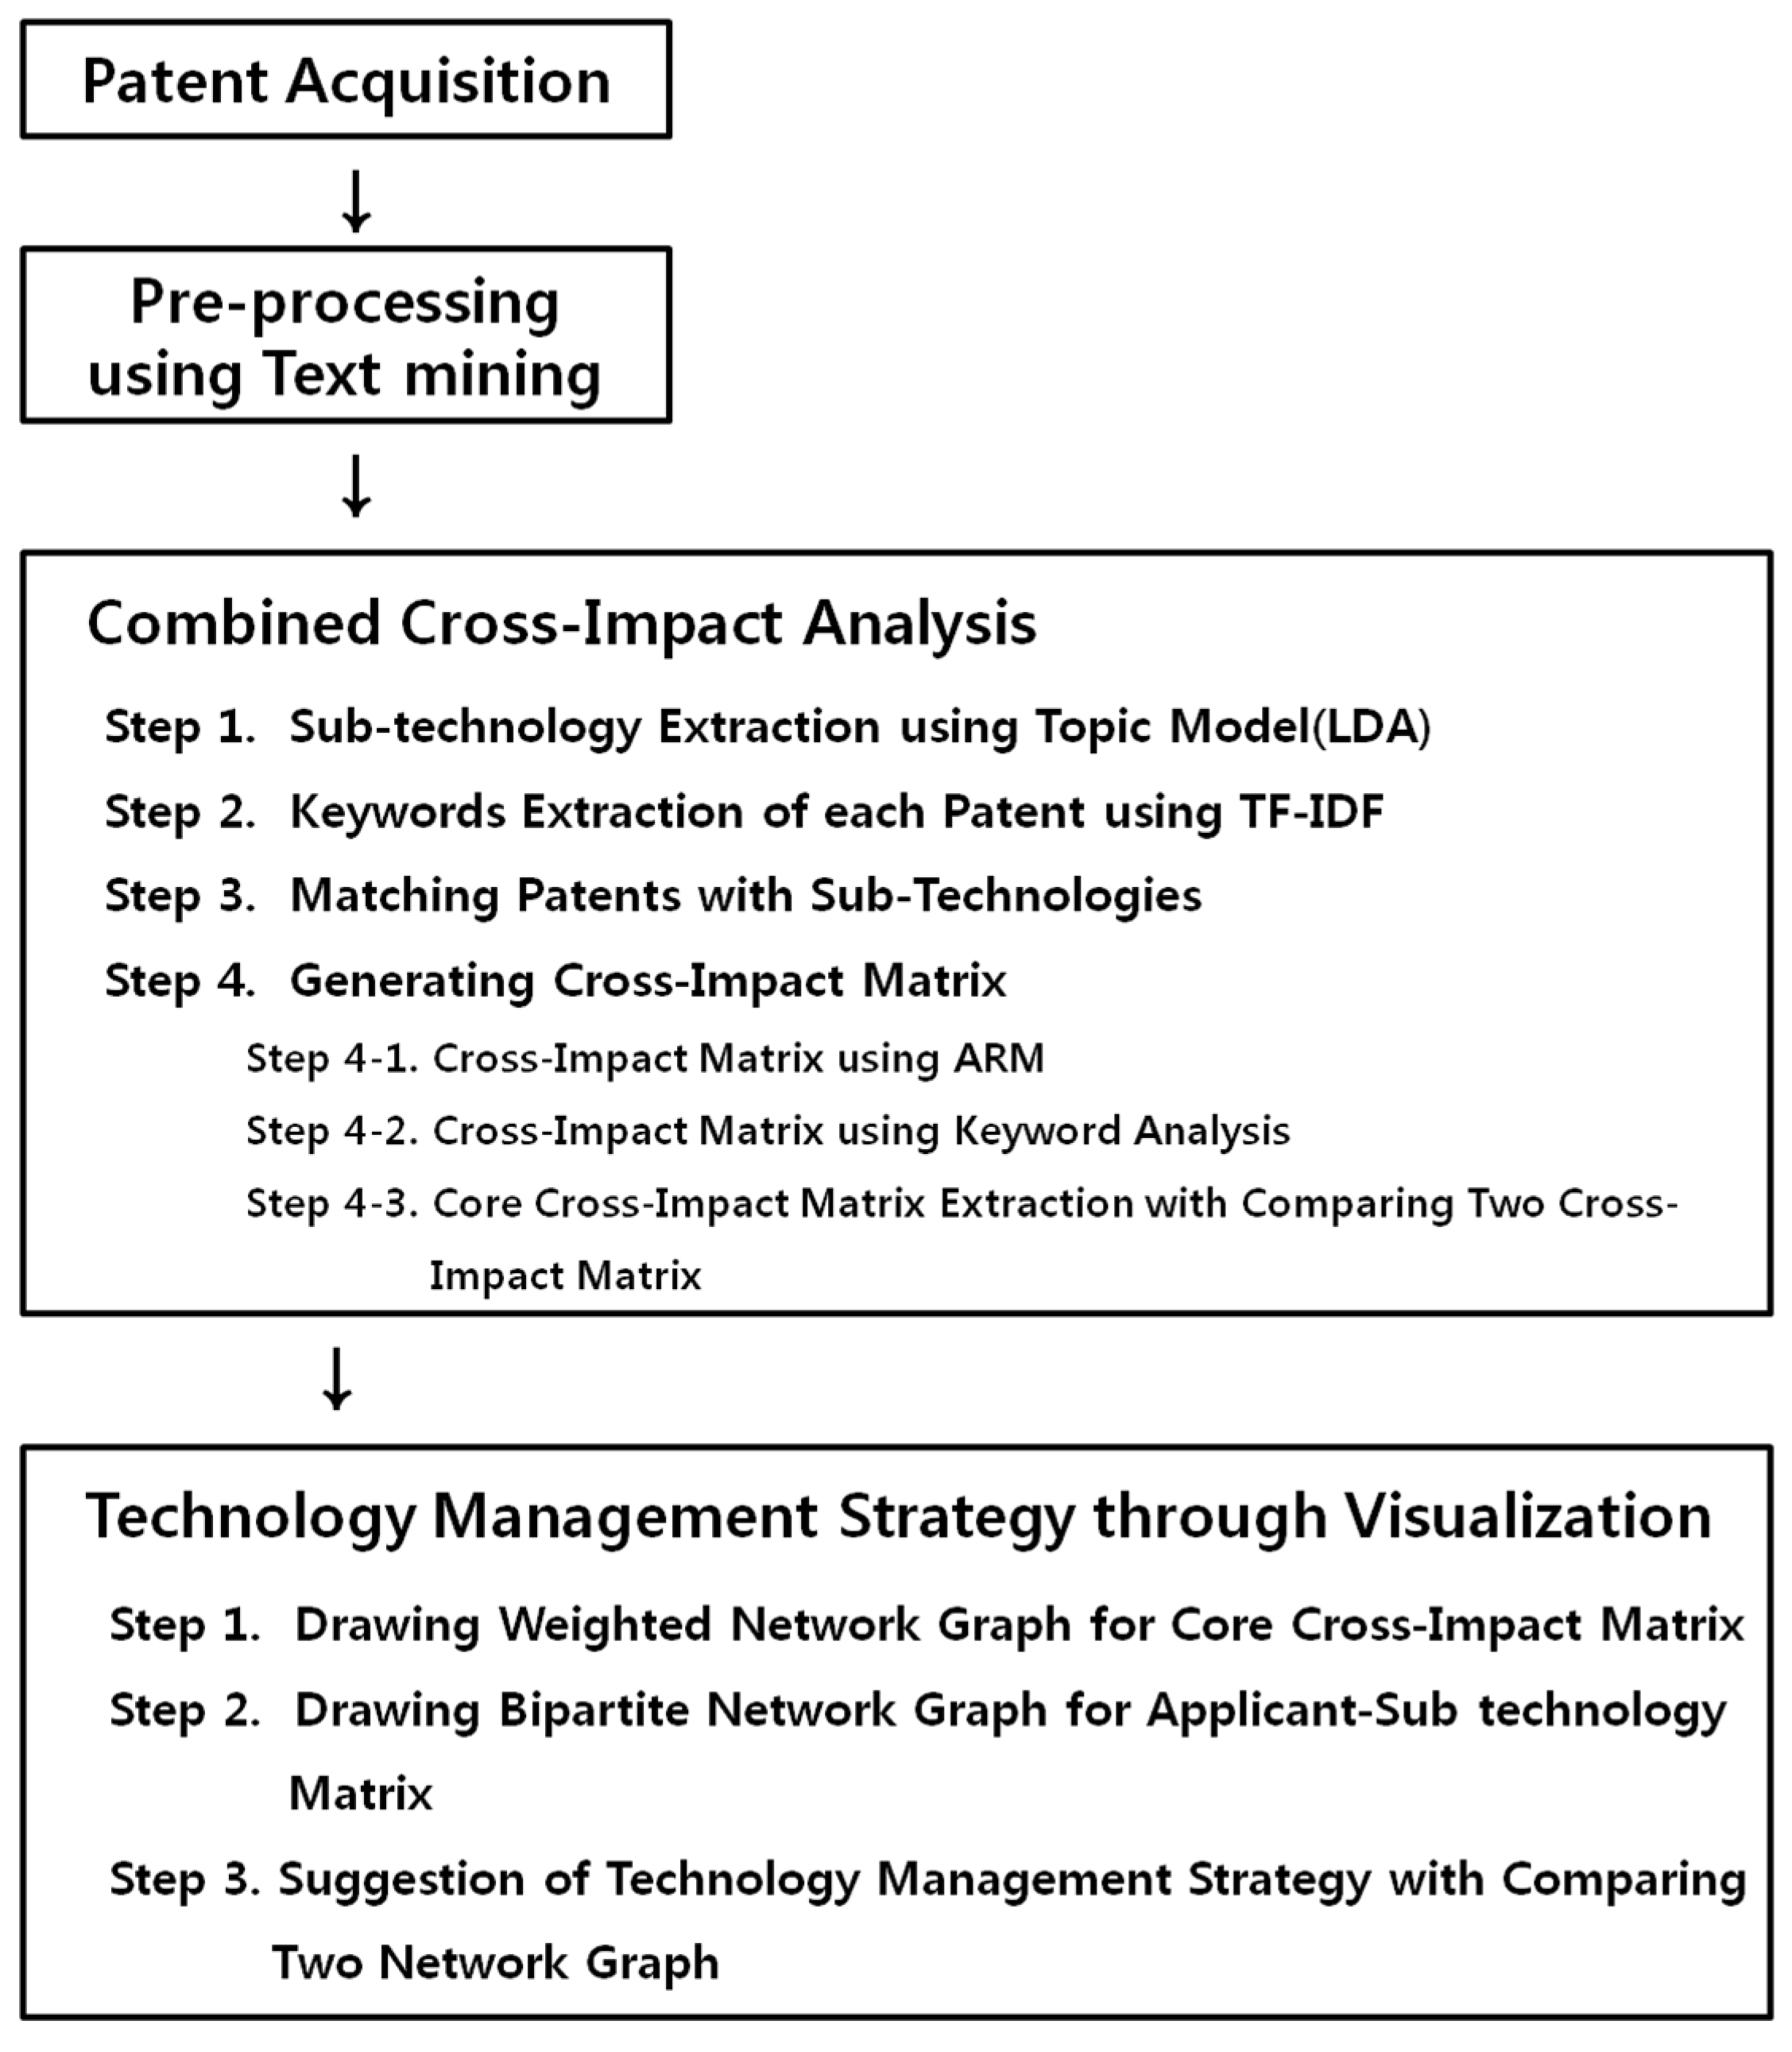
3.2. Proposed Hybrid Model

A technology consists of various sub-technologies, which have effects on each other as it is advanced. The effect needs to be understood to achieve sustainable MOT strategies. Therefore, this paper suggests a quantitative patent analysis with a hybrid model comprising text-mining, TF-IDF, topic model, cross-impact analysis, association rule mining, keyword analysis, social network analysis, and applicant analysis, as shown in Figure 1, which shows the objective and sustainable MOT strategies based on the impacts of sub-technologies.
First, patent documents are collected from the patent database. It is necessary to build the search query to collect patent data. Then, noise data are removed to select valid data. This selection step increases the accuracy of the result of analysis.
Second, a text mining technique is applied to unstructured patent data to transform the patent’s title and abstract into patent-term matrix (PTM). Useless terms, such as blanks, numbers, and “be” verbs, are removed. Then, TF-IDF is used to remove the commonly occurring terms that do not have enough representativeness.
It is important to fix the number of topics in order that the topic model is applied to extract latent topics in a group of documents. We used the average silhouette width, which is mainly used in cluster analysis for extracting the optimal number of clusters [31]. Equation (4) expresses the silhouette width of each observed value.
S i = D i M i m a x { M i D i }
where D i refers to the average value of dissimilarity between the observed value i and the other values. M i is the minimum distance between the value i and the values in the other cluster. Thus, the largest averages silhouette width represents the optimal number of cluster.
The extracted topics from the patent group are determined as sub-technologies. Then, keywords from each topic are extracted. In order to allocate patents to the sub-technologies, it is necessary to match the keywords of the patent’s high TF-IDF and sub-technologies. At this point, the patents are allowed to be allocated in more than one sub-technology. It means that a single patent can contain many technologies.
We combine two types of analysis methods in order to construct the cross-impact matrix based on the patent-sub technology matrix. First, association rule mining is applied to calculate the confidence among sub-technologies with a patent considered as a transaction and a sub-technology considered as an item. Confidence shows the possibilities of developing sub-technology B when sub-technology A has been developed. It can be defined as the cross impact between these two sub-technologies.
It is possible to evaluate the cross impact easily by applying association rule mining, but the loss of information is inevitable as it does not consider patent information with only one sub-technology. Therefore, we additionally conduct the experiment of a keyword analysis method to minimize the loss of information as well as to improve the accuracy of the experimental result. The keyword analysis method calculates the cross impact by using the ratio keywords of each sub-technology, which are included in patents.
Lastly, we use a bipartite network and visualize the relationship between high-ranked patent applicants and sub-technologies to understand the current R & D situation of companies. A sustainable MOT strategy is then finally suggested by using the two graphs.

4. Experimental Results and Analysis

4.1. Patent Acquisition

About 1000 patents regarding humanoids applied in the United States before 27 December 2015 were collected. Then, some noise data, such as patents about toys or dolls, were removed; thus, there were 901 valid raw data for the analysis, as shown in Table 1.

4.2. Pre-Processing Using Text Mining

A title and an abstract of each patent, which were unstructured, were combined as a column data. It was transformed into a PTM with 901 patents and 4415 terms by using text mining. This PTM (901 × 4415) was pre-processed and underwent TF-IDF to remove meaningless stop-words and patents. Then, a PTM with 874 patents and 1104 terms was obtained to use for further analysis.

4.3. Combined Cross-Impact Analysis

4.3.1. Sub-Technology Extraction Using Topic Model (LDA)

Extracting sub-technologies should be preceded in order to construct the cross-impact matrix. We selected 13 topics, which showed the highest average silhouette width, as shown in Table 2.
Table 3 shows the keywords that belonged to 13 sub-technologies derived by topic model.

4.3.2. Keywords Extraction of Each Patent Using TF-IDF

In order to assign 874 patents to 13 sub-technologies, keywords appearing both in patents and sub-technologies were extracted and analyzed. As each keyword of different sub-technologies was extracted by the topic model, each patent’s keyword was weighted according to its value of TF-IDF. Then, the words of patents whose values of TF-IDF were bigger than the third quartile, 0.17650, were selected as valid keywords.

4.3.3. Matching Patents with Sub-Technologies

Next, patents that contained keywords of each sub-technology were assigned to the corresponding sub-technologies. As a result, a PTM (776 × 13) was constructed with 776 patents, excluding 98 patents that did not belong to any sub-technology, and 13 sub-technologies. Each cell of the matrix contained 0 or 1 based on whether the patent in the row was assigned to the sub-technology in the column. Table 4 shows a part of the PTM.

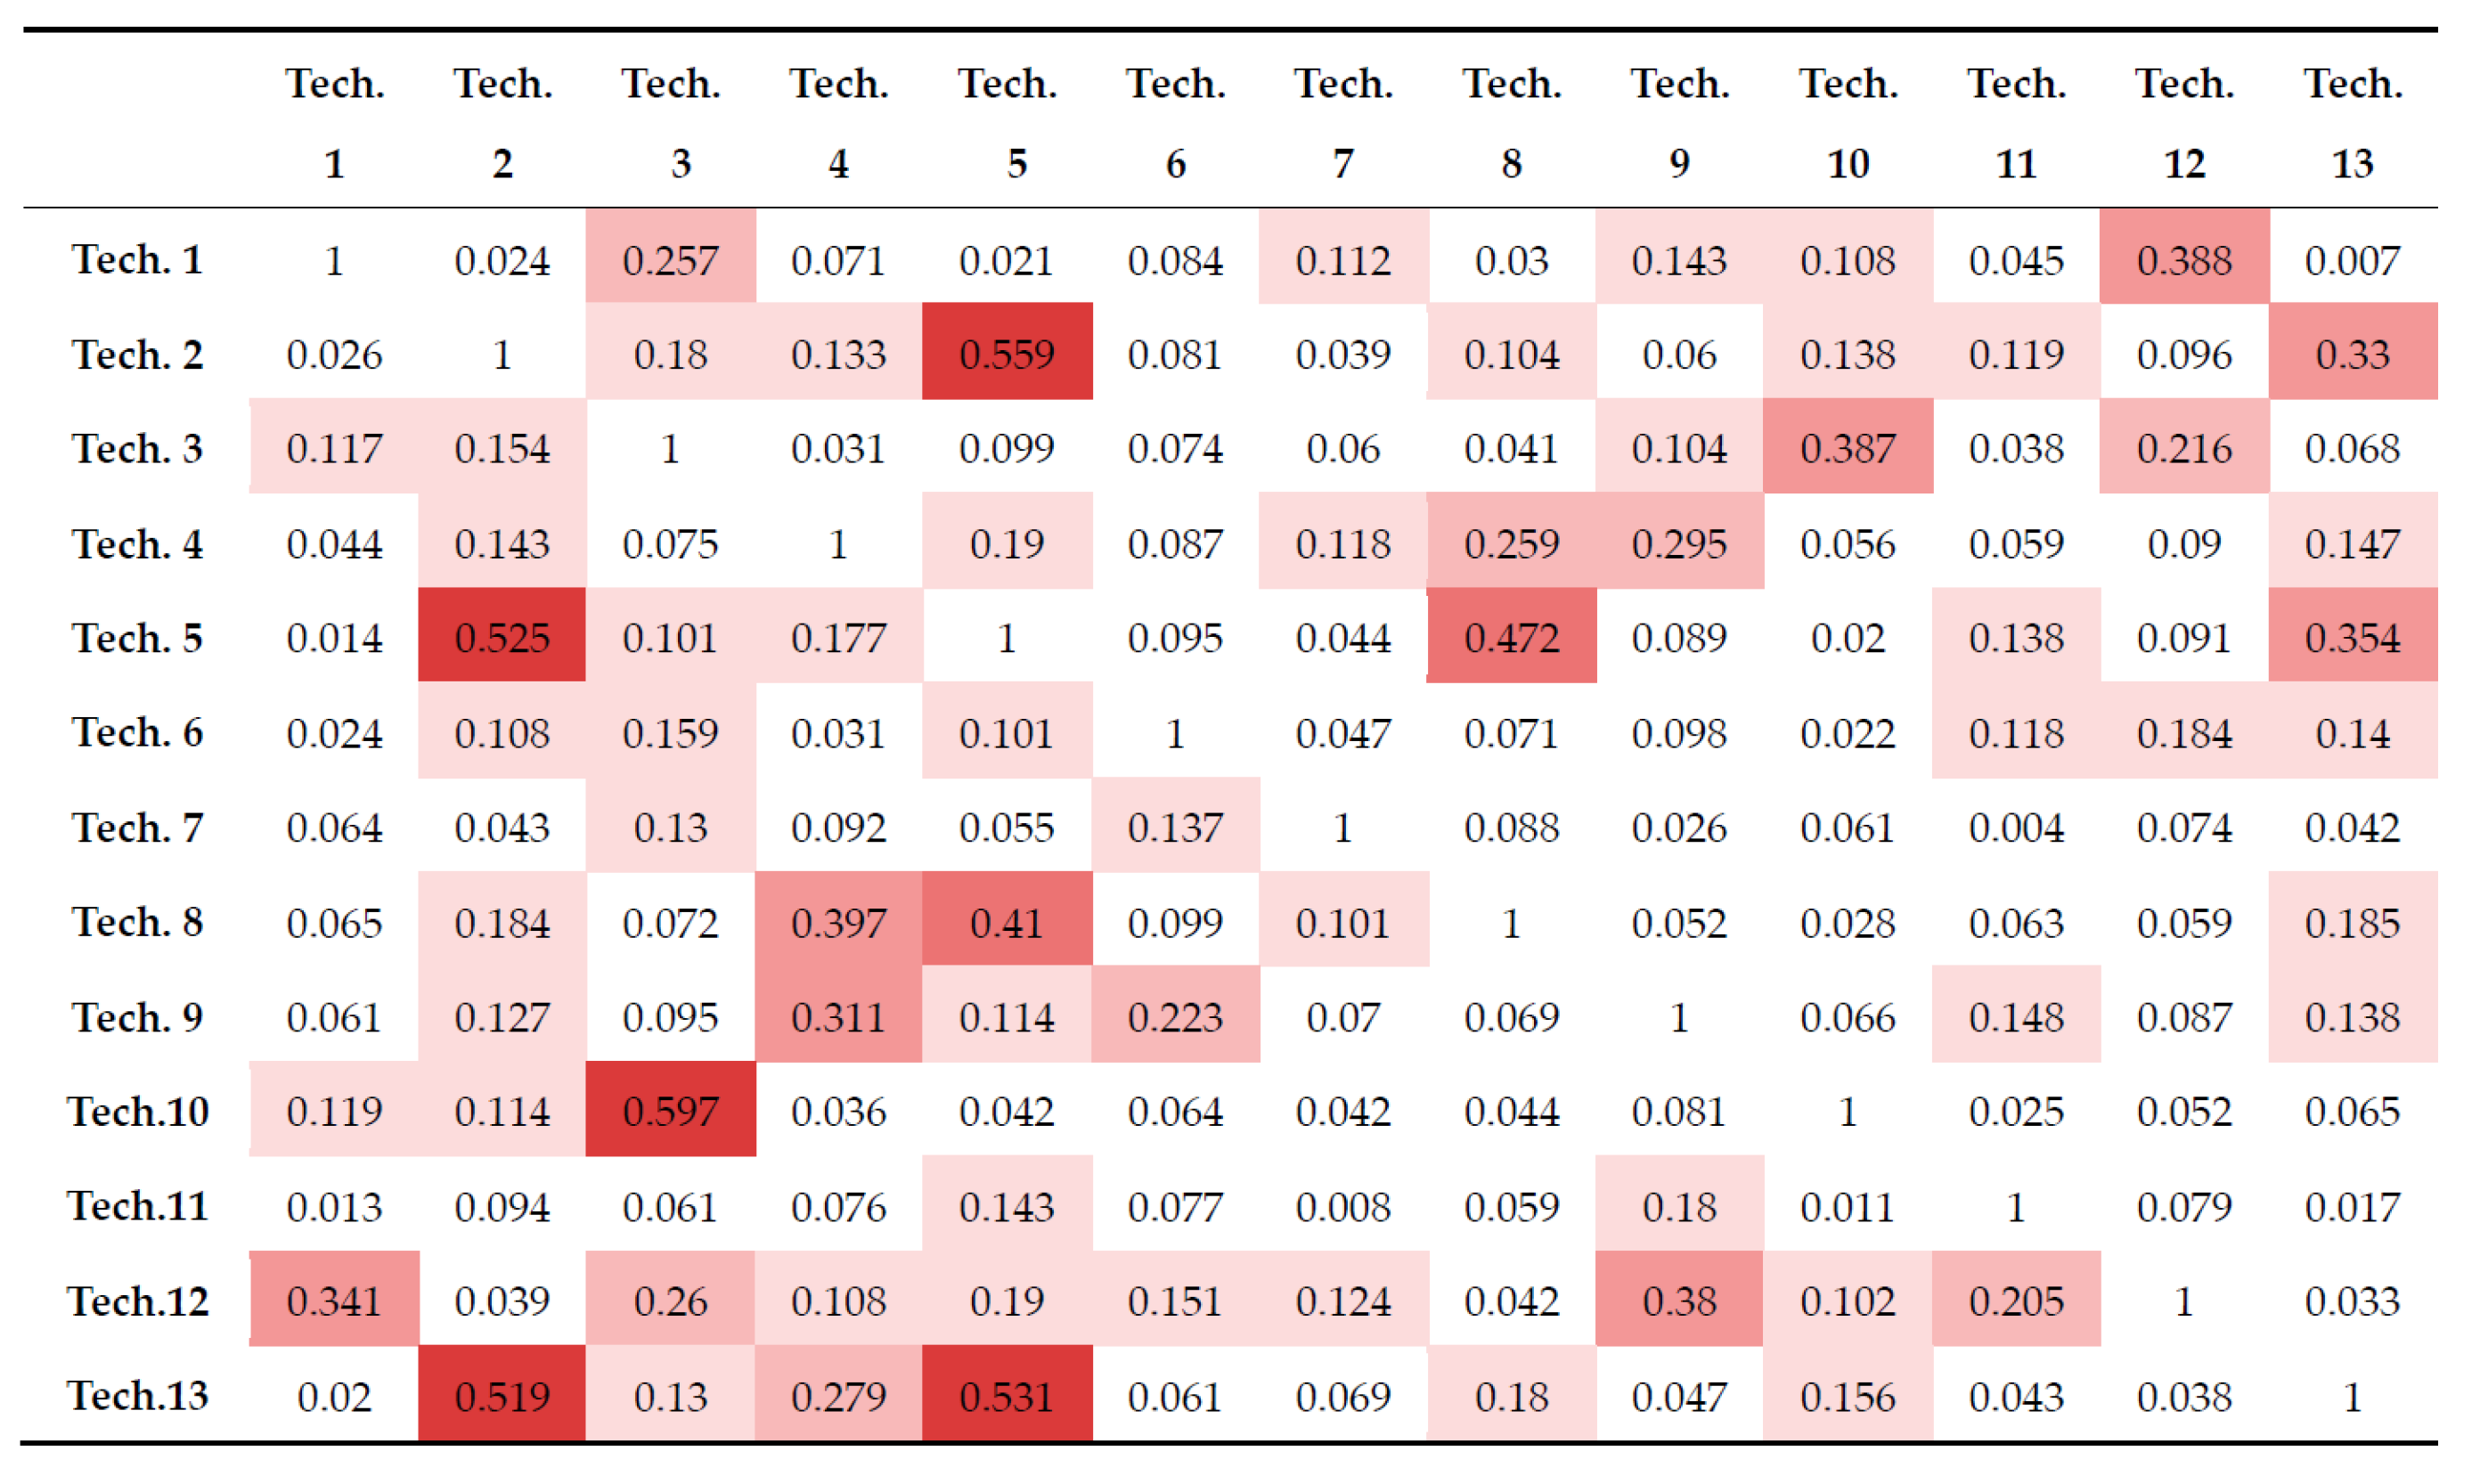
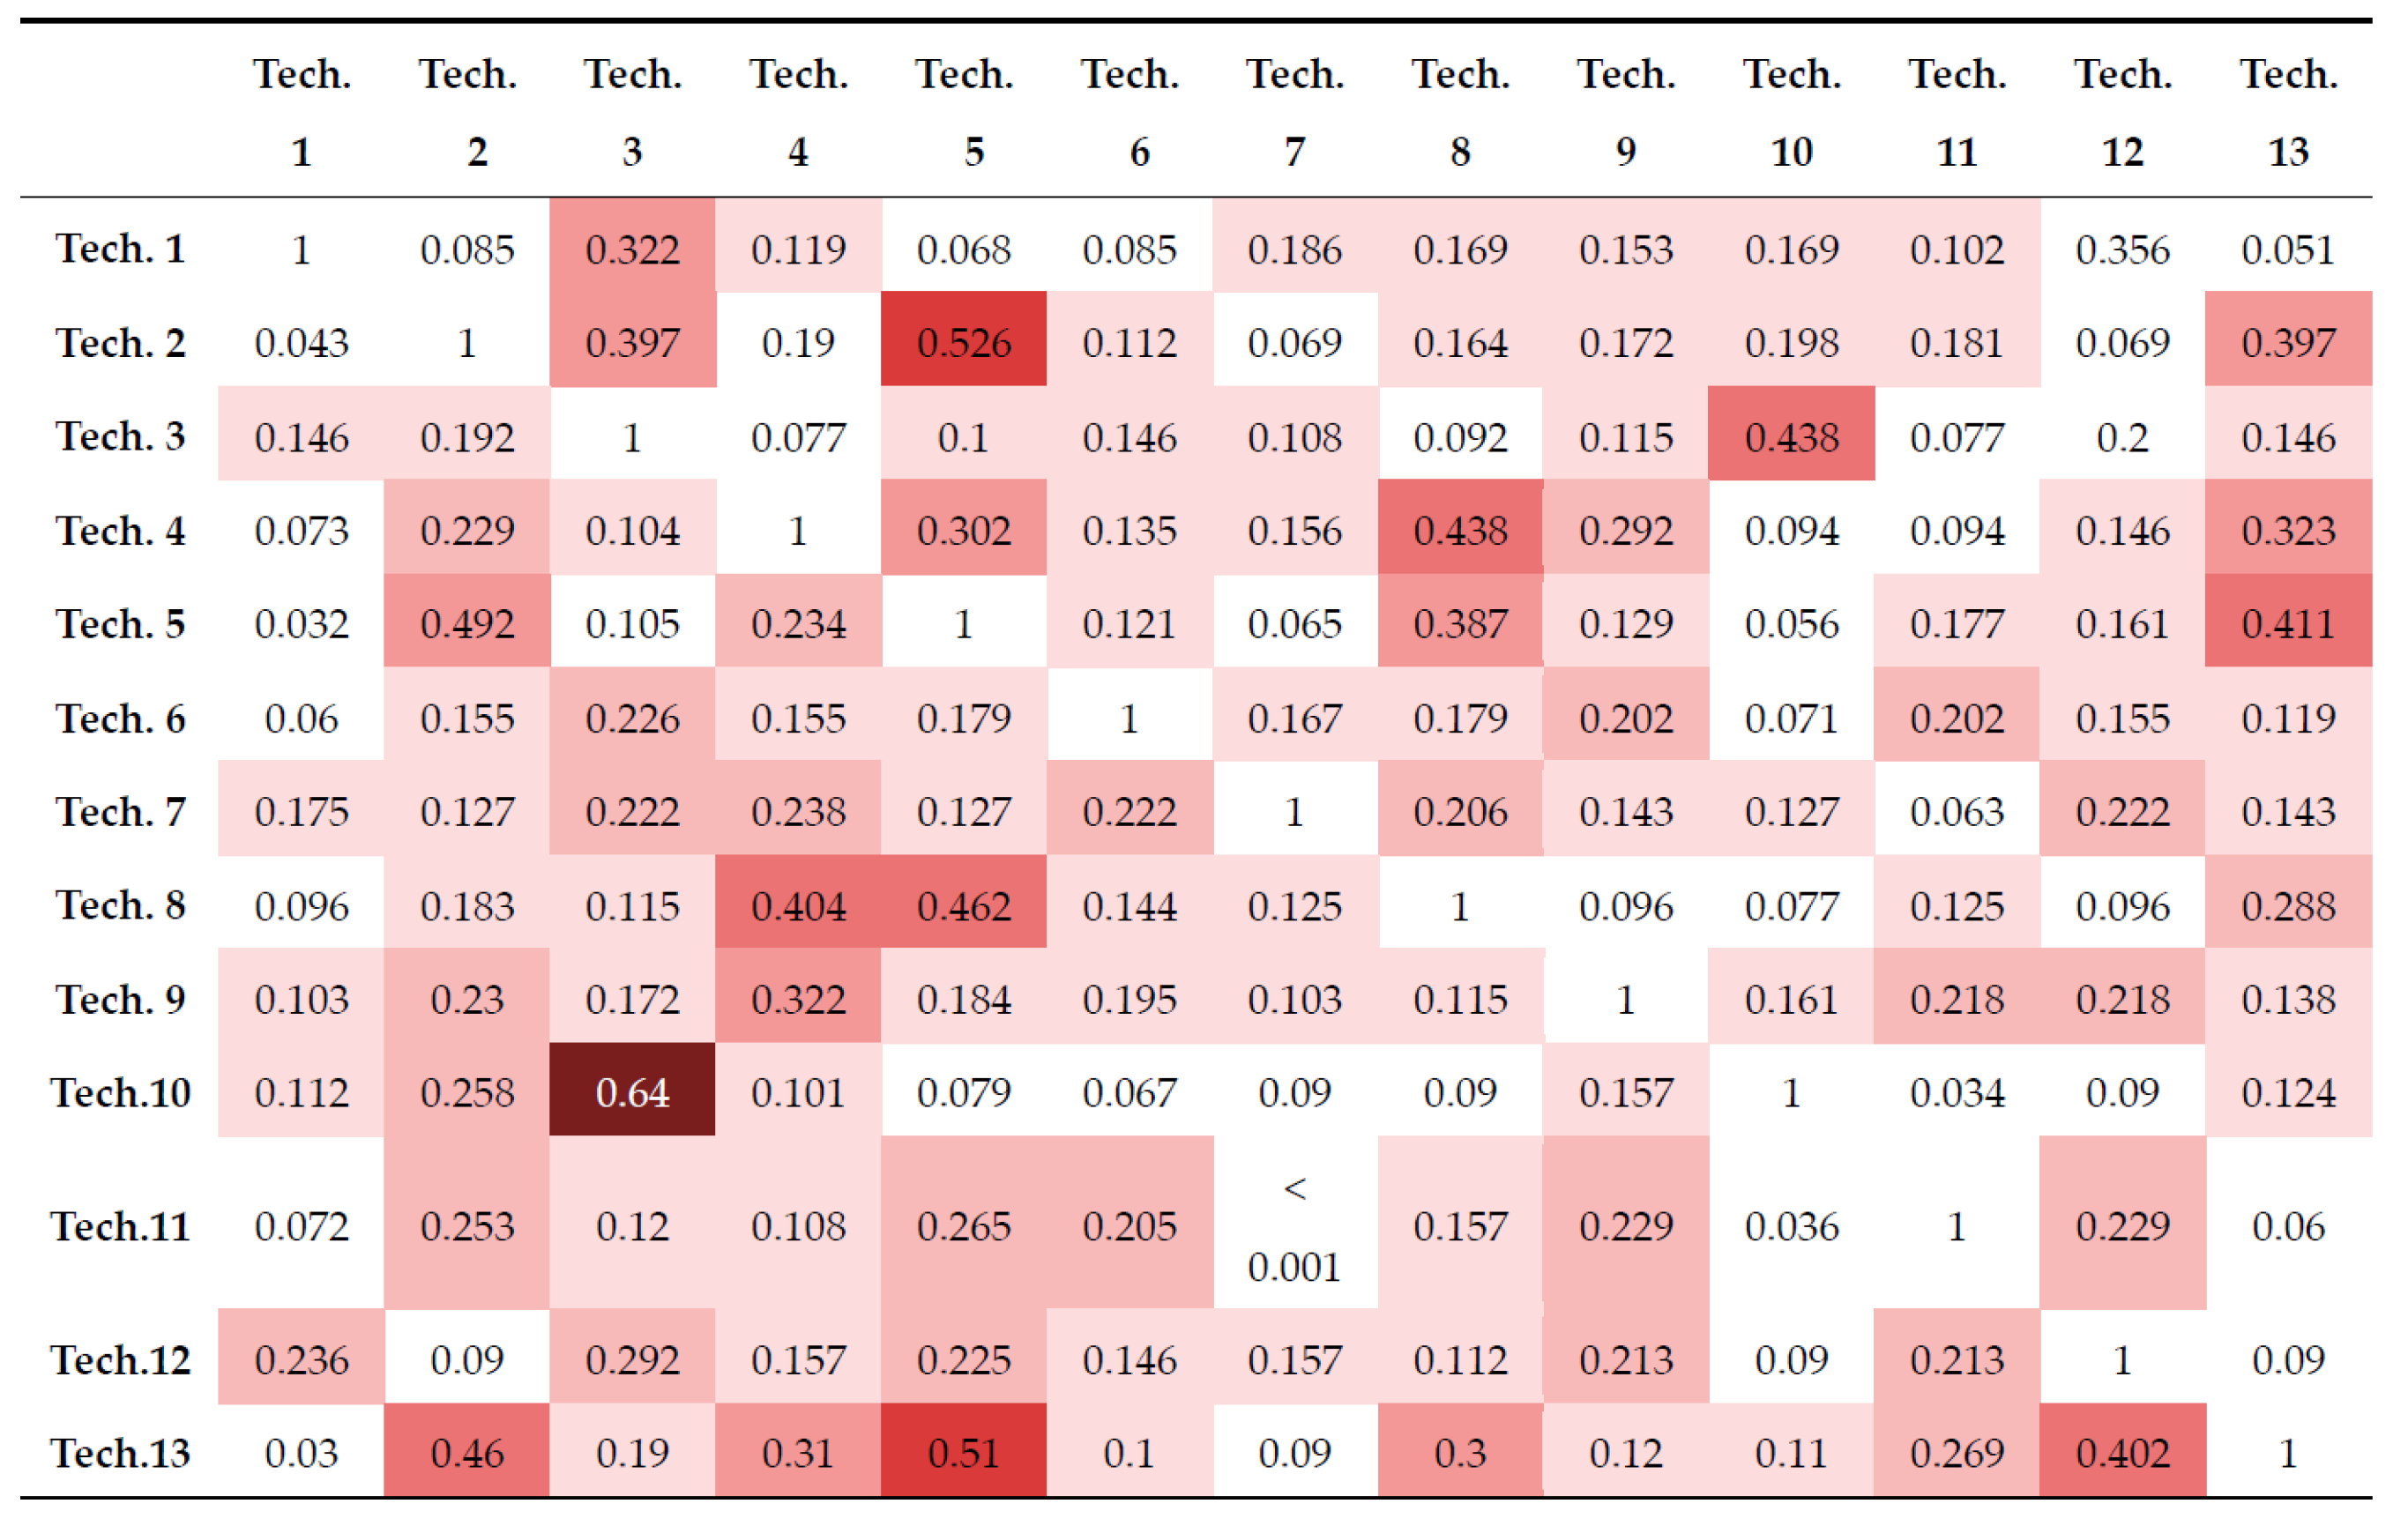
4.3.4. Generating Cross-Impact Matrix

Association rule mining was used to construct a cross-impact matrix. A total of 447 patents out of 776 patents, which contained more than two technologies, were set as transactions, and 13 sub-technologies were set as items. Then, the estimated confidence was used as the cross impacts among the sub-technologies to construct the cross-impact matrix.
The red-scale colors in Figure 2 represent the degree of the cross-impact as the depth of color. When the cross-impact, as a probability, is close to 1, the impact of the technology in the row on the technology in the column is big. In this research, the values of the cross-impact bigger than 0.2 were used in this research, so the color became darker as the value increases by 0.1 for better discriminability.
The above PTM considers only the patents belonging to more than one sub-technology. As it neglected the information of 329 patents assigned to just one sub-technology, the cross-impact matrix, as shown in Table 5, was constructed considering the result of keywords analysis using all keywords.
Each cell Pij of Table 5 denotes the average value that was calculated by the appearance frequency of the keyword of sub-technology j in patents assigned to sub-technology i divided by the number of patents. The value was transformed into the cross impact by using Equation (5), as shown in Figure 3.
P ( j | i ) =   P ( i j ) P ( j )   P i j =   P i j P j j
The above two cross-impact matrices were combined, and then the relationship between the sub-technologies was extracted according to whether the cross impact was higher than 0.2. The cross impact lower than 0.2 was transformed into 0. The cross impact higher than 0.2 was recalculated as the average value of the two matrices. As a result, the core cross-impact matrix, which represented the combined matrix, was constructed to present the relationships only among significant sub-technologies, as shown in Table 6.
The value of thresholds 0.2 was arbitrarily set to consider the cross-impact only when the values of it is bigger than 0.2. As the thresholds decreases, we can consider more relationships between technologies, but the complexity also increases. Conversely, the number of relationships to consider decreases as the value of thresholds increases, so the relationships can be more easily understood. The problem of setting the threshold value is not that of right or wrong, so the analysts or the managers who try to get insights for sustainable MOT through the methodology proposed in this paper can adjust the value according to their purpose of analysis.

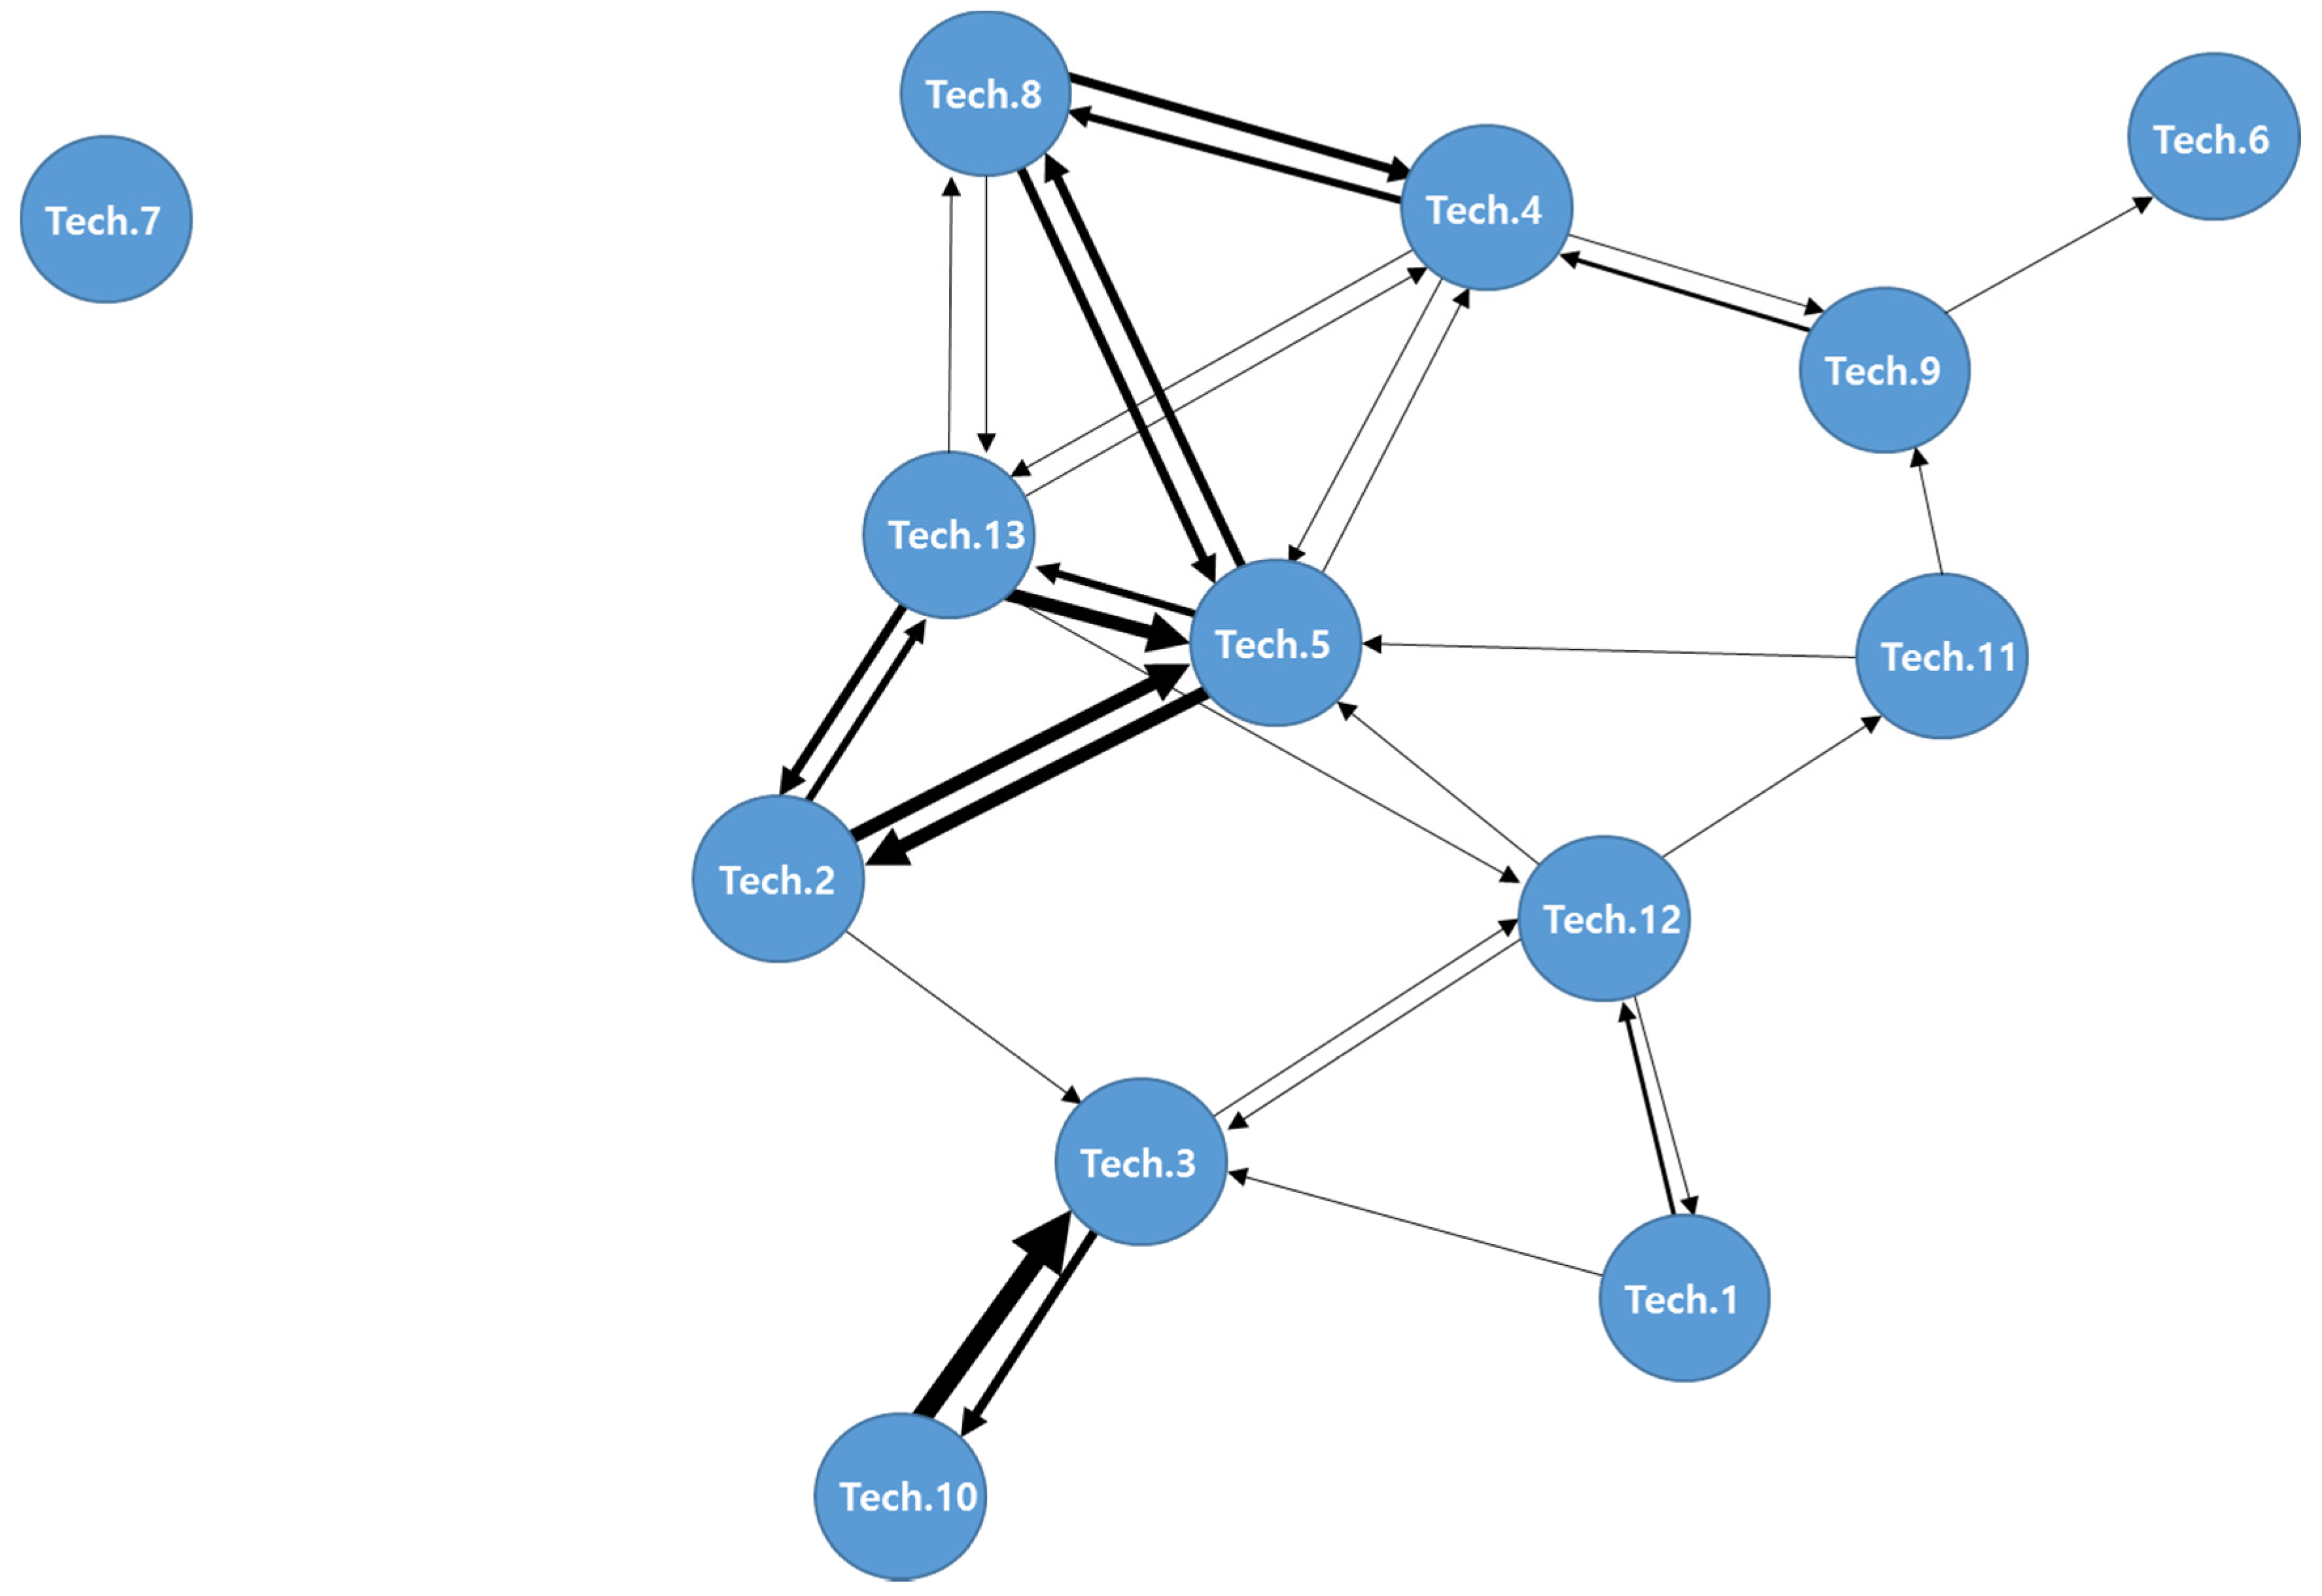
4.4. Combined Cross-Impact Analysis

4.4.1. Drawing Weighted Network Graph for Core Cross-Impact Matrix

The relationships between sub-technologies extracted using the core cross-impact matrix were visualized by a weighted network graph that represents the relationship of sub-technologies as edge’s direction and thickness.
According to Figure 4, Tech. 7 and Tech. 6 are considered to be independently developed while they do not have effects on other technologies. Thus, when the developments of those two technologies are considered, other technologies do not need to be considered. Conversely, Tech. 10 and Tech. 3 have the biggest effects on each other. Seeing the fact that the development of Patient rounding system technology has a big effect on the development of Remote station technology, the latter one seems to be the core technology for the former one. Thus, the increase of the demand of the patient rounding system technology is expected to lead to the increase of the demand of the remote system technology. It can be seen that Robotic vehicle technology located in the center of the graph is linked to the biggest number of technologies. This means that the technology is the complex related to various other technologies. Therefore, the current status of various other technologies should be considered when the R & D of the robotic vehicle technology is processed. In addition, it can be found out that the technology of autonomous driving using an AI robot is a critical issue in the current humanoid robot technology. There is also a remarkable point about path planning system (Tech. 12). Seeing that it is located in the center around robotic vehicle, depth map and gait system (Tech. 11), remote system and communication system (Tech. 1), it seems to be the core technology of the humanoid mobility system. Therefore, when the humanoid mobility system is under development, the development of the path planning system and its surrounding technologies such as robotic vehicle, depth map and gait system, remote system and communication system should be considered together.

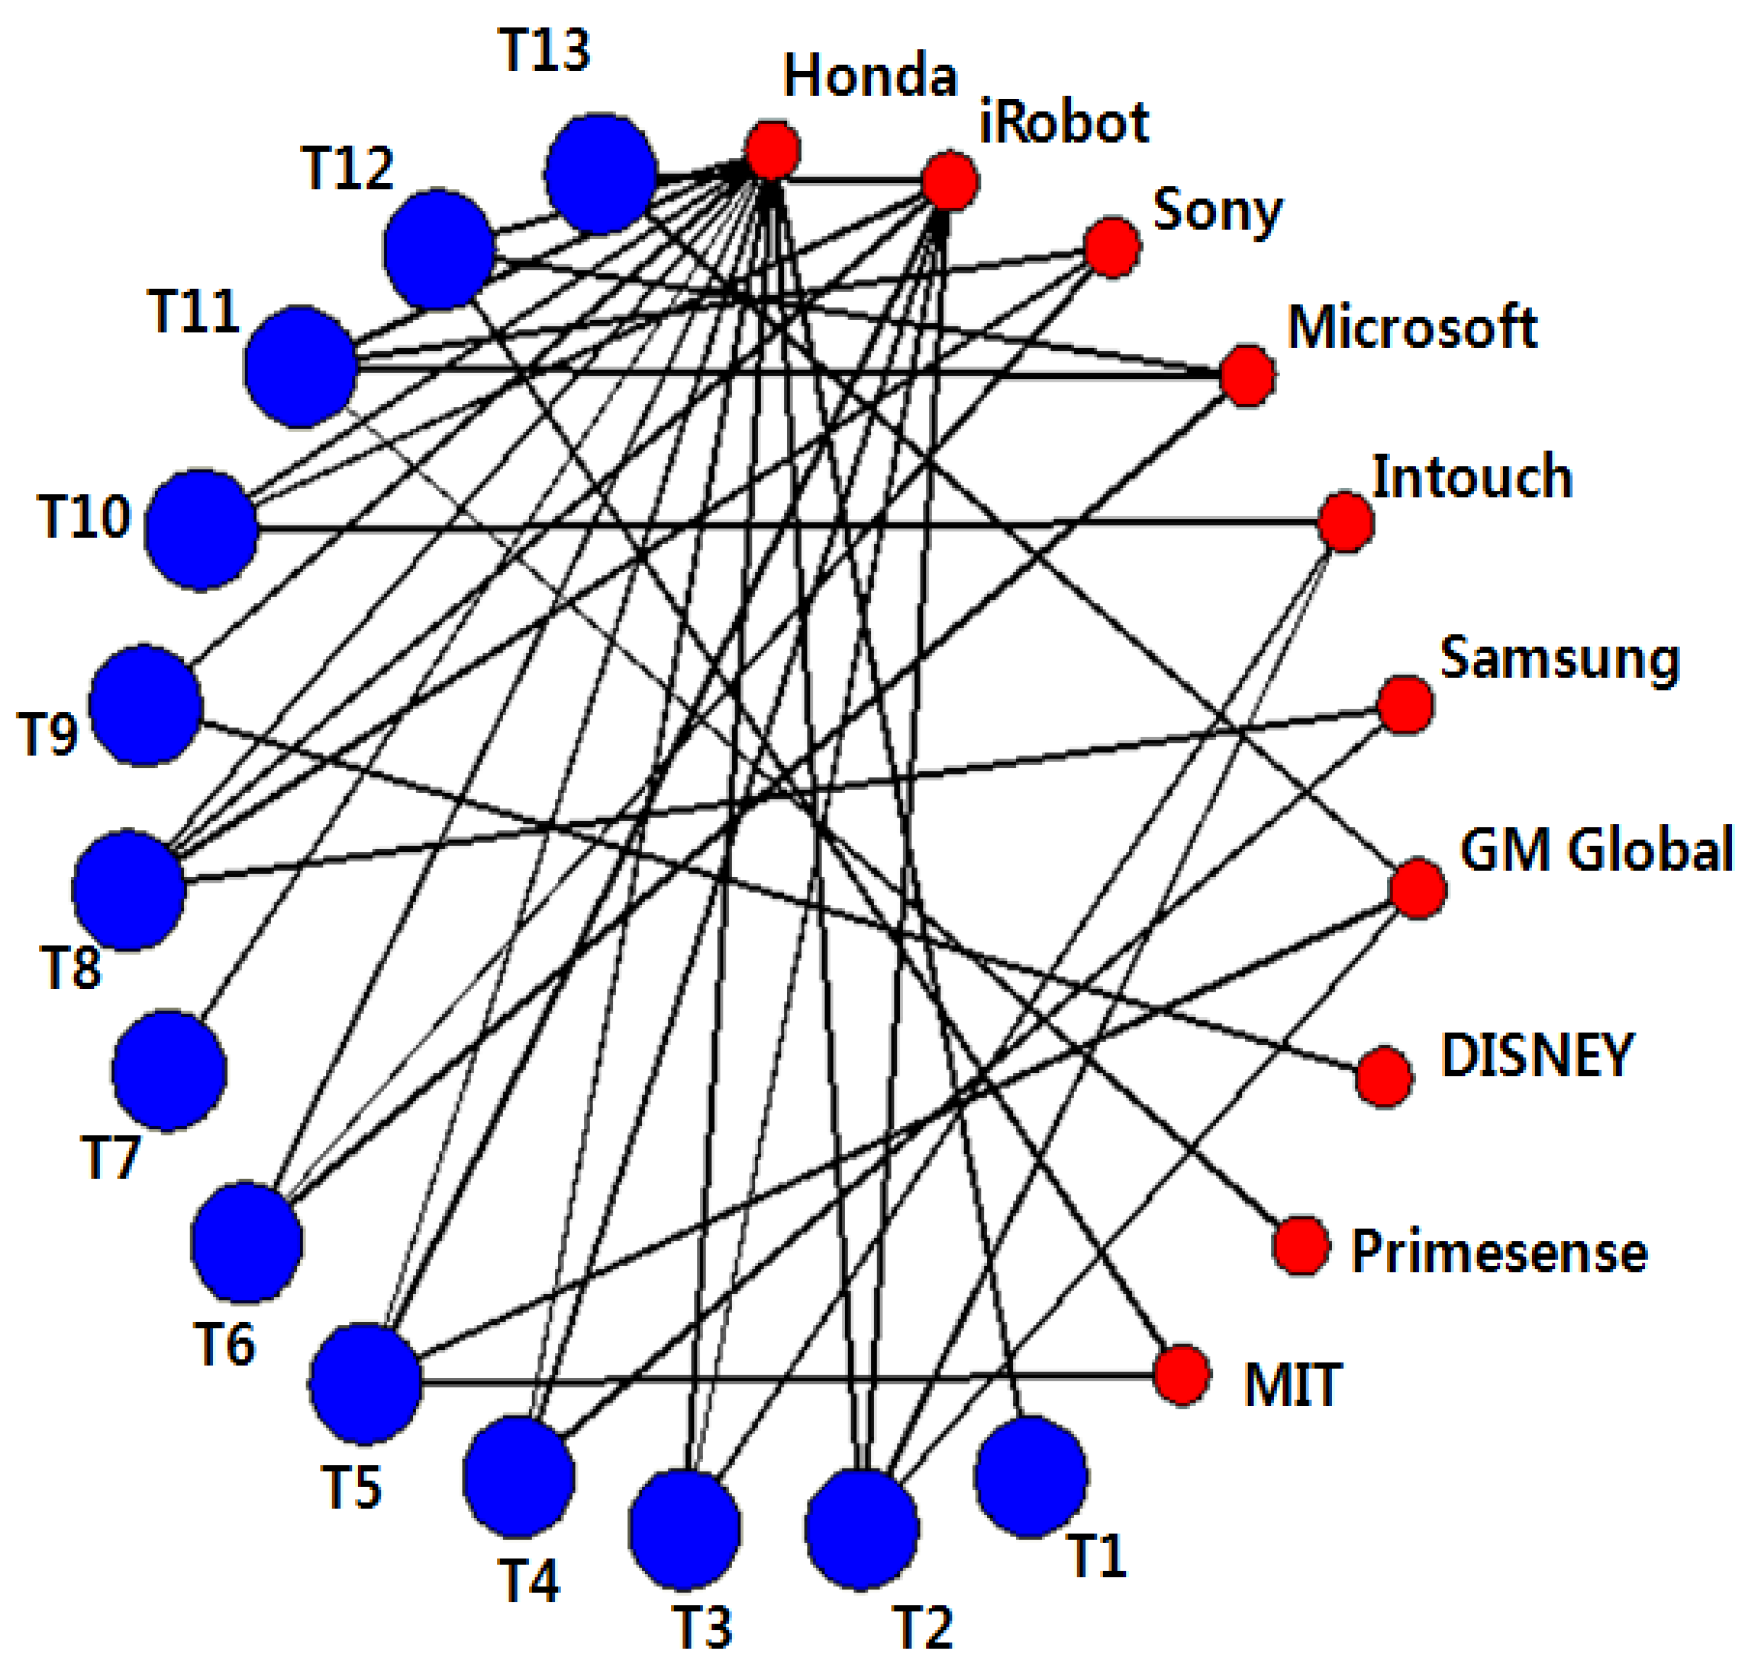
4.4.2. Drawing Bipartite Network Graph for Applicant-Sub-Technology Matrix

It is possible to understand the cross impacts and the relationships between technologies from the weighted network graph. It is also necessary to analyze the R & D companies to understand the current R & D situation of each technology, as shown in Table 7.
Table 8 shows the company–technology matrix to find out the technological area where each company focuses its R & D resource. Each cell presents the number of patents owned by each company.
The bipartite network graph was drawn based on the constructed cross-impact matrix in order to visualize and understand these companies, as shown in Figure 5.
It was possible to understand that Honda and iRobot actively developed various sub-technologies. Honda had many patents on almost every technological area except tech. 13(Cleaning robot system), while iRobot mostly concentrated on developing tech. 13. Other companies had patents on 1 to 3 sub-technologies each.

5. Conclusions

In this study, humanoid patents were collected to extract sub-technologies based on a topic model, and the patents were assigned to sub-technologies by TF-IDF. Then, a core cross-impact matrix was constructed using association rule mining and a keyword analysis. A weighted network was then constructed to visualize the cross impacts and the relationships between sub-technologies from the core cross-impact matrix. Additionally, a company–technology analysis was conducted and visualized using a bipartite network to understand the current R & D situation of each company. The patent analysis method presented in this study is useful for developing a sustainable MOT strategy, as it is possible to understand specific technologies. A technology consists of various types of sub-technologies that positively influence on each other. Therefore, it is strongly necessary to extract the relationships between these sub-technologies. Moreover, this paper provides additional insights into MOT by presenting a company’s R & D situation. In a further study, a simulation using the cross-impact matrix will be conducted to predict promising technologies over time.

Acknowledgments

This research was supported by Basic Science Research Program through the National Research Foundation of Korea (NRF) funded by the Ministry of Education (NRF-2015R1D1A1A01059742) and by the BK 21 Plus (Big Data in Manufacturing and Logistics Systems, Korea University).

Author Contributions

Kim designed this research and collected the data set for the experiment. Lee, Kim and Jang analyzed the data to show the validity of this study. Park wrote the paper and performed the entire research steps. In addition, all authors have cooperated with each other in revising the paper.

Conflicts of Interest

The authors declare no conflict of interest.

References

  1. Ting, C.H.; Yeo, W.H.; King, Y.J.; Chuah, Y.D.; Lee, J.V.; Khaw, W.B. Humanoid robot: A review of the architecture, applications and future trend. Res. J. Appl. Sci. Eng. Technol. 2014, 7, 1364–1369. [Google Scholar]
  2. You, B.J.; Oh, Y.H.; Choi, Y.J. Survey on humanoid researches. J. Korean Soc. Precision Eng. 2004, 21, 15–21. (In Korean) [Google Scholar]
  3. Lin, P.; Abney, K.; Bekey, G.A. Robot Ethics: The Ethical and Social Implications of Robotics; The MIT Press: Massachusetts, USA, 2012. [Google Scholar]
  4. Lee, S.; Kang, S.; Park, Y.S.; Park, Y. Technology roadmapping for R & D planning: The case of the Korean parts and material industry. Technovation 2007, 27, 433–445. [Google Scholar]
  5. Arora, A.; Gambardella, A. The market for technology. Handb. Econ. Innov. 2011, 1, 641–678. [Google Scholar]
  6. Gordon, T.J. Cross-impact matrices: An illustration of their use for policy analysis. Futures 1969, 1, 527–531. [Google Scholar] [CrossRef]
  7. Gordon, T.J.; Hayward, H. Initial experiments with the cross impact matrix method of forecasting. Futures 1968, 1, 100–116. [Google Scholar] [CrossRef]
  8. Mishra, S.; Deshmukh, S.G.; Vrat, P. Matching of technological forecasting technique to a technology. Technol. Forecast. Soc. Change 2002, 69, 1–27. [Google Scholar] [CrossRef]
  9. KIPRIS. Korea Intellectual Property Rights Information Service. Available online: http://www.kipris.or.kr (accessed on 10 May 2016).
  10. Korea Intellectual Property Office. Patent and Information Analysis (for Researchers); Gyungsung Book: Seoul, Korea, 2009. (In Korean) [Google Scholar]
  11. Tseng, Y.H.; Lin, C.J.; Lin, Y.I. Text mining technique for patent analysis. Inf. Processing Manage. 2007, 43, 1216–1247. [Google Scholar] [CrossRef]
  12. Fattori, M.; Pedrazzi, G.; Turra, R. Text mining applied to patent mapping: A practical business case. World Patent Inf. 2003, 25, 335–342. [Google Scholar] [CrossRef]
  13. Yoon, B.; Park, Y. A systematic approach for identifying technology opportunities: Keyword-based morphology analysis. Technol. Forecast. Soc. Change 2005, 72, 145–160. [Google Scholar] [CrossRef]
  14. Lee, S.; Yoon, B.; Park, Y. An approach to discovering new technology opportunities: Keyword-based patent map approach. Technovation 2009, 29, 481–497. [Google Scholar] [CrossRef]
  15. Jeong, G.H.; Kim, S.H. A qualitative cross-impact approach to find the key technology. Technol. Forecast. Soc. Change 1997, 55, 203–214. [Google Scholar] [CrossRef]
  16. Choi, C.; Kim, S.; Park, Y. A patent-based cross impact analysis for quantitative estimation of technological impact: The case of information and communication technology. Technol. Forecast. Soc. Change 2007, 74, 1296–1314. [Google Scholar] [CrossRef]
  17. Thorleuchter, D.; Van den Poel, D.; Prinzie, A. A compared R & D-based and patent-based cross impact analysis for identifying relationships between technologies. Technol. Forecast. Soc. Change 2010, 77, 1037–1050. [Google Scholar]
  18. Blei, D.M. Probabilistic topic models. Commun. ACM 2012, 55, 77–84. [Google Scholar] [CrossRef]
  19. Zhang, Y.; Zhang, G.; Chen, H.; Porter, A.L.; Zhu, D.; Lu, J. Topic analysis and forecasting for science, technology and innovation: Methodology with a case study focusing on big data research. Technol. Forecast. Soc. Change 2016, 105, 179–191. [Google Scholar] [CrossRef]
  20. Kotsiantis, S.; Kanellopoulos, D. Association rules mining: A recent overview. Int. Trans. Comput. Sci. Eng. 2006, 32, 71–82. [Google Scholar]
  21. Shih, M.J.; Liu, D.R.; Hsu, M.L. Mining change in patent trends for competitive intelligence. In Advances in Knowledge Discovery and Data Mining; Washio, T., Suzuki, E., Ting, K.M., Inokuchi, A., Eds.; Springer: Berlin, Germany, 2000; Volume 5012, pp. 999–1005. [Google Scholar]
  22. Kim, C.; Lee, H.; Seol, H.; Lee, C. Identifying core technologies based on technological cross-impacts: An association rule mining (ARM) and analytic network process (ANP) approach. Expert Syst. Appl. 2011, 38, 12559–12564. [Google Scholar] [CrossRef]
  23. Lee, B.; Jeong, Y.I. Mapping Korea’s national R & D domain of robot technology by using the co-word analysis. Scientometrics 2008, 77, 3–19. [Google Scholar]
  24. Rip, A.; Courtial, J. Co-word maps of biotechnology: An example of cognitive scientometrics. Scientometrics 1984, 6, 381–400. [Google Scholar] [CrossRef]
  25. Otte, E.; Rousseau, R. Social network analysis: A powerful strategy, also for the information sciences. J. Inf. Sci. 2002, 28, 441–453. [Google Scholar] [CrossRef]
  26. Yoon, J.; Choi, S.; Kim, K. Invention property-function network analysis of patents: A case of silicon-based thin film solar cells. Scientometrics 2010, 86, 687–703. [Google Scholar] [CrossRef]
  27. Silver, D.; Huang, A.; Maddison, C.J.; Guez, A.; Sifre, L.; van den Driessche, G.; Schrittwieser, J.; Antonoglou, I.; Panneershelvam, V.; Lanctot, M.; et al. Mastering the game of Go with deep neural networks and tree search. Nature 2016, 529, 484–489. [Google Scholar] [CrossRef] [PubMed]
  28. One Hundred Year Study on Artificial Intelligence (AI100). Available online: http://ai100.stanford.edu/ (accessed on 10 May 2016).
  29. Choi, J.; Jang, D.; Jun, S.; Park, S. A predictive model of technology transfer using patent analysis. Sustainability 2015, 7, 16175–16195. [Google Scholar] [CrossRef]
  30. Kim, S.; Jang, D.; Jun, S.; Park, S. A novel forecasting methodology for sustainable management of defense technology. Sustainability 2015, 7, 16720–16736. [Google Scholar] [CrossRef]
  31. Rousseeuw, P.J. Silhouettes: A graphical aid to the interpretation and validation of cluster analysis. J. Comput. Appl. Math. 1987, 20, 53–65. [Google Scholar] [CrossRef]
Figure 1. Procedure of proposed method.
Sustainability 08 00474 g001
Figure 2. Cross-impact matrix based on association rule mining. (Tech.: Technology).
Sustainability 08 00474 g002
Figure 3. Cross-impact matrix based on keyword analysis. (Tech.: Technology).
Sustainability 08 00474 g003
Figure 4. Weighted network graph for core Cross-impact matrix. (Tech.: Technology).
Sustainability 08 00474 g004
Figure 5. Bipartite network graph for company–technology matrix. (T: Technology).
Sustainability 08 00474 g005
Table 1. Patent acquisition.
DatabaseKeywordPeriodNationPatentsNoise DataValid Data
WipsHumanoid–Dec. 27th, 2015US100099901
Wips is the name of patent database.
Table 2. Average value of silhouette width by a number of topics.
X = 4X = 5X = 6X = 7X = 8X = 9X = 10X = 11X = 12X = 13
0.030.040.050.060.070.070.080.080.090.094
X = 14X = 15X = 16X = 17X = 18X = 19X = 20X = 21X = 22X = 23
−0.0030.0050.010.0160.02150.0260.0340.038−0.052−0.048
X = 24X = 25X = 26X = 27X = 28X = 29X = 30X = 31X = 32X = 33
−0.043−0.039−0.35−0.03−0.025−0.02−0.015−0.011−0.007−0.003
X = 34X = 35X = 36X = 37X = 38X = 39X = 40X = 41X = 42X = 43
0.0010.0040.0080.01270.01690.02060.02250.02670.02980.0233
Table 3. Derived topics, keywords and technology definition.
TopicKeywordsTechnology
1Messag, sender, voic, multimedia, surgic, microphone, document, invas, text, entity, audio, emoticon, invari, entity, instrumentCommunication System
2Platform, fall, articul, assemble, shoulder, phantom, dphm, widget, organ, tendon, heterogen, traction, depthbas, anthropomorph, centermassRobot Joint
3Station, section, speech, event, nois, line, convers, water, quiet, acoust, status, face, overhead, session, genomRemote Station
4Member, ball, guid, finger, bin, terrain, cooper, panorama, popul, cohort, bar, puzzl, counterbalance, cross, performedRobot Finger
5Assembl, wheel, acceler, spring, rotary, vehicle, imped, gripper, air, flexion, transmitt, articular, candi, lingual, plantarRobotic Vehicle
6Trunk, knowledge, touchscreen, hiup game, test, crane, neck, salienc, driver, item, loop, class, figurin, cordKnowledge-based Robot
7Emot, attent, tactil, easi, tag, physiology, scanner, array, illus, good, transit, stimulus, frequenc, marker, nervousTactile Sensor
8Softwar, layer, hal, hardwar, finger, seat, media, grip, rnn, beam, vehicle, wheel, emphas, context, passingHardware Abstraction Layer
9Pose, energy, key, exoskeleton, nonhumanoid, beat, music, slide, pipe, guid, cuff, telescop, teach, metal, descriptorEnergy Management and Sound System
10Patient, station, batteri, gateway, breast, framework, bound, beacon plate, charg, engine, status, bridg, bright, acquisitPatient Rounding System
11Depth, target, zmp, gait, ann, question, shell, rout, bone, appendage, isol, grasp, bag, geography, cloudDepth Map and Gait System
12Anim, path, node, entity, file, face, extens, mesh, flexion, soft, creation, tissue, graph, share, brakePath Planning System
13Clean, fluid, subsystem, debri, avatar, assembl, world, zone, term, cash, channel, core, roller, avatars, floorcleanCleaning Robot System
Table 4. Patent-technology matrix.
PatentsTech. 1Tech. 2Tech. 13
1011
2010
776000
Tech.: Technology.
Table 5. Result of keyword analysis.
Tech. 1Tech. 2Tech. 3Tech. 4Tech. 5Tech. 6Tech. 7Tech. 8Tech. 9Tech. 10Tech. 11Tech. 12Tech. 13
Tech. 16.6050.0991.0250.3210.0860.2720.3830.1480.6050.5060.1982.0120.049
Tech. 20.174.1060.7160.5962.3050.2620.1350.5110.2550.6450.5250.4972.234
Tech. 30.7730.6333.9870.140.4070.240.2070.20.441.8070.1671.120.46
Tech. 40.2880.5860.2974.4960.7840.2790.4051.271.2430.2610.2610.4690.991
Tech. 50.0952.1570.4010.7964.1220.3060.152.320.3740.0950.6050.4692.395
Tech. 60.160.4430.6320.1420.4153.2260.160.3490.4150.1040.5190.9530.943
Tech. 70.4220.1770.520.4120.2260.4413.4220.430.1080.2840.0190.3820.284
Tech. 80.4260.7540.2871.7871.6890.320.3444.910.2210.1310.2790.3031.254
Tech. 90.40.520.381.40.470.720.240.344.220.310.650.450.93
Tech. 100.7840.4692.3780.1620.1710.2070.1440.2160.3424.6670.1080.270.441
Tech. 110.0850.3860.2420.340.5880.2480.0260.2880.7580.0524.3920.4120.118
Tech. 122.2520.1621.0360.4870.7840.4870.4230.2071.6040.4780.9015.180.225
Tech. 130.1312.1310.5161.2542.1890.1970.2380.8850.1970.730.1890.1976.762
Tech.: Technology.
Table 6. Core cross-impact matrix.
Tech. 1Tech. 2Tech. 3Tech. 4Tech. 5Tech. 6Tech. 7Tech. 8Tech. 9Tech. 10Tech. 11Tech. 12Tech. 13
Tech. 1100.29000000000.3720
Tech. 2010.28900.54300000000.364
Tech. 30010000000.41300.2080
Tech. 400010.246000.3490.2940000.235
Tech. 500.50900.2061000.4300000.383
Tech. 60000010000000
Tech. 70000001000000
Tech. 80000.4010.43600100000.237
Tech. 90000.31700.2090010000
Tech. 10000.6190000001000
Tech. 1100000.2040000.2050100
Tech. 120.28900.27600.2080000.29700.20910
Tech. 1300.4900.2950.521000.240000.221
Tech.: Technology.
Table 7. Leading companies extracted.
RankingCompanyPatents
1Honda Research Institute Europe GmbH100
2iRobot Corporation77
3Sony Corporation48
4Microsoft Corporation41
5InTouch Technologies, Inc.39
6Samsung Electronics26
7GM Global Technology Operations, Inc.20
8Disney Enterprises, INC., A Delaware Corporation19
9Primesense Ltd.17
10Massachusetts Institute of Technology16
Table 8. Company–technology matrix.
T1T2T3T4T5T6T7T8T9T10T11T12T13
Honda1723301513111017151336100
iRobot014191034002902500117
Sony0000018017001600
Microsoft0000014000032110
Intouch0143800000044000
Samsung000250001100000
GM0170021000000013
Disney00000000210000
Primesense00000000001700
MIT000025000000100
T: Technology.

