Article

Changes in CO2 Emissions Induced by Agricultural Inputs in China over 1991–2014

Key Laboratory of Land Surface Pattern and Simulation, Institute of Geographic Sciences and Natural Resources Research, Chinese Academy of Sciences, Beijing 100101, China
Sustainability 2016, 8(5), 414; https://doi.org/10.3390/su8050414
Submission received: 8 December 2015 / Revised: 11 April 2016 / Accepted: 22 April 2016 / Published: 26 April 2016

Abstract

:
Increase in CO2 emissions induced by agricultural inputs in China since its socialist market economic reforms may hinder its sustainable economic development. More attention has been paid to changes in agricultural land use and overall land use benefit; however, relatively less attention has been paid to changes in CO2 emissions induced by agricultural inputs in China since the reforms. The carbon footprint (CF) variation for total agricultural production, the effects of different inputs on the total CF, and the changes in carbon intensity of the agricultural production system were analyzed using national level agrochemical and energy inputs data for the period 1991 to 2014. The total CF had a fluctuating upward trend, which was mainly affected by increases in nitrogen fertilizer input and energy consumption. The carbon intensity in production decreased, which indicated that the agricultural output value per unit of carbon cost gradually increased according to the market demands. However, the increase in agricultural output value per unit of carbon cost cannot outweigh the potential environmental risks induced by the increase in total carbon footprint per unit area of agricultural land. The improvements promoted by the related agricultural policies in China should aim to strike a balance between agricultural economy development and low carbon intensity in area.

1. Introduction

Human influence on the climate system is clear, and recent anthropogenic emissions of greenhouse gases (GHGs) are the highest in history [1]. Atmospheric CO2 concentration is rising, due primarily to fossil-fuel combustion, cropland expansion onto grassland, grassland degradation, and deforestation [2,3,4]. Human-induced emissions of carbon dioxide or greenhouse gases, expressed in CO2 equivalents and by the carbon footprint (CF), have attracted worldwide attention because of their important effects on the environment and global warming. In order to reduce CO2 emissions caused by production and consumption and develop a low carbon economy, CF assessment has been gradually approved and used by many industrial enterprises and areas [5,6,7]. It is also commonly used to assess the impact of household and agricultural CO2 emissions [8,9,10].
Traditional agriculture mainly relied on renewable resources, such as organic fertilizers and human and animal power. However, modern agriculture is more reliant on non-renewable resources, such as agrochemicals and fossil fuels. This has meant that global agriculture is now regarded as one of the largest emitters of GHGs in the world [10]. Attempts to identify the potential risks associated with high carbon agriculture and ways of developing low carbon agricultural production systems have relied on quantifying the CF. Previous studies have also investigated sustainable agricultural production, ways of reducing agricultural carbon emissions, and potential improvements to the environment by using CF assessments to develop new agricultural input plans, technologies, and management strategies [9,10,11,12].
Rapid economic development is usually accompanied by highly intensive fossil energy combustion and increased use of industrial processes, which are the most important anthropogenic sources of the greenhouse gases [13], especially in developing countries. China is the largest developing and agricultural country in the world. Modern agriculture in China has developed rapidly since the formally economic reforms in the early 1990s, which transformed its planned economy into a socialist market economy. China surpassed the U.S., the largest developed country, in 2006 as the largest national source of CO2 emissions [14], and agriculture has become one of the most important anthropogenic sources of CO2 emissions in China. Agrochemical and energy inputs are needed to promote agricultural production and consolidate agriculture’s position in the national economy [15]. However, there has been little research on the CF caused by agriculture and how it is affected by agrochemical and energy inputs.
Agrochemical and energy inputs are mainly used on agricultural lands with high use benefits, such as cropland and orchards [16,17]. Cropland has always changed due to the conversion of high quality cropland to construction land for greater land use benefits, mainly in the economically developed eastern China, the expansion of cropland onto grassland for food security before the Grain for Green Policy in 1999, and the conversion of marginal cropland to forest or grassland for ecological security after the Grain for Green Policy in 1999, mainly in the ecologically vulnerable Western China [18,19,20]. Cropland has decreased in China since 2000, which is regarded as one of the chief threats to the nation’s food security. To increase agricultural production and the income of farmers, a series of supporting agriculture policies were launched after 2004 in order to relieve the negative influence of the cropland loss on agricultural production. For example, the agricultural tax was abolished in 2006, and agricultural policy objectives were gradually changed from the original “levying more, subsidizing less” to “levying less, subsidizing more” [21]. The implementation of the related land use policies has considerably changed the structure of rural agriculture in China since the early 1990s. It has also had an impact on indirect and direct CO2 emissions because the agricultural changes have affected agrochemical and agricultural energy inputs. It is therefore essential to investigate CO2 emission trends and agricultural carbon efficiency after China has formally reformed its socialist market economic system.
The objectives of this study were to: (1) map the total CF variation over time for Chinese agricultural production in order to show how the agricultural intensification affected total CO2 emission trends; (2) investigate the effects of different inputs on the total CF trend in order to identify the main factors affecting CO2 emissions; and (3) assess agricultural output value and carbon intensity in order to evaluate the potential reductions in GHGs emissions. Finally, this paper makes some suggestions that should promote low carbon agricultural development and improve the related agricultural policies in China.

2. Data Collection and Methodology

2.1. Data

The agrochemical inputs data (fertilizers, pesticides, and plastic film) and the agricultural output values and their indexes for China were sourced from the China Rural Statistical Yearbook series for the period 1991–2014 [17]. The change in the agricultural land area was based on the data from FAO statistics [22]. The data for the main agricultural energy inputs (raw coal, washed coal, coke, gasoline, diesel, and electricity) were collected from the China Energy Statistical Yearbook series for the period 1991–2014 [23].

2.2. Methods

The CF for agricultural production was assessed by considering the total GHGs emissions in carbon equivalents (CE) for each year’s production. The agricultural production carbon costs mainly consist of emissions from the manufacture of the agrochemicals applied and from the energy directly consumed by agriculture. Cheng et al. [10] suggested that direct N2O emissions from agricultural lands, caused by chemical fertilizer-N application, made a significant contribution to the total GHG emissions, so this was also taken into account. Thus, carbon cost induced by N fertilizer use consisted of indirect CO2 emissions from N fertilizer manufacture and direct CO2 emissions (equivalents) from N fertilizer application-induced N2O. The CO2 emissions due to agricultural infrastructure were not considered in the CF analysis.
The individual carbon cost for agricultural production was calculated using the following equation:
Carbon cost = Emission source input × Emission factor
where “Carbon cost” represents the CO2 emissions caused by a certain input from an agricultural production emission source in tCE; “Emission source input” is the applied amounts of N, P, and K fertilizers, pesticide, plastic film, raw coal, washed coal, coke, gasoline, or diesel in tons or the consumption of electricity in MWh (1 MWh = 103 kWh); and the “Emission factor” is the individual carbon intensity in tCE per unit mass (ton) or per MWh caused by individual agricultural inputs. The yearly emission factor for electricity was based on the study by Huo et al. [24]. The emission factors used in this study are listed in Table 1.
The carbon cost caused by direct N2O emissions induced by chemical N fertilizer inputs was calculated using the following equation:
CN = N × EFN × 44/28 × 298 × 12/44
where CN represents the direct N2O emissions from N fertilizer application (in tCE); N represents the amount of N fertilizer (t) applied; EFN represents the emission factor for N2O emissions caused by N fertilizer application (tN2O–N t−1N fertilizer); 44/28 is the molecular conversion factor of N2 to N2O; 298 is the net global warming potential (GWP) over a 100-year period; and 12/44 is the molecular conversion factor of CO2 to C [10,29].
The total CF estimation for agricultural production was calculated by considering all of the individual carbon costs listed in Table 1. The formula used was:
CF = CF + CN + CP + CPF + CC + CG+ CD + CE
where CF, CN, CP, CPF, CC, CG, CD, and CE represent the individual carbon costs due to fertilizer inputs (N, P, and K fertilizers), direct N2O emissions from N fertilizer application, pesticides, plastic films, coal, gasoline, diesel, and electricity, respectively.
Carbon intensity was defined as the total emissions induced with production in a unit output value of agricultural production or a unit area of agricultural land, which was used to reflect the impact of agricultural land use on GHG emissions and the cost-effectiveness at the expense of CF for a production system [10]. The carbon intensity in production (CIP) was calculated by dividing the total CF by the agricultural output value for that respective year. The equation used was:
CIP = CF/AOV
where CIP is carbon intensity in production, CF is total carbon footprint caused by agricultural inputs, and AOV is the agricultural output value. The AOV was recalculated based on the constant price in 1991 (the first year of the study period) and the agricultural output value index (Supplementary Materials). The agricultural output value includes output values for crop production, forestry, animal husbandry, and fishing, because agrochemicals and agricultural energy are needed by the entire agricultural production system. Carbon efficiency was defined as the agricultural output value per unit of carbon cost. Carbon intensity in area (CIA) was calculated by dividing the total CF by the agricultural land area for that respective year. The equation used was:
CIA = CF/AL
where CIA is carbon intensity in area, CF is total carbon footprint caused by agricultural inputs, and AL is the agricultural land area.

3. Results

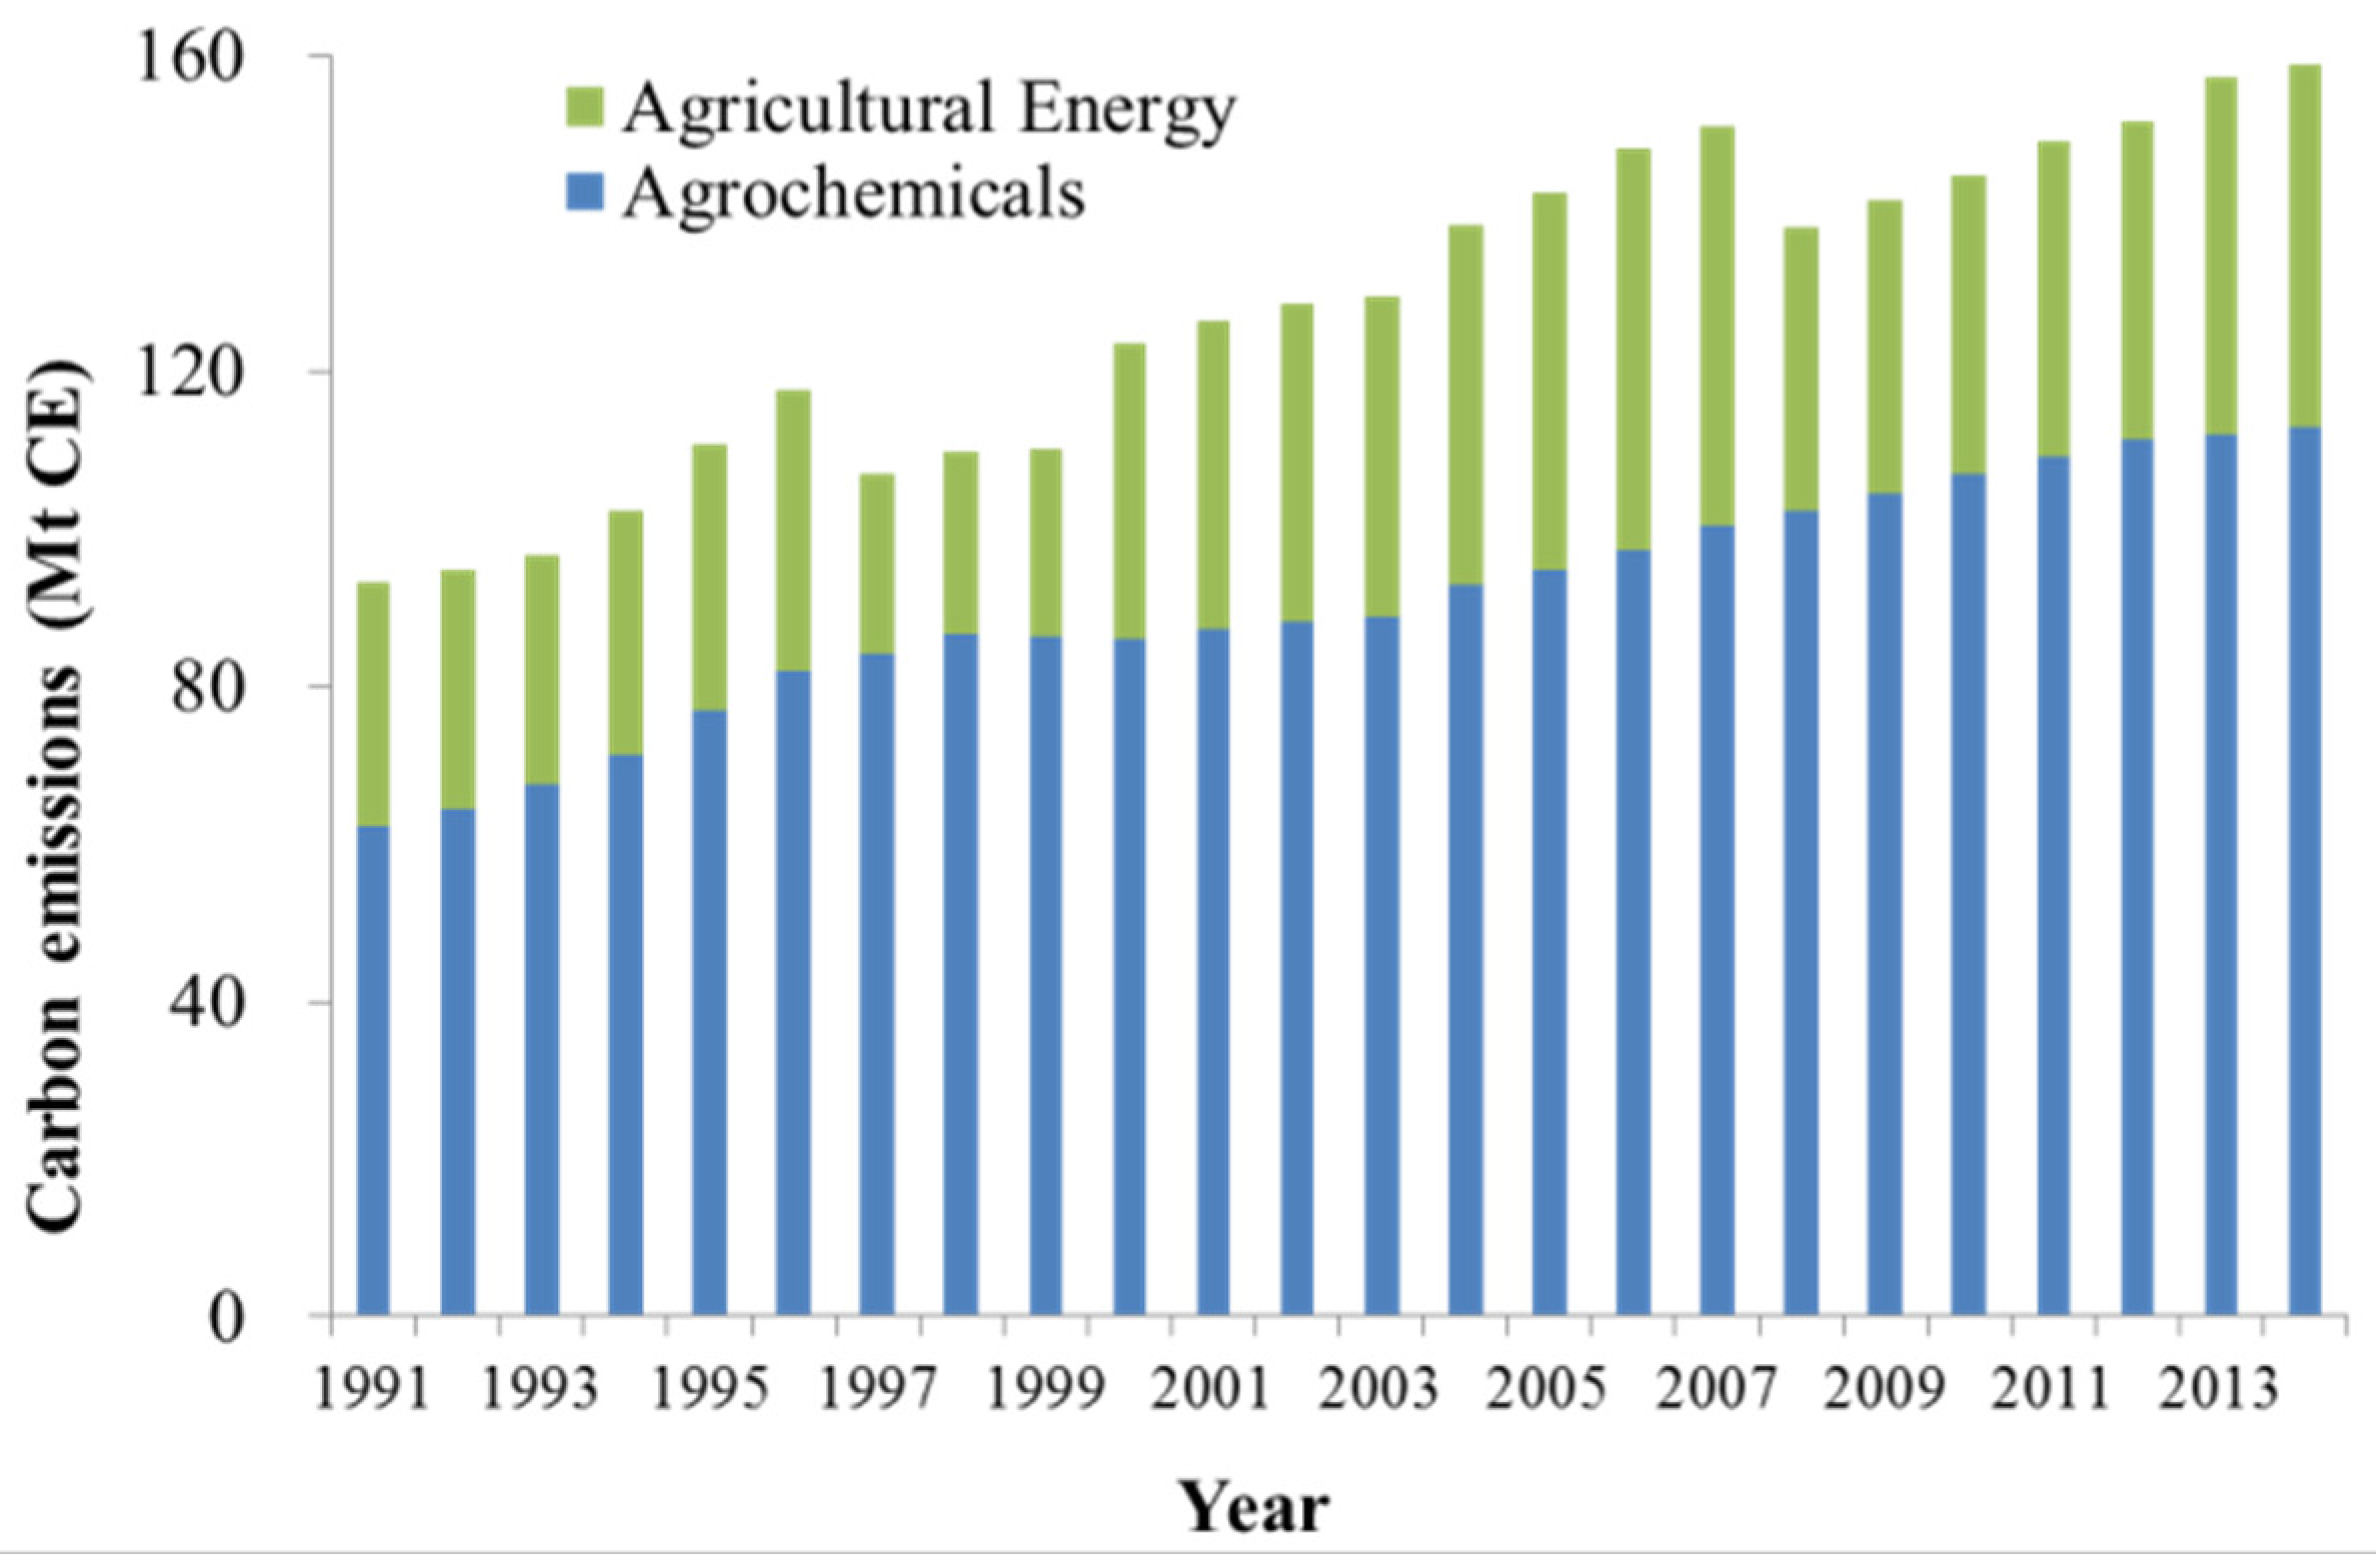
3.1. Total CF Variation over Time for Chinese Agricultural Production

The total CF for Chinese agricultural production had a fluctuating upward trend. The total CF caused by agrochemical inputs (fertilizers, pesticides, and plastic film) and energy inputs (raw coal, washed coal, coke, gasoline, diesel, and electricity) increased from 93.29 Mt CE (1 Mt = 106 t) in 1991 to 158.93 Mt CE in 2014, with an average of 127.96 Mt CE and an annual growth rate of 2.9% (Figure 1 and Table 2). The total CF trend could be roughly divided into three time periods, i.e., 1991–1999, 2000–2007, and 2008–2014 (Figure 1). The total CF unsteadily increased during the first period, with an average of 104.59 Mt CE and a lower annual growth rate of 2.0%. It obviously increased during the second period, with an average of 136.01 Mt CE and a higher annual growth rate of 2.8%, and linearly increased during the third period, with an average of 148.79 Mt CE and an annual growth rate of 2.2%. Two abnormally high values could be found in 1995 and 1996, and distinct changes in the total CF occurred in 2000 and 2008.

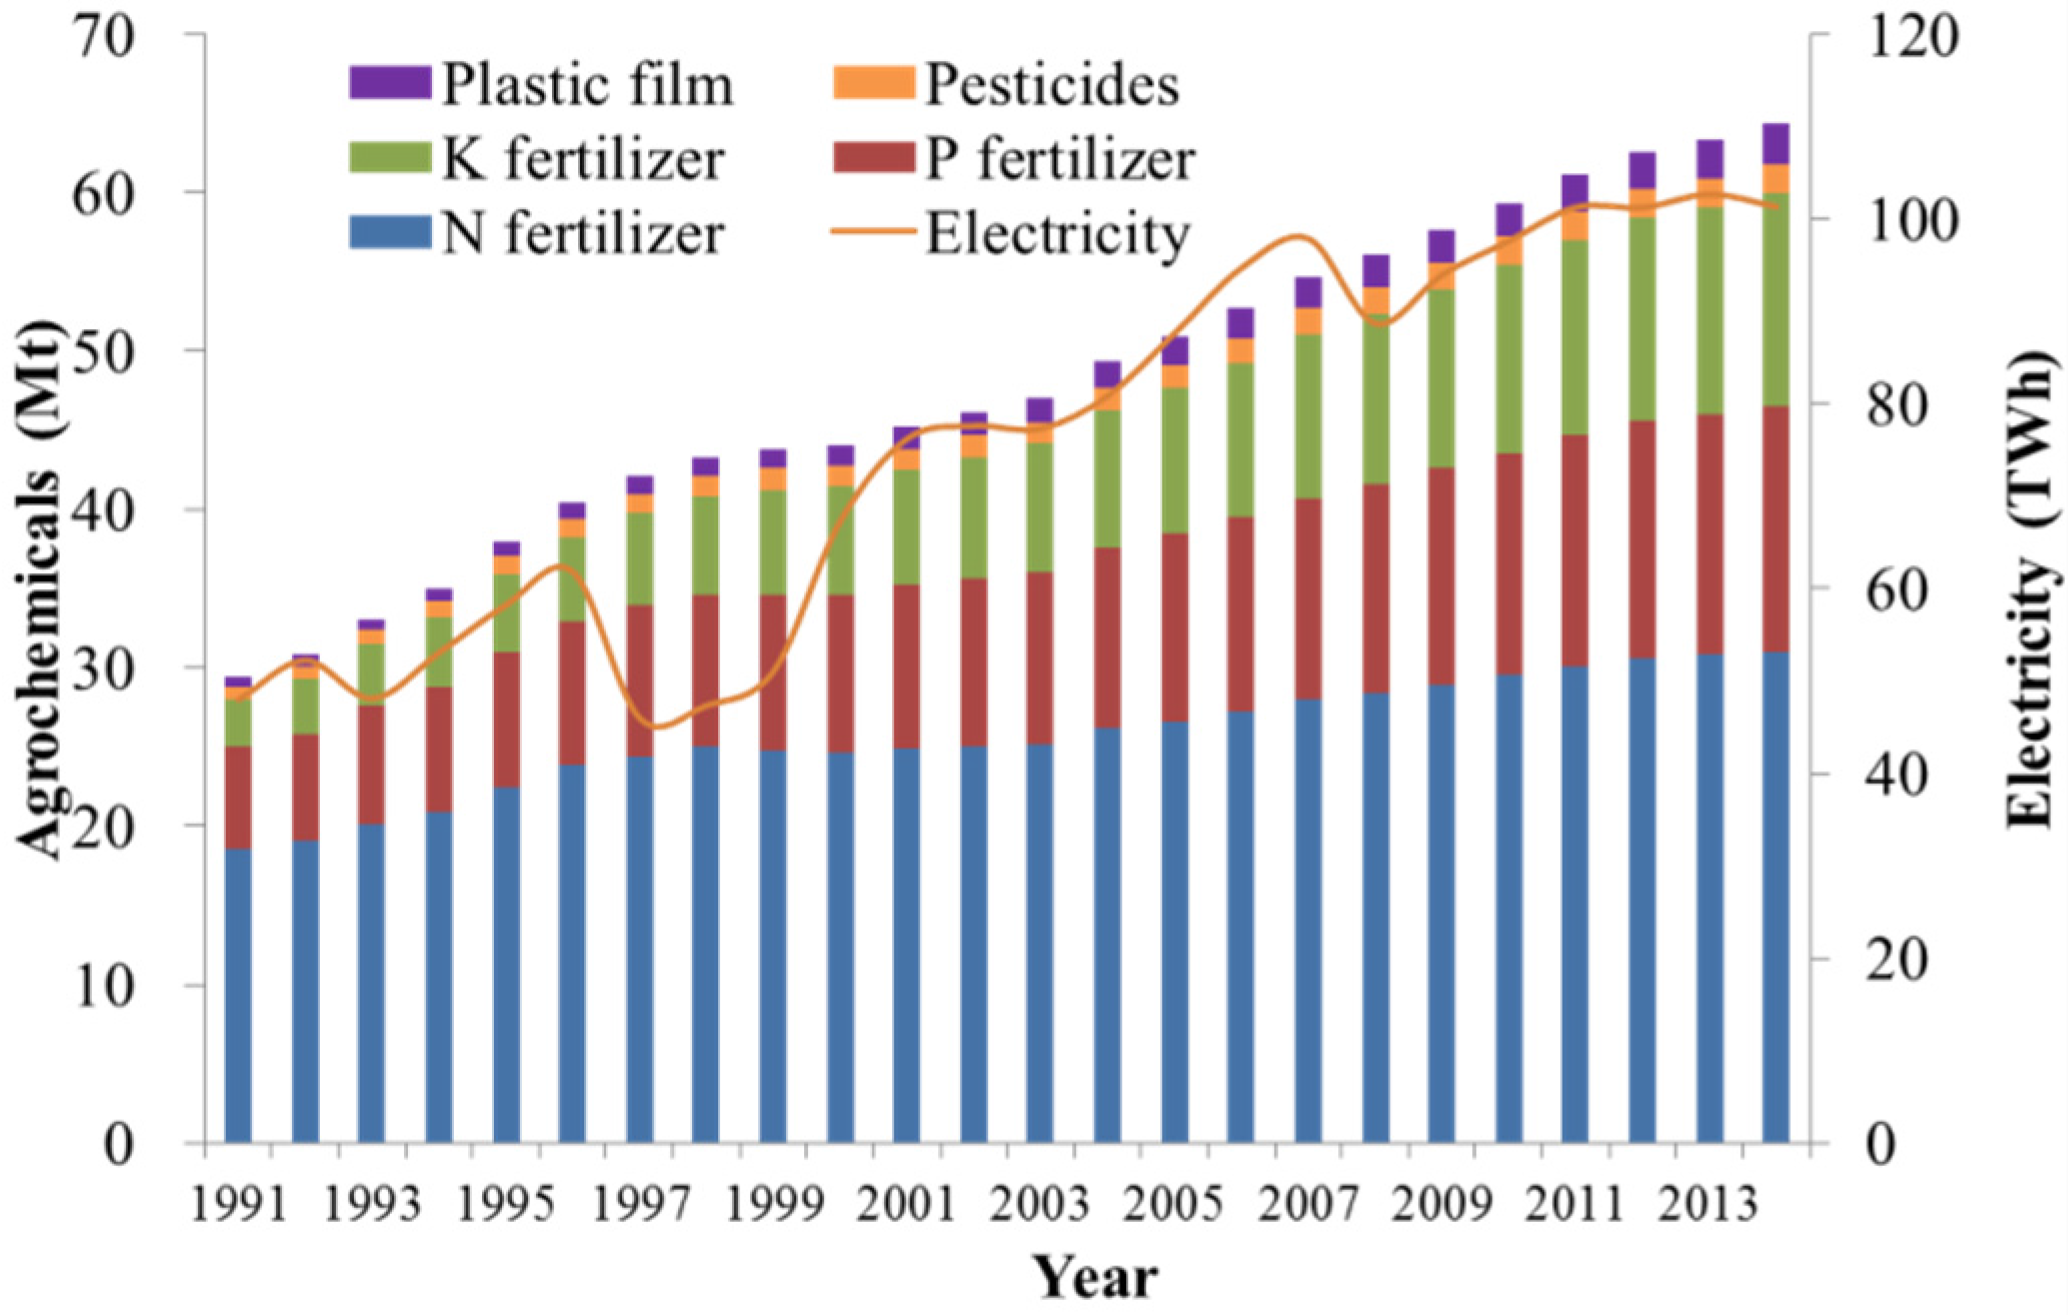
3.2. Effects of Different Inputs on Total CF

The average percentage CO2 emissions caused by different agricultural input contributions to the total CF from 1991 to 2014 were calculated, and the percentage contribution order was N fertilizer (58.81%) > electricity (12.17%) > diesel (7.96%) > coal (7.31%) > pesticides (6.36%) > plastic film (3.07%) > P fertilizer (1.71%) > gasoline (1.10%) > K fertilizer (0.93%). The average percentage contributions of the different inputs to the total CF over the study period indicated that chemical fertilizers and energy consumption contributed 90.58% to the total CF, while pesticides and plastic film accounted for only 9.42% (Table 3). CO2 emissions induced by fertilizer use accounted for 61.45%, on average, of the total CF, of which about 58.81% was contributed by N fertilizer use. This consisted of 35.11% indirect CO2 emissions from N fertilizer manufacture and 23.71% direct CO2 emissions from N fertilizer application-induced N2O. Direct CO2 emissions from energy consumption contributed 29.12% to the total CF, of which 12.17%, 9.06%, and 7.90% were contributed by electricity, fuel oil, and coal use, respectively.
The CF trend was mainly determined by CO2 emissions induced by N fertilizer input and energy consumption. Table 2 shows that the N fertilizer percentage contribution had the following period order: 1991–1999 > 2008–2014 > 2000–2007. In comparison, the order for the percentage contribution by energy use was 2000–2007 > 1991–1999 > 2008–2014. It is clear that more agricultural energy, especially electricity and diesel, was used to increase the land productivity during the second period.
The absolute contributions of indirect CO2 emissions from K fertilizer, plastic film, pesticides, and P fertilizer to total CF were relatively small. However, their relative growth rates were higher than those from N fertilizer and agricultural energy (Table 3). They increased in the order K fertilizer > plastic film > P fertilizer > pesticides when the 1991 data for carbon costs was used as the base standard.

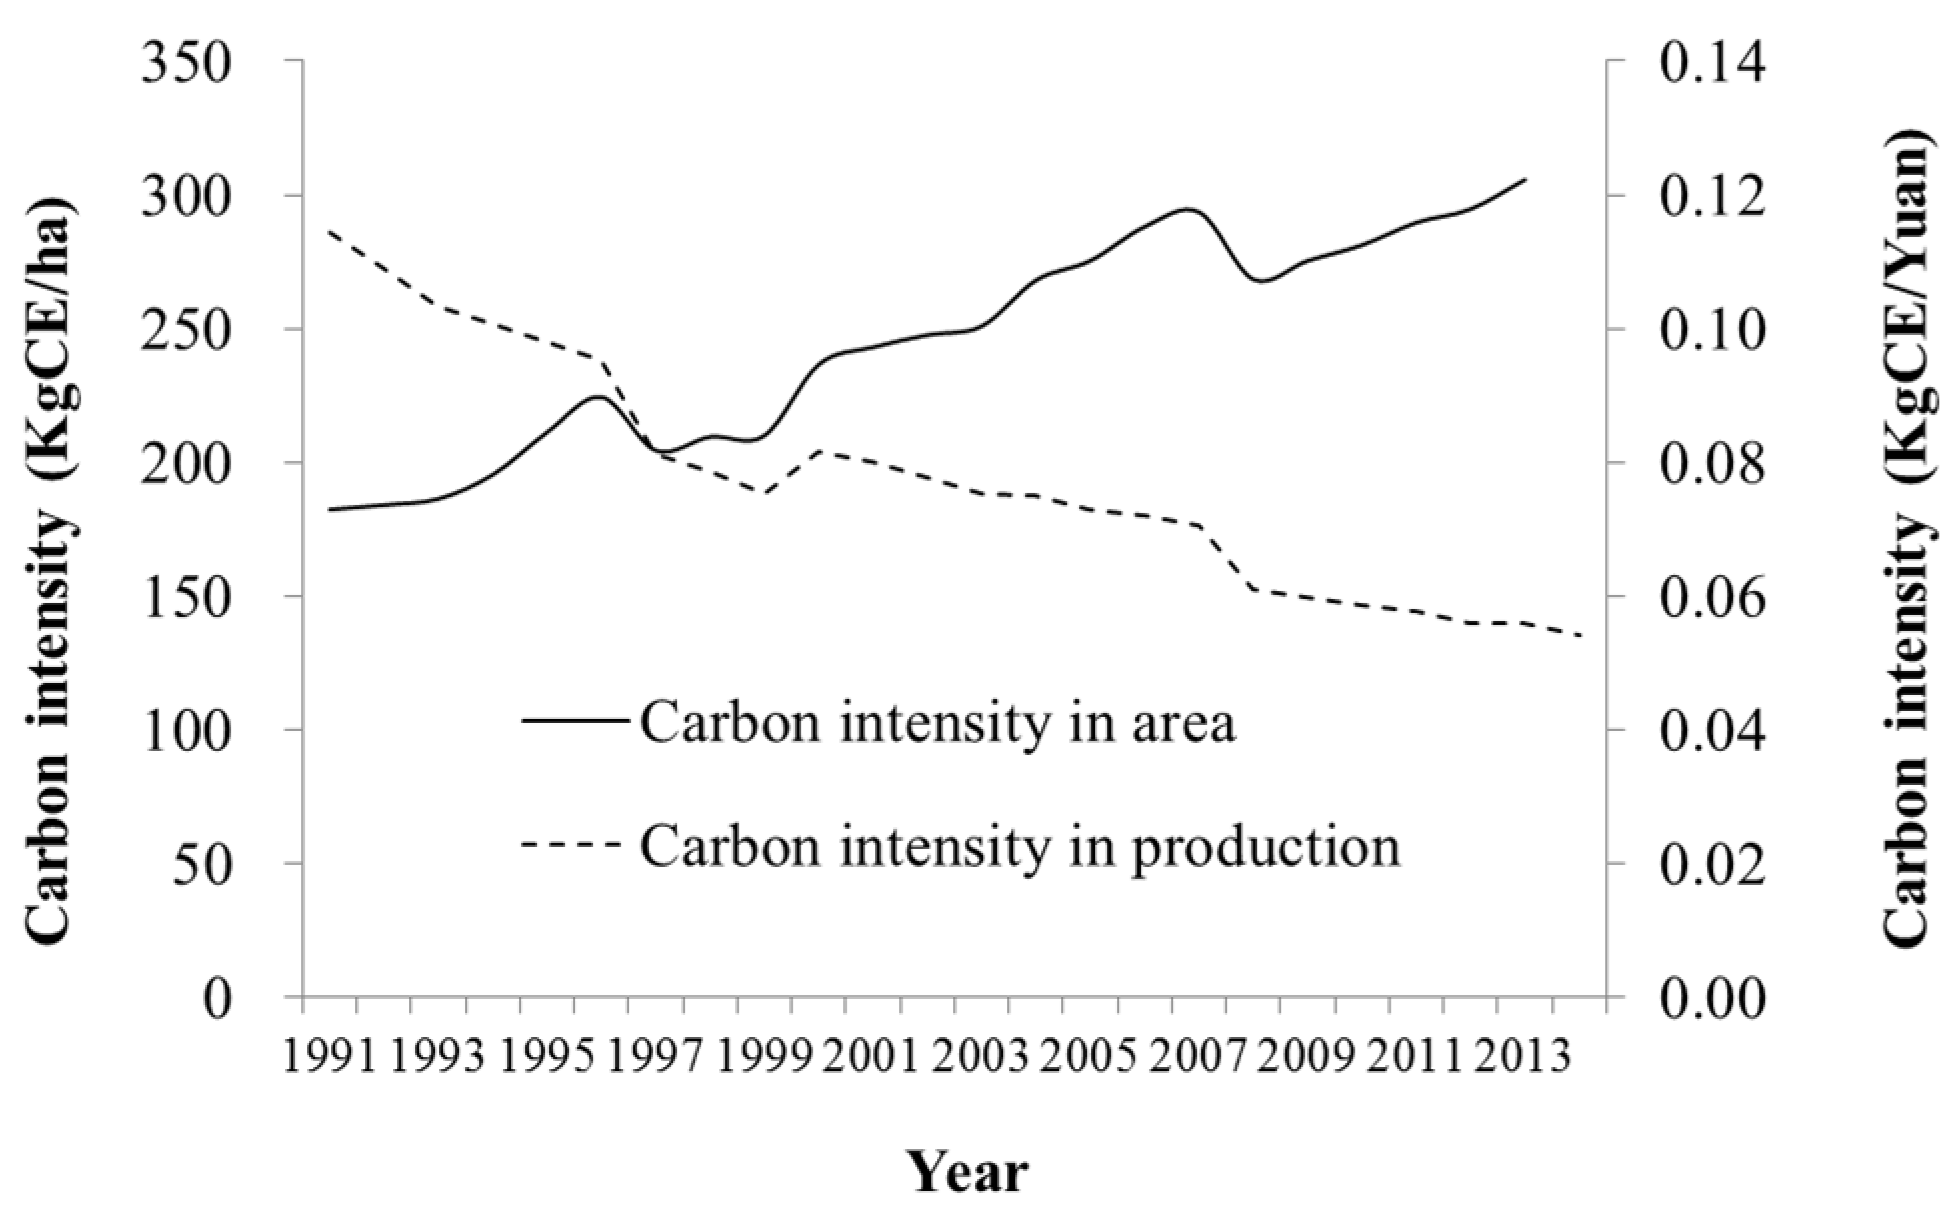
3.3. Agricultural Output Value and Carbon Intensity

The agricultural output value in China gradually increased from 0.82 TCNY in 1991 to 2.93 TCNY in 2014, with an annual increase rate of 88.2 billion CNY. The agricultural output value increased at a faster rate than total CF in China, which led to the CIP declining from 0.114 kg CE/CNY in 1991 to 0.054 kg CE/CNY in 2014 (Figure 2). The CIP curve was convex between 2000 and 2007, which was due to the higher energy inputs during that period. The decrease in CIP indicated that agricultural land use was restructured and effectiveness of agricultural inputs was gradually improved according to the market demands, which subsequently led to improved carbon efficiency. However, the carbon intensity in area generally increased from 182.43 kg CE/ha in 1991 to 305.71 kg CE/ha in 2013 (Figure 2), because the CF generally increased and the agricultural land generally decreased after 1998. In other words, the increase in agricultural output value per unit of carbon cost cannot outweigh the potential risks induced by an increase in total carbon footprint per unit area of agricultural land.
Agrochemical and electricity inputs, especially K fertilizer, plastic film, and P fertilizer, obviously increased with a high agricultural output value over the study period (Figure 3). Grain crop (a general term for cereals, potatoes, and legumes in China) yield is traditionally essential to food security. It increased from 466.62 Mt in 1995 to 512.30 Mt in 1998, decreased from 508.39 Mt in 1999 to 430.70 Mt in 2003, and increased from 469.47 Mt in 2004 to 607.03 Mt in 2014. Comparatively, cash crop (a general term for cottons, oil-bearing crop, sugar crop, hemp crop, tobaccos, vegetables, melons, and flowers in China) production is more closely related to agricultural output value and farm incomes. It increased from 367.15 Mt in 1995 to 938.14 Mt in 2014. Notably, cash crop yield has exceeded grain crop yield since 1998. In addition, about 80% of the cash crop yield was contributed by vegetable production based on the national yield statistics. Vegetable production increased from 257.27 Mt in 1995 to 760.05 Mt in 2014. The increase in vegetable production needed more agrochemical and energy inputs than the observed rise in grain production, especially N fertilizer, K fertilizer, plastic film, and pesticides. The increase in agricultural output value per unit of carbon cost also cannot outweigh the potential risk of agricultural non-point pollution induced by an increase in agrochemical inputs per unit area of agricultural land.

4. Discussion

4.1. CO2 Emissions and the Related Chinese Agricultural Policies

The rising trend in total CF was closely related to the development of the agricultural intensification that began with the initiation of socialist market economic reforms. The two abnormally high values of the total CF in 1995 and 1996 were due to the government incentives to improve agricultural production by increasing agrochemical and energy inputs and by township enterprise development incentives introduced in 1995 and 1996 [30]. From 2000 to 2007, the total CF increased from a higher starting point. This is because that the Grain for Green Policy of returning marginal cropland to forest or grassland was mainly implemented from 2000 to 2007 to combat land degradation in China. The higher agricultural inputs, especially agricultural energy [31], were used to increase the income of farmers and to compensate for the impact of reduced cropland area and decreased land productivity for the Grain for Green Policy.
The CF increased dramatically between 2004 and 2007, because a series of policies to support agriculture were launched in this period, especially the exemption of agricultural tax in 2006, which aimed to prevent the decline in grain production and improve agricultural production capacity [30,32]. The proportion by energy from 2008 to 2014 was relatively low, because a series of low-carbon agricultural techniques were adopted to increase the use efficiency of agricultural energy and to reduce carbon emissions induced by the energy consumption [33,34]. Thus, the total CF slightly increased from a relatively lower value in 2008 over 2008–2014. It is clear that the socialist market economic reforms and related agricultural policies and low-carbon techniques had a significant influence on agricultural inputs and the related total CF associated with Chinese agricultural production.
In a general agreement with the findings from similar studies [10,35,36], the absolute contributions from N fertilizer- and energy-induced emissions in this study indicate that reduction in N fertilizer and energy use in China’s agricultural production offer a great option to reduce the national total GHGs emission. The absolute contributions from indirect CO2 emissions caused by K fertilizer, plastic film, pesticides, and P fertilizer to total CF were relatively small compared to N fertilizer and agricultural energy. However, their relative growth rates were higher, and their potential environmental risks in the future cannot be neglected. Thus, the improvement of the related agricultural policies and techniques needs to consider both the absolute and relative percentage contributions from CO2 emissions induced by each agricultural input.

4.2. Agricultural Economy Development and Low Carbon Requirements

The increase in agricultural output value in China was mainly due to the switching from low-valued grain crops to high-valued cash crops or fruits, crop variety improvement, and the above-mentioned agricultural inputs. Population growth and the associated increase in food and income demands have been a major force driving the continued increases in agricultural output value and agrochemical and energy inputs in China.
Due to the demand for continuous improvements in living standards, cash crops, fruit, and commercial forestry production will make larger contributions to future rises in the agricultural output value. The agricultural output increases mainly relied on excessive inputs of agrochemicals and energy with certain agricultural planting structure; however, there was not enough consideration given to the quality, diversity, and efficient use of agrochemicals and energy. This probably led to nutrient imbalances, inefficient use or over use of agrochemicals and energy, and greater CO2 emissions. For example, N fertilizer application has exceeded its safe environmental limit of 27.29 Mt since 2007, and P fertilizer application has exceeded its safe environmental limit of 9.96 Mt since 2000 in China [37]. In other words, the increase in carbon efficiency over the study period, with an accompanying increase in carbon intensity in area, had not mitigated the potential risk of nutrient imbalances and the inefficient use of agrochemicals and energy [33,38,39,40] and caused greater CO2 emissions resulting from rising agrochemical and energy inputs. Furthermore, the decline in soil quality, especially soil acidification [41] and soil compaction [42], caused by the inefficient and over use of agrochemicals and the lack of pressure to combine agrochemical applications with organic inputs and to improve soil properties, has seriously affected the sustainable use of soils in intensive Chinese agricultural systems. Improvement of soil quality will lead to more CO2 emissions, because more agricultural materials and energy will be needed.
It is clear that the development of agricultural economy requires increasing agricultural inputs in China. However, the sustainable development of agricultural economy will depend on the quality, diversity, and efficient use of agricultural inputs in order to keep the balance between agricultural economy development and low carbon requirements. Thus, there is an ongoing need to develop sustainable agriculture based on lower CO2 emissions in agricultural production processes. In order to control the possible reduction in yield and increase in CIP caused by the reduction of agrochemical and energy inputs, it would be essential to increase the use efficiency of agrochemicals and energy, to use more organic fertilizer, biopesticides, straw pulp film, and biodiesel in energy-saving machinery [43], and to optimize the input structure of all agricultural materials and energy. In particular, the use of biochar from crop straw pyrolysis as a soil amendment to agricultural land could cut down the carbon cost of N fertilizer use [44].

4.3. Uncertainty of Assessment of CO2 Emissions Induced by Agricultural Inputs

Changes in CO2 emissions and the related carbon intensity induced by agricultural inputs for agricultural production in China over 1991–2014 were assessed; however, there are still some sources of uncertainty for the detailed assessment. Without detailed data of agrochemical and energy inputs for each main agricultural component (crop and fruit, forestry, animal husbandry, and fishing), it would be impossible to quantitatively analyze the contribution of CF from each main agricultural component to the total CF. Uncertainty could also arise from the use of data for agricultural inputs obtained from statistical yearbooks in China and data for the agricultural land area obtained from FAOSTAT. In addition, the use of emission factors for P fertilizer, K fertilizer, and pesticides available abroad could also lead to uncertainty because of their absence of studies in China [10]. Despite the mentioned sources of uncertainty, the overall estimation in this paper could offer elementary information for understanding the carbon cost caused by each agrochemical and energy input and the changes in CO2 emissions from China’s agricultural production since its socialist market economic reforms.

5. Conclusions

The increase in CO2 emissions caused by agrochemical and energy inputs could reflect the potential environmental risk of agricultural intensification in China. The increase in the total carbon footprint for agricultural production over the study period was due to the influence of the initialization of socialist market economic reforms since the early 1990s and a series of ecological and supporting agricultural policies since 1999.
The total CF for agricultural production showed a volatile upward trend, and the total CF variation over time could be split into three periods, i.e., 1991–1999, 2000–2007, and 2008–2014. The CF trend was mainly affected by the CO2 emissions caused by N fertilizer inputs and energy consumption. However, the relative growth rates of CO2 emissions caused by K fertilizer, plastic film, P fertilizer, and pesticides were higher than those caused by N fertilizer and agricultural energy. Thus, the potential risks casued by all agrochemical and energy inputs need monitoring.
The relative growth rate of agricultural output value was higher than that of total CF in China, which led to the decease in carbon intensity in production from 1991 to 2014. However, the increase in agricultural output value per unit of carbon cost does not outweigh the potential risks induced by the increase in total carbon footprint per unit area of agricultural land. This study is a reminder that the increasing carbon intensity in area may affect the overall success of the series of supporting agricultural policies and sustainable agricultural development in China.

Supplementary Materials

The following are available online at www.mdpi.com/2071-1050/8/5/414/s1.

Acknowledgments

This study is supported by Natural Science Foundation of China (NSFC 41371531) and the Commonweal Research Project (201404304).

Conflicts of Interest

The author declares no conflict of interest.

Abbreviations

The following abbreviations are used in this manuscript:
CFCarbon footprint
GHGsGreenhouse gases
CECO2 equivalents
CIPCarbon intensity in production

References

  1. IPCC. Contribution of Working Groups I, II and III to the Fifth Assessment Report of the Intergovernmental Panel on Climate Change. In Climate Change 2014: Synthesis Report; Core Writing Team, R.K., Meyer, L.A., Eds.; IPCC: Geneva, Switzerland, 2014. [Google Scholar]
  2. West, T.O.; Marland, G. A synthesis of carbon sequestration, carbon emissions, and net carbon flux in agriculture: Comparing tillage practices in the United States. Agric. Ecosyst. Environ. 2002, 91, 217–232. [Google Scholar] [CrossRef]
  3. Qi, Y.; Dong, Y.; Liu, J. Effect of the conversion of grassland to spring wheat field on the CO2 emission characteristics in Inner Mongolia, China. Soil Tillage Res. 2007, 94, 310–320. [Google Scholar] [CrossRef]
  4. Wang, B.; Li, J.; Jiang, W.; Zhao, L.; Gu, S. Impacts of the rangeland degradation on CO2 flux and the underlying mechanisms in the Three-River Source Region on the Qinghai-Tibetan Plateau. China Environ. Sci. 2012, 32, 1764–1771. [Google Scholar]
  5. Shen, L.; Gao, T.; Zhao, J.; Wang, L.; Wang, La.; Liu, L.; Chen, F.; Xue, J. Factory-level measurements on CO2 emission factors of cement production in China. Renew. Sustain. Energy Rev. 2014, 34, 337–349. [Google Scholar] [CrossRef]
  6. Rowe, R.L.; Street, N.R.; Taylor, G. Identifying potential environmental impacts of large-scale deployment of dedicated bioenergy crops in the UK. Renew. Sustain. Energy Rev. 2009, 13, 271–290. [Google Scholar] [CrossRef]
  7. Zhao, R.; Huang, X.; Zhong, T.; Peng, J. Carbon footprint of different industrial spaces based on energy consumption in China. J. Geogr. Sci. 2011, 21, 285–300. [Google Scholar] [CrossRef]
  8. Kenny, T.; Gray, N.F. Comparative performance of six carbon footprint models for use in Ireland. Environ. Impact Assess. Rev. 2009, 29, 1–6. [Google Scholar] [CrossRef]
  9. Dubey, A.; Lal, R. Carbon footprint and sustainability of agricultural production systems in Punjab, India, and Ohio, USA. J. Crop Improv. 2009, 23, 332–350. [Google Scholar] [CrossRef]
  10. Cheng, K.; Pan, G.; Smith, P.; Luo, T.; Li, L.; Zheng, J.; Zhang, X.; Han, X.; Yan, M. Carbon footprint of China’s crop production-An estimation using agro-statistics data over 1993–2007. Agric. Ecosyst. Environ. 2011, 142, 231–237. [Google Scholar] [CrossRef]
  11. Huang, Z.; Mi, S. Agricultural sector carbon footprint accounting: A case of Zhejiang, China. Issues Agric. Econ. 2011, 11, 40–47. [Google Scholar]
  12. Perry, S.; Klemes, J.; Bulatov, I. Integrating waste and renewable energy to reduce the carbon footprint of locally integrated energy sectors. Energy 2008, 33, 1489–1497. [Google Scholar] [CrossRef]
  13. Liu, Y.; Xiao, H.W.; Zikhali, P.; Lv, Y.K. Carbon Emissions in China: A Spatial Econometric Analysis at the Regional Level. Sustainability 2014, 6, 6005–6023. [Google Scholar]
  14. Zhao, Y.; Nielsen, C.P.; McElroy, M.B. China’s CO2 emissions estimated from the bottom up: Recent trends, spatial distributions, and quantification of uncertainties. Atmos. Environ. 2012, 59, 214–223. [Google Scholar] [CrossRef]
  15. Chen, T.; Chen, S.; Xu, H.; Huang, S.; Chen, Y. Simulation study on ratios of nitrogen, phosphorus and potassium fertilizers required in the crop production in China. Acta Geogr. Sin. 1998, 53, 32–41. [Google Scholar]
  16. Yao, G.; Liu, G.; Xie, H. Spatiotemporal difference and driving forces of input factors intensity for arable land-use in China. J. Nat. Resour. 2014, 29, 1836–1848. [Google Scholar]
  17. National Bureau of Statistics of China (NBSC). China Rural Statistical Yearbook, 1992–2015; China Statistics Press: Beijing, China, 1991–2015.
  18. Feng, Z.; Yang, Y.; Zhang, Y.; Zhang, P.; Li, Y. Grain-for-green policy and its impacts on grain supply in West China. Land Use Policy 2005, 22, 301–312. [Google Scholar] [CrossRef]
  19. Wang, X.; Lu, C.; Fang, J.; Shen, Y. Implications for development of grain-for-green policy based on cropland suitability evaluation in desertification-affected north China. Land Use Policy 2007, 24, 417–424. [Google Scholar] [CrossRef]
  20. Lin, Y.; Yao, S. Impact of the Sloping Land Conversion Program on rural house hold income: An integrated estimation. Land Use Policy 2014, 40, 56–63. [Google Scholar] [CrossRef]
  21. Liu, H. Evolution of Chinese agricultural supporting policies and rural development. China Agric. Inf. 2012, 15, 24–25. [Google Scholar]
  22. FAOSTAT, 2016. Available online: http://faostat3.fao.org/download/R/RL/E (accessed on 18 March 2016).
  23. National Bureau of Statistics of China (NBSC). China Energy Statistical Yearbook, 1992–2015; China Statistics Press: Beijing, China, 1991–2015. [Google Scholar]
  24. Huo, M.; Han, X.; Shan, B. Empirical Study on Key Factors of Carbon Emission Intensity of Power Industry. Electr. Power 2013, 46, 122–126. [Google Scholar]
  25. Lu, F.; Wang, X.; Han, B. Assessment on the availability of nitrogen fertilization in improving carbon sequestration potential of China’s cropland soil. Chin. J. Appl. Ecol. 2008, 19, 2239–2250. [Google Scholar]
  26. Lu, Y.; Huang, Y.; Zou, J.; Zheng, X. An inventory of N2O emissions from agriculture in China using precipitation-rectified emission factor and background emission. Chemosphere 2006, 65, 1915–1924. [Google Scholar] [CrossRef] [PubMed]
  27. General Administration of Quality Supervision, Inspection and Quarantine of the People’s Republic of China (AQSIQ); Standardization Administration of the People’s Republic of China (SAC). General Principles for Calculation of the Comprehensive Energy Consumption (GB/T 2589–2008); China Standard Press: Beijing, China, 2008. [Google Scholar]
  28. National Development and Reform Commission of China (NDRCC). Guidelines for Provincial Greenhouse Gas Inventories (Trial); Beijing, China, 2011.
  29. IPCC. 2006 IPCC Guidelines for National Greenhouse Gas Inventories. In Prepared by the National Greenhouse Gas Inventories Programme; Eggleston, H.S., Buendia, L., Miwa, K., Ngara, T., Tanabe, K., Eds.; IGES: Tokyo, Japan, 2006. [Google Scholar]
  30. He, J.; Feng, J. The stage features and policy choices in China’s agriculture development: a comparative analysis under the perspective of “Four Stages Theory” in international agricultural development process. Chin. Agric. Sci. Bull. 2010, 26, 439–444. [Google Scholar]
  31. Lin, B.; Fei, R. Regional differences of CO2 emissions performance in China’s agricultural sector: A Malmquist index approach. Eur. J. Agron. 2015, 70, 33–40. [Google Scholar] [CrossRef]
  32. Wang, X. Spatio-temporal changes in agrochemical inputs and the risk assessment before and after the grain-for-green policy in China. Environ. Monit. Assess. 2013, 185, 1927–1937. [Google Scholar] [CrossRef] [PubMed]
  33. Luan, Y.; Ren, J. Agricultural total factor energy efficiency of China and its convergence. Chin. J. Agric. Resour. Reg. Plan. 2014, 35, 20–24. [Google Scholar]
  34. Dai, X.; He, Y.; Zhong, Q. Driving factors and their contributions to agricultural CO2 emission due to energy consumption in China: Based on an expended Kaya identity and LMDI decomposition method. Chin. J. Eco-Agric. 2015, 23, 1445–1454. [Google Scholar]
  35. Kahrl, F.; Li, Y.J.; Su, Y.F.; Tennigkeit, T.; Wilkes, A.; Xu, J.C. Greenhouse gas emissions from nitrogen fertilizer use in China. Environ. Sci. Policy 2010, 13, 688–694. [Google Scholar] [CrossRef]
  36. Yan, M.; Cheng, K.; Luo, T.; Yan, Y.; Pan, G.; Rees, R.M. Carbon footprint of grain crop production in China—Based on farm survey data. J. Clean. Prod. 2015, 104, 130–138. [Google Scholar] [CrossRef]
  37. Zhang, W.; Wang, Y.; Ma, W.; Ma, J.; Zhang, F. A discussion on the method for fertilizer demand forecast of China. Soil Fertil. Sci. China. 2008, 2, 1–5. [Google Scholar]
  38. Ye, B.; Tang, H.; Tang, X.; Xu, Y. Status and prevention measurements of farmland pollution in China. Chin. Agric. Sci. Bull. 2010, 26, 295–298. [Google Scholar]
  39. Yang, Q.; Sang, L.; Sun, J.; Ji, Z.; Yuan, W.; Guo, Y.; Gai, Y. Current situation of fertilizer use in China and the method to improve chemical fertilizer utilization efficiency. J. Shanxi Agric. Sci. 2011, 39, 690–692. [Google Scholar]
  40. Shao, Z.; Zhang, S. Main measures of improving pesticide using efficiency. Agrochemicals 2014, 53, 382–385. [Google Scholar]
  41. Guo, J.; Liu, X.; Zhang, Y.; Shen, L.; Han, W.; Zhang, W.; Christie, P.; Goulding, K.; Vitousek, P.; Zhang, F. Significant acidification in major Chinese croplands. Science 2010, 327, 1008–1010. [Google Scholar] [CrossRef] [PubMed] [Green Version]
  42. Zhao, J. Causes and solutions of soil compaction. Mod. Agric. Sci. Technol. 2014, 13, 261–264. [Google Scholar]
  43. Wang, X. Sustainable development in Tibet requires control of agricultural nonpoint pollution. Environ. Sci. Technol. 2014, 48, 8944–8945. [Google Scholar] [CrossRef] [PubMed]
  44. Zhang, A.F.; Cui, L.Q.; Pan, G.X.; Li, L.Q.; Hussain, Q.; Zhang, X.H.; Zheng, J.W.; Crowley, D. Effect of biochar amendment on yield and methane and nitrous oxide emissions from a rice paddy from Tai Lake plain, China. Agric. Ecosyst. Environ. 2010, 139, 469–475. [Google Scholar] [CrossRef]
Figure 1. Changes in carbon costs from agrochemical and agricultural energy inputs.
Sustainability 08 00414 g001
Figure 2. Change in carbon intensity in agricultural production.
Sustainability 08 00414 g002
Figure 3. Changes in main agricultural inputs.
Sustainability 08 00414 g003
Table 1. Emission factors of agricultural inputs.
Emission SourceEmission FactorLiterature
N fertilizer1.74 t C t−1 N fertilizer[25]
P fertilizer0.2 t C t−1 P fertilizer[9]
K fertilizer0.15 t C t−1 K fertilizer[9]
N fertilizer-induced N2O0.0092 t N2O–N t−1 N fertilizer[26]
Pesticides6 t C t−1 pesticides[9]
Plastic film2.58 t C t−1 plastic film[11]
Raw coal0.52 t C t−1 raw coal[27,28]
Washed coal0.20 t C t−1 washed coal[27,28]
Coke0.78 t C t−1 coke[27,28]
Gasoline0.80 t C t−1 gasoline[27,28]
Diesel0.84 t C t−1 diesel[27,28]
Electricity *0.23–0.18 t C MW−1h−1[24]
* Note: the emission factor for electricity changed from 0.23 t C MW−1h−1 in 1991 to 0.18 t C MW−1h−1 in 2014.
Table 2. Comparison of mean carbon footprint (CF) of agricultural production between different periods.
PeriodOutput Value (TCNY *)Mean CF (Mt CE)CIP (kg CE CNY−1)Proportion by N Fertilizer (%)Proportion by Energy (%)
1991–19991.13104.590.09561.5927.86
2000–20071.81136.010.07655.8232.33
2008–20142.59148.790.05858.6727.08
1991–20141.78127.960.07858.8129.12
* Note: 1 TCNY = 1012 CNY; CNY: China Yuan or RMB Yuan.
Table 3. Agricultural input contributions to total CF and relative changing rate (%).
NN-N2OPKPesticidesPlastic FilmRaw CoalWashed CoalCokeGasolineDieselElectricity
1991–199936.7624.821.590.695.932.347.920.050.661.066.6511.52
Rate1.431.433.629.005.187.38−6.83−2.008.88−6.36−4.47−0.72
2000–200733.3222.501.650.936.173.107.360.040.651.2410.0712.97
Rate−0.91−0.910.573.000.472.332.030.43−6.701.182.130.95
2008–201435.0223.651.941.237.123.966.480.050.270.997.2212.08
Rate−0.74−0.740.341.18-0.871.686.784.98−6.142.482.57−1.10
1991–201435.1123.711.710.936.363.077.310.050.541.107.9612.17
Rate−0.10−0.101.816.491.615.66−1.221.44−1.66−1.02−0.08−0.11

