Article

Integrated Economic and Environmental Assessment of Waste Policy Instruments

1
Division of Environmental Systems Analysis, Department of Energy and Environment, Chalmers University of Technology, SE-412 58 Gothenburg, Sweden
2
IVL Swedish Environmental Research Institute, Box 210 60, SE-100 31 Stockholm, Sweden
3
Department of Building, Energy and Environmental Engineering, Faculty of Engineering and Sustainable Development, University of Gävle, Kungsbäcksvägen 47, SE-801 76 Gävle, Sweden
4
Division of Environmental Strategies Research, Department of Sustainable Development, Environmental Sciences and Engineering, School of Architecture and Built Environment, KTH Royal Institute of Technology, SE-100 44 Stockholm, Sweden
5
National Institute of Economic Research, Box 3116, SE-103 62 Stockholm, Sweden
*
Author to whom correspondence should be addressed.
Sustainability 2016, 8(5), 411; https://doi.org/10.3390/su8050411
Submission received: 26 January 2016 / Revised: 13 April 2016 / Accepted: 19 April 2016 / Published: 26 April 2016

Abstract

:
The need for new policy instruments supporting the on-going transition from end-of-pipe waste treatment to resource management has been recognized in European policy. Instruments need to be carefully assessed before implementation to promote the desired changes and avoid problem shifting. Mathematical models may assist policy makers in such assessments. This paper presents a set of soft-linked models for assessing the economic and environmental impacts of policy instruments for both the prevention and management of waste and discusses its strengths and limitations. Consisting of (1) a macro-economic model, (2) a systems engineering model for waste management and (3) a life cycle assessment model for waste management, the set is primarily suited to assessing market-based instruments and environmental regulations. Considerable resources were needed for developing and using the set, and there are clear limits as to what can be addressed. However, if only one of the models had been used, neither the range of instruments nor the scope of impacts would have been possible to cover. Furthermore, soft-linked models allow many disciplines to contribute within one harmonized framework. Such integrated assessments may become increasingly useful for continuing the implementation of policy for sustainable governance of society’s material resources.

1. Introduction

Over the years, a mix of policy measures has been applied in order to shift waste management in a more sustainable direction. Modern Swedish waste legislation dates from 1975, when a bill was passed stating that (1) waste is a resource that should be utilized and (2) those who generate waste are responsible for it. Since then, policy has been used mainly to incite a transition from landfilling to recovery of material and energy resources. Examples are the extended producer responsibility introduced in 1994 [1,2,3], restrictions against landfilling in 1997 [4], a landfilling tax in 2000 [5], banning of landfilling of combustible waste in 2002 and of organic waste in 2005 [6], a tax on waste incineration between 2006 and 2010 [7], the national environmental objectives in 1999 [8] and the national waste plans in 2005 and 2012 [9,10].
More recently, waste management is being discussed in the context of resource-efficiency and a circular economy in the European Union (EU): how to use natural material resources more efficiently and to avoid waste, but to use unavoidable waste as a resource [11]. EU member states are required to develop waste prevention programs taking into account the whole life cycles of materials with the goal to decouple environmental impacts associated with waste generation from economic growth [12]. The use of economic instruments is said to play a crucial role in the achievement of waste prevention and management objectives (ibid.). The Swedish national waste plan also supports the use of economic instruments and even claims they are needed in order to make stakeholders act responsibly [10].
Although there is support for the waste hierarchy, overall goals for a more resource-efficient Europe and recognition of the need for policy instruments supporting this transition, few instruments for waste prevention and increased recycling are yet in place. If such instruments are to be introduced, they need to be carefully designed and assessed before implementation in order to promote the desired changes and avoid problem shifting. It is of importance to assess links between economic growth, generation and management of waste and resulting environmental impacts and how these may play out in an uncertain future.
Ex ante assessments using mathematical models can assist in designing robust policy instruments. The models can be “used as experimental vehicles in which options may be explored without the risks and costs that accompany real-world experimentation” [13], and they also provide a platform for stakeholder discussions. Mathematical models for waste management planning have been developed since the 1960s. However, few integrate economic and environmental aspects, and even fewer are used for policy assessment. Furthermore, none simultaneously address macro-economy, waste management technology, environmental impacts and their links (see Section 2).
We have developed and used a set of linked mathematical models for assessing economic and environmental impacts of future national waste policy instruments. The aim of this paper is to describe the modelling approach and to identify and discuss its strengths and limitations. The work was conducted as part of “Towards Sustainable Waste Management” (TOSUWAMA), a research program funded by the Swedish Environmental Protection Agency, with the purpose to propose and evaluate policy instruments and strategic decisions that can contribute to developing Swedish waste management in a more sustainable direction. Results and conclusions from the overall assessment of policy instruments have been published in [14].

2. Models for Economic and Environmental Assessment of Waste Generation and Management

Mathematical models for waste management decision support have often been used for comparing technologies, but less frequently for assessing strategies, policies or specific policy instruments. They initially focused on issues such as routing of collection vehicles, location of facilities and optimization of treatment capacity [15,16,17]. Later, the scope expanded to wider waste management, and besides economic parameters, environmental parameters were also addressed [18,19,20,21,22,23]. From the late 1990s, the development of Life Cycle Assessment (LCA) models of waste management has increased [24,25,26,27]. Such LCA models have been used to study the potential environmental impacts in, for instance, municipal waste planning [28,29,30], evaluate regional and national strategies or policies [31] and compare treatment technologies [32,33]. LCA models of waste management have also been combined with energy system models for studying the environmental impacts of waste management options involving energy recovery [34]. The economic value of energy recovery from waste in relation to other energy conversion options has been addressed by combining systems engineering models [35]. The few assessments of specific policy instruments include a tax on waste incineration [36,37,38], combinations of policy instruments for landfill diversion and material recycling [39,40,41] and a scrap-tire recycling policy [42].
Such waste management models, traditionally developed within engineering sciences, can be labelled as “bottom-up” approaches. Models represent physical flows (materials and energy) and technologies for processing flows. “Top-down” approaches, in contrast, rely on macro-economy theories, and models represent economic flows of materials, energy, labor and capital. The relation between economic activity and waste generation has, to some extent, been studied with such top-down models, notably Computable General Equilibrium (CGE) models and econometric models. CGE models were used to calculate future waste quantities from manufacturing [43,44] and to examine the effect of trade liberalization on solid waste generation [45], the sectoral impacts of a tax on hazardous waste in the mining industry [46] and the effect of a tax on household waste [47]. The decoupling of solid waste generation from income growth by introducing unit-based pricing schemes for waste collection was analyzed within an applied general equilibrium model [48]. An approach similar to that of [43] was applied to study future waste quantities in Sweden and to assess the decoupling of waste generation from economic growth [49], but extended it by linking production factors to waste generation derived from national waste statistics [50]. A review of the coverage of environmental indicators in CGE models found that decoupling between waste generation and economic growth was captured by four out of eighteen models [51].
In sum, most efforts have been directed towards estimating future waste generation with top-down economic models and assessing waste management options with bottom-up engineering models. Less attention has been paid to quantifying the combined economic and environmental impacts of waste generation growth and to assessing waste policy instruments. This is consistent with the well-recognized general lack of tools that can be used in broader Life Cycle Sustainability Analysis (LCSA) [52,53,54,55,56,57,58]. The set of linked models presented in this paper may contribute to overcoming this gap. It combines top-down and bottom-up modelling. It also combines different systems perspectives: the economy-wide system, the waste-management system and the life cycle. It thus shows that it is possible to construct the set of tools that has been asked for within the field of LCSA [54].

3. A Set of Linked Models for Assessment of Waste Policy

The set as developed links three models for enabling the assessment of economic and environmental impacts of waste policy instruments introduced (1) on a macro-economic level for preventing the generation and hazardousness of waste or (2) directly in the waste management sector for shifting waste management activities. The models, their integration into a set and its use are described in the following section.

3.1. The Macro-Economic Model EMEC

The top-down model EMEC (Environmental Medium-Term Economic Model) is a static CGE model of the Swedish economy, initially developed and used for analyzing the interaction between the economy and the environment. The model was evaluated through a number of climate policy analyses conducted in Sweden during the past fifteen years and reported by governmental committees and in peer-reviewed journals [49,59,60]. As part of TOSUWAMA, the model was further developed to include also waste intensities by relating economic activity to the generation of waste in physical quantities [61,62]. The waste categories modelled are presented in Table A1 and Table A2.
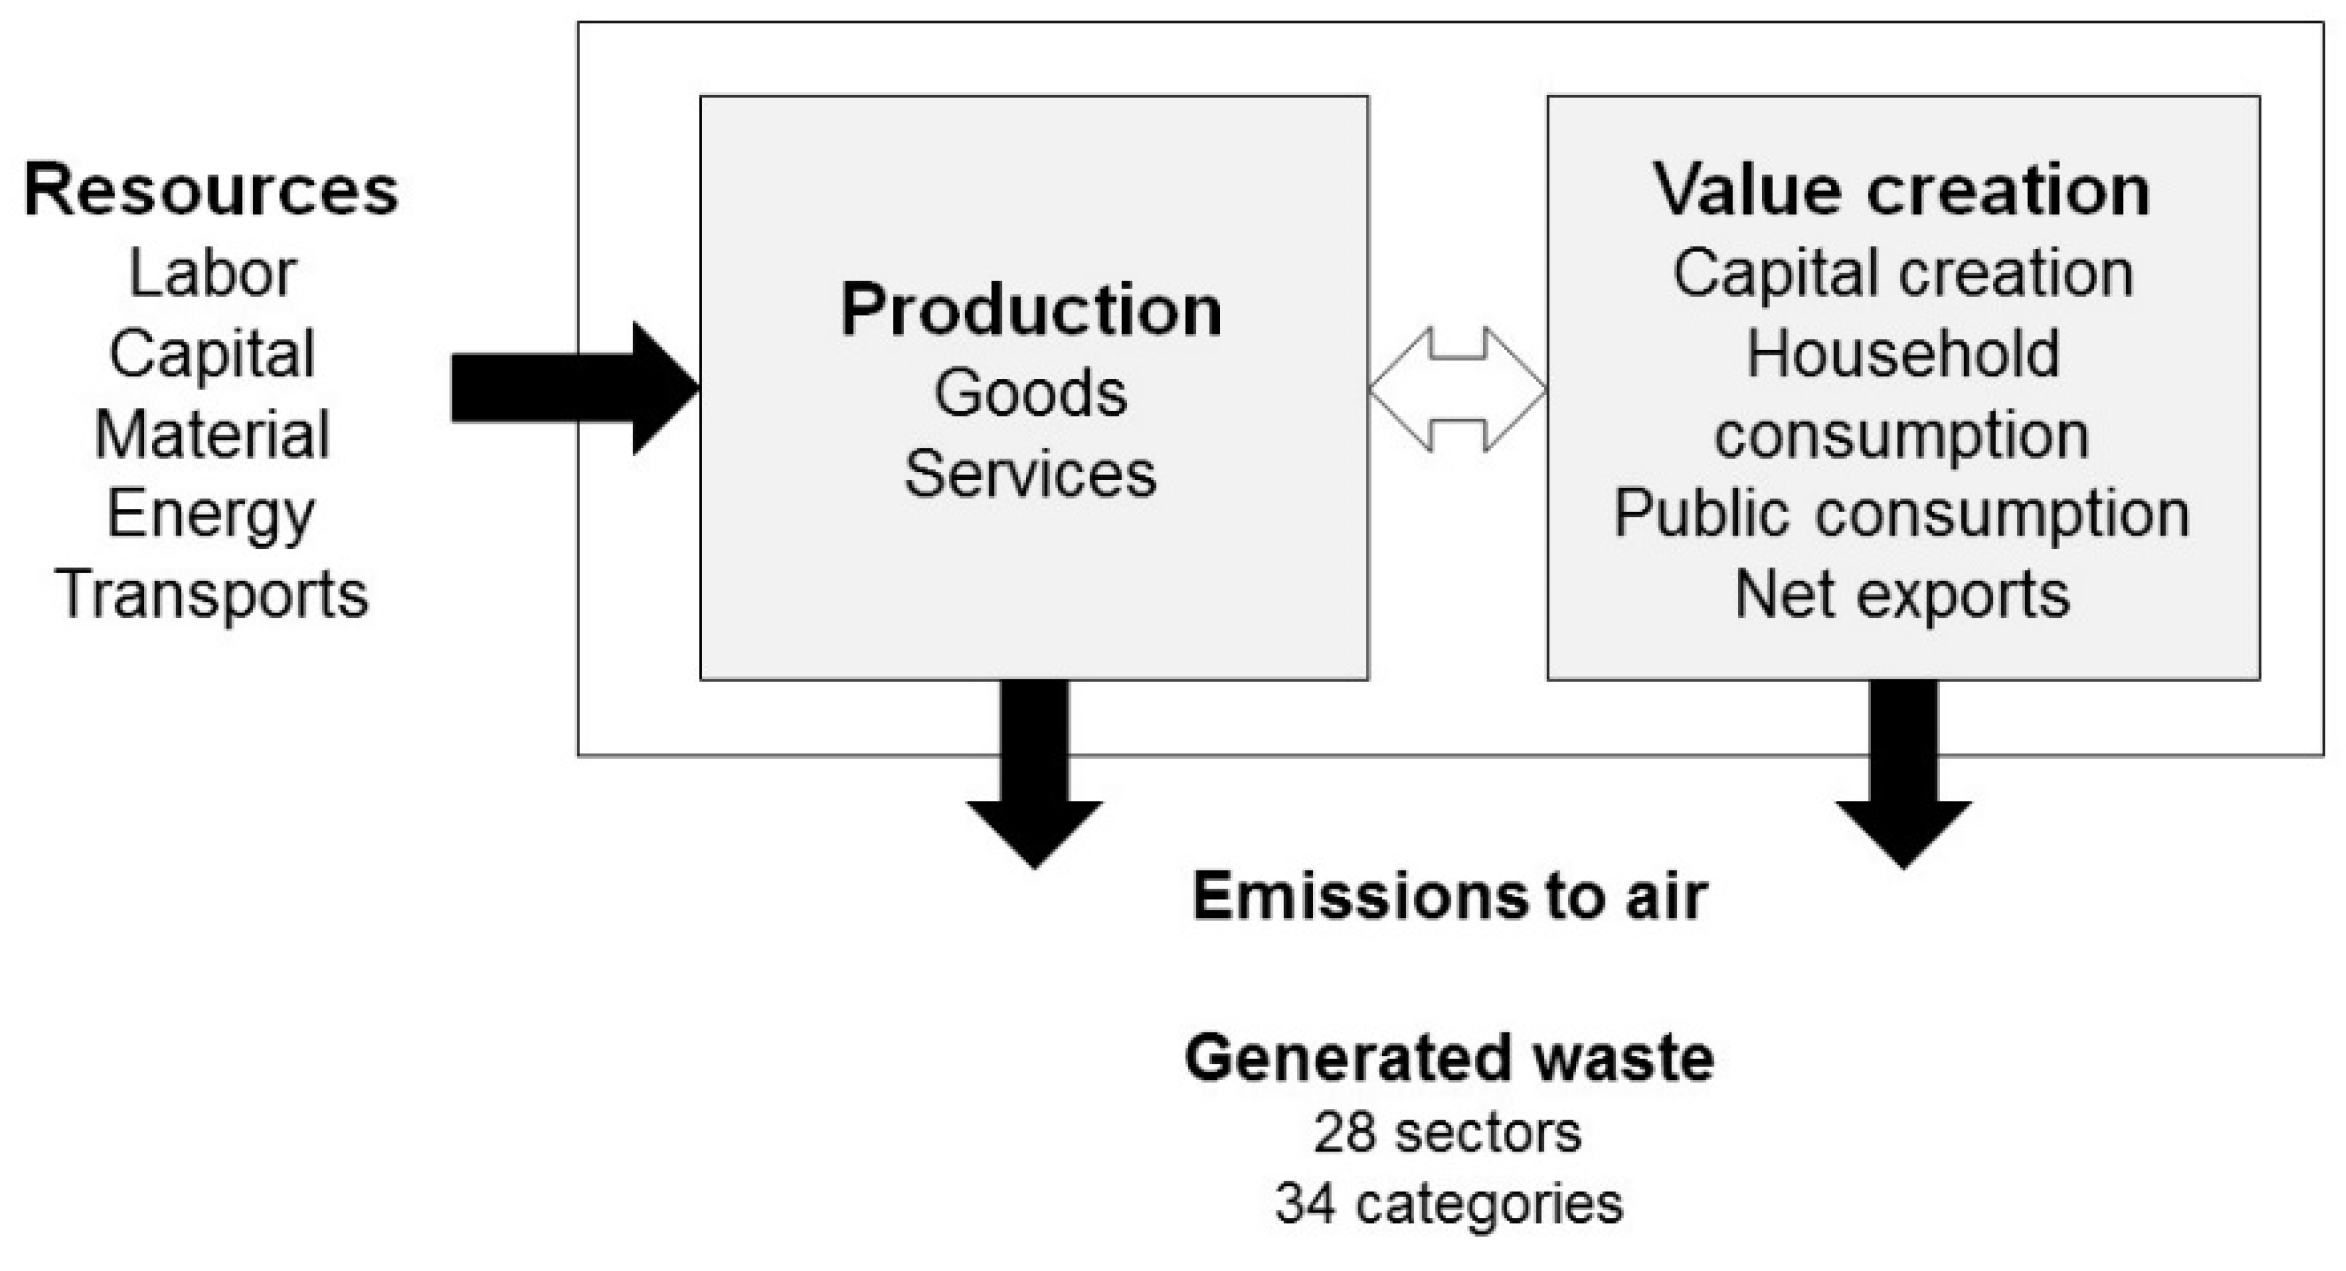
EMEC models 26 industry sectors and 33 composite commodities. Produced goods and services are used together with imports to create composite commodities for domestic use, but can also be exported. Production requires primary factors (two kinds of labor and capital) and inputs of materials, energy and transports (Figure 1). Households maximize utility subject to an income restriction. Firms maximize profit subject to resource restrictions. Disposal of public services, produced by a single government agent, is subject to a budget constraint. The foreign sector’s import and export activities are governed by an exogenously-given trade balance. Sweden’s products are assumed to have small shares of the total demand on world markets, and therefore, any quantity of exported goods must be sold at given world market prices. The sectors modelled are presented in Table A3.
Waste generation is related to the production and consumption of commodities, and thus, economic activity generates firms’ waste by the input used in production and households’ waste by households’ use of outputs. The waste intensities relating waste generation to economic activity were derived from Swedish national waste statistics for the year 2008 [50,63]. Since firms are assumed to be cost minimizing in the choice of labor, capital, energy, transports and materials for producing outputs, the substitutions between these inputs and productivity changes in the use of the inputs affect waste generation. Households’ waste generation is affected by the consumption of goods and services. Waste management is not represented as a single sector, but its activities are split between the sectors “Water and sewage” and “Services”.

3.2. The Waste Management Model NatWaste

The bottom-up model, NatWaste (National Waste management), is a systems engineering model for strategic planning of national waste management systems [40]. It has been used to assess, for instance, the introduction of a landfill tax and landfilling bans in Sweden (ibid.) and goals for biological treatment and material recycling [64].
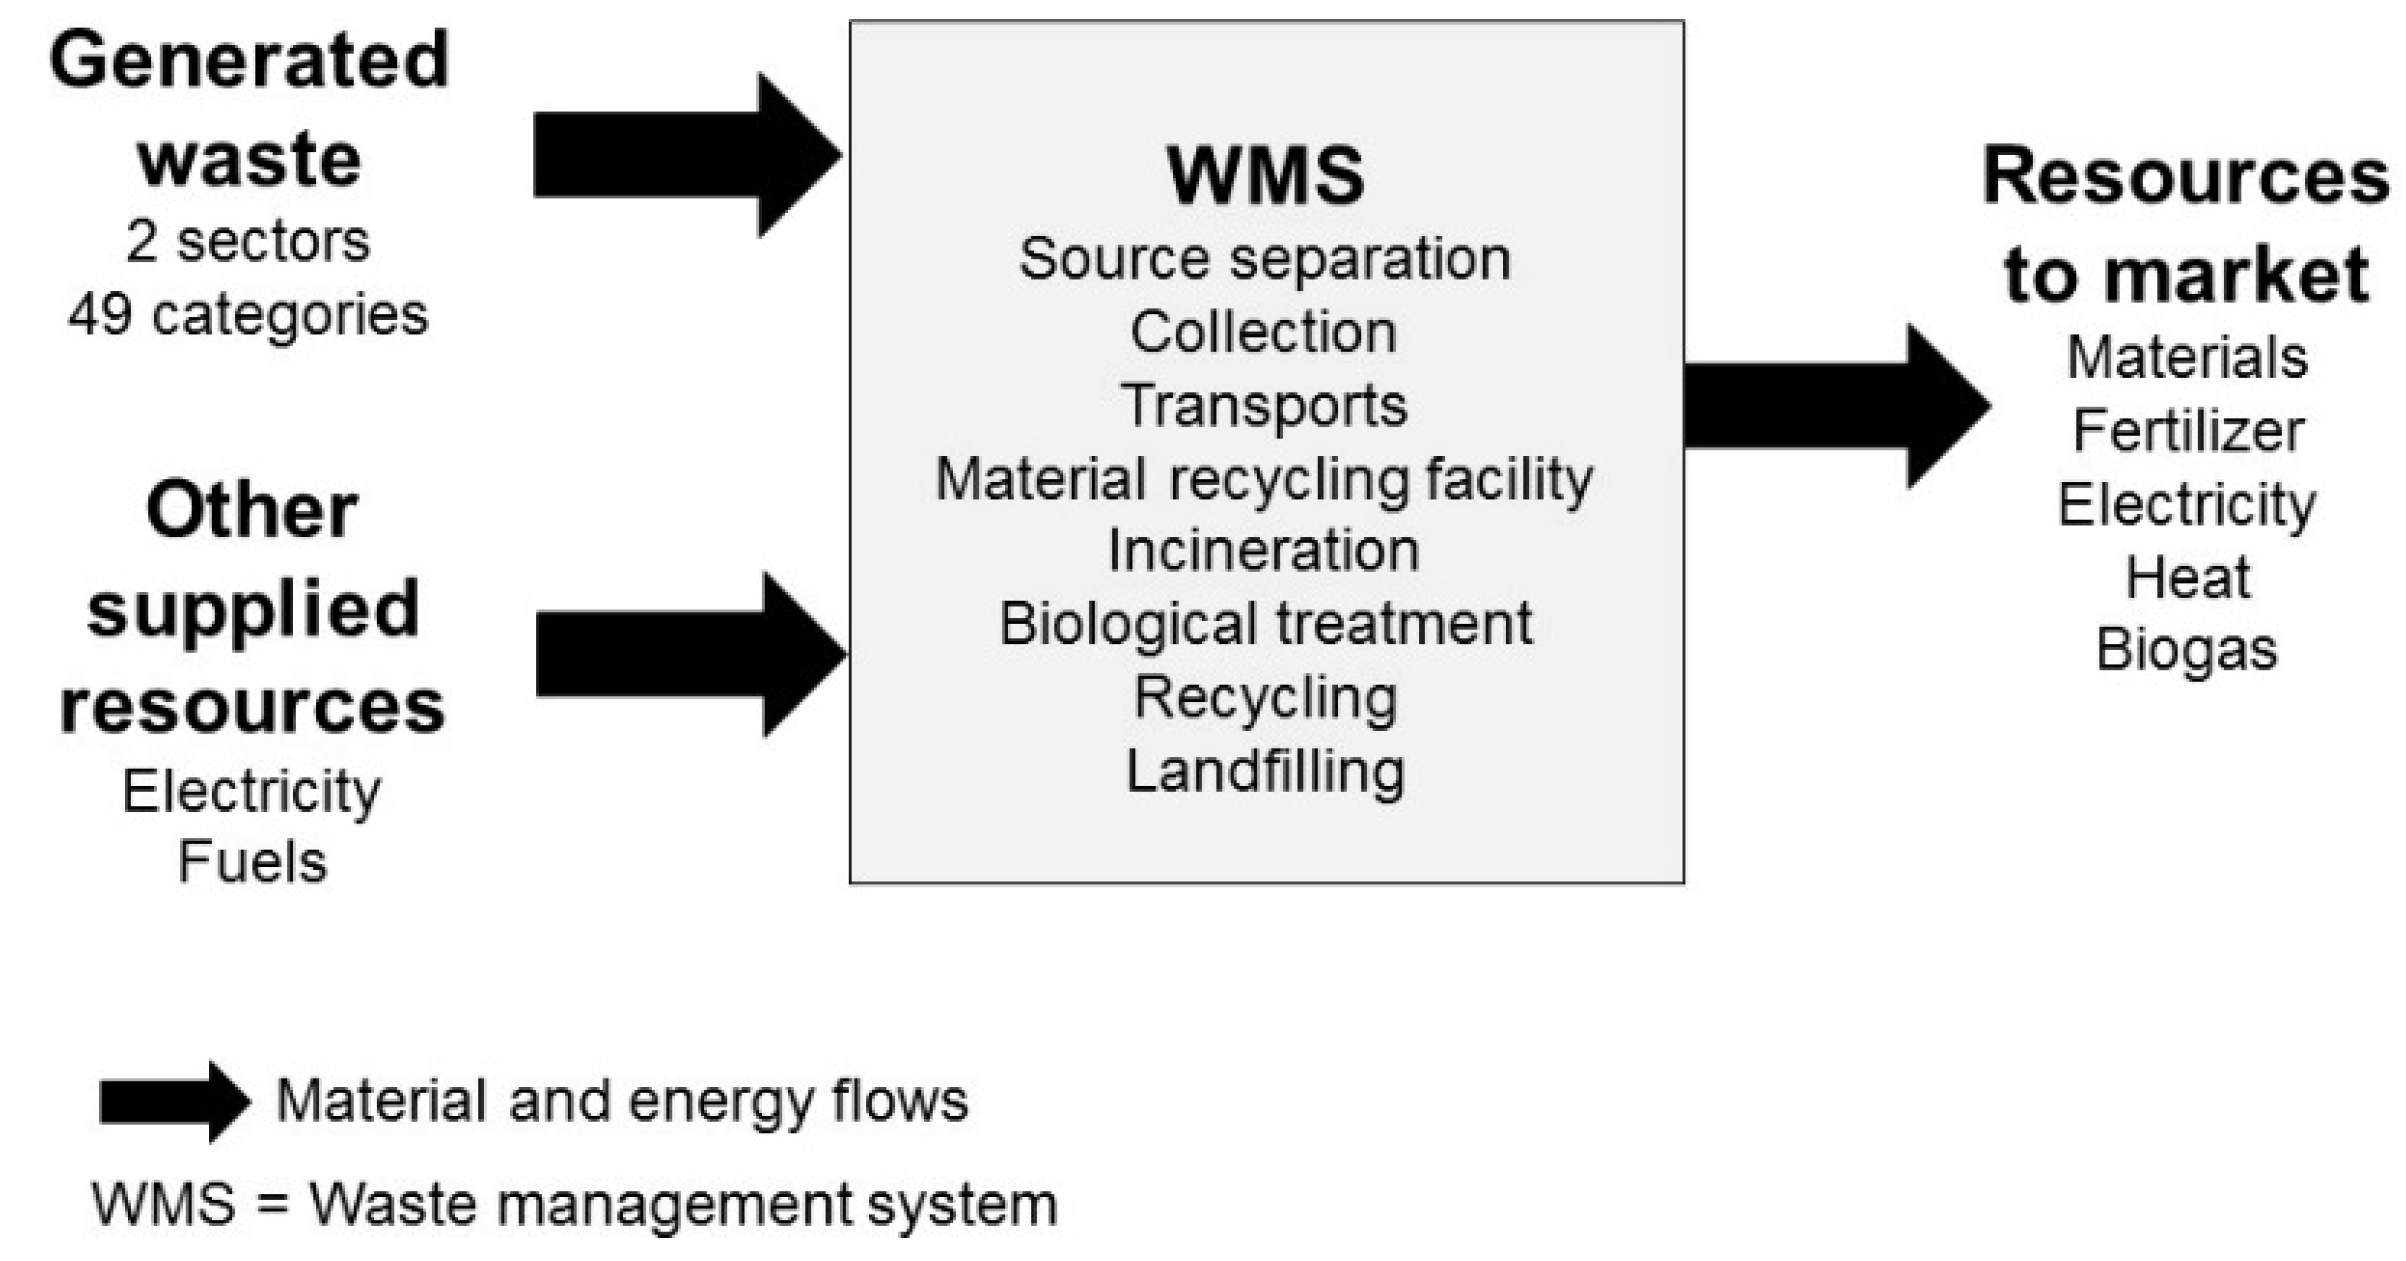
Based on cost optimization, NatWaste calculates the cost-effective mix of waste management processes (Figure 2) for a given quantity of waste. The cost-effective mix is the set of processes that gives the lowest total net economic costs, excluding external environmental costs and private consumer time, with respect to the conditions defined. These include the collection, transportation and treatment options available for each included waste category (Table A4). Costs include variable costs for collection, local and regional transportation and treatment of waste, auxiliary energy and materials, annualized investment costs for new or expanded process capacity and revenues for recovered material and energy. Capital costs for investments already made are not included, but treated as sunk costs. Results from NatWaste specify the cost-effective mix of waste management processes, in terms of waste quantities processed and resources recovered by each process
NatWaste models waste categories of a certain quantity and composition from industry and households from the point where it is collected from the first generator (Figure 2). Waste is then treated in the system, usually in a sequence of different processes. Resources exit the system exit as recovered materials (e.g., scrap metal, glass, different plastics), fertilizer (compost and digestate) and energy (electrical power, heat and biogas) to be absorbed by the markets. Auxiliary electricity and vehicle fuels are supplied for running the system.
Swedish waste management is modelled as a number of coupled generalized municipal waste management systems [40]. Each generalized system reflects different characteristics, such as the size of the municipality and access to a district heating system. Every Swedish municipality is allocated to one such generalized system, so that the sum of generalized municipal systems represents the national system. In total, 49 waste categories from industry and households are modelled (Table A1 and Table A3), including all non-hazardous waste categories generated in Sweden, except waste from the mining industry, waste considered as biofuel and other wastes that were considered not to be affected by the policy instruments to be assessed in TOSUWAMA.

3.3. The LCA Waste Management Model SWEA

The bottom-up model SWEA was developed for life cycle assessments of potential environmental impacts of waste management and waste prevention in Sweden [65]. It builds on previous work [36], utilizing Life Cycle Inventory (LCI) data, in which processes are represented by inputs and outputs of material and energy flows of unit processes, from existing models, databases and earlier studies of waste management processes, such as collection, treatment and recycling of waste.
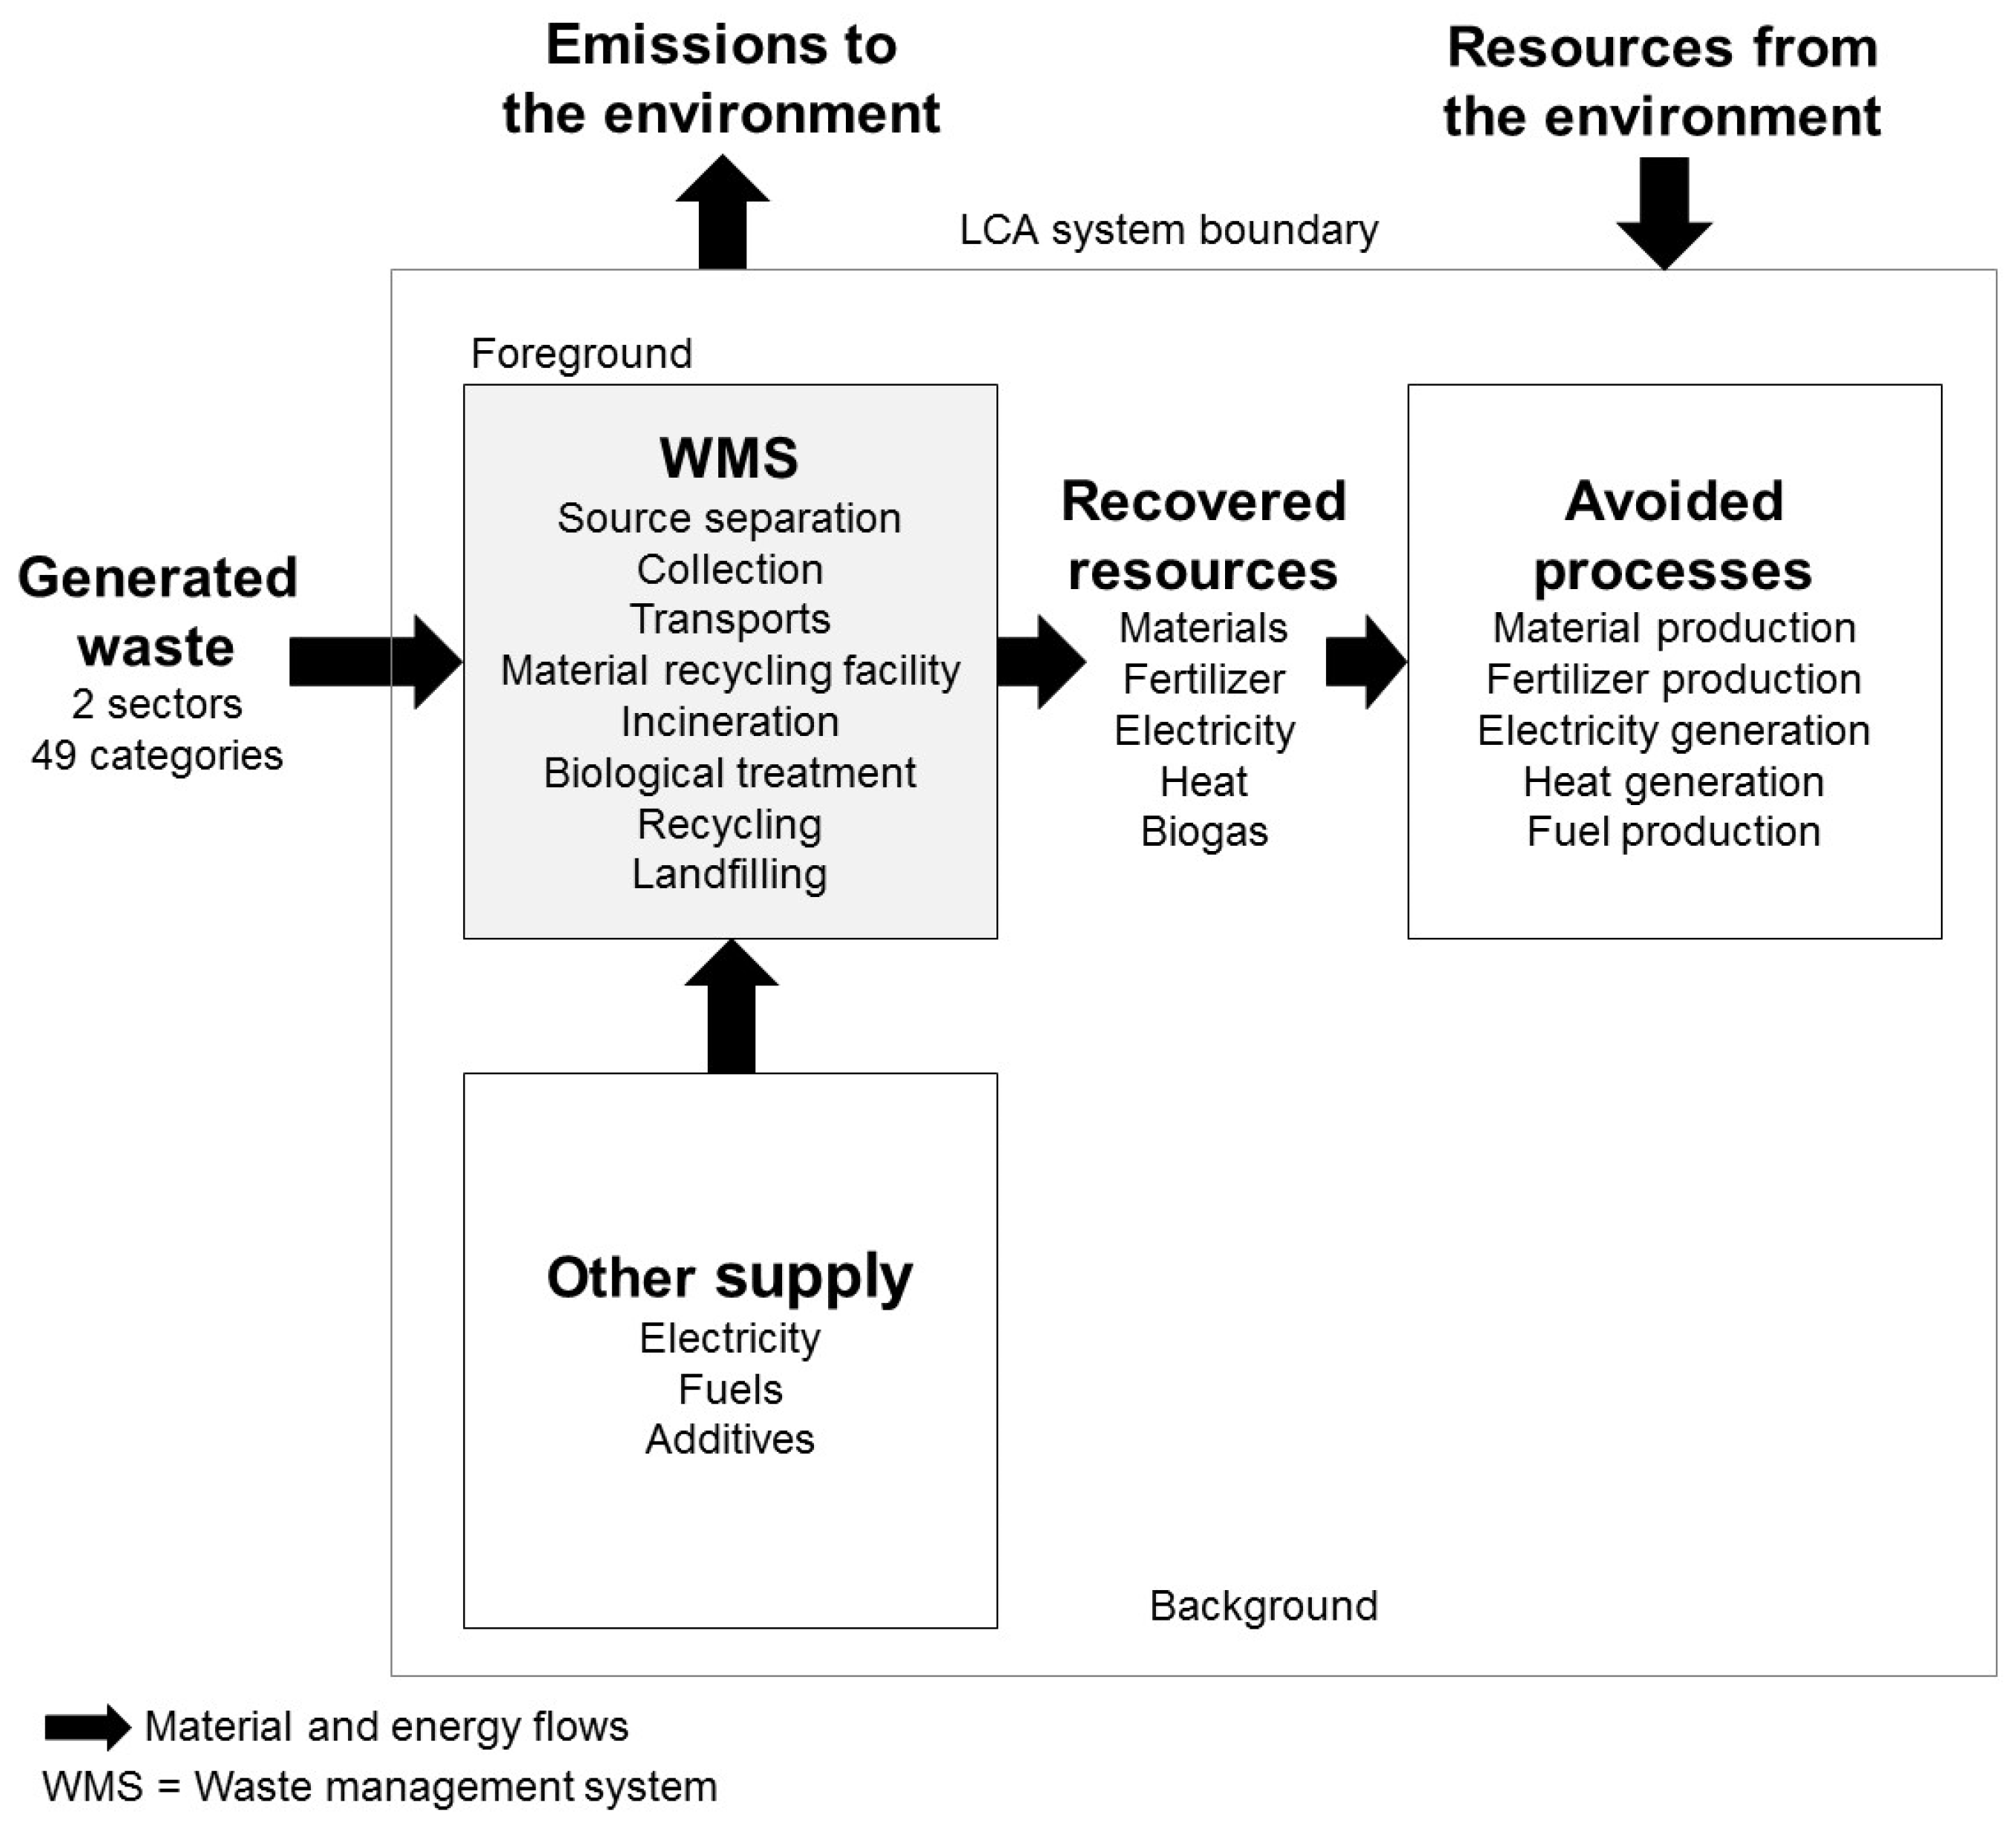
SWEA can be represented as consisting of a foreground system, corresponding to the WMS in NatWaste, and a background system. The foreground system includes collection, transportation, separation and treatment of the different waste categories, while the background system includes process models of the production of fuels, electricity and materials used by the foreground system (Figure 3). In line with established LCA methodology for waste management [66,67], credit is given to the recovery of resources from waste in the foreground system through system expansion and modelling of the avoided processes. In comparative assessments of scenarios where waste quantities remain constant, waste generation is excluded from the model. In analyses of waste prevention measures, the avoided burden of manufacturing and the use of products corresponding to the reduced waste amounts are calculated.
SWEA includes the same 49 waste categories from industry and households and waste process options as NatWaste (Table A1, Table A3 and Table A4). LCI data for thermal and biological waste treatment, landfill disposal and recycling of inert waste was generated by the ORWARE (Organic Waste Research) model [68]. Additional LCI data on recycling were provided from Swedish datasets [65] or EcoInvent. LCI data on the background system and avoided processes (such as materials from virgin resources, energy supply, vehicle fuels and chemical fertilizer) were taken from the database EcoInvent 2.0 (Ecoinvent Centre, Dübendrof, Switzerland) [69]. The potential environmental impacts of emissions to and resources from the environment can be assessed by using Life Cycle Impact Assessment (LCIA) methods, such as the ReCiPe method [70] (Table A5).

3.4. Linking of the Models

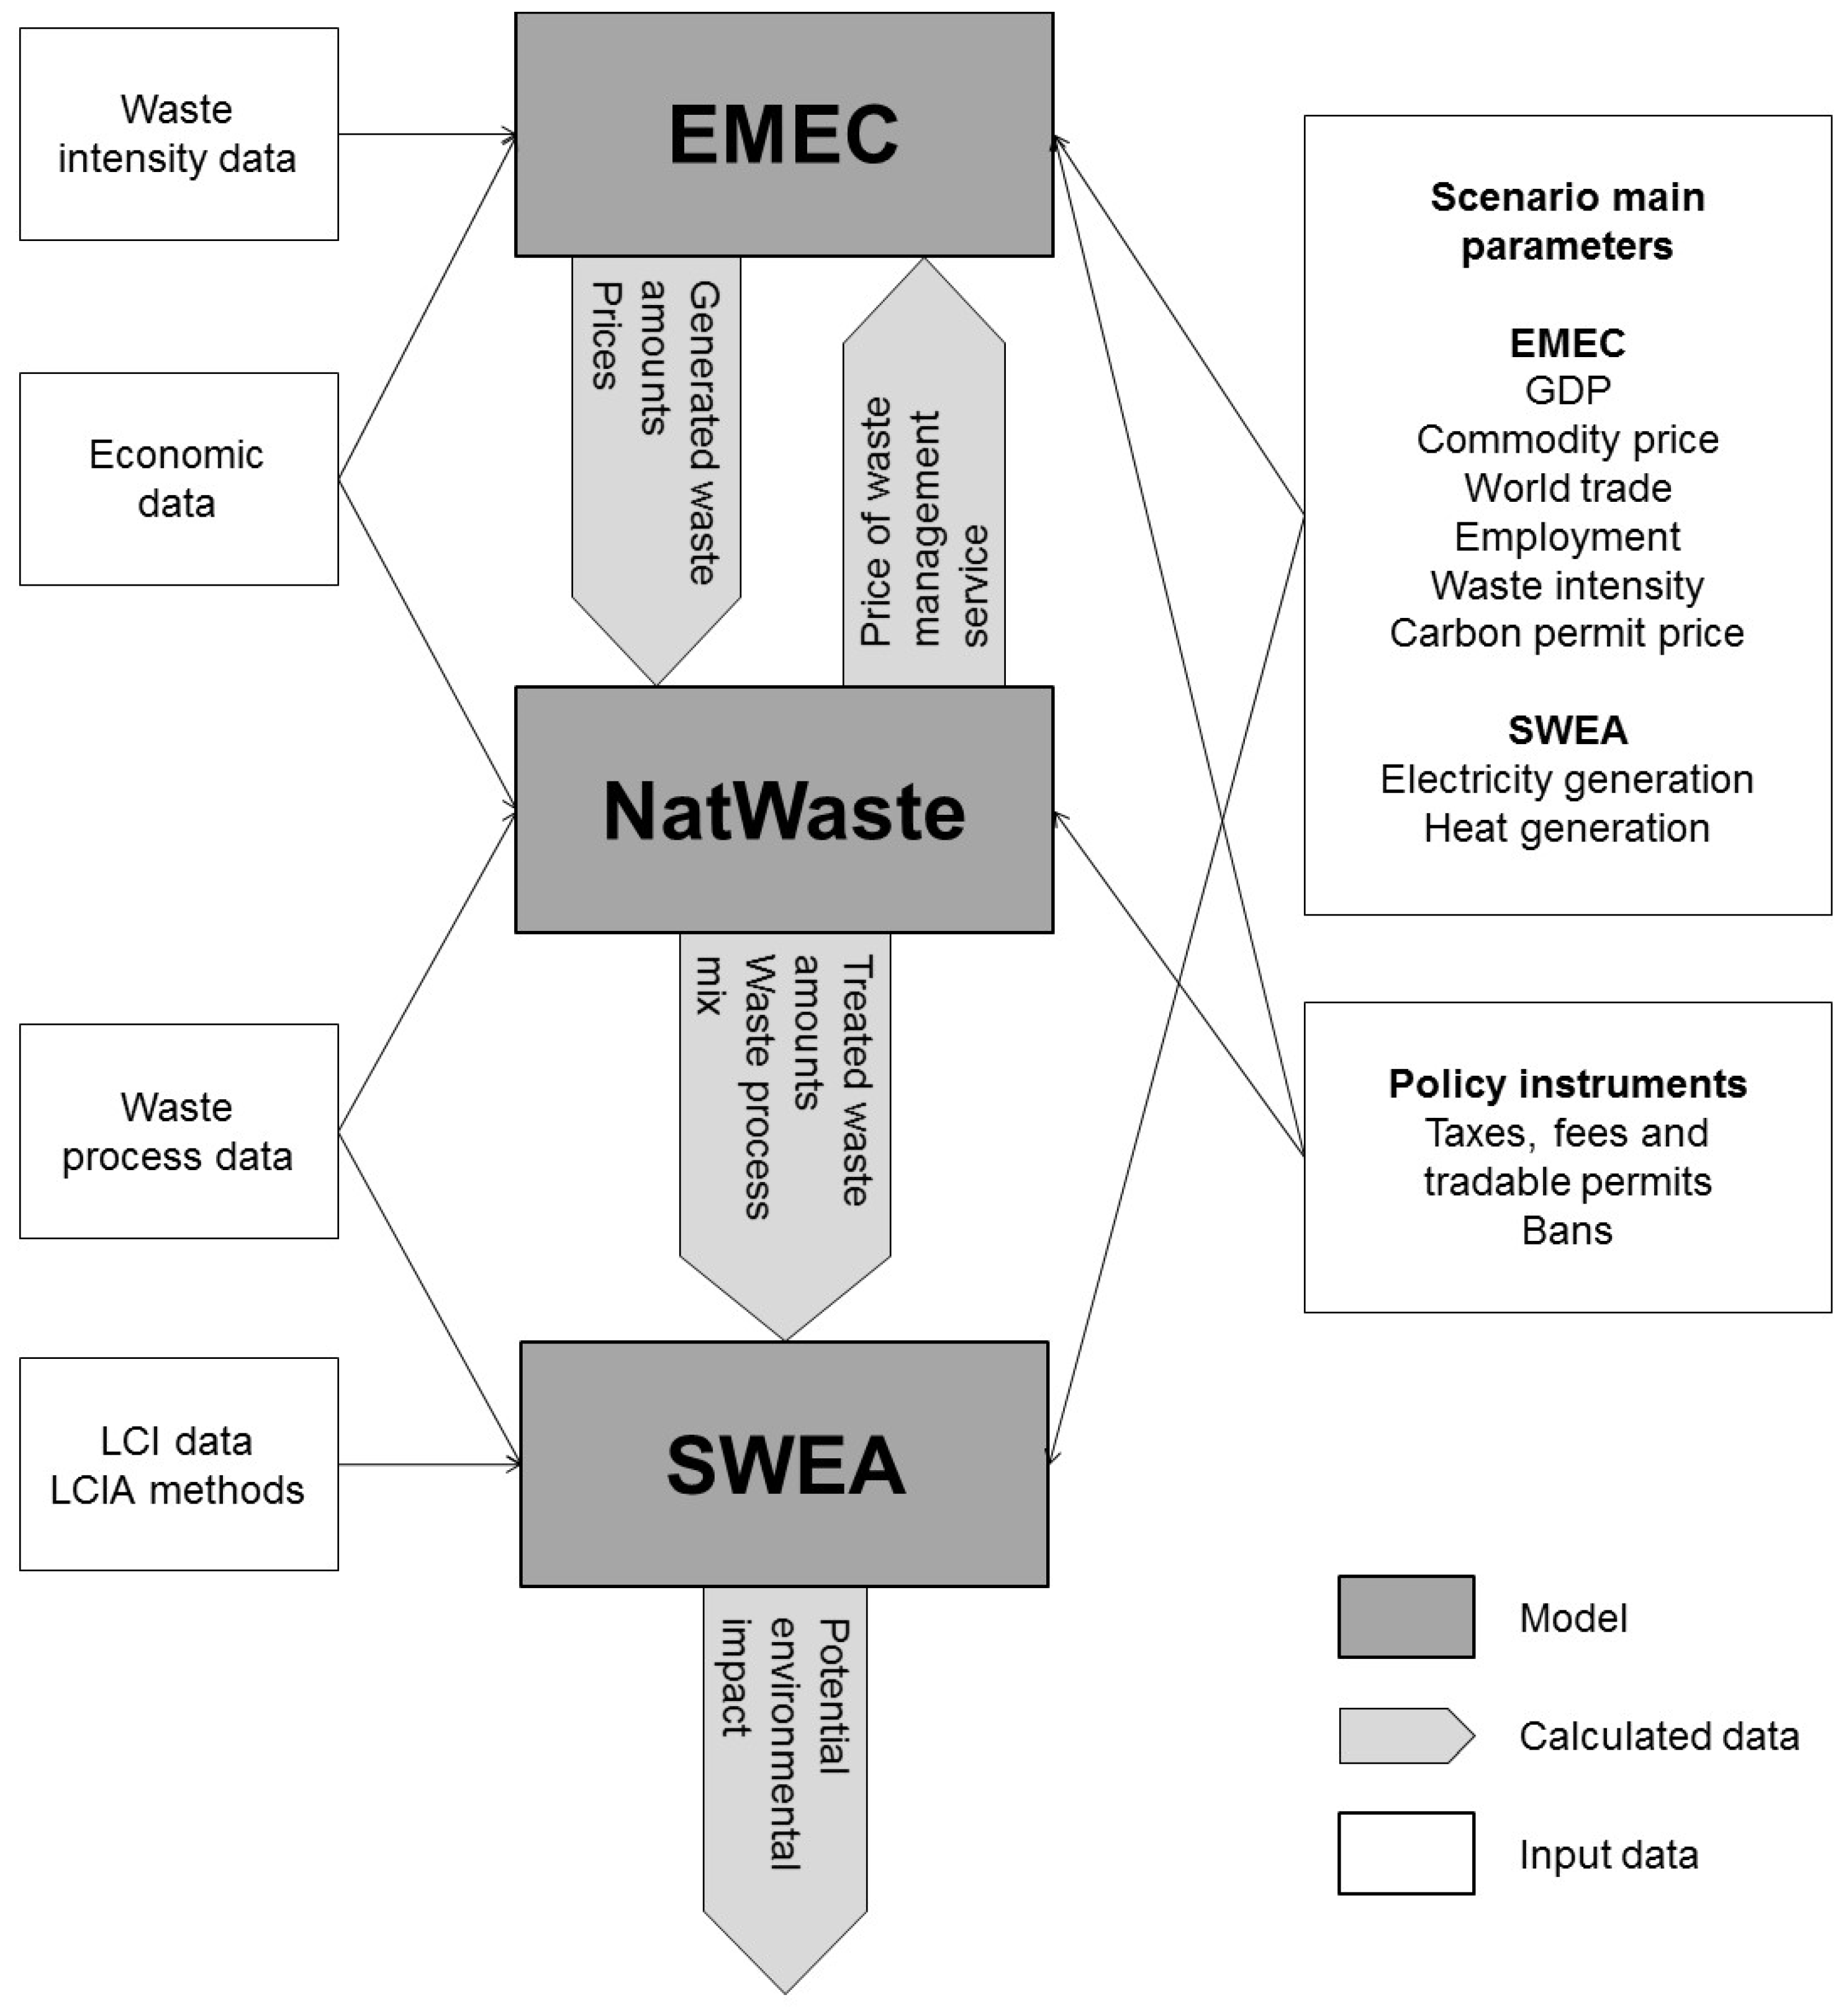
The analysis starts by establishing a base year solution in both EMEC and NatWaste, using official statistics on the economy and waste (in TOSUWAMA, the year 2006). Then, scenario assumptions for exogenous variables in EMEC (Figure 4) are used for solving the model´s endogenous variables for a future year (in TOSUWAMA, the year 2030). The solution for endogenous variables, such as the waste quantities generated (Table A1 and Table A2) in included sectors (Table A3) and the price changes of raw materials, energy, transport and labor used or produced in waste management compared to the base year are transferred to NatWaste (Figure 4). NatWaste then calculates the cost-effective process mix for managing the new waste amounts and the resulting marginal costs for each waste category and sector (Table A1 and Table A3). The marginal costs are transferred back to EMEC, in which they are handled as prices of waste management services (Figure 4), so that EMEC can calculate how firms and households react to the price change of waste management services. After the iterations between EMEC and NatWaste, described in more detail in [61], the cost-effective process mix for waste management and waste amounts are transferred from NatWaste to SWEA (Figure 4). This means that the results from NatWaste determine what waste category amounts will be handled by what process models in SWEA. Potential environmental impact is then calculated based on the resulting resource use and emissions calculated by SWEA (Figure 4 and Table A5). Note that while physical flows (material and energy) within, to and from the waste management system are the basis for modelling in NatWaste and SWEA, EMEC models economic relations in the Swedish economy, including all industrial sectors, the public sector and households.
The primary results from the linked models are: (1) the waste amounts generated by category and sector (Table A1, Table A2 and Table A3); (2) the cost-effective process mix for managing this waste (Table A4); and (3) its potential environmental impacts (Table A5). It is also possible to obtain results for recovered resources in terms of energy recovery (amounts of electricity, heat and biogas), material recycling (amounts of recycled materials) and biological treatment (amount of organic fertilizer). In addition, structural changes in the Swedish economy can be obtained.
Data transfer between the three models is achieved by means of a “soft link” set up, meaning that numerical data are transferred manually between the models. No manual translation of data is required, since the models are harmonized in terms of parameter terminology for waste categories, generating sectors and management processes. NatWaste and SWEA share the scope and level of detail in the representation of waste categories and technical waste management options, and both use physical flows (material and energy) as a basis for modelling. Where NatWaste considers costs and revenues linked to processing physical flows to, from and within waste management, SWEA considers how the same processing of physical flows links up to generated or avoided environmental impacts. EMEC models economic relations in the Swedish economy, including all industrial sectors, the public sector and households. The waste categories modelled in EMEC correspond to the European Waste Catalogue for Statistics(EWC-Stat) waste categories in the European Waste Statistics Directive [71]. Many of these categories, however, are too aggregated to be used for modelling impacts at the process level performed with NatWaste and SWEA. Therefore, most waste categories were disaggregated further in several material- or product-based subcategories when modelled in NatWaste and SWEA [61] (Table A1).
After establishing a common reference solution for the chosen scenario year, the assessment of policy instruments is performed by introducing them in EMEC, if for waste prevention, or in NatWaste, if for waste management (Figure 4). The same iterative and sequential procedure as described above is performed, and finally, the solutions are compared to that of the reference solution. This procedure can be performed under varying future external scenarios, which are described in some detail in the following section. As an illustration, the assessment of the policy instrument Differentiated value-added tax (VAT) is also briefly described.

3.5. Assessment of Policy Instruments in Scenarios

The main purpose of developing the set of linked models was to assess waste policy instruments in TOSUWAMA. Policy instruments were chosen and detailed during the course of the program in parallel with the model development [72]. First, policy instruments were suggested by stakeholders or identified in the literature. Then, 14 instruments were chosen as interesting candidates for assessment and described in some detail (Table 1). The main goals of the instruments differ: 1–8 direct waste management in a more sustainable direction; 9–13 prevent the generation and hazardousness of waste; and 14 combines both goals. The set of linked models is primarily suited for analyzing easily-quantifiable policy instruments, and after a first examination, Instruments 1–3 and 9–11 were chosen for assessment with the set of linked models. Although suitable for the set of linked models, Instruments 4 and 5 were instead assessed by literature studies, while Instrument 12 could not be assessed because of a lack of data (see Section 4.5). Other assessments in TOSUWAMA dealt with instruments 3, 6–8, 13 and 14 [14].
To explore the robustness of policy instruments, assessments were made with reference to different future developments, illustrated in scenarios for the year 2030 [62,73,74]. Besides a reference scenario assuming developments in accordance with official forecasts made in 2008, four scenarios were set up (Table 2).
The scenarios, designed to explore possible, but very different future developments of society, were initially qualitatively described. For assessment with the set of linked models, scenarios were translated into quantifications, where key assumptions concerned Gross Domestic Product (GDP), world trade, primary product prices, oil prices, employment, carbon permit price, waste intensities and energy system performance (Figure 4). The scenarios were implemented in EMEC and then transferred to NatWaste through the relative price changes calculated by EMEC. The price changes in each scenario were used for recalculating the level of unit costs and revenues for waste management in NatWaste, such as treatment and transportation costs and material and energy revenues. This ensured a consistent implementation of scenarios between the two models. SWEA implemented the scenarios in two ways, both through results on waste generation transferred via NatWaste, and assumptions on heat and electricity mixes in the energy system.
To illustrate the use of the set of linked models, the assessment of the policy instrument Differentiated VAT is briefly described [14]. A reduction of the VAT on households’ service consumption (excluding transportation), from current levels of 25% or 12% to 6%, could shift consumption from goods to services and thereby reduce waste generation and environmental impacts. The assessment of one of the two studied alternatives to finance such a tax cut, by decreasing government transfers to households, is presented.
As a first step, the EMEC model calculated an increase in service consumption by 3.6%, compared to a case without the policy instrument. It was observed that while consumption of goods fell, households’ total consumption expenditures were almost unchanged. Investments fell marginally as did imports and exports. GDP decreased by 0.1%. As a result, there was also a decrease in households’ waste generation by about 1% (corresponding to 125 ktons).
The waste amounts generated (per category and sector) for the cases with and without the policy instrument were transferred from EMEC to NatWaste. Based on this, NatWaste calculated the cost-effective process mix for managing the waste. The introduction of the Differentiated VAT only affected the amount of generated waste, but not the waste management system itself (in terms of costs, revenues or performance parameters). Thus, results only differed between the two cases in terms of waste amounts processed, while the optimal mix of waste management processes remained the same.
Finally, the waste amounts and optimal mix of waste management processes were transferred from NatWaste to SWEA. Based on this, SWEA calculated potential environmental impacts from waste management with and without the policy instrument (Table 3). “Waste management system” impacts are in the majority of categories negative since avoided burdens resulting from, e.g., recycled materials and recovered energy, are larger than direct impacts (see Section 3.3).
For most impact categories, the net result from waste management was hardly affected by the policy instrument. This can be explained by the fact that the indirect avoided burdens also decreased when waste amounts decreased. SWEA also calculated reduced impacts from production resulting from waste prevention, “avoided material production”, corresponding to the 1% reduction of households’ waste generation. When taken into account, net potential environmental impacts were reduced by up to 7% with the policy instrument. Marine eutrophication was an exception because of a relatively small contribution to this impact category from waste management itself, but a heavy dependence on emission from beef production, which was reduced as a result of the waste prevention calculated by EMEC. The results were similar in all scenarios studied (Table 2).
It was concluded that the studied alternative of Differentiated VAT may reduce environmental impacts without significantly impacting the economy as a whole. However, the relatively limited reduction of environmental impacts points to larger differentiation of VAT levels or combinations with other instruments for incentivizing larger reductions. Such options were however not assessed within TOSUWAMA.

4. Discussion

Based on experiences from developing and using the set of linked models in TOSUWAMA, the discussion aims at identifying and discussing its strengths and limitations.

4.1. The Governing Purpose

When constructing a model, the modeler must choose how to simplify reality with respect to a number of considerations. What real-world problem is the modelling intended to shed light on? What parts of the real world need to be represented in the model, and what can be left outside? What causal relationships should the model capture and how? What level of detail is required for describing causal relationships? Central to these choices is the intended purpose of the model. As stressed by [13], fitness for the purpose is crucial for the validity of hard-systems models. In our case, the overarching purpose is to provide information that enables decision-makers to reflect on decisions of waste policy design before implementation. This intended purpose governed the choices made when developing the set of linked models.

4.2. Scope and Level of Detail

Guided by the intended purpose, the modeler decides on the trade-off between scope and detail [75]. The broader the scope of a model, the more aggregated, and thus, generalized, the level of the analysis and vice versa. If no trade-offs were made, the model complexity would be so large that the modeler would not be in control. In the case of TOSUWAMA, the intended purpose of assessing a broad range of waste policy instruments requires both a large scope and significant level of detail. The set of models soft-links one top-down and two bottom-up models to capture a large scope and a large amount of detail and to allow for assessment within one harmonized framework. At the same time, the flexibility of using each model separately remains. Since all build on existing peer-reviewed models, significant benefits and initial quality assurance to the efforts can be reaped [76]. However, considerable efforts involving several modelers and analysts of various disciplines were still needed. Extensive communication was required to make sure that all approaches were sufficiently understood by all participants involved, so that linking and subsequent analyses could be correctly performed. The full resources allocated for developing and assessing policy instruments with the set of linked models in TOSUWAMA amounted to 900 kEuros and involved around ten people over a period of six years.
There are three alternative modelling approaches to soft-linking. One is to develop a single model of limited scope, the second to use a toolbox of separate models of complementary scope and the third to develop a fully-integrated model covering the whole system in focus and the same aspects modelled as in the soft-linked models.
A clear advantage of a single model approach is that there is more likely a number of existing models to use, so that model development resources could be saved or spent on data collection and analysis instead. Furthermore, one modeler could be in control of the full analysis. However, the single model approach would cover a limited part of the system in focus, and fewer aspects would be modelled. In the TOSUWAMA case, it would only be possible to assess instruments for economic aspects and limited environmental impacts, either for waste prevention (EMEC), or for waste management (NatWaste), or for comprehensive environmental impacts of both waste prevention and management (SWEA). Not only would a single model limit the range of policy instruments, it would also require a number of assumptions to be made exogenously about, e.g., waste generation and prices of waste disposal services.
Existing models and assessment methods can be collected in a toolbox and used in parallel to model and analyze different aspects or parts of the system in focus. This approach has been used to, for example, assess possible future European resource policies in the EU 7th Framework project Dynamix [77]. The toolbox approach does not suffer from the limited scope of a single model. In fact, the total scope can easily be expanded beyond the scope of a limited set of soft-linked models. However, in contrast to soft-linking, the toolbox approach does not allow for modelling the links between the systems, system levels or aspects covered by each separate model. In addition, the results from the different models can be difficult to compare. This makes the synthesis more difficult and possibly more subjective, compared to an analysis with a set of soft-linked models.
A fully-integrated model covering the whole system in focus and the same aspects modelled as the set of linked models does not exist for waste policy assessments to our knowledge. Its development would require considerable resources, both in terms of expertise and time, but could, on the other hand, offer significant benefits of control and productivity when put into use. The drawbacks of a single large model may include a loss of transparency, which reduces what can be learned from the modelling [76]. The complexity of such a model can make it difficult to validate it and to explain the results it produces. In practice, fully-integrated models often opt for a simplified modelling of either macroeconomic or technologies in order to be of a manageable complexity, as can be noted in, e.g., energy-economy analysis [78].

4.3. Harmonization of Models

The set of soft-linked models needed to be harmonized to ensure consistency in terminology, common model parameters and data and implementation of policy instruments and scenarios. Because of the large number of data transferred between the models, it was also important that these data could be exchanged without manual translation. Overall, the harmonization of NatWaste and SWEA was straightforward, while in some respects more challenging with EMEC. This is not surprising, because the scope and detail of NatWaste and SWEA are similar, but very different from those of EMEC (see Section 3).
The more aggregated level of EMEC needed to be consistently matched with the more disaggregated level in NatWaste and SWEA. One such case was the description of waste categories. While EMEC works with the aggregated waste categories of European waste statistics, these are too aggregated for a meaningful analysis in NatWaste and SWEA (see Section 3 and Table A1). Although one of the most time-consuming tasks in the development of the set of models, it was possible to collect data to disaggregate waste categories for the needs of NatWaste and SWEA and to establish a smooth exchange of data on waste flows between the three models.
Resolving the different aggregate levels in the description of virgin and recovered materials and energy could, however, not be prioritized within the scope of TOSUWAMA and had thus to be treated as a limitation when assessing policy instruments. Recovered materials and energy from waste are beneficial outputs from the waste-management system and are modelled and thus possible to capture in assessments with NatWaste and SWEA. EMEC, however, does not distinguish between virgin and secondary materials and also not between biofuels and energy from waste. This means that the value of recovered resources in the overall economy cannot be separated from that of virgin ones by the set of models.
Another issue regards the harmonization of scopes. The economy-wide scope of EMEC includes all industrial sectors and households. Waste management activities are part of the EMEC sectors “Water and sewage” and “Services”, which means the scope of EMEC overlaps the ones of NatWaste and SWEA. Ideally, soft-linking should control and include corrections for overlaps [76]. However, such control requires significant efforts to accomplish, which could not be prioritized. This means that although there is feedback between NatWaste and EMEC through the price of waste disposal services, there is no feedback directly to the structure of the two sectors “Water and sewage” and “Services”.
In short, soft-linking captures the impact of the price of waste disposal services in the whole economy (in the feedback from NatWaste to EMEC), the waste quantities and the economy’s overall relative price changes (in the feedback from EMEC to NatWaste), but no other economic feedbacks. This can be argued as being a reasonable prioritization for the intended purpose of TOSUWAMA as long as the scale of recovered materials and energy from waste compared to virgin materials and energy biofuels, and the scale of waste management compared to industrial sectors, are small and not likely to significantly impact the economy-wide equilibrium. However, if more radical changes in material recycling and other ways of closing material loops as major parts of the economy are to be analyzed in other studies, a revision should be considered. For comparison, in energy-economy analyses using soft-linked macro-economic models and energy systems engineering models, strict procedures to control overlaps and feedbacks are used, since impacts may be significant (e.g., [76,79]). Technical changes in the energy system may involve considerable feedbacks to the rest of the economy, and conversely, major changes in the economy may impact the demand for energy and costs for energy inputs to the energy system [76].

4.4. Data Availability

Despite the advantage of using existing models and focusing only on modelling those system aspects necessary for the intended purpose, significant work was needed to find and adapt new data, both for harmonization between models and for complementing individual models. Certain parts initially planned for had to be excluded owing to the lack of data.
Data could be collected so that EMEC covered all waste categories encompassed by European waste statistics, except those outside the scope of TOSUWAMA (see Section 3). Data could also be collected and generated so that NatWaste and SWEA covered all non-hazardous waste categories in EMEC and their management. However, while generation of hazardous waste was modelled in EMEC, available data about its treatment options was either incomplete or too specific to include in NatWaste and SWEA (Table A2). Overall, there is a lack of system studies in both hazardous waste treatment and hazardous content in material flows. The latter contributed to the difficulties in allocating hazardous substances to materials in EMEC, which would have been needed for assessing the policy instrument of a tax on hazardous substances (Instrument No. 12, Table 1).
Due to an almost complete lack of data, waste prevention by introducing a specific technology in industrial production could not be included in EMEC as initially planned. In sum, four ways of preventing waste were modelled in EMEC: (1) a general yearly autonomous efficiency improvement of all activities in the economy; (2) substitution to less waste-generating inputs in production (substitution between the inputs of material, energy, labor and capital); (3) reduction of waste-intensive production in favor of less waste-intensive production; and (4) replacement in consumed goods and services from waste-intensive to less waste-intensive, but more expensive ones. This limitation may result in a somewhat underestimated impact of policy instruments on industrial waste prevention in the assessments.

4.5. Policy Instruments

The set of linked models is primarily suited for analyzing easily quantifiable policy instruments. In TOSUWAMA, these instruments were concerned with the introduction of taxes, fees, tradable permits and bans, which, using the typology referred to by [80], belong to the three categories of using markets, creating markets and environmental regulations. Instruments in the category engaging the public (information disclosure, public participation and voluntary agreements) are not suitable and would require other types of assessments.
Nevertheless, for a couple of otherwise quantifiable policy instruments, there were model limitations that required additional assumptions to be made. These concerned, for example, the value of recovering energy from waste in relation to other energy conversion options. When assessing policy instruments connected to biogas production and heat and electricity generation, energy system models could be useful for better capturing of the systemic conditions of such options.
EMEC and NatWaste both assess the economic effect of instruments, whereafter SWEA assesses the environmental consequences. This is a limitation since instruments may not only impact on strict economic grounds. For example, it has been empirically observed that a weight-based fee for the collection of household waste (Instrument 3, Table 1) may lead to a mix of waste prevention, increased source separation and illegal waste dumping, indicating different and other than pure cost-efficient responses among households to the instrument [81]. In TOSUWAMA, the level and mix between these three outcomes were assumed exogenously and then assessed with NatWaste and SWEA.
Other means for managing material flows in society, such as product life extension, re-use and remanufacturing, may be part of waste policy or, rather, resource-efficiency policy. The set of linked models is not particularly suited to analyzing such instruments, because of the aggregated level of material flows, as modelled in EMEC, and because NatWaste and SWEA focus on modelling the management of waste already generated. Further development of the set would then be needed or other approaches would have to be considered.

5. Conclusions

The need for policy instruments supporting a transition from mere end-of-pipe solutions to resource management has been recognized in European policy. If such instruments are to be introduced, they need to be carefully designed and assessed before implementation in order to promote the desired changes and avoid problem shifting. Ex ante assessments using mathematical models, as presented in this paper, may assist decision-makers designing policy instruments. Three existing models were soft-linked for assessing policy instruments for both the prevention and management of waste within one harmonized framework. The set of linked models is primarily suited for analyzing easily-quantifiable policy instruments, such as bans, taxes and fees. Several such instruments were assessed and contributed to the synthesis of TOSUWAMA [14].
Neither the wide range of waste policy instruments nor the scope of their potential impacts would have been possible to assess if only one of the three models had been used. However, considerable resources were needed for adapting, soft-linking and using the models. Full integration into a single model would probably have involved significantly more resources in time and multidisciplinary expertise to develop and might have resulted in reductions in the complexity captured, but may, on the other hand, require fewer analysts once in place. On the other hand, considering the breadth of the issues addressed and the many perspectives involved, it may be an advantage to use soft-linked models: a broad group of analysts brought to the table may enrich the work, from the design of the study through development and use of tools to the assessment and interpretation of results. However, time and good communications are essential to obtaining benefits from such diversity.
There are clear limits as to what this specific modelling approach, and indeed any such approaches, can address and also to the extent to which they meet the needs of decision-makers. It has been noted that despite a strong research interest in developing and conducting formal modelling assessments, they have not yet been extensively used for supporting decision-making on policy [82,83]. However, considering the growing needs of societal governance of material resources and possible requirements for new, clever and robust policy initiatives, the usefulness of model assessments may increase. In this perspective, soft-linked models may be a way forward, allowing many aspects to be addressed and disciplines to contribute.

Acknowledgments

The Swedish Environmental Protection Agency is acknowledged for funding the TOSUWAMA program. Contributions from other TOSUWAMA researchers and stakeholders are also acknowledged.

Author Contributions

The content of the paper relies on a collective effort undertaken by several researchers in TOSUWAMA. Maria Ljunggren Söderman wrote most of the paper, carried out the research involving NatWaste and contributed to SWEA. Ola Eriksson co-authored the paper and contributed to SWEA. Anna Björklund co-authored the paper and led the research on SWEA. Göran Östblom led the research on EMEC including the writing of corresponding parts. Tomas Ekvall and Göran Finnveden conceived and led the design of the TOSUWAMA program and provided feedback on the paper. Yevgeniya Arushanyan contributed to SWEA. Jan-Olov Sundqvist led the development of waste coefficients for EMEC.

Conflicts of Interest

The authors declare no conflict of interest.

Appendix

The Appendix contains further model specifications with the purpose of clarifying what data are being transferred between the models and what results the set of linked models generates.
Table A1. Non-hazardous waste categories modelled in EMEC, NatWaste and SWEA and corresponding EWC-Stat waste category codes [71].
Non-Hazardous Waste Categories
EWC-Stat CodeEMECNatWaste and SWEA
1.2, 1.4, 2, 3.1Chemical wastesChemical
3.2, 11, 11.3SludgeIndustrial sludge organic
Industrial sludge non-organic
Sewage sludge
6Metal wastesAluminum
Ferrous
Stainless
Other metal
7.1Glass wastesGlass clear
Glass color
7.2Paper wastesCardboard
Corrugated board
Newsprint
Office paper
Fiber reject
7.3Rubber wastesRubber
7.4Plastic wastesPolyethylene (PE)
Polypropylene
Polyethylene terephthalate
Polystyrene (PS)
Polyvinyl chloride (PVC)
Polyurethane
Polycarbonate
Agricultural film
Agricultural cans
Agricultural other
7.5Wood wastesWood
7.6Textile wastesTextile
8Discarded equipmentEquipment
8.1Discarded vehiclesNot included
8.41Batteries and accumulatorsNot included
9Animal and vegetal wastesManure
Animal waste
Animal waste to be hygienized
Vegetal waste
Park waste
Foods waste
10.1Household wastesHousehold and similar waste
Foods
Park
Newsprint
Corrugated board
Cardboard
PE
PS
Glass clear
Glass color
Metals
Landfill residues
Hazardous waste
Equipment
Wood
Textile
Other combustible waste
Bulky waste
Paper
Plastics
Wood
Plaster
Inert mix
10.2Mixed materialsCombustible wastes
Paper
Plastics
Wood
Non-combustible wastes
Plaster
Inert mix
Mixed wastes
Paper
Plastics
Wood
Plaster
Inert mix
10.3Sorting residuesRecycled fiber reject
Sorting ashes
12Mineral wastesPlaster
Inert mix
Asphalt
12.4Combustion wastesSteel industry slag, blast-furnace
Steel industry slag, other
Wood fly ash
Other ashes
Table A2. Hazardous waste categories modelled in EMEC and corresponding EWC-Stat waste category codes [71]. These categories were not included in NatWaste and SWEA.
Hazardous Waste Categories
EWC-Stat CodeEMECNatWaste and SWEA
1.1Spent solventsNot included
1.3Used oilsNot included
1.2, 1.4, 2, 3.1Chemical wastesNot included
3.2SludgeNot included
6Metal wastesNot included
7.1Glass wastesNot included
7.5Wood wastesNot included
7.7PCB wastesNot included
8Discarded equipmentNot included
8.1Discarded vehiclesNot included
8.41Batteries and accumulatorsNot included
10.2Mixed materialsNot included
10.3Sorting residuesNot included
12Mineral wastesNot included
12.4Combustion wastesNot included
12.6Contaminated soilsNot included
Table A3. Sectors modelled in EMEC, NatWaste and SWEA.
Sectors in EMECSectors in NatWaste and SWEA
AgricultureIndustry
Fishery
Forestry
Mining
Other industries
Mineral products
Pulp and paper mills
Drug industries
Other chemical industries
Iron and steel industries
Non-iron metal industries
Engineering
Petroleum refineries
Electricity supply
Hot water supply
Gas distribution
Water and sewage
Construction
Railroad transports
Road goods transports
Road passenger transports
Sea transports
Air transports
Other transports
Services
Real estate
Public
HouseholdsHouseholds
Table A4. Waste processes modelled in NatWaste and SWEA.
Collection and Transport OptionsWaste Treatment Options
Curbside collection of organic and residual waste in separate bagsSorting biofuel heat boiler
Biofuel heat boiler
Curbside collection of organic and residual waste in separate binsCombined heat and power
Heat only boiler
Curbside collection of comingled wasteCement kiln
Curbside collection of fully-separated wasteAnaerobic digestion
Fully-separated waste at local recycling stationWindow compost
Fully-separated waste at central recycling center regional transportReactor compost
Material recycling
Landfill
Table A5. Potential environmental impacts indicators calculated by SWEA using the LCIA methods ReCiPe Midpoint (H) v 1.06method [70] and cumulative energy demand [84].
ReCiPe Environmental Impact IndicatorsCumulative Energy Demand Impact Indicators
Climate changeNonrenewable, fossil
Ozone depletionNon-renewable, nuclear
Human toxicityRenewable, biomass
Photochemical oxidant formationRenewable, wind, solar, geothermal
Particulate matter formationRenewable, water
Ionizing radiation
Terrestrial acidification
Freshwater eutrophication
Marine eutrophication
Terrestrial ecotoxicity
Freshwater ecotoxicity
Marine ecotoxicity
Agricultural land occupation
Urban land occupation
Natural land transformation
Water depletion
Metal depletion
Fossil depletion

References

  1. Swedish Government. SFS 1994:1205 Förordning om Producentansvar för Returpapper (Ordinance on Producers’ Responsibility for Waste Paper, in Swedish); Ministry of the Environment: Stockholm, Sweden, 1994.
  2. Swedish Government. SFS 1994:1235 Förordning om Producentansvar för Förpackningar (Ordinance on Producers’ Responsibility for Packages, in Swedish); Ministry of the Environment: Stockholm, Sweden, 1994.
  3. Swedish Government. SFS 1994:1236 Förordning om Producentansvar för Däck (Ordinance on Producers’ Responsibility for Tyres, in Swedish); Ministry of the Environment: Stockholm, Sweden, 1994.
  4. Swedish Government. Government Bill 1996/97:172. Hantering av Uttjänta varor i ett Ekologiskt Hållbart Samhälle—Ett Ansvar för Alla (Management of Used Goods in an Ecologically Sustainable Society, in Swedish); Ministry of the Environment: Stockholm, Sweden, 1996.
  5. Swedish Government. SFS 1999:673 Förordning om Skatt på Avfall (Ordinance on tax on Waste, in Swedish); Ministry of Finance: Stockholm, Sweden, 1999.
  6. Swedish Government. SFS 1998:902 Renhållningsförordning (Ordinance on Waste Management, in Swedish); Ministry of the Environment: Stockholm, Sweden, 1998.
  7. Swedish Government. SFS 2001:512 Förordning om Deponering av Avfall (Ordinance on Landfilling of Waste, in Swedish); Ministry of the Environment: Stockholm, Sweden, 2001.
  8. Swedish Government. Government bill 1997/98:145. Svenska Miljömål. Miljöpolitik för ett Hållbart Sverige. (Swedish Environmental Quality Goals an Environmental Policy for a Sustainable Sweden, in Swedish); Ministry of the Environment: Stockholm, Sweden, 1997.
  9. Swedish Environmental Protection Agency. Strategy for Sustainable Waste Management. Sweden's Waste Plan; Swedish Environmental Protection Agency: Stockholm, Sweden, 2005.
  10. Swedish Environmental Protection Agency. From Waste Management to Resource Efficiency. Sweden's Waste Plan 2012–2017; Swedish Environmental Protection Agency: Stockholm, Sweden, 2012.
  11. European Commission. Closing the Loop—An eu Action Plan for the Circular Economy, COM 614/2; European Commission: Brussels, Belgium, 2015. [Google Scholar]
  12. European Commission. Directive 2008/98/EC of the European Parliament and of the Council of 19 November 2008 on Waste and Repealing Certain Directives; European Commission: Brussels, Belgium, 2008. [Google Scholar]
  13. Pidd, M. Why modelling and model use matter. J. Oper Res. Soc. 2010, 61, 14–24. [Google Scholar] [CrossRef]
  14. Finnveden, G.; Ekvall, T.; Arushanyan, Y.; Bisaillon, M.; Henriksson, G.; Östling, U.G.; Ljunggren Söderman, M.; Sahlin, J.; Stenmarck, Å.; Sundberg, J.; et al. Policy instruments towards a sustainable waste management. Sustainability 2013, 5, 841–881. [Google Scholar] [CrossRef]
  15. Anderson, L.; Nigam, A. A Mathematical Model for the Optimization of a Waste Management System; SERL Report; University of California at Berkeley, Sanitary Engineering Research Laboratory: Berkeley, CA, USA, 1968. [Google Scholar]
  16. Helms, B.P.; Clark, R.M. Locational models for solid waste management. J. Urban Plan. Dev. Div. 1971, 97, 1–13. [Google Scholar]
  17. Morse, N.; Roth, E.W. Systems Analysis of Regional Solid Waste Handling; United States Environmental Protection Agency: Washington, D.C., USA, 1970; Volume 2065.
  18. Berger, C.; Chauny, F.; Langevin, A.; Loulou, R.; Riopel, D.; Savard, G.; Waaub, J.-P. Eugene: An Optimization-Based Decision Support System for Long Term Integrated Regional Solid Waste Management Planning; Group for Research in Decision Analysis (GERAD): Montreal, QC, Canada, 1998. [Google Scholar]
  19. Chang, N.-B.; Schuler, R.; Shoemaker, C.A. Environmental and economic optimization of an integrated solid waste management system. J. Resour. Manag. Technol. 1993, 21, 87–98. [Google Scholar]
  20. Eriksson, O.; Olofsson, M.; Ekvall, T. How model-based systems analysis can be improved for waste management planning. Waste Manag. Res. 2003, 21, 488–500. [Google Scholar] [CrossRef] [PubMed]
  21. Juul, N.; Münster, M.; Ravn, H.; Ljunggren Söderman, M. Challenges when performing economic optimization of waste treatment: A review. Waste Manag. 2013, 33, 1918–1925. [Google Scholar] [CrossRef] [PubMed]
  22. Sundberg, J.; Gipperth, P.; Wene, C.O. A systems-approach to municipal solid-waste management—A pilot-study of Goteborg. Waste Manag. Res. 1994, 12, 73–91. [Google Scholar] [CrossRef]
  23. Tanskanen, J.H. Strategic planning of municipal solid waste management. Resour. Conserv. Recycl. 2000, 30, 111–133. [Google Scholar] [CrossRef]
  24. Cleary, J. Life cycle assessments of municipal solid waste management systems: A comparative analysis of selected peer-reviewed literature. Environ. Int. 2009, 35, 1256–1266. [Google Scholar] [CrossRef] [PubMed]
  25. Gentil, E.C.; Damgaard, A.; Hauschild, M.; Finnveden, G.; Eriksson, O.; Thorneloe, S.; Kaplan, P.O.; Barlaz, M.; Muller, O.; Matsui, Y.; et al. Models for waste life cycle assessment: Review of technical assumptions. Waste Manag. 2010, 30, 2636–2648. [Google Scholar] [CrossRef] [PubMed]
  26. Laurent, A.; Bakas, I.; Clavreul, J.; Bernstad, A.; Niero, M.; Gentil, E.; Hauschild, M.Z.; Christensen, T.H. Review of LCA studies of solid waste management systems—Part i: Lessons learned and perspectives. Waste Manag. 2014, 34, 573–588. [Google Scholar] [CrossRef] [PubMed]
  27. Winkler, J.; Bilitewski, B. Comparative evaluation of life cycle assessment models for solid waste management. Waste Manag. 2007, 27, 1021–1031. [Google Scholar] [CrossRef] [PubMed]
  28. Björklund, A.; Bjuggren, C.; Dalemo, M.; Sonesson, U. Planning biodegradable waste management in Stockholm. J. Ind. Ecol. 1999, 3, 43–58. [Google Scholar] [CrossRef]
  29. McDougall, F.R.; Hruska, J.P. Report: The use of life cycle inventory tools to support an integrated approach to solid waste management. Waste Manag. Res. 2000, 18, 590–594. [Google Scholar] [CrossRef]
  30. Weitz, K.; Barlaz, M.; Ranjithan, R.; Brill, D.; Thorneloe, S.; Ham, R. Life cycle management of municipal solid waste. Int. J. Life Cycle Assess. 1999, 4, 195–201. [Google Scholar] [CrossRef]
  31. Nilsson, M.; Bjorklund, A.; Finnveden, G.; Johansson, J. Testing a SEA methodology for the energy sector: A waste incineration tax proposal. Environ. Impact Assess. 2005, 25, 1–32. [Google Scholar] [CrossRef]
  32. Assefa, G.; Björklund, A.; Eriksson, O.; Frostell, B. Orware: An aid to environmental technology chain assessment. J. Clean. Prod. 2005, 13, 265–274. [Google Scholar] [CrossRef]
  33. Menard, J.F.; Lesage, P.; Deschenes, L.; Samson, R. Comparative life cycle assessment of two landfill technologies for the treatment of municipal solid waste. Int. J. Life Cycle Assess. 2004, 9, 371–378. [Google Scholar] [CrossRef]
  34. Eriksson, O.; Bisaillon, M. Multiple system modelling of waste management. Waste Manag. 2011, 31, 2620–2630. [Google Scholar] [CrossRef] [PubMed]
  35. Munster, M.; Ravn, H.; Hedegaard, K.; Juul, N.; Soderman, M.L. Economic and environmental optimization of waste treatment. Waste Manag. 2015, 38, 486–495. [Google Scholar] [CrossRef] [PubMed] [Green Version]
  36. Bjorklund, A.E.; Finnveden, G. Life cycle assessment of a national policy proposal—The case of a Swedish waste incineration tax. Waste Manag. 2007, 27, 1046–1058. [Google Scholar] [CrossRef] [PubMed]
  37. Holmgren, K.; Gebremedhin, A. Modelling a district heating system: Introduction of waste incineration, policy instruments and co-operation with an industry. Energy Policy 2004, 32, 1807–1817. [Google Scholar] [CrossRef]
  38. Sahlin, J.; Ekvall, T.; Bisaillon, M.; Sundberg, J. Introduction of a waste incineration tax: Effects on the Swedish waste flows. Resour. Conserv. Recycl. 2007, 51, 827–846. [Google Scholar] [CrossRef]
  39. Browne, D.; O'Regan, B.; Moles, R. Use of carbon footprinting to explore alternative household waste policy scenarios in an Irish city-region. Resour. Conserv. Recycl. 2009, 54, 113–122. [Google Scholar] [CrossRef]
  40. Ljunggren, M. Modelling national solid waste management. Waste Manag. Res. 2000, 18, 525–537. [Google Scholar] [CrossRef]
  41. Ljunggren Söderman, M.; Sundberg, J. Strategic waste management planning in a Swedish region. J. Solid Waste Technol. Manag. 2004, 30, 187–202. [Google Scholar]
  42. Chang, N.-B. Economic and policy instrument analyses in support of the scrap tire recycling program in taiwan. J. Environ. Manag. 2008, 86, 435–450. [Google Scholar] [CrossRef] [PubMed]
  43. Bruvoll, A.; Ibenholt, K. Future waste generation—Forecasts on the basis of a macroeconomic model. Resour. Conserv. Recycl. 1997, 19, 137–149. [Google Scholar] [CrossRef]
  44. Ibenholt, K. Material accounting in a macroeconomic framework—Forecast of waste generated in manufacturing industries in Norway. Environ. Resour. Econ. 2003, 26, 227–248. [Google Scholar] [CrossRef]
  45. Faehn, T.; Holmoy, E. Trade liberalisation and effects on pollutive emissions to air and deposits of solid waste. A general equilibrium assessment for Norway. Econ. Model. 2003, 20, 703–727. [Google Scholar]
  46. Wiebelt, M. Hazardous waste management in South African mining-a CGE analysis of the economic impacts. Dev. South. Afr. 2001, 18, 169–187. [Google Scholar]
  47. Xie, J.; Saltzman, S. Environmental policy analysis: An environmental computable general-equilibrium approach for developing countries. J. Policy Model. 2000, 22, 453–489. [Google Scholar] [CrossRef]
  48. Bartelings, H. Municipal Solid Waste Management Problems: An Applied General Equilibrium Analysis; Wageningen Universiteit: Wageningen, The Netherlands, 2003. [Google Scholar]
  49. Sjostrom, M.; Ostblom, G. Decoupling waste generation from economic growth—A CGE analysis of the Swedish case. Ecol. Econ. 2010, 69, 1545–1552. [Google Scholar] [CrossRef]
  50. Sundqvist, J.-O.; Stenmarck, Å.; Ekvall, T. Model for Future Waste Generation IVL; Swedish Environmental Research Institute: Stockholm, Sweden, 2010. [Google Scholar]
  51. Bohringer, C.; Loschel, A. Computable general equilibrium models for sustainability impact assessment: Status quo and prospects. Ecol. Econ. 2006, 60, 49–64. [Google Scholar] [CrossRef]
  52. Benoit, C.; Norris, G.A.; Valdivia, S.; Ciroth, A.; Moberg, A.; Bos, U.; Prakash, S.; Ugaya, C.; Beck, T. The guidelines for social life cycle assessment of products: Just in time! Int. J. Life Cycle Assess. 2010, 15, 156–163. [Google Scholar] [CrossRef]
  53. Finkbeiner, M.; Schau, E.M.; Lehmann, A.; Traverso, M. Towards life cycle sustainability assessment. Sustainability 2010, 2, 3309–3322. [Google Scholar] [CrossRef]
  54. Guinee, J.B.; Heijungs, R.; Huppes, G.; Zamagni, A.; Masoni, P.; Buonamici, R.; Ekvall, T.; Rydberg, T. Life cycle assessment: Past, present, and futures. Environ. Sci. Technol. 2011, 45, 90–96. [Google Scholar] [CrossRef] [PubMed]
  55. Halog, A.; Manik, Y. Advancing integrated systems modelling framework for life cycle sustainability assessment. Sustainability 2011, 3, 469–499. [Google Scholar] [CrossRef]
  56. Kloepffer, W. Life cycle sustainability assessment of products. Int. J. Life Cycle Assess. 2008, 13, 89–94. [Google Scholar] [CrossRef]
  57. Klopffer, W. Life-cycle based methods for sustainable product development. Int. J. Life Cycle Assess. 2003, 8, 157–159. [Google Scholar] [CrossRef]
  58. Zamagni, A. Life cycle sustainability assessment. Int. J. Life Cycle Assess. 2012, 17, 373–376. [Google Scholar] [CrossRef]
  59. Östblom, G. An Environmental Medium Term Economic Model EMEC. Working Paper 69; National Institute for Economic Research: Stockholm, Sweden, 1999. [Google Scholar]
  60. Östblom, G.; Berg, C. The EMEC Model: Version 2.0. Working Paper 96; National Institute of Economic Research: Stockholm, Sweden, 2006. [Google Scholar]
  61. Östblom, G.; Ljunggren Söderman, M.; Sjöström, M. Analysing Future Solid Waste Generation—Soft Linking a Model for Waste Management with a CGE-Model for Sweden. Working paper 118; National Institute of Economic Research: Stockholm, Sweden, 2010. [Google Scholar]
  62. Sjöström, M.; Östblom, G. Future Waste Scenarios for Sweden Based on a CGE-Model. Working Paper 109; National Institute of Economic Research: Stockholm, Sweden, 2009. [Google Scholar]
  63. Swedish Environmental Protection Agency. Avfall i Sverige 2006; Swedish Environmental Protection Agency: Stockholm, Sweden, 2008.
  64. Ljunggren Söderman, M. Including indirect environmental impacts in waste management planning. Resour. Conserv. Recycl. 2003, 38, 213–241. [Google Scholar] [CrossRef]
  65. Björklund, A.; Ambell, C.; Arushanyan, Y.; Eriksson, O. Swea Waste Treatment, LCI Datasets in CPM LCA Database; Swedish Life Cycle Center: Gothenburg, Sweden, 2013. [Google Scholar]
  66. Clift, R.; Doig, A.; Finnveden, G. The application of life cycle assessment to integrated solid waste management—Part 1—Methodology. Process Saf. Environ. Prot. 2000, 78, 279–287. [Google Scholar] [CrossRef]
  67. Finnveden, G.; Hauschild, M.Z.; Ekvall, T.; Guinée, J.; Heijungs, R.; Hellweg, S.; Koehler, A.; Pennington, D.; Suh, S. Recent developments in life cycle assessment. J. Environ. Manag. 2009, 91, 1–21. [Google Scholar] [CrossRef] [PubMed]
  68. Eriksson, O.; Frostell, B.; Bjorklund, A.; Assefa, G.; Sundqvist, J.O.; Granath, J.; Carlsson, M.; Baky, A.; Thyselius, L. Orware—A simulation tool for waste management. Resour. Conserv. Recycl. 2002, 36, 287–307. [Google Scholar] [CrossRef]
  69. Ecoinvent Centre. Ecoinvent Data v2.0, Final Reports Ecoinvent 2000 No. 1–15, as Included in Simapro; Swiss Centre for Life Cycle Inventories: Dübendorf, Switzerland, 2007. [Google Scholar]
  70. Goedkoop, M.J.; Heijungs, R.; Huijbregts, M.; de Schryver, A.; Struijs, J.; Van Zelm, R. ReCiPe 2008. A Life Cycle Impact Assessment Method Which Comprises Harmonised Category Indicators at the Midpoint and the Endpoint Level, First edition. Report i: Characterisation. Available online: http://www.leidenuniv.nl/cml/ssp/publications/recipe_characterisation.pdf (accessed on 21 April 2016).
  71. European Commission. Regulation (ec) No. 2150/2002 of the European Parliament and the Council of 25 November 2002 on Waste Statistics; European Commission: Brussels, Belgium, 2002. [Google Scholar]
  72. Finnveden, G.; Bisaillon, M.; Noring, M.; Stenmarck, Å.; Sundberg, J.; Sundqvist, J.-O.; Tyskeng, S. Developing and evaluating new policy instruments for sustainable waste management. Int. J. Environ. Sustain. Dev. 2012, 11, 19–31. [Google Scholar] [CrossRef]
  73. Dreborg, K.-H.; Tyskeng, S. Framtida Förutsättningar för en Hållbar Avfallshantering (Future Conditions for a Sustainable Waste Management, in Swedish); KTH Royal Institute of Technology, Miljöstrategisk analys—Fms: Stockholm, Sweden, 2008. [Google Scholar]
  74. Munster, M.; Finnveden, G.; Wenzel, H. Future waste treatment and energy systems—Examples of joint scenarios. Waste Manag. 2013, 33, 2457–2464. [Google Scholar] [CrossRef] [PubMed]
  75. Wene, C.O. Exploring and Mapping: An Intercomparison of the IEA-Markal and CEC-EFOM Technical Energy System Models and the ANL Electric Utility Model. BNL-52224; Brookhaven National Laboratory: Upton, NY, USA, 1989. [Google Scholar]
  76. Wene, C.O. Energy-economy analysis: Linking the macroeconomic and systems engineering approaches. Energy 1996, 21, 809–824. [Google Scholar] [CrossRef]
  77. Umpfenbach, K. Common Approach for Dynamix. In How Will We Know If Absolute Decoupling Has Been Achieved; DYNAMIX: Berlin, Germany, 2013. [Google Scholar]
  78. Nystrom, I.; Wene, C.O. Energy-economy linking in markal-macro: Interplay of nuclear, conservation and CO2 policies in Sweden. Int. J. Environ. Pollut. 1999, 12, 323–342. [Google Scholar] [CrossRef]
  79. Krook Riekkola, A.; Berg, C.; Ahlgren, E.; Söderholm, P. Challenges in soft linking: The Case of EMEC and Times-Sweden. Working Paper 133; National Institute of Economic Research: Stockholm, Sweden, 2013. [Google Scholar]
  80. Sterner, T. Policy Instruments for Environmental and Natural Resource Management; Resources for the Future: Washington, DC, USA, 2003. [Google Scholar]
  81. Bisaillon, M.; Finnveden, G.; Noring, M.; Stenmarck, Å.; Sundberg, J.; Sundqvist, J.-O.; Tyskeng, S. Nya Styrmedel Inom Avfallsområdet? (New Policy Measures for Waste Management? in Swedish); KTH Royal Institute of Technology, Miljöstrategisk analys—Fms: Stockholm, Sweden, 2009. [Google Scholar]
  82. Nilsson, M.; Jordan, A.; Turnpenny, J.; Hertin, J.; Nykvist, B.; Russel, D. The use and non-use of policy appraisal tools in public policy making: An analysis of three European countries and the European Union. Policy Sci. 2008, 41, 335–355. [Google Scholar] [CrossRef]
  83. Turnpenny, J.; Radaelli, C.; Jordan, A.; Jacob, K. The policy and politics of policy appraisal: Emerging trends and new directions. J. Eur. Public Policy 2009, 16, 640–653. [Google Scholar] [CrossRef]
  84. Frischknecht, R.; Jungbluth, N.; Althaus, H.J.; Doka, G.; Dones, R.; Hischier, R.; Hellweg, S.; Humbert, S.; Margni, M.; Nemecek, T.; et al. Implementation of Life Cycle Impact Assessment Methods: Data v2.0. Ecoinvent Report No. 3; Swiss Centre for Life Cycle Inventories: Dübendorf, Switzerland, 2007. [Google Scholar]
Figure 1. Conceptual model of the flows in the economy as modelled in the Environmental Medium-Term Economic Model (EMEC).
Sustainability 08 00411 g001
Figure 2. Conceptual model of the waste management system modelled in National Waste management (NatWaste).
Sustainability 08 00411 g002
Figure 3. Conceptual model of the waste management system modelled in Swedish Waste management Environmental Assessment (SWEA).
Sustainability 08 00411 g003
Figure 4. Linking of the models, including main data flows and input data. LCIA, Life Cycle Impact Assessment.
Sustainability 08 00411 g004
Table 1. Waste policy instruments selected for assessment in Towards Sustainable Waste Management (TOSUWAMA). x indicates assessed and (x) indicates that assessment would be suitable, but was not performed in TOSUWAMA.
Waste Policy InstrumentSet of Linked ModelsOther Assessments in TOSUWAMA
1Climate tax on waste incinerationx
2Inclusion of waste in the system of green certificates for electricity productionx
3Weight-based waste collection feexx
4Weight-based tax on incineration of waste(x)x
5Compulsory recycling of recyclable materials(x)x
6Environmentally-differentiated waste collection fee x
7Developed recycling systems x
8Tradable certificates for use of recycled material x
9Tax on virgin raw materialsx
10Advertisements on request onlyx
11Differentiated VAT (lower VAT on services than on goods)x
12Tax on hazardous substances(x)
13Mandatory labelling of goods containing hazardous substances x
14Information to households and enterprises x
Table 2. Future scenarios [62,73,74].
ScenarioMarket DevelopmentPolitical Governance of the Environment
ReferenceBusiness as usualBusiness as usual
Global sustainabilityGlobalizationStrong
Global marketsGlobalizationWeak
Regional marketsRegionalizationWeak
European sustainabilityRegionalizationStrong
Table 3. Potential environmental impacts with and without Differentiated VAT.
Impact CategoryUnitsNo PolicyDifferentiated VATNet Difference
Waste Management SystemWaste Management SystemAvoided Material ProductionTotal Impact
Climate changekg CO2 eq−2.53 × 10⁹−2.52 × 10⁹−1.45 × 10⁸−2.67 × 1091.34 × 108
Ozone depletionkg CFC-11 eq−1.22 × 10³−1.22 × 10³−3.11 × 101−1.25 × 1032.36 × 101
Human toxicitykg 1,4-DB eq−1.61 × 10⁹−1.59 × 10⁹−5.09 × 10⁷−1.64 × 1093.94 × 107
Photochemical oxidant formationkg NMVOC−2.18 × 10⁷−2.16 × 10⁷−5.56 × 10⁵−2.22 × 1074.28 × 105
Particulate matter formationkg PM10 eq1.43 × 1081.42 × 108−3.34 × 1051.42 × 1088.76 × 105
Ionizing radiationkg U235 eq−5.78 × 10⁹−5.75 × 10⁹−3.32 × 10⁷−5.79 × 1093.82 × 106
Terrestrial acidificationkg SO2 eq−2.30 × 10⁷−2.29 × 10⁷−1.00 × 10⁶−2.39 × 1078.65 × 105
Freshwater eutrophicationkg P eq3.68 × 1063.68 × 106−4.22 × 1043.64 × 1064.83 × 104
Marine eutrophicationkg N eq−3.98 × 10⁵−3.96 × 10⁵−4.86 × 10⁵−8.82 × 1054.84 × 105
Terrestrial ecotoxicitykg 1,4-DB eq−5.79 × 10⁶−5.75 × 10⁶−9.30 × 10⁴−5.85 × 1065.52 × 104
Freshwater ecotoxicitykg 1,4-DB eq1.35 × 1081.35 × 108−1.36 × 1061.34 × 1081.29 × 106
Marine ecotoxicitykg 1,4-DB eq1.03 × 1081.03 × 108−1.23 × 1061.02 × 1081.11 × 106
Agricultural land occupationm2a−9.35 × 10⁹−9.28 × 10⁹−2.01 × 10⁸−9.48 × 1091.26 × 108
Urban land occupationm2a−1.81 × 10⁸−1.79 × 10⁸−2.94 × 10⁶−1.82 × 1081.60 × 106
Natural land transformationm2−3.53 × 10⁶−3.51 × 10⁶−2.86 × 10⁴−3.54 × 1061.44 × 104
Water depletionm3−8.36 × 10⁷−8.31 × 10⁷−6.13 × 10⁶−8.92 × 1075.65 × 106
Metal depletionkg Fe eq−7.49 × 10⁹−7.45 × 10⁹−6.29 × 10⁷−7.52 × 1092.35 × 107
Fossil depletionkg oil eq−1.85 × 10⁹−1.84 × 10⁹−4.53 × 10⁷−1.89 × 1093.52 × 107

