Article

Analysis of the Effect of the CaCl2 Mass Fraction on the Efficiency of a Heat Pump Integrated Heat-Source Tower Using an Artificial Neural Network Model

College of Civil Engineering, Hunan University, Changsha 410082, China
*
Authors to whom correspondence should be addressed.
Sustainability 2016, 8(5), 410; https://doi.org/10.3390/su8050410
Submission received: 30 November 2015 / Revised: 21 April 2016 / Accepted: 22 April 2016 / Published: 26 April 2016
(This article belongs to the Special Issue Renewable Energy Applications and Energy Saving in Buildings)

Abstract

:
An existing idle cooling tower can be reversibly used as a heat-source tower (HST) to drive a heat pump (HP) in cold seasons, with calcium chloride (CaCl2) aqueous solution commonly selected as the secondary working fluid in an indirect system due to its good thermo-physical properties. This study analyzed the effect of CaCl2 mass fraction on the effectiveness (ε) of a closed HST and the coefficient of performance (COP) of a HP heating system using an artificial neural network (ANN) technique. CaCl2 aqueous solutions with five different mass fractions, viz. 3%, 9%, 15%, 21%, and 27%, were chosen as the secondary working fluids for the HSTHP heating system. In order to collect enough measured data, extensive field tests were conducted on an experimental test rig in Changsha, China which experiences hot summer and cold winter weather. After back-propagation (BP) training, the three-layer (4-9-2) ANN model with a tangent sigmoid transfer function at the hidden layer and a linear transfer function at the output layer was developed for predicting the tower effectiveness and the COP of the HP under different inlet air dry-/wet-bulb temperatures, hot water inlet temperatures and CaCl2 mass fractions. The correlation coefficient (R), mean relative error (MRE) and root mean squared error (RMSE) were adopted to evaluate the prediction accuracy of the ANN model. The results showed that the R, MRE, and RMSE between the training values and the experimental values of ε (COP) were 0.995 (0.996), 2.09% (1.89%), and 0.005 (0.060), respectively, which indicated that the ANN model was reliable and robust in predicting the performance of the HP. The findings of this paper indicated that in order to guarantee normal operation of the system, the freezing point temperature of the CaCl2 aqueous solution should be sufficiently (3–5 K) below its lowest operating temperature or lower than the normal operating temperature by about 10 K. The tower effectiveness increased with increasing CaCl2 mass fraction from 0 to 27%, while the COP of the HP decreased. A tradeoff between the tower effectiveness and the COP of the HP should be considered to further determine the suitable mass fraction of CaCl2 aqueous solution for the HSTHP heating system. The outputs of this study are expected to provide guidelines for selecting brine with an appropriate mass fraction for a closed HSTHP heating system for actual applications, which would be a reasonable solution to improve the system performance.

1. Introduction

A mechanical draft cooling tower is usually employed to release the heat withdrawn from buildings [1,2,3,4], but it also can be fully and reversibly used as a heat-source-tower (HST) to drive a heat pump (HP) heating system in cold seasons [5]. Heat-source tower heat pumps (HSTHPs), having the same advantage as common water-cooling air conditioners and water source heat pumps, can utilize sensible and latent heat of air to efficiently carry out three-combined supply of air-conditioning, heating, and hot water for buildings [6]. Recently, a number of HSTHP systems were installed in China, and have been operating satisfactorily for several years [7,8].
Many researchers have carried out a series of experimental studies and theoretical analyses on the performance characteristics of HST. Liang et al. [9] studied the various rules of solution regeneration rate of an open HST installed in a sub-tropical region of China via experimental and theoretical analysis. It was found that increasing the auxiliary heat greatly improved the solution regeneration rate. Wen et al. [10] conducted an experimental study on the heat transfer coefficient between air and liquid, such as water and ethylene glycol, with 40% mass concentration in a cross-flow HST. An empirical correlation of the heat transfer coefficient was developed by a regression method. Cheng et al. [11,12] analyzed the merits and demerits of closed HSTHP systems in hot-summer and cold-winter regions of China. It was reported that HSTHP can still maintain high energy efficiency under frost prevention conditions. Zhang et al. [13] developed an analytical model for the coupled heat and mass transfer processes in a counter flow HST based on operating conditions. Wu et al. [14] conducted an experimental investigation on the influence factors of the Lewis number in a cross flow HST and predicted the performance characteristics of the HST heat pump heating system in winter using an artificial neural network (ANN) technique [15] and an adaptive neuro-fuzzy inference approach [16]. Tan and Deng [17] found that the use of an HST would achieve higher energy efficiency than the use of electrical heating as the backup heat provisions when the building space cooling load is reduced. Subsequently, a method was developed for evaluating the heat and mass transfer characteristics in an HST for heat recovery [18]. A complete method was also provided for analyzing the heat and mass transfer characteristics within and at the boundaries of the HST together with the analytical method developed previously [19].
Although the performance characteristics of cooling towers integrated with cooling water systems have been widely reported in the literature, there are few researches focusing on HSTHP systems [20,21,22,23]. The operational characteristics of HSTHP systems are expected to be significantly different from that of common cooling water systems. These differences mainly include reduction of latent heat exchange and the relatively low secondary working fluid temperature, which is usually below 0 °C. Brine antifreezes instead of water are usually selected as the circulation medium due to their good thermo-physical properties. From the present research status, very few researchers have studied the calcium chloride (CaCl2) mass fraction influence on the efficiency of an HSTHP heating system. In fact, this influence is non-linear, and the factors are interactional and inter-coupling. ANN modeling is good at preferably catching nonlinear rule instead of classical mathematic modeling. Meanwhile, ANN models were successfully used to predict the cooling towers’ performance [24,25,26]. In this paper, ANN technology is also adopted to simulate the performance of the HSTHP system.
This study aims to analyze the effect of the CaCl2 mass fraction on the effectiveness (ε) of an HST and the coefficient of performance (COP) of an HP by means of experimental testing and ANN technology. A series of experiments were conducted on a test rig in Hunan University of China, which experiences hot summer and cold winter weather. CaCl2 aqueous solutions with five different mass fractions, viz. 3%, 9%, 15%, 21%, and 27%, were chosen as the secondary working fluids in this study. Extensive measured data, including inlet air dry-/wet-bulb temperatures and hot water inlet/outlet temperatures, were obtained under different CaCl2 mass fractions and constant input powers of fan, circulation pump, and compressor. The ANN approach was adopted to deal with the experimental data. In the ANN model, inlet air dry-/wet-bulb temperatures, hot water inlet temperature, and CaCl2 mass fraction were input parameters, and the tower effectiveness and the COP of the HP unit were output parameters. The findings should facilitate engineers to select brine antifreezes with a suitable mass fraction for an HSTHP system.

2. Experimental Apparatus and Procedure

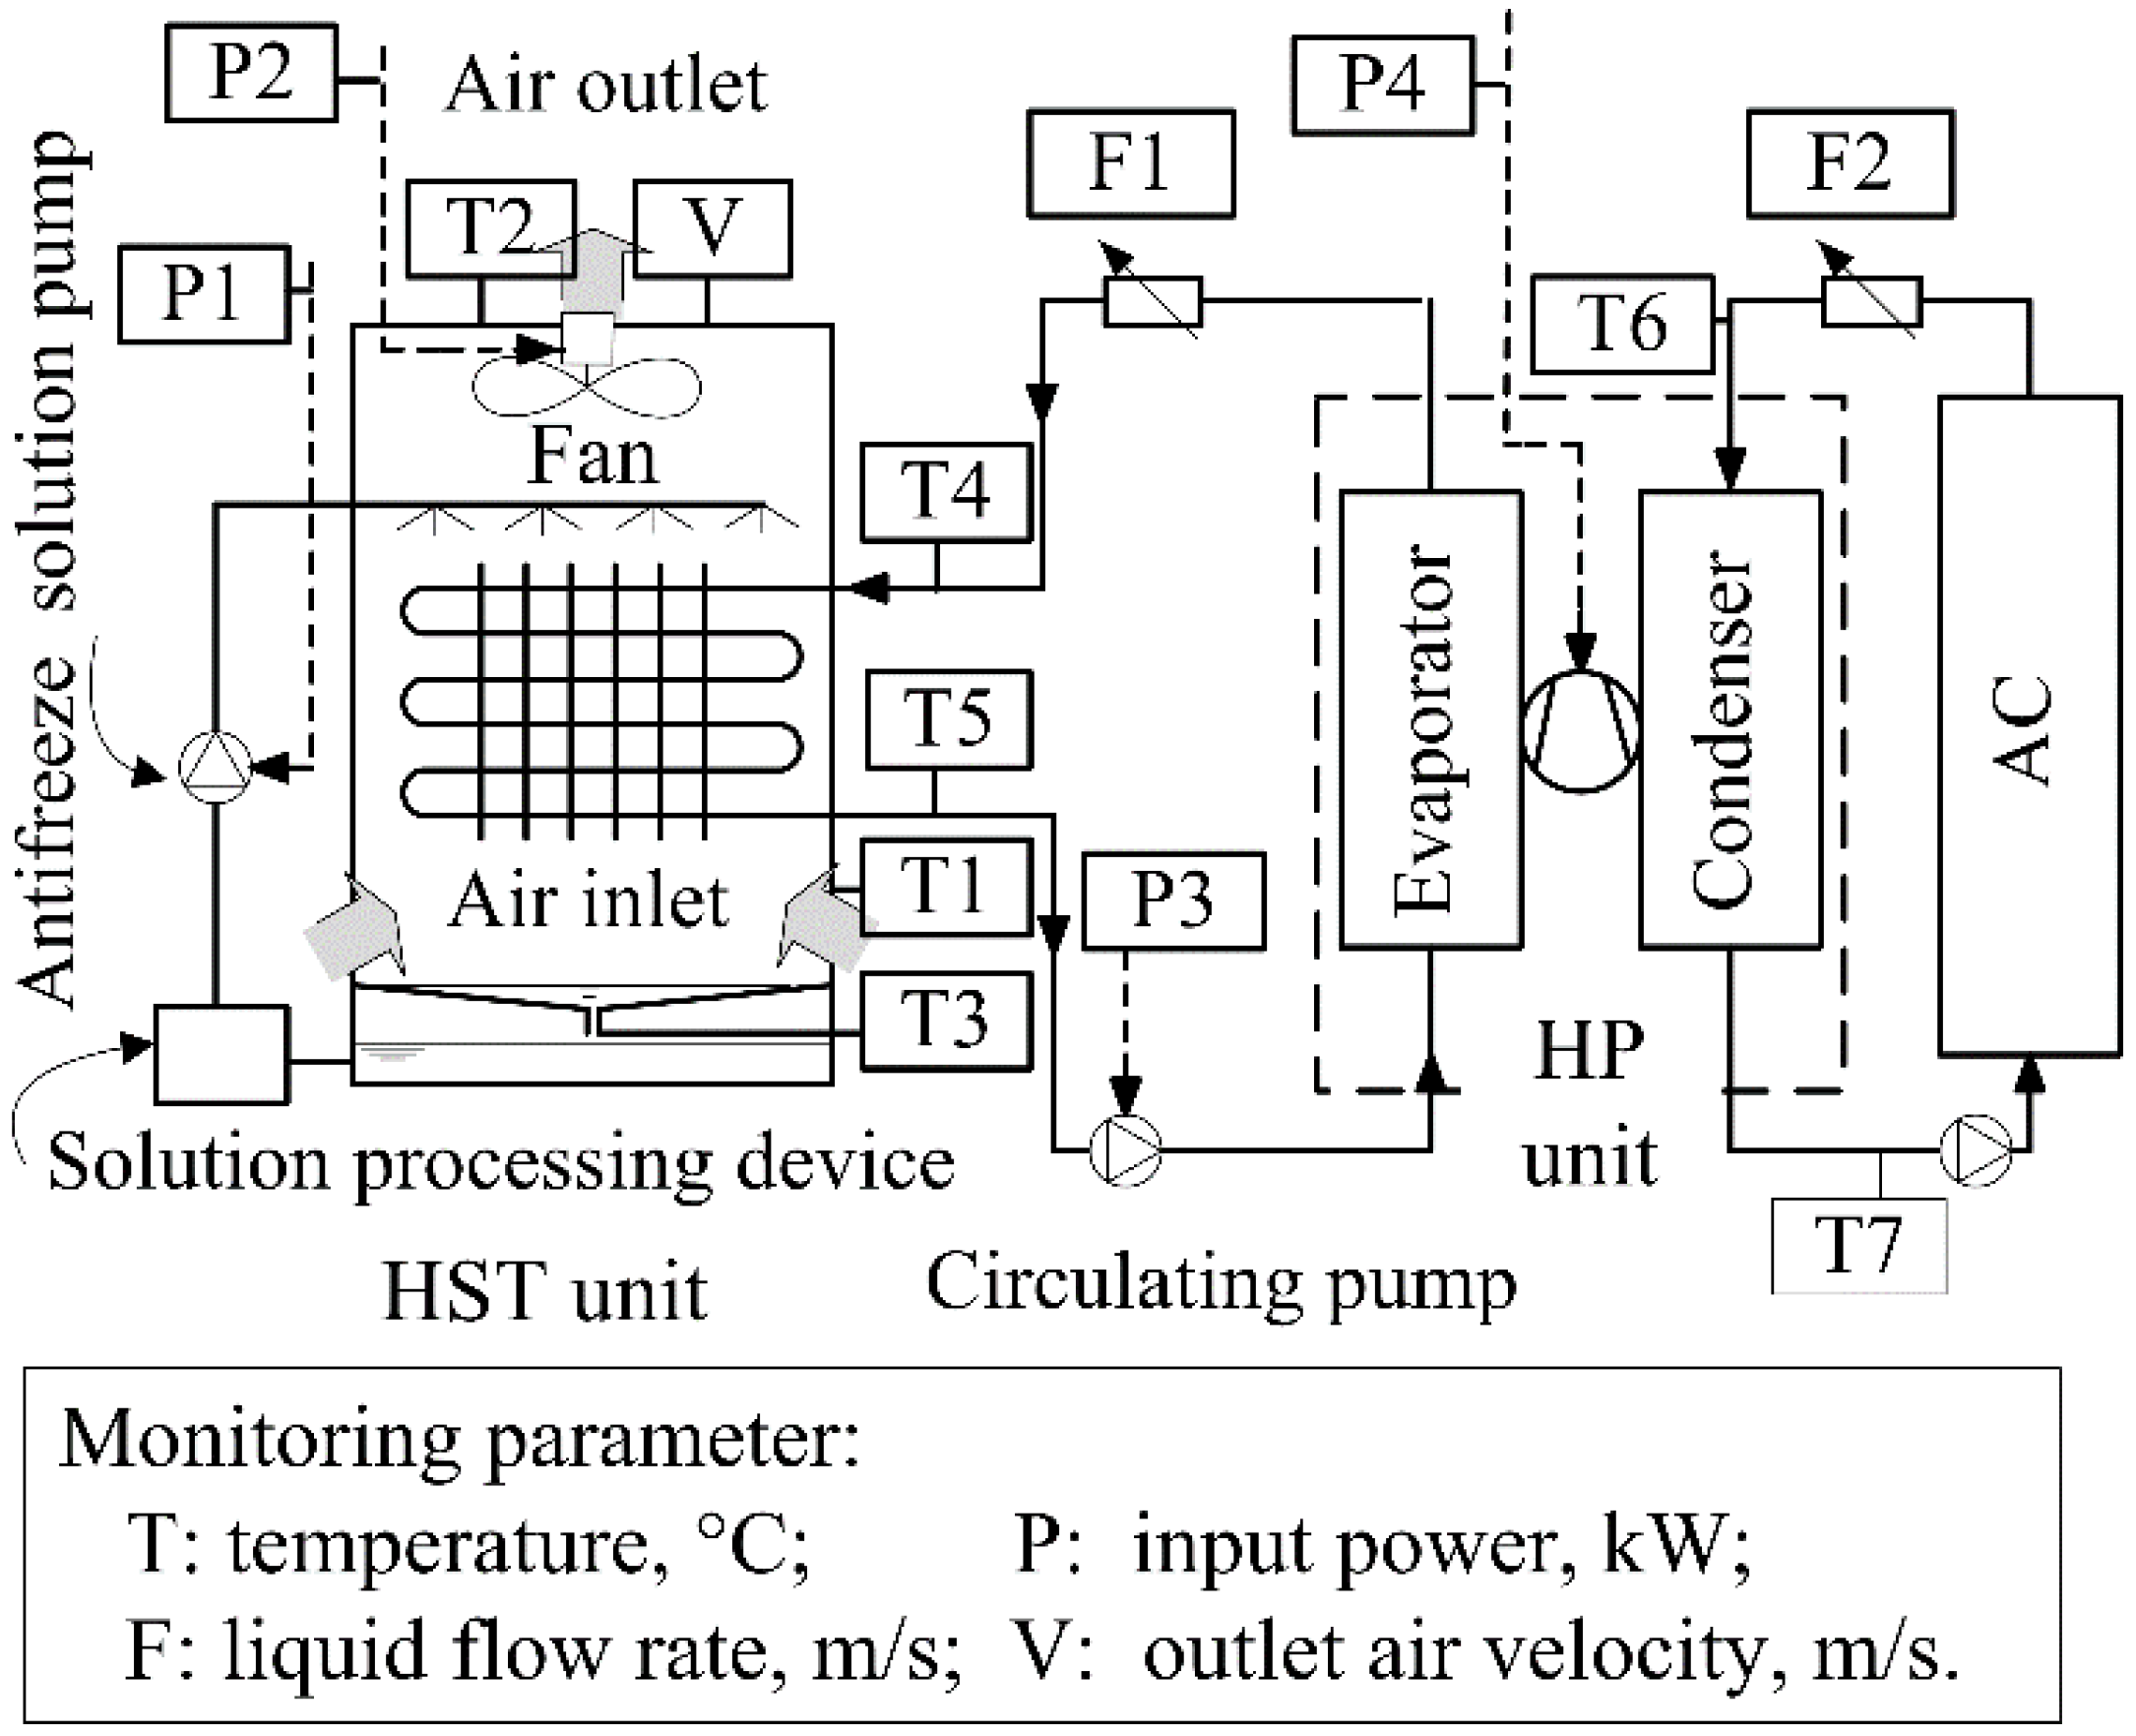
2.1. Description of the Closed HSTHP System

An experimental closed HSTHP system [12] was installed in Hunan University, China, which experiences hot summer and cold winter weather. Extensive field experimental work on the performance characteristics of the HSTHP system was carried out in the experimental test rig. The tested HST, which was an induced draft counter-flow type and specially designed, was utilized fully and efficiently as a heat source to extract heat from ambient air to drive an HP heating system. The HP system was an integrated water source HP unit with a rated power of 4.1 kW and a total heating capacity of 16 kW. Figure 1 presents the schematic diagram of the experimental system. The heating system consisted of five working fluids, viz. moist air, antifreeze solution, circulating solution, refrigerant (R22), and water. CaCl2 aqueous solution, which was an alternative fluid for application in low temperature conditions (below 0 °C), was selected as the secondary working fluid due to its good thermo-physical properties [27].
Ambient air is sucked into the HST unit by the fan with a rated power of 0.55 kW, and then indirectly cooled by the CaCl2 aqueous solution in the finned heat exchange coil inside the HST. Under frosting conditions, the antifreeze solution, sprayed on the top of the finned coil, can protect the surface of the heat exchanger from frosting. The cold aqueous solution is pumped into the HST by a circulating solution pump with a rated power of 0.75 kW to absorb heat from the ambient air, and then pumped back into the evaporator of the HP, to exchange heat with the refrigerant of R22. The water entering the condenser is heated at the same time for a hot water supply. Therefore, the HST unit, replacing a boiler or other heating systems, can provide a low temperature heat source for HP units for hot water production. Fan, antifreeze solution pump, circulating solution pump, and compressor are all controlled by frequency converter speed control systems in order to improve the system’s operation stability as well as to save energy.

2.2. System Performance Indexes

The tower effectiveness and the COP of the HP unit were selected as the indexes to evaluate the system performance under non-frosting operating conditions and constant input power of fan, circulating pump, and compressor. Similar to the definition of cooling tower effectiveness, the effectiveness of HST can be defined as the ratio of the actual inlet temperature rise of the CaCl2 aqueous solution to the ideal maximum temperature rise.
ε = T a q , o T a q , i T w b , i T a q , i
The COP of HP is expressed as follows:
C O P = c w m w ( T w , o T w , i ) P c o m p
The correlation equation between these two indexes was established as follows:
ε c a q ρ a q v a q ( T w b , i T a q , i ) = ( C O P η ) × P c o m p
As shown in the correlation equation above, the relationship between the tower effectiveness and the COP of the HP is non-linear. The influence factors included the specific heat capacity, the density, the volume flow rate of CaCl2 aqueous solution, the CaCl2 solution temperature and the ambient wet-bulb temperature at the inlet of the HST, as well as the input power and efficiency of the compressor.

2.3. Testing Procedure

A set of instruments were installed to measure the related operating parameters, including ambient air dry-/wet-bulb temperatures, dry-/wet-bulb temperatures of the air outlet, air velocity, flow rates of the aqueous solution and the hot water, inlet and outlet temperatures of the aqueous solutions, as well as the input power of fan, antifreeze solution pump, circulating solution pump and compressor. The detailed arrangement of the instruments is presented in Figure 1. Table 1 shows the specification and accuracy of the instruments.
In this study, the input power of the fan, circulating solution pump, and the compressor were kept constant and were 0.51 kW, 0.75 kW, and 4.1 kW, respectively. During the whole experimental process, the input power of the antifreeze solution pump was zero because the closed HST was operated under non-frosting conditions. The hot water flow rate was 1.31 m3/h. CaCl2 aqueous solutions with five different mass fractions, viz. 3%, 9%, 15%, 21%, and 27%, were chosen as the secondary working fluid, respectively. The other relevant parameters were recorded by color paperless recorders every five minutes after the system achieved stability for an hour. Each set of data was chosen as the system achieved steady state, which required that the temperatures at all test points fluctuated within ±0.2 °C for longer than 20 min.

2.4. Uncertainty Analysis

Uncertainty analyses for the experimental results were expressed by the following equation [28]:
Δ y = [ ( f x 1 ) 2 ( Δ x 1 ) 2 + ( f x 2 ) 2 ( Δ x 2 ) 2 + + ( f x n ) 2 ( Δ x n ) 2 ] 1 / 2
Obviously, the uncertainty of the tower effectiveness was influenced by the measurement accuracy of the ambient wet-bulb temperature, and the CaCl2 aqueous solution temperatures at the inlet and outlet of the HST. The uncertainty analyses for the COP focused on the temperature difference between the inlet and outlets of the hot water, the input power of the compressor, and the hot water mass flow rate. For example, when Tw,o = 42.8 °C and Tw,i = 33.6 °C, the uncertainty of the COP, calculated based on the given operating parameters, was 4.7%, in which the uncertainties caused by the temperature difference between the inlet and outlets of the hot water and the input power of the compressor accounted for 85.3% and 10.2% of the total uncertainty, respectively, while the uncertainty caused by the hot water mass flow rate was only 0.5%. Therefore, the key point of improving the test accuracy is to improve the temperature measurement accuracy.

3. ANN Modeling

3.1. Three-Layer BP Network

The HSTHP is a complex system, mainly consisting of the processes of heat and mass transfer, electro-thermal conversion, and electro-kinetic mass transport. It is quite difficult to accurately describe these processes using classical modelling techniques. Thus, an ANN model, which can be used to resolve complicated and non-linear problems of internal heat transfer, was adopted in this paper [15,25,29,30,31]. The model with one hidden layer can meet the simulative requirements [32]. Compared with other ANN models, it is quite appropriate by using the BP network to solve complicated problems. Thus, a three-layer BP network with a complicated non-linear mapping function was adopted to realize the mapping from input to output. As shown in Figure 2, the input layer has four nodes, including inlet air dry-bulb temperature Ta,i, inlet air wet-bulb temperature Twb,i, hot water inlet temperature Tw,i, and the mass concentration of CaCl2 solution w. Also the output layer has two nodes, viz. the tower effectiveness and the COP of the HP. In addition, the value ranges of the input parameters are shown in Table 2.
The BP network part was implemented under the Matlab environment, and the tangent sigmoid function and the linear transfer function were chosen at the hidden layer and the output layer, respectively. The data set consisted of 319 input-output pairs, therein, 70% of the data set were randomly assigned as the training set, the remaining 30% were employed for testing the network. All the data were normalized into −1 to 1 in order to improve the prediction agreement. The normalization and anti-normalization functions for the training data were premnmx and postmnmx functions, and the normalization and anti-normalization functions for testing data were tramnmx and postmnx functions, respectively. During the course of training, the traingdx function was used to act as the training function in this paper, because it has higher stability and a faster convergence rate [33].

3.2. Performance Analysis of ANN

In order to assess the accuracy of the BP network model, the mean relative error (MRE), correlation coefficient (R) and root mean square error (RMSE) were used as the characteristic parameters to evaluate the consistency between training and prediction results [15,25,34].
The MRE, which shows the mean ratio between the error and the network output values, is given by [15,25,34]
M R E ( % ) = 1 N i = 1 N | 100 × a i b i a i |
The correlation coefficient (R) is a measurement of how well the variation in the predicted outputs is explained by the experimental values, and the R value between the experimental values and the predicted outputs is given by [15,25,34],
R = cov ( a , b ) cov ( a , a ) cov ( b , b )
where cov(a,b) is the covariance between a and p sets which represent the experimental and network predicted output sets, respectively, and is given by
cov ( a , b ) = E ( a μ a ) ( b μ b )
In addition, cov(a,a) and cov(b,b) are the auto covariance of a and b sets, respectively, and are expressed by:
cov ( a , a ) = E ( a μ a ) 2
cov ( b , b ) = E ( b μ b ) 2
The correlation coefficient values close to +1 indicate a stronger agreement between training and predicted values, while the values close to −1 indicate a stronger negative relationship between training and predicted values.
The root mean square error (RMSE), which could reveal the accuracy of the model, is calculated as: [15,34],
R M S E = 1 N 1 N ( a i b i ) 2

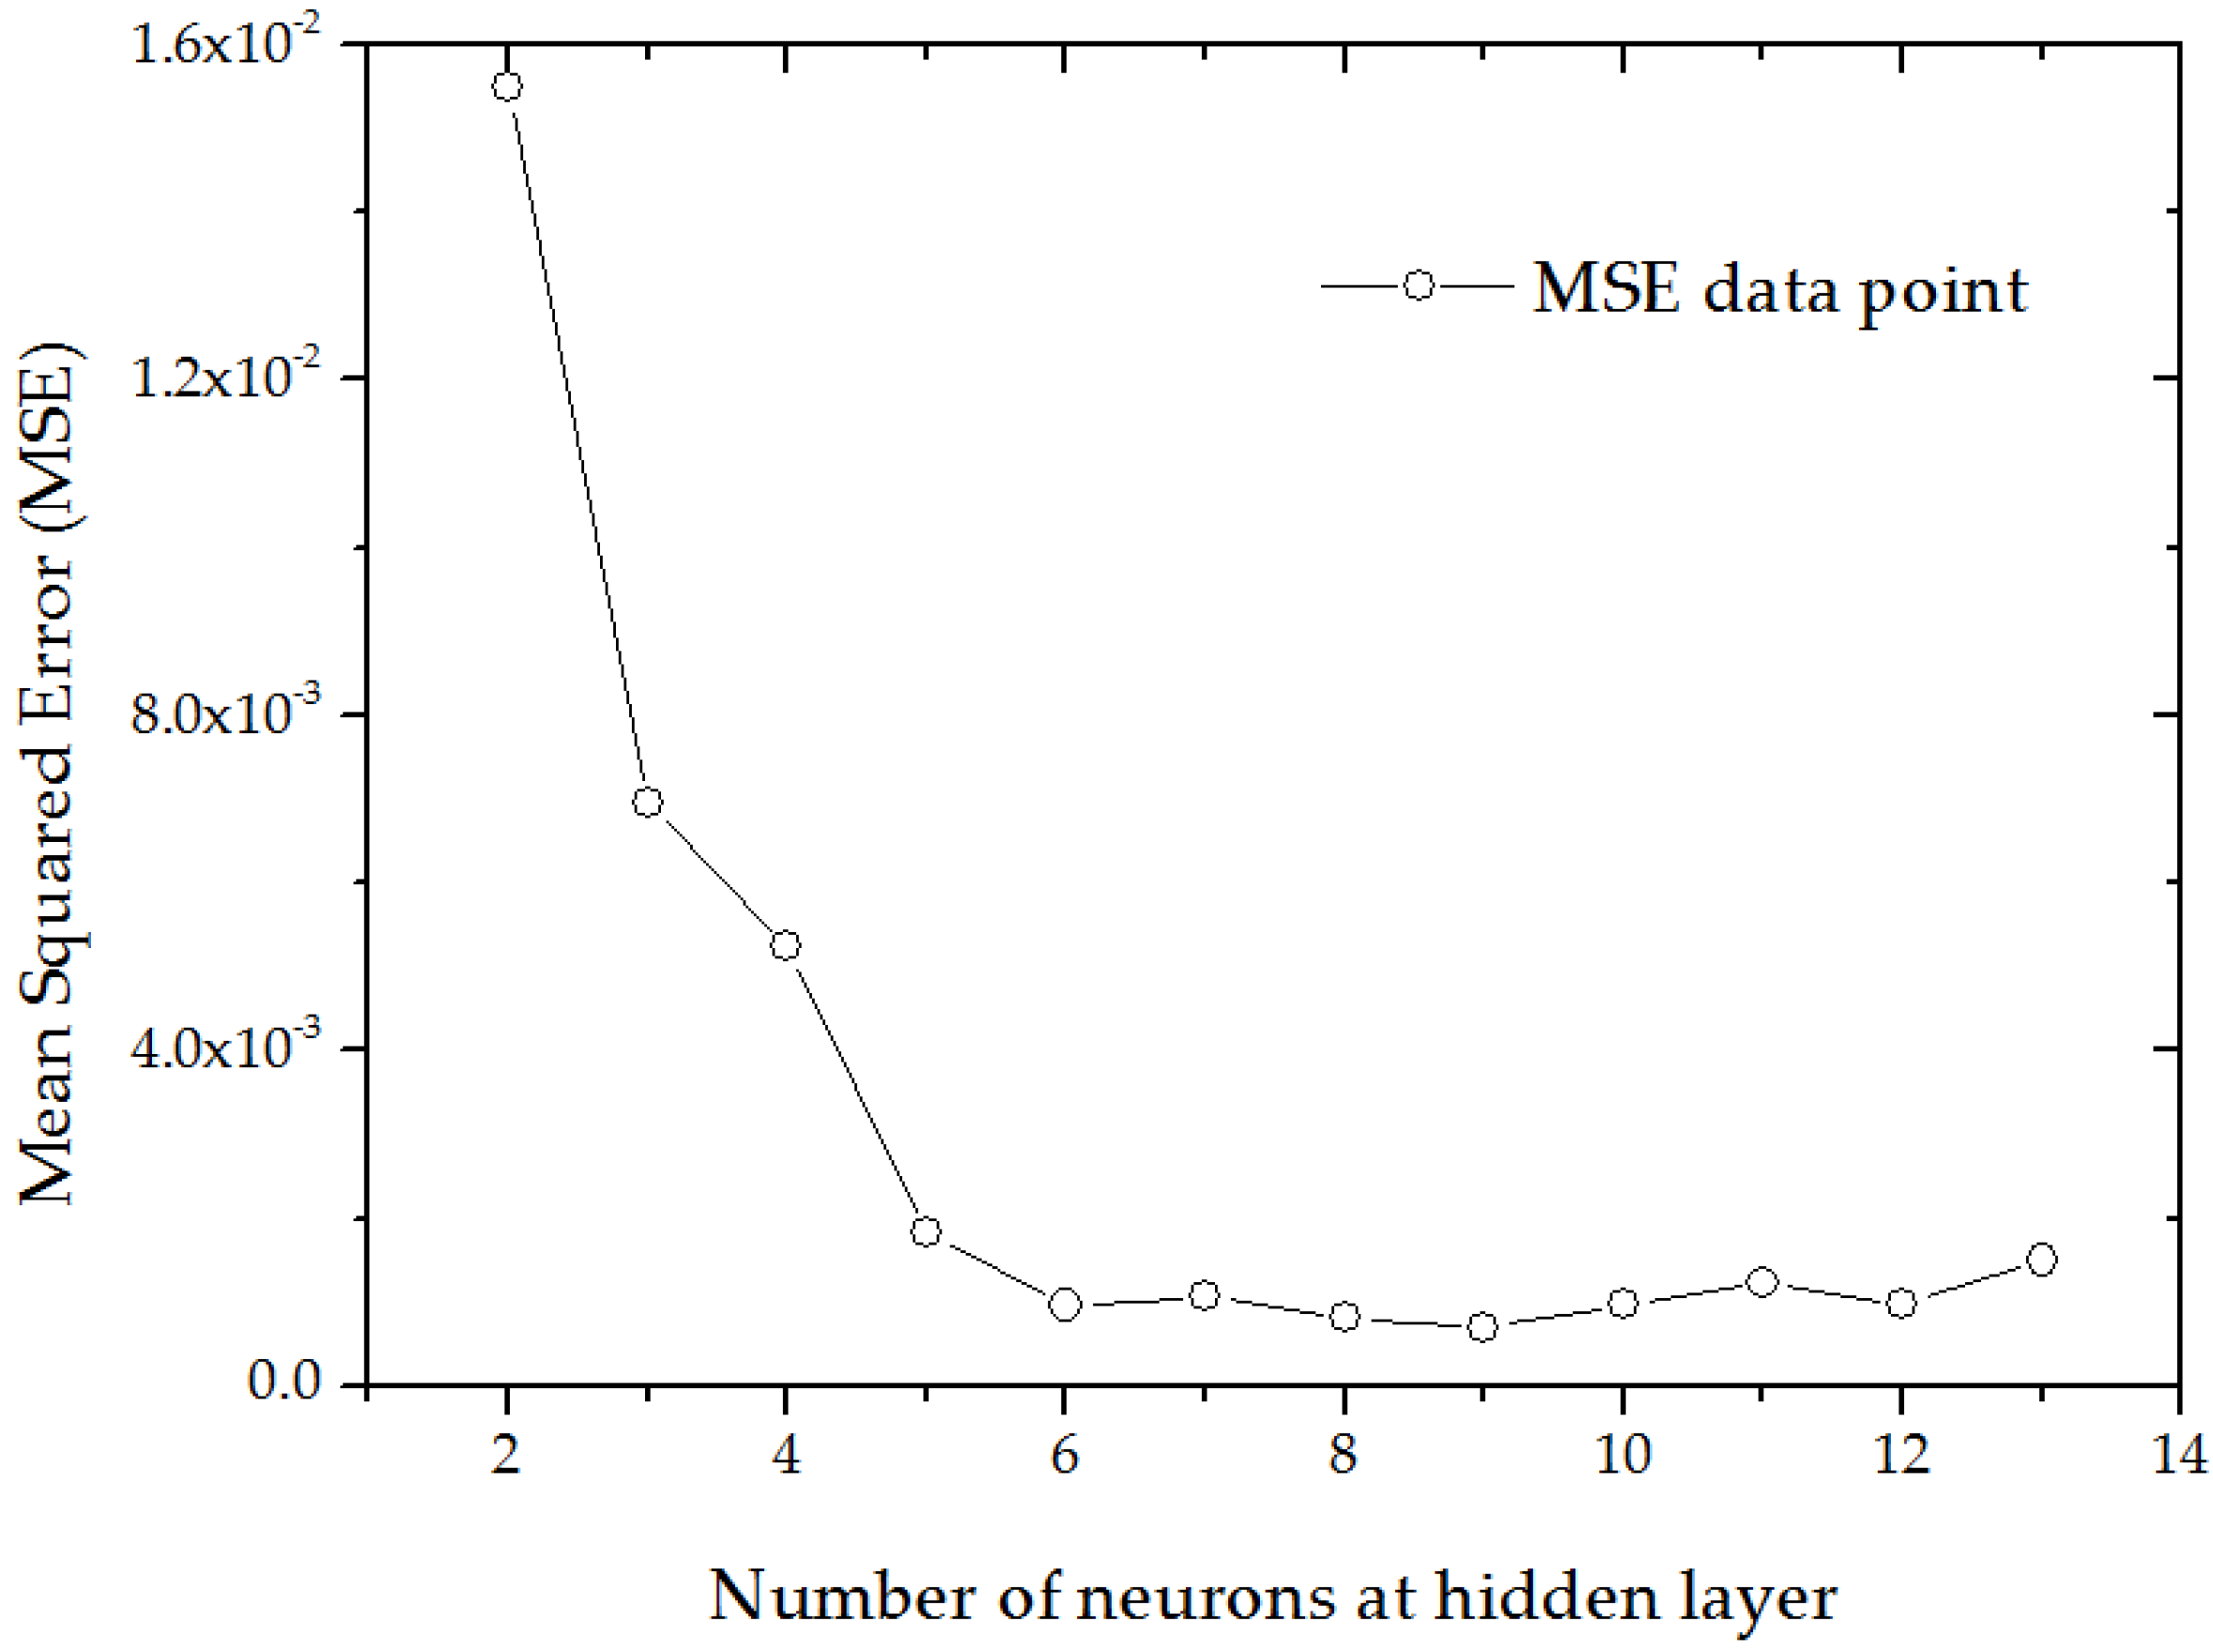
3.3. Determination of the Node Number in the Hidden Layer

Three formulas, which can receive the node number in the hidden layer, can be determined by Equations (10)–(12) [35],
i = 0 n C n 1 i > N   ( if   i > n 1 ,   C i n 1 = 0 )
n 1 = n + m + c 0
n 1 = log 2 n
For the three-layer BP network, the calculated formula of the node number in the hidden layer is defined by [33],
n 1 = n m
Another empirical formula [36] was also developed to determine the node number in the hidden layer, which is expressed as follows:
n 1 = 0.43 n m + 0.12 m 2 + 2.54 n + 0.77 m + 0.86
According to the above formulas, the node number ranged from 2–13 for the hidden layer. Figure 3 illustrates the dependence between the neuron number and mean squared error (MSE) for the variable learning rate backpropagation algorithm. As shown in Figure 3, the MSE of the network is much higher for the second (MSE 0.0155), the third (MSE 0.0070), and the fourth (MSE 0.0052) hidden neurons than for the others. For the other neurons in the hidden layer, the corresponding MSE fluctuates around 0.001. With nine hidden neurons, the MSE reached its minimum value of 0.0007. Hence, the neural network containing nine hidden neurons was chosen as the best case.
Figure 4 illustrates the training process, validation, and test mean squared errors for the variable learning rate backpropagation algorithm. The best validation performance is about 0.0007 at 131 iterations, after that the training was stopped because the training error did not change. These results indicate that the ANN network model is reliable.

4. Results and Discussions

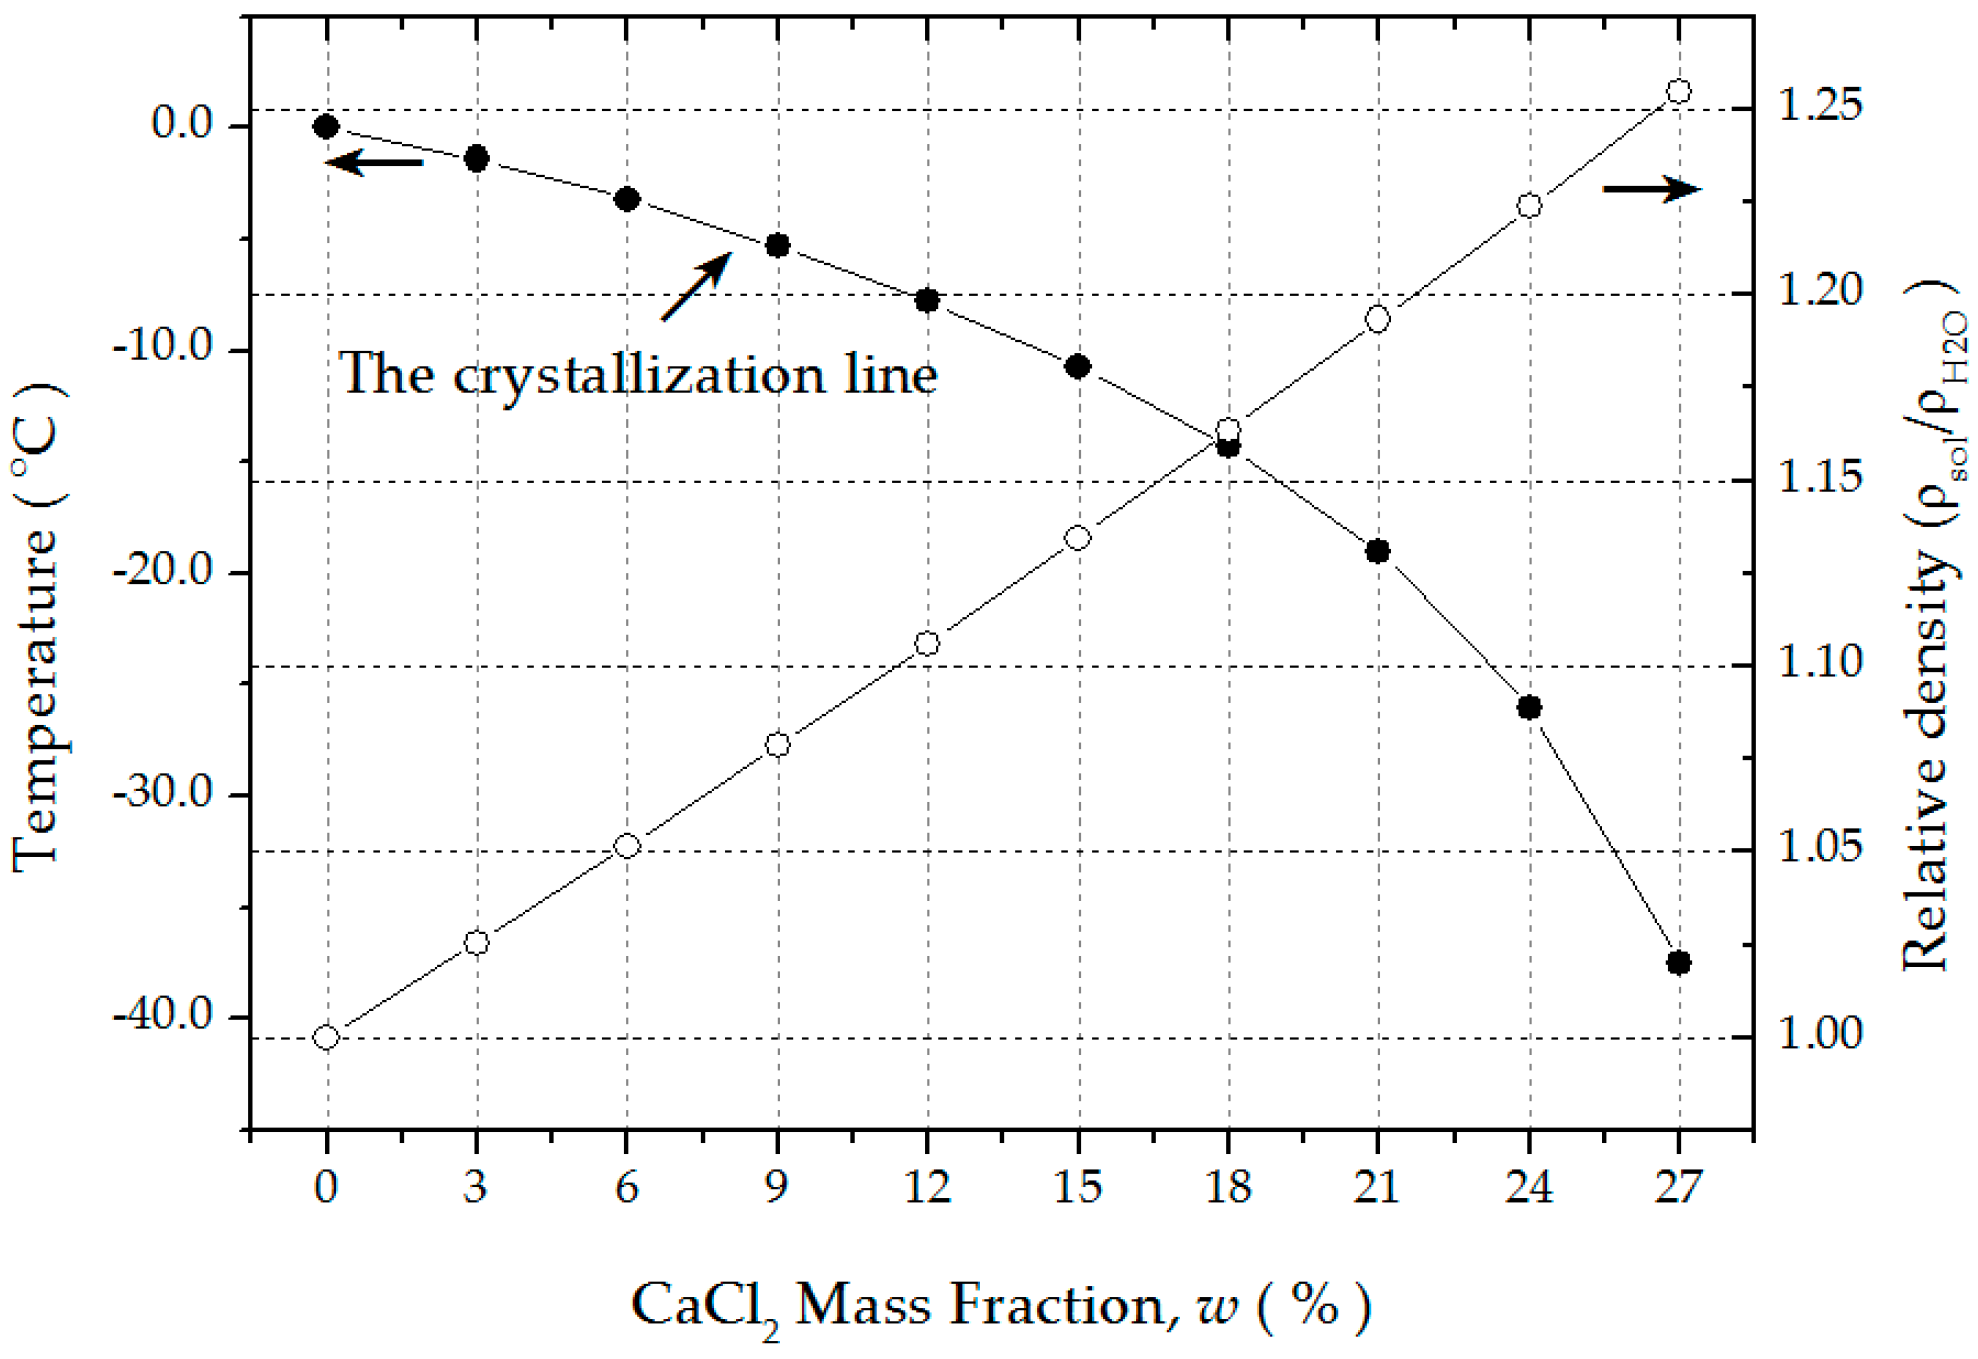
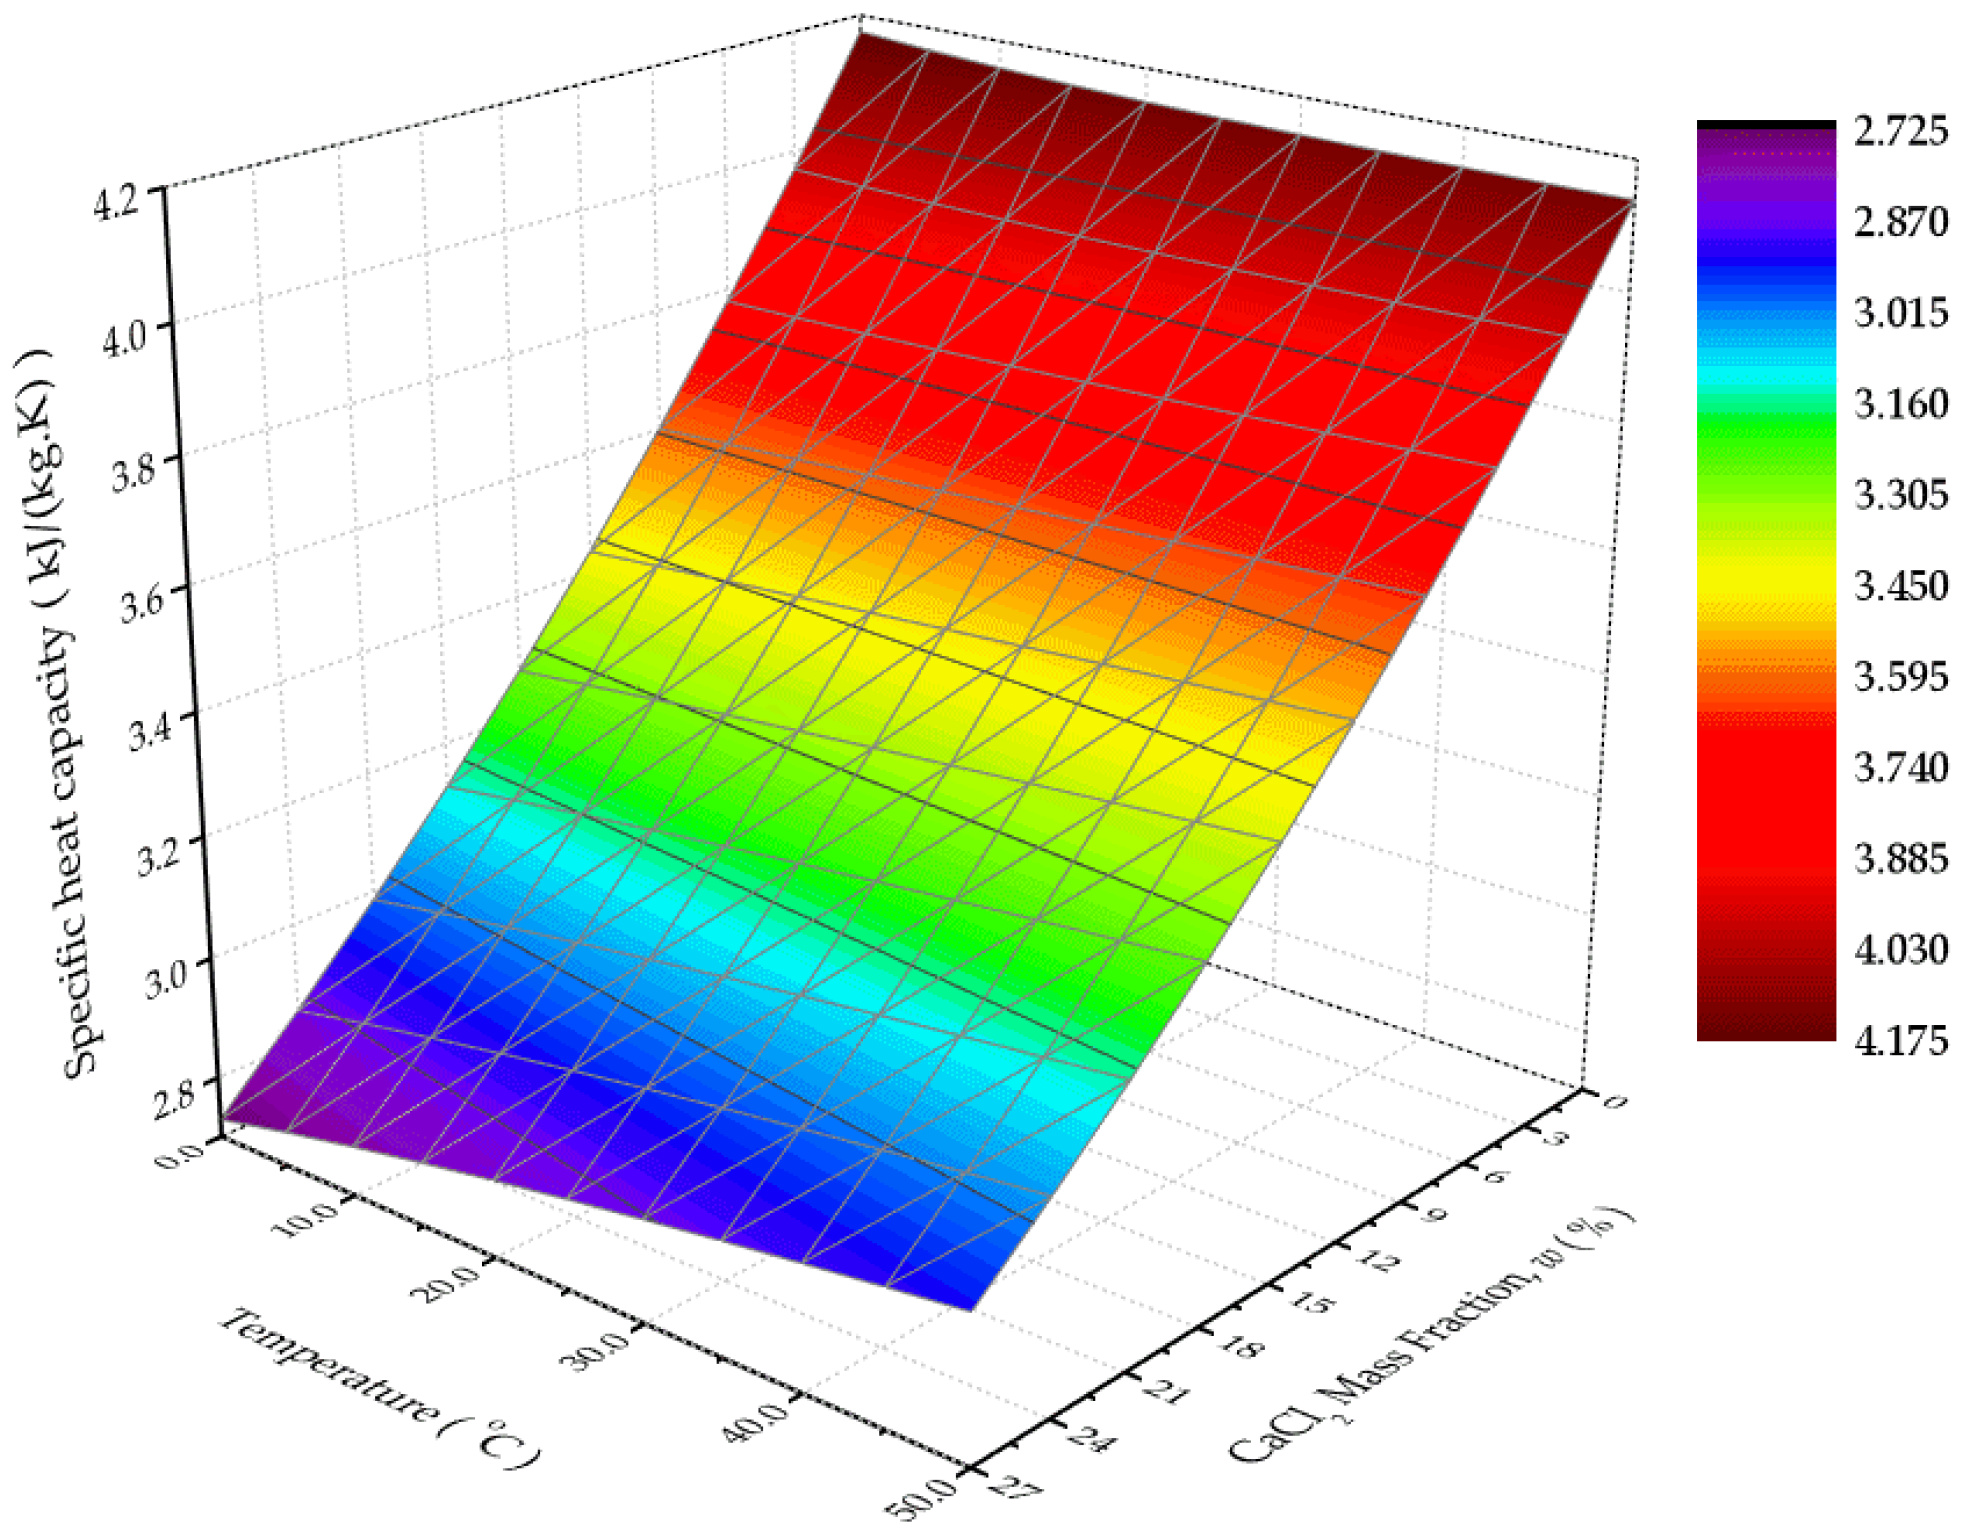
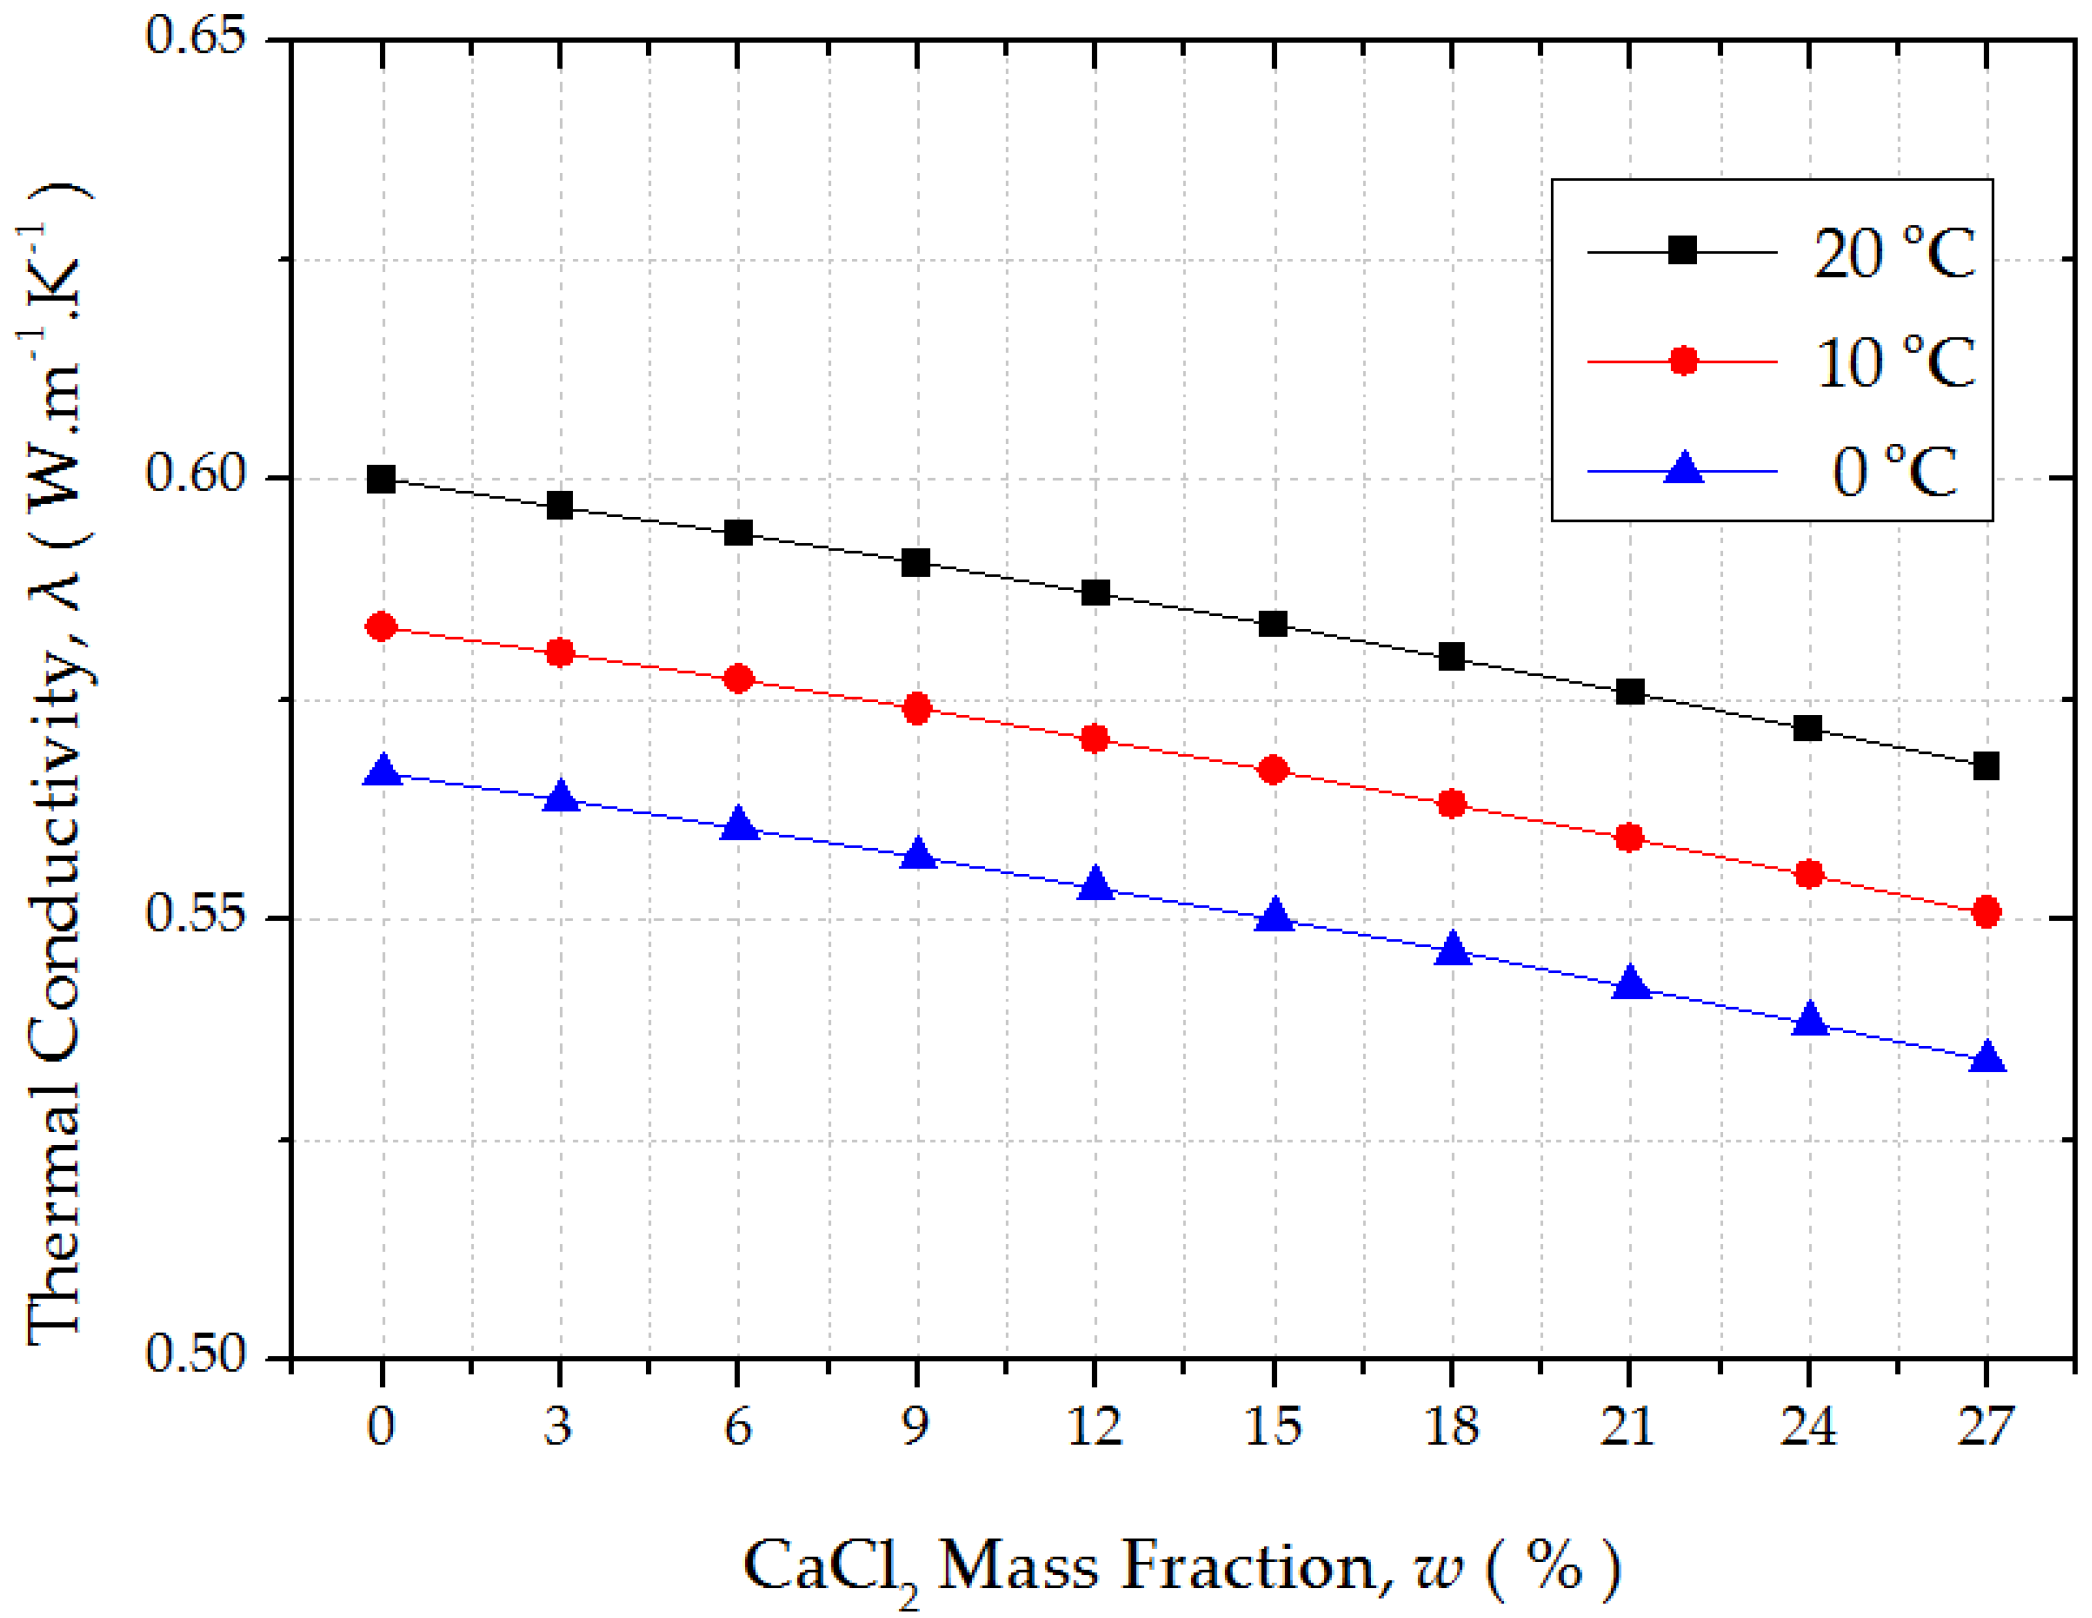
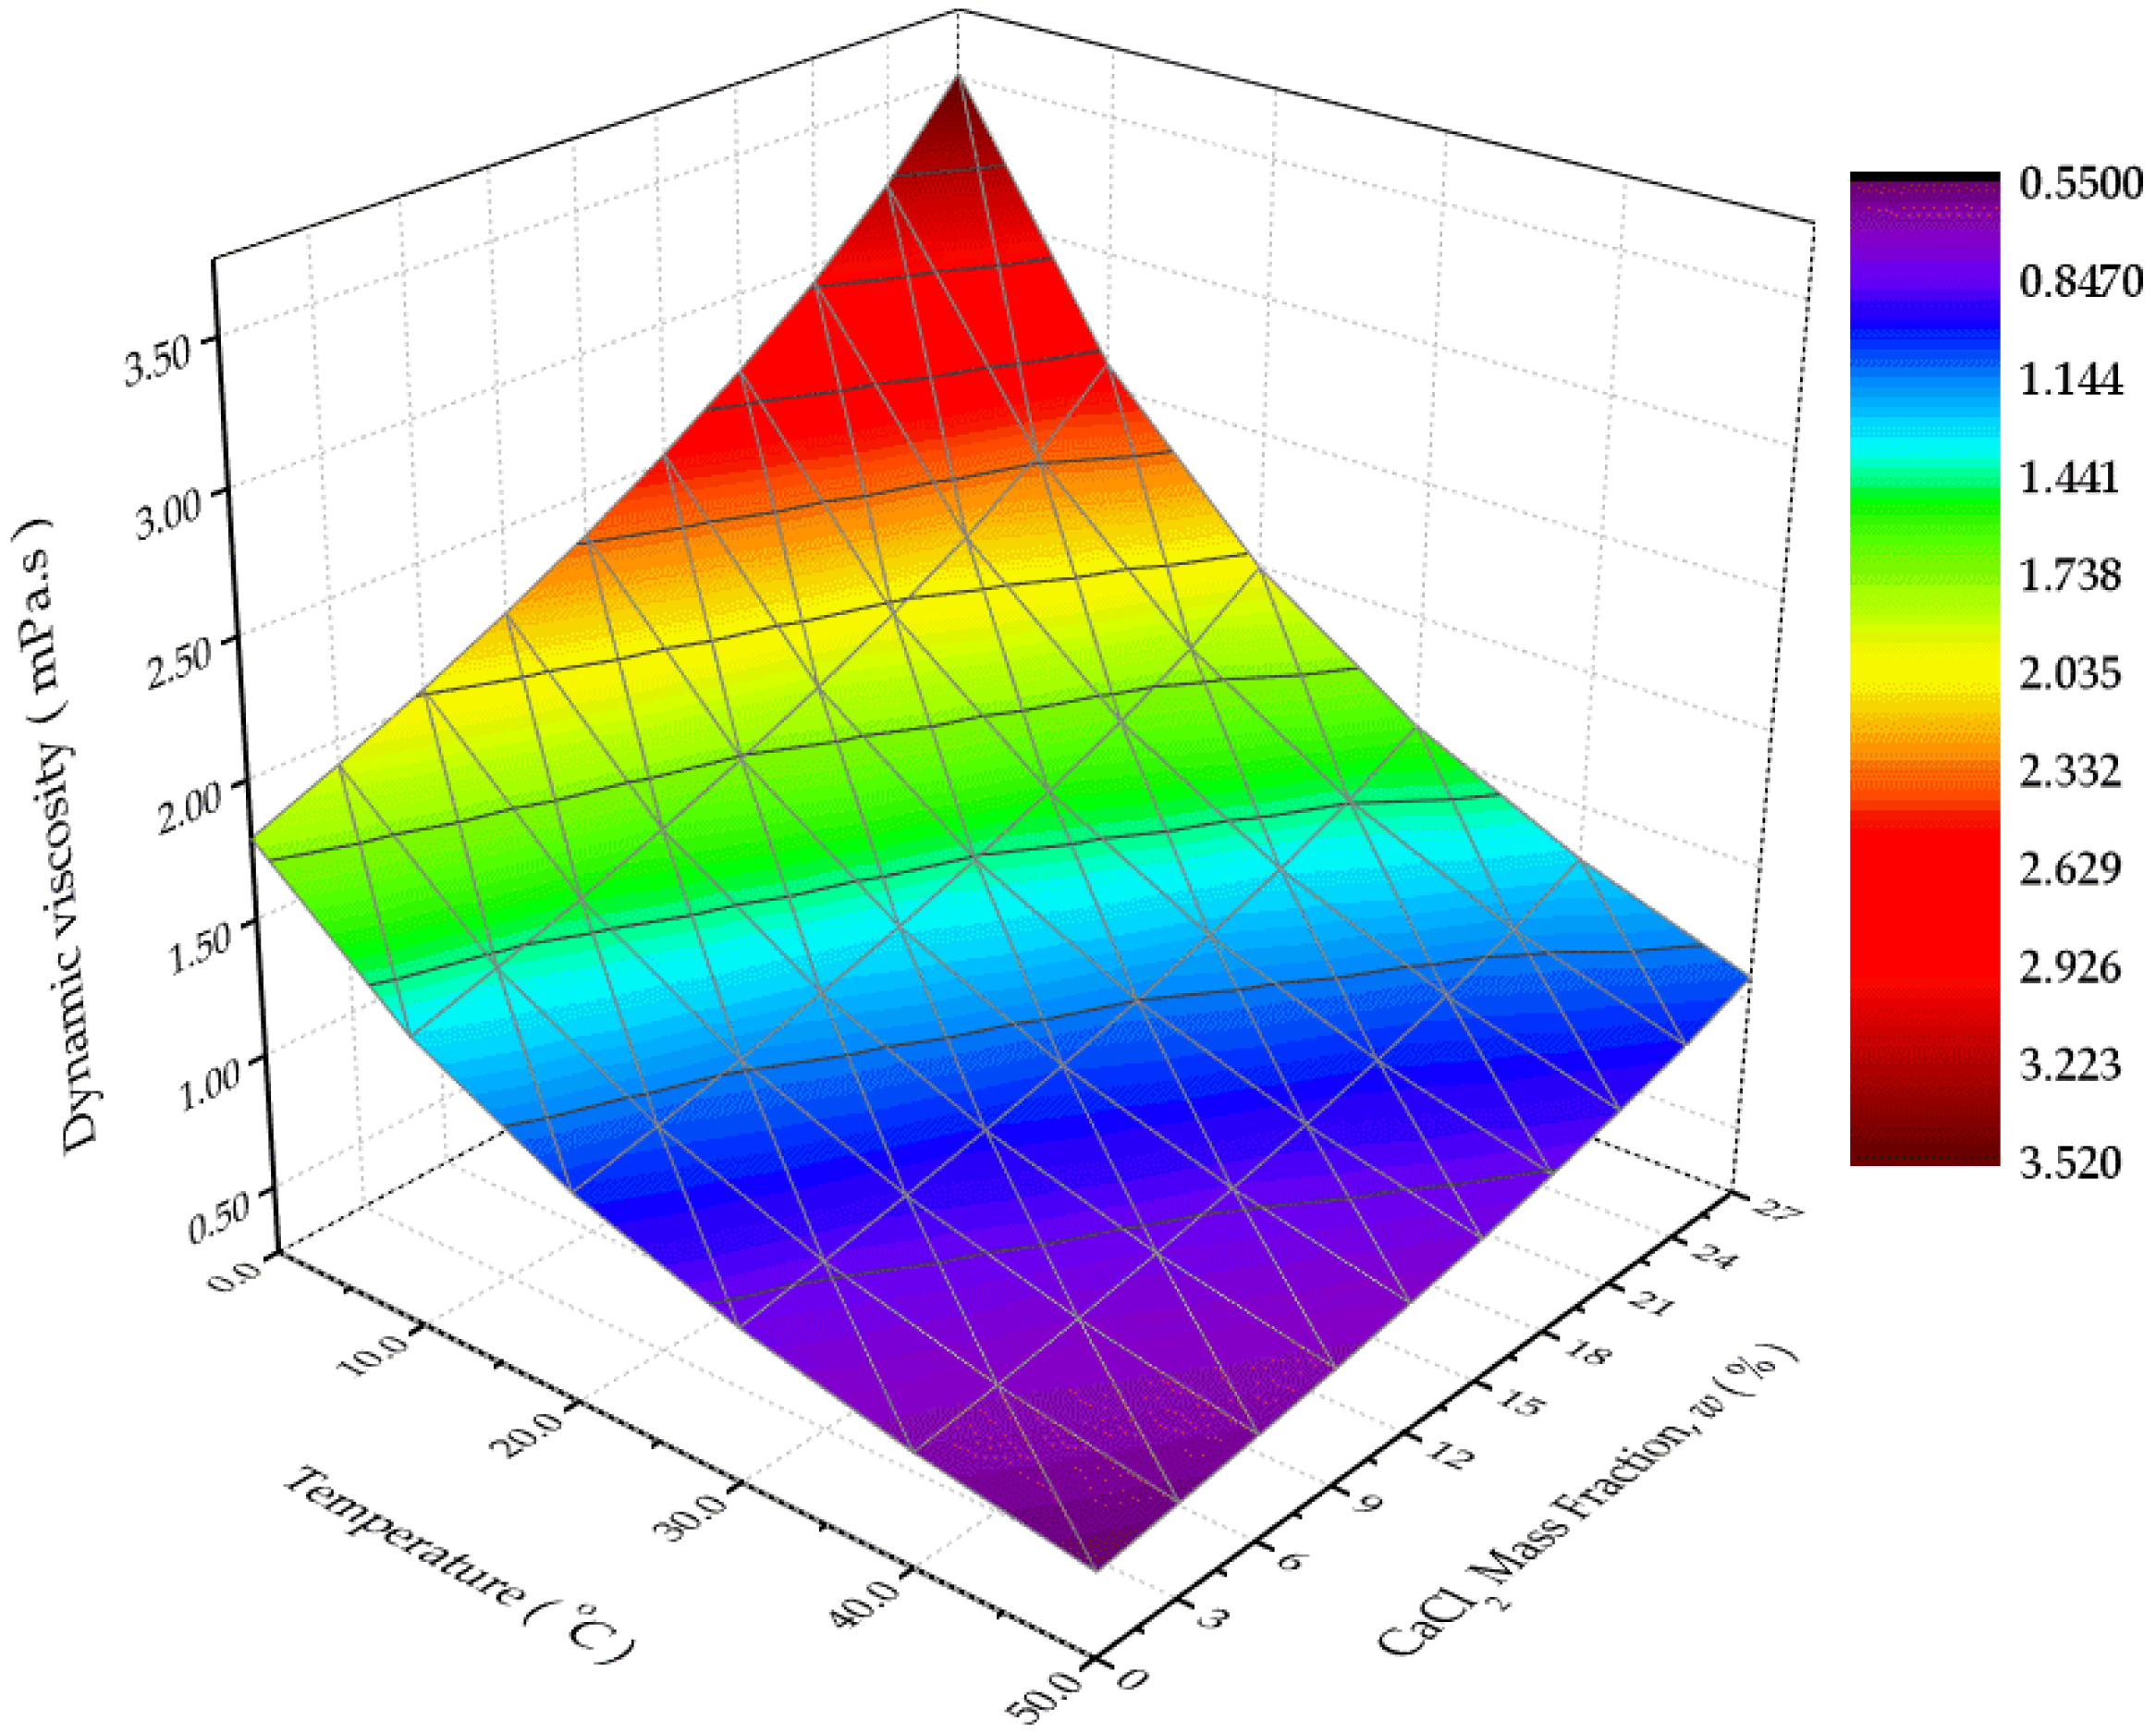
4.1. Thermo-Physical Properties of CaCl2 Aqueous Solution

Water is an excellent secondary working fluid for air conditioning when the lowest temperature is not less than +3 °C, while CaCl2 aqueous solution is an alternative for applications below 0 °C due to the freezing point depressor and the high water affinity [27]. CaCl2 aqueous solution was earlier used as a brine in various air conditioning systems. In this work, CaCl2 aqueous solutions with different mass fractions, viz. 3%, 9%, 15%, 21%, and 27%, were chosen as the secondary working fluids in the experiments. The mass fractions and the corresponding temperatures of these aqueous solutions could be used to calculate their thermo-physical properties according to the methods described by Melinder [27] and Conder [37]. Figure 5, Figure 6, Figure 7 and Figure 8 show the basic thermo-physical properties, viz. freezing point, density, viscosity, specific heat, and thermal conductivity. When the mass fraction varied from 0%–27% (0% ≤ w ≤ 27%), the freezing point and the relative density (to saturated liquid water at the same temperature) may be represented by a single function of the mass fraction, as shown in Figure 5. At the freezing point temperature, ice crystals begin to form in equilibrium if there is no sub-cooling. The relative density increases with increasing mass fraction. The specific heat capacity, dynamic viscosity, and thermal conductivity of CaCl2 aqueous solution may be represented by a function of the mass fraction and the temperature. Figure 6 and Figure 7 show that the specific heat capacity and the thermal conductivity increase with increasing temperature and decrease with increasing mass fraction. As shown in Figure 8, the dynamic viscosity increases with increasing mass fraction and decreases with increasing temperature. Overall, CaCl2 aqueous solution, which provides an alternative option for application below 0 °C, could give sufficient freezing protection, small pressure drop, and good heat transfer performance.

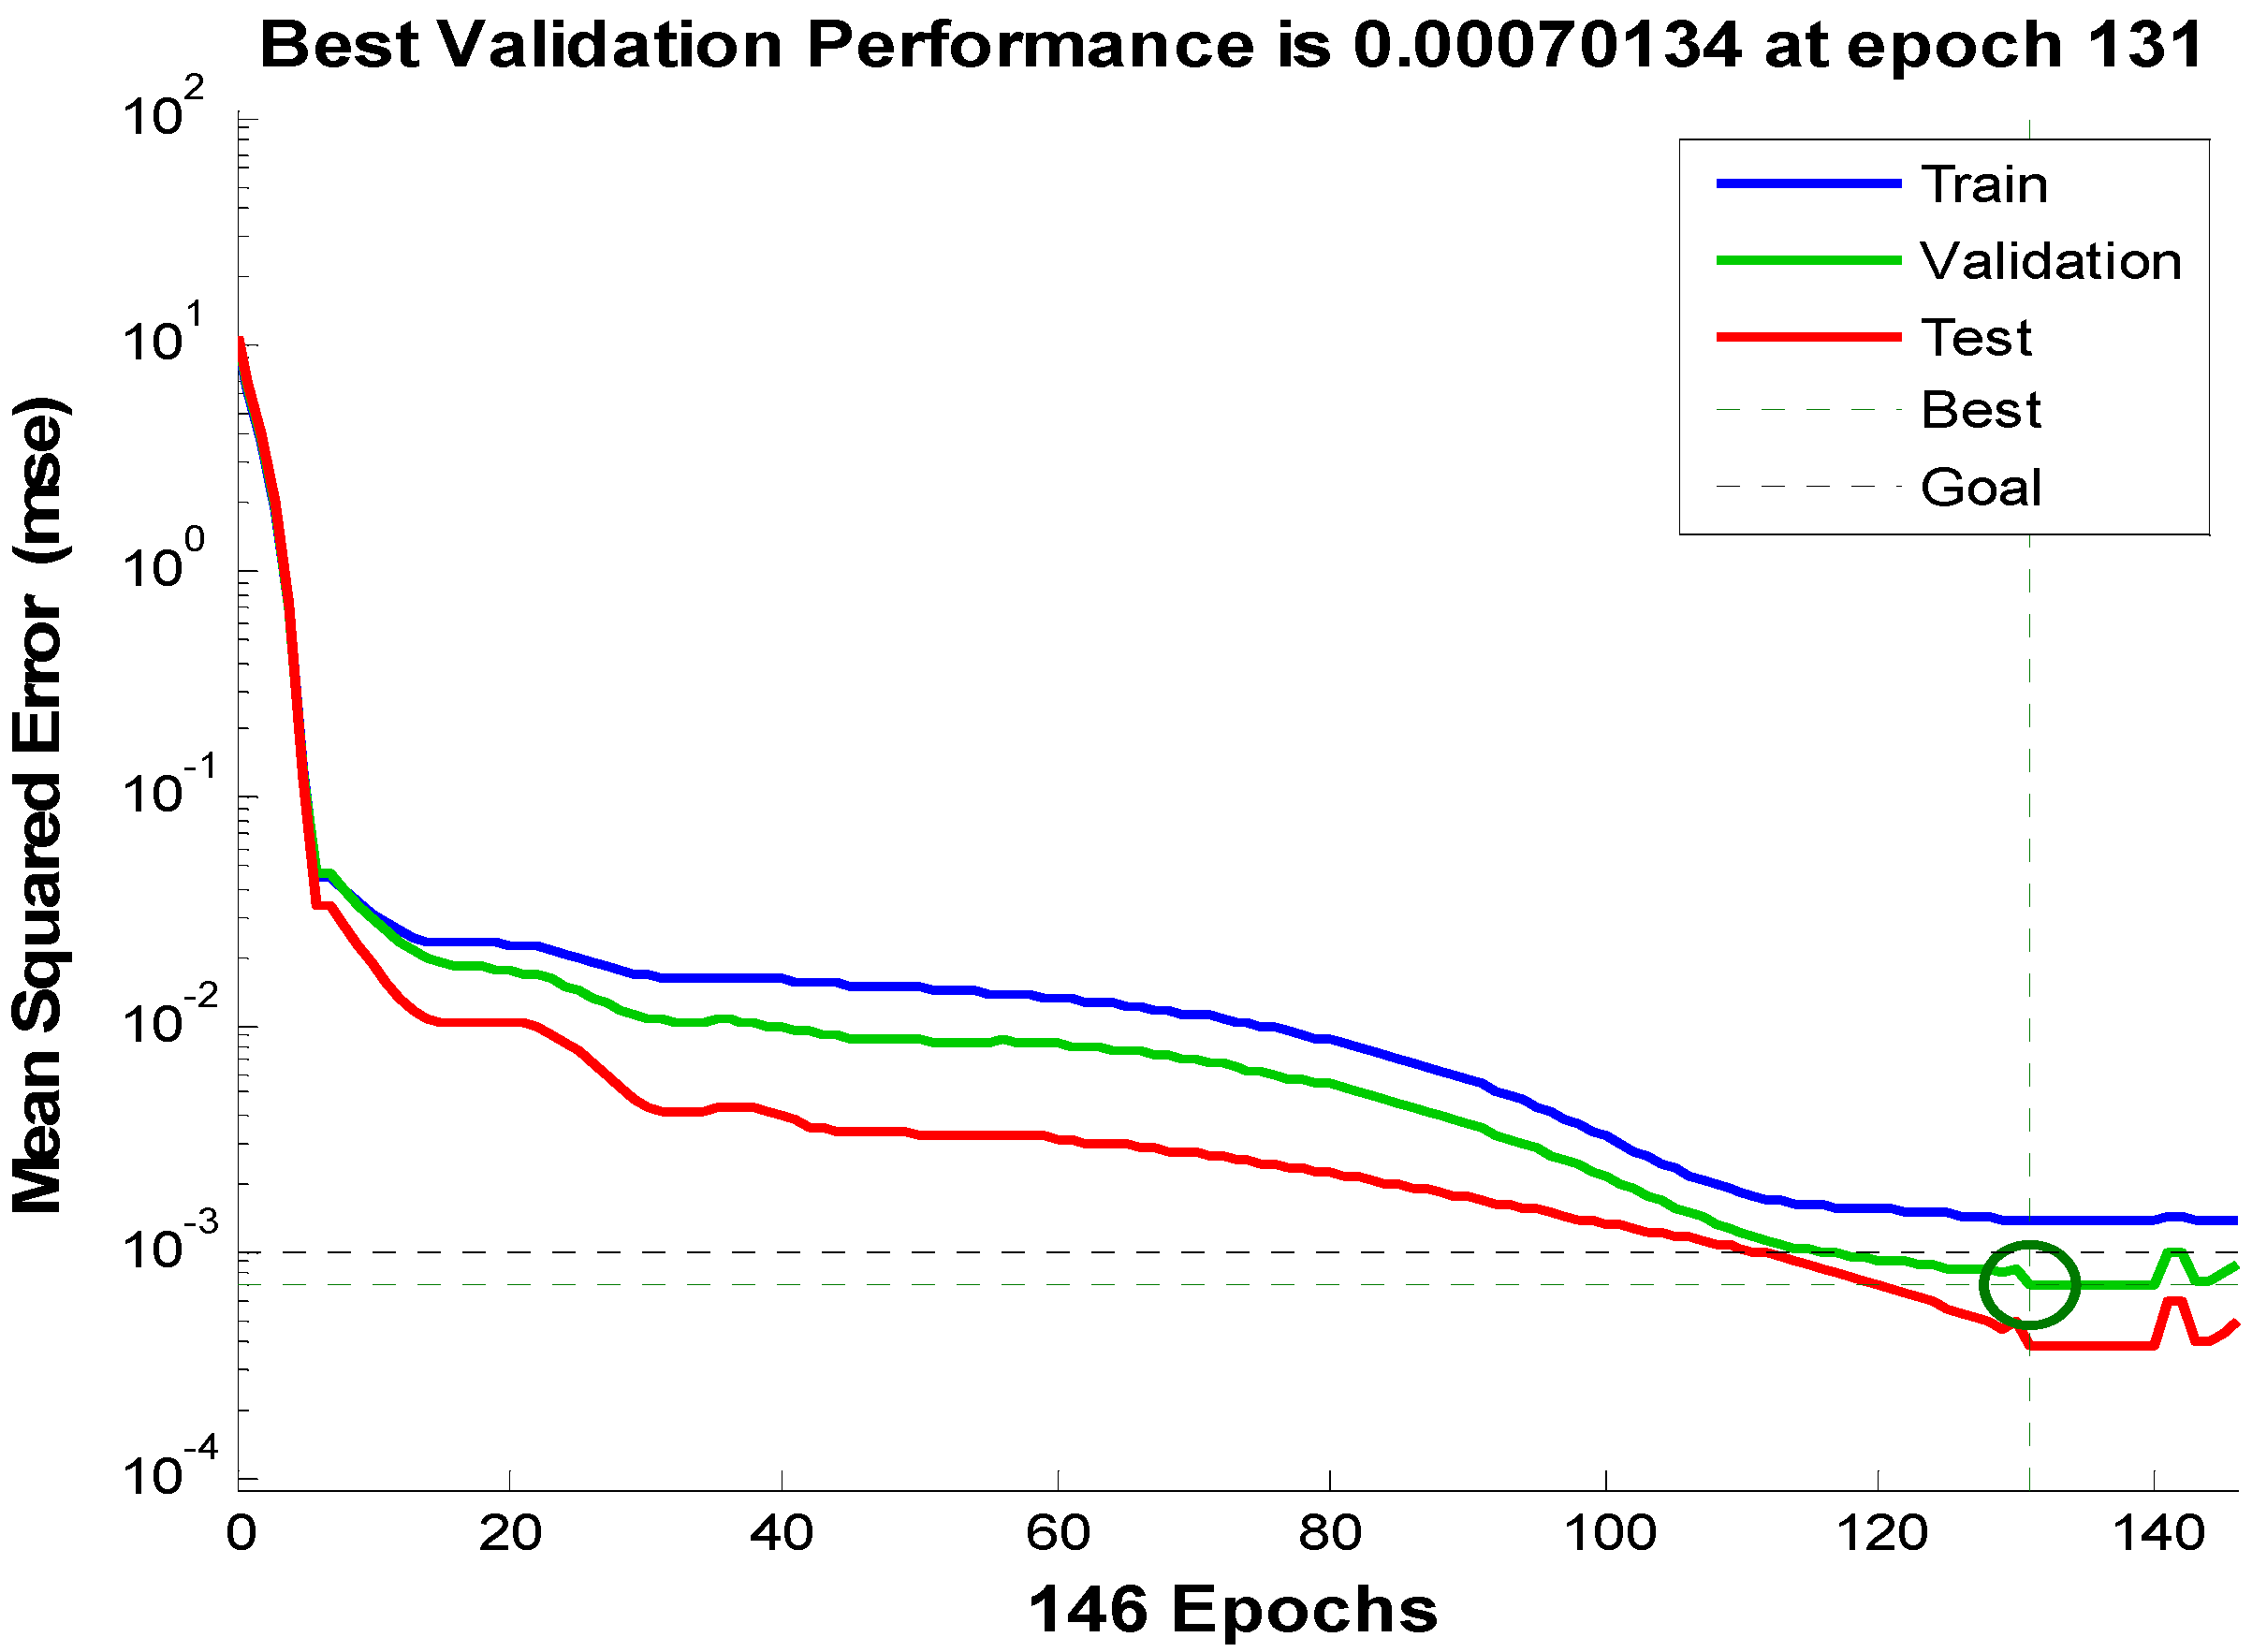
4.2. Training Results and Performance Analysis of the ANN Model

Over many trials, the MRE reached the minimum, the R of training results was very close to +1 and the results had the least RMSE when the node number in the hidden layer was 9. As shown in Figure 9a, the R, MRE, and RMSE between training values and experimental values for ε are 0.995%, 2.09%, and 0.005%, respectively, while Figure 9b shows those for COP are 0.996%, 1.89%, and 0.060%, respectively. These results demonstrate that the predicted values of ε and COP are quite accurate and the training results have a very good agreement according to the characteristic parameters MRE, R, and RMSE. Thus, the ANN model can effectively predict the tower effectiveness and the COP of the HP under normal operating conditions.

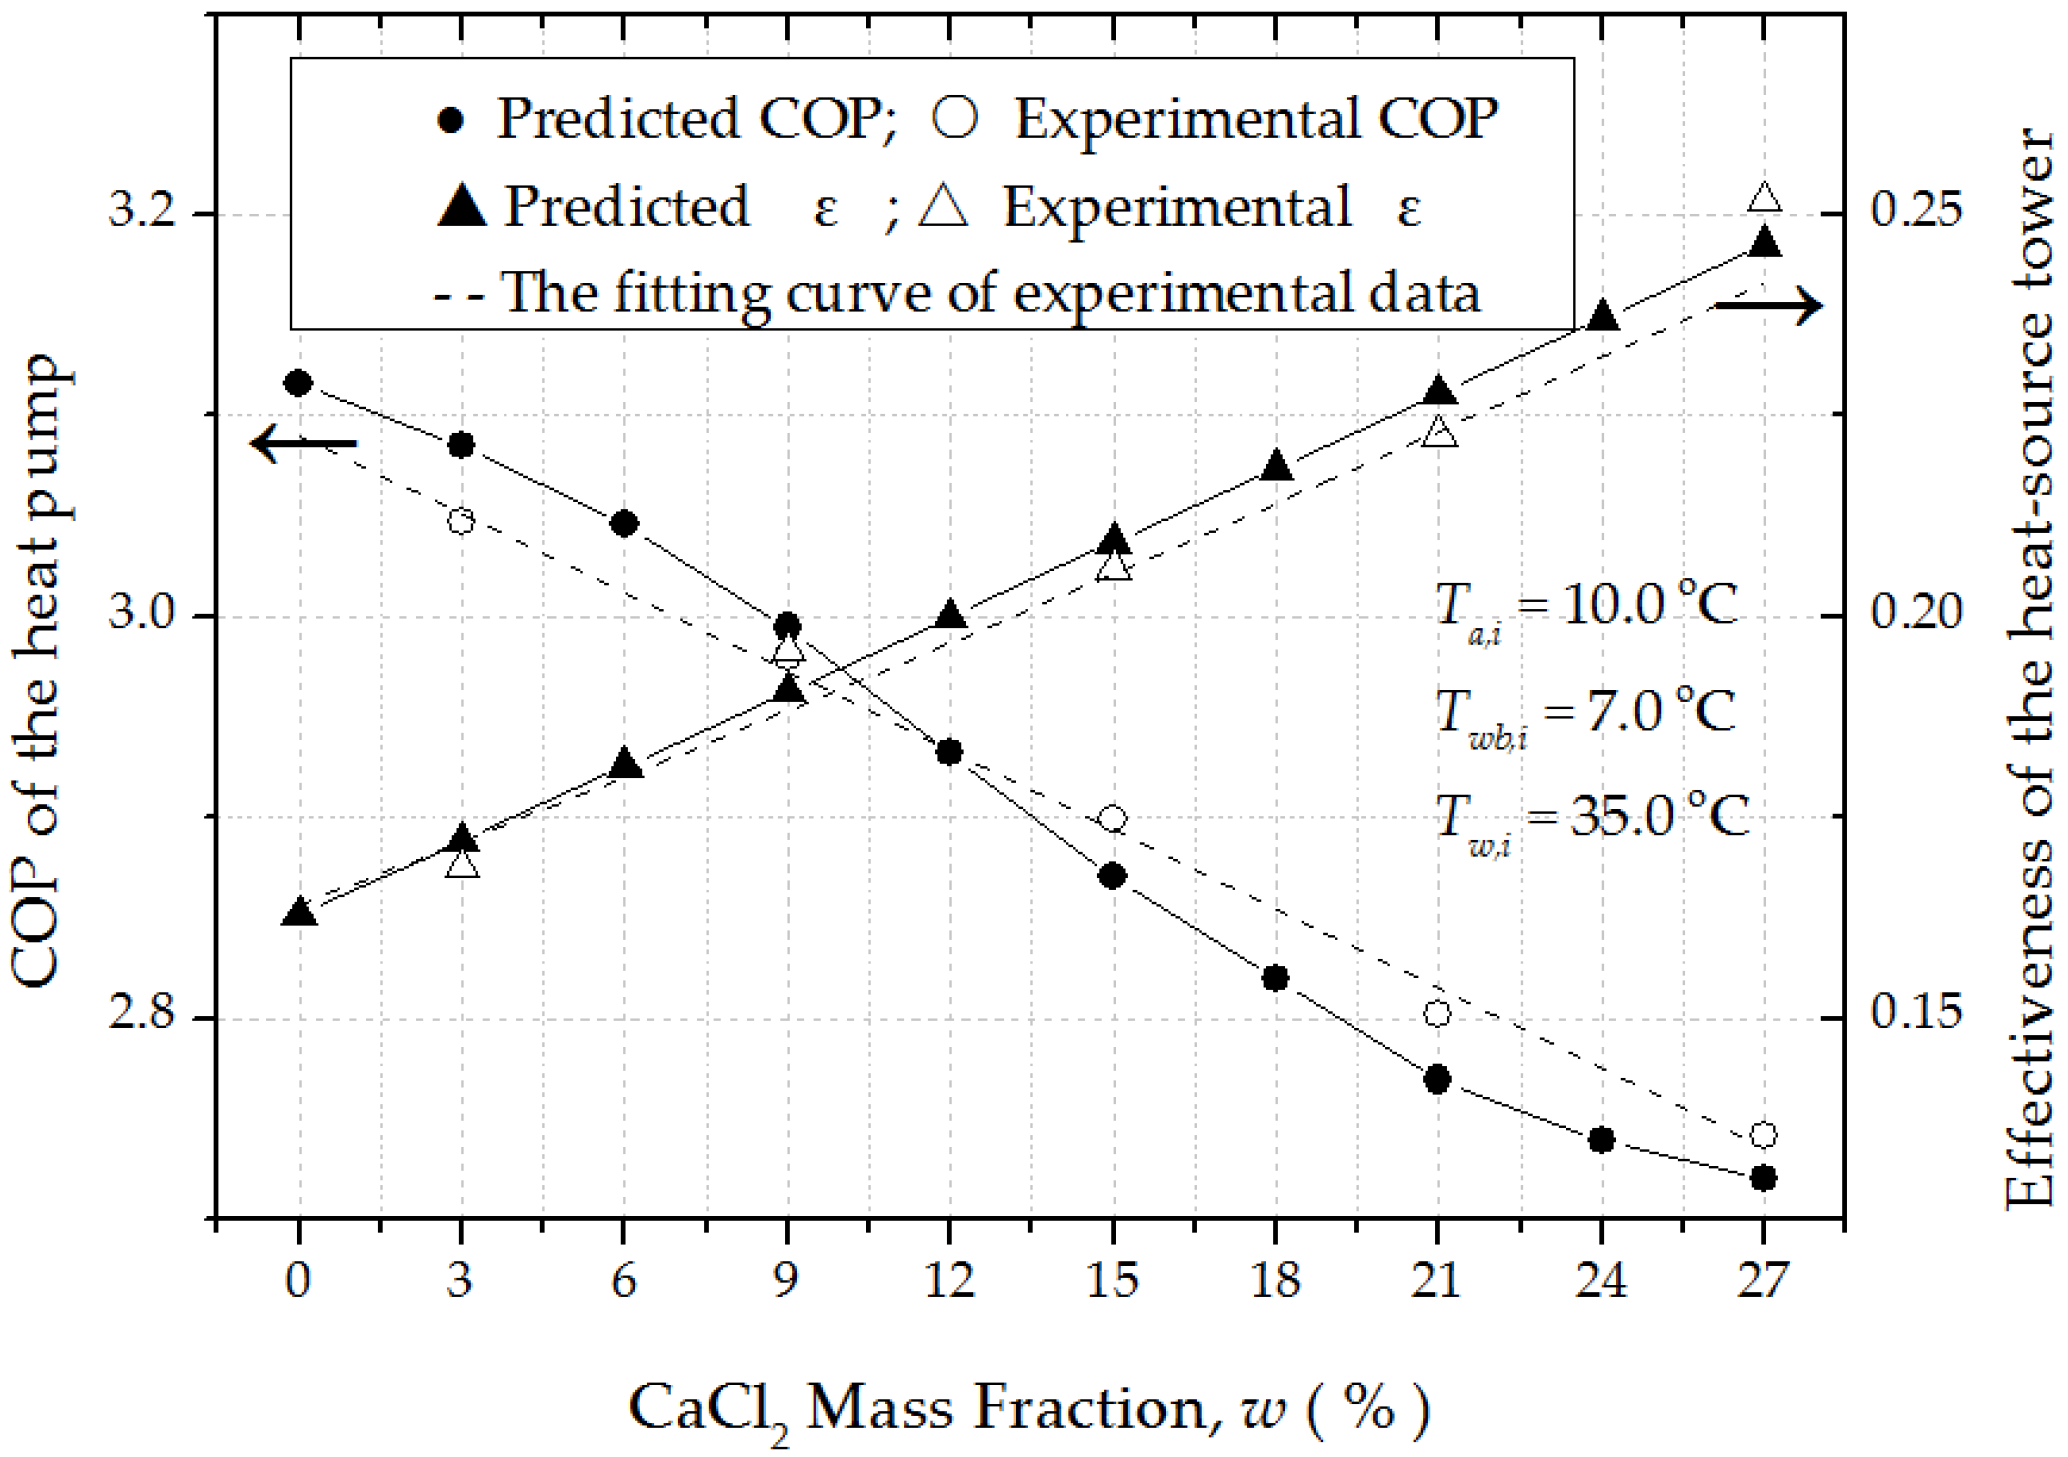
4.3. Effects of CaCl2 Mass Fraction on the Efficiency of the HSTHP

In this paper, we mainly focus on studying the effect of CaCl2 mass fraction on the tower effectiveness and the COP of the HP. In order to visualize the effect, the ε and COP predicted by the ANN model under different CaCl2 mass fractions are indicated in Figure 10. This figure depicts the same variation trends of the predicted and the experimental values with the CaCl2 mass fraction changing from 0% to 27%, and the other three input parameters kept constant (viz. the inlet temperature of the hot water, inlet air dry- and wet-bulb temperatures are equal to 35.0 °C, 10.0 °C, and 7.0 °C, respectively). It can be seen that the predicted values are in good agreement with the experimental values. The tower effectiveness increases with increasing CaCl2 mass fraction. This may be explained that with increasing CaCl2 mass fraction, the thermal conductivity of the CaCl2 aqueous solution decreases which in turn gives a negative effect to the heat transfer in the HST. Because the density and the dynamic viscosity of the CaCl2 aqueous solution increase with increasing CaCl2 mass fraction from 0% to 27%, a decline in the mass flow rate of the CaCl2 aqueous solution can lead to provision of adequate retention time of the heat transfer fluid to ensure positive heat transfer. Meanwhile, the decreasing specific heat capacity requires less thermal energy for each degree rising. Therefore, the actual inlet temperature rise rate of CaCl2 aqueous solution is faster than that of the ideal maximum. The COP of the HP decreases with increasing CaCl2 mass fraction. The results indicate that the lower the CaCl2 mass fraction, the higher the COP of the HP. The reasons can be explained in that the heat absorbed by the HST and transported by the pipeline network decreases with increasing CaCl2 mass fraction due to the decrease of the heat transfer coefficient and the CaCl2 aqueous solution flow rate.
A previous study [27] showed that for a suitable secondary working fluid selected in an indirect system, its freezing point temperature should be lower than the lowest expected temperature and the normal operating temperature by about 10 K such that the fluid can be pumped through the system easily. Another suggestion given in ref. [38] was that the freezing point of the secondary fluid should be sufficiently (3–5 K) below its lowest operating temperature. The main findings of this paper are that the tower effectiveness increased with increasing CaCl2 mass fraction from 0% to 27%, while the COP of the heat pump decreased. Therefore, a tradeoff between the tower effectiveness and the COP of the heat pump should be considered to further determine the suitable mass fraction of CaCl2 aqueous solution for the HSTHP heating system.

5. Conclusions

This study analyzed the effect of CaCl2 mass fraction on the COP of a heat pump (HP) and the effectiveness of a closed heat-source tower (HST) using artificial neural network (ANN) technology. An ANN model based on a variable learning rate back-propagation algorithm was developed. Sufficient field experimental data were obtained from an existing heat-source tower heat pump (HSTHP) heating system under non-frosting operating conditions. After back-propagation training with the data, the three-layer (4-9-2) ANN model with a tangent sigmoid transfer function (tansig) at the hidden layer and a linear transfer function (purelin) at the output layer was used to efficiently predict the tower effectiveness and the COP of the HP.
Correlation coefficient (R), mean relative error (MRE) and root mean squared error (RMSE) were adopted to evaluate the prediction accuracy of the ANN model. The results demonstrated that the R, MRE, and RMSE between training values and experimental values for ε (COP) were 0.995 (0.996), 2.09% (1.89%), and 0.005 (0.060), respectively, which indicated that the ANN model was reliable and could be used to predict both performance indexes of the HSTHP system with a high degree of accuracy.
Results showed that in order to guarantee the normal operation of the system, the freezing point temperature of the CaCl2 aqueous solution should be sufficiently (3–5 K) below its lowest operating temperature or lower than the normal operating temperature by about 10 K. The tower effectiveness increased with increasing CaCl2 mass fraction from 0% to 27%, while the COP of the HP decreased. Therefore, a tradeoff between the tower effectiveness and the COP of the HP should be considered to further determine the appropriate CaCl2 mass fraction for an HSTHP heating system. The conclusions are expected to provide guidelines for selecting brine with a suitable mass fraction in actual applications, which is a reasonable solution to improve the efficiency of a closed HSTHP system.

Acknowledgments

The authors appreciated the financial support from National Natural Science Foundation of China (No. 51578220).

Author Contributions

Xiaoqing Wei performed the laboratory analysis and wrote the manuscript; Nianping Li and Jinqing Peng designed the study, supervised the experiments and revised the manuscript; Jianlin Cheng built the test rig; Xiaoqing Wei, Jianlin Cheng, Lin Su and Jinhua Hu were responsible for the field test and the experimental data-processing.

Conflicts of interest

The authors declare no conflict of interest.

Nomenclature

Roman symbols
aithe experimental values
bithe network output values
cspecific heat, kJ/(kg·°C)
cwspecific heat of cooling water at constant pressure, 4.1868 kJ/(kg·°C)
c0a constant belongs to [1,10]
n1the node numbers in the hidden layer
nthe node numbers in the input layer
mthe node numbers in the output layer
mwmass flow rate, kg/s
Pinput power, kW
Qheating capacity, kW
Rcorrelation coefficient
wCaCl2 mass fraction, %
Ttemperature, °C
Nsample number
Ethe expected value
Voutlet average air velocity, m/s
Fliquid flow rate, m/s
vvolume flow rate, m3/s
Greek symbols
ηtotal efficiency of compressor
ρdensity, kg/m3
μa, μbThe mean value of a set and b set
εtower effectiveness
Acronyms
HSTHeat-Source Tower
HPHeat Pump
COPCoefficient of Performance
ANNArtificial Neural Network
MREMean relative error
RMSERoot mean squared error
BPBack-propagation
Subscripts
aair
aqCaCl2 aqueous solution
compcompressor
whot water
iinlet
ooutlet
wbambient wet-bulb

References

  1. Hajidavalloo, E.; Shakeri, R.; Mehrabian, M.A. Thermal performance of cross flow cooling towers in variable wet bulb temperature. Energy Convers. Manag. 2010, 51, 1298–1303. [Google Scholar] [CrossRef]
  2. Jin, G.Y.; Cai, W.J.; Lu, L.; Lee, E.L.; Chiang, A. A simplified modeling of mechanical cooling tower for control and optimization of HVAC systems. Energy Convers. Manag. 2007, 48, 355–365. [Google Scholar] [CrossRef]
  3. Khan, J.U.R.; Yaqub, M.; Zubair, S.M. Performance characteristics of counter flow wet cooling towers. Energy Convers. Manag. 2003, 44, 2073–2091. [Google Scholar] [CrossRef]
  4. Lemouari, M.; Boumaza, M. Experimental investigation of the performance characteristics of a counterflow wet cooling tower. Int. J. Therm. Sci. 2010, 49, 2049–2056. [Google Scholar] [CrossRef]
  5. Deng, S.; Song, Z.; Tan, K. Air-cooled heat pump with desuperheater: Retrofit for year-round service hot water supply. Build. Serv. Eng. 1998, 19, 129–133. [Google Scholar] [CrossRef]
  6. Heat-Source-Tower Heat Pump. Available online: http://www.climatesolver.org/innovations/living/heat-source-tower-heat-pump (accessed on 5 March 2009).
  7. Song, Y.; Ma, H.; Long, W. Application and analysis of energy tower heat pump technology in air conditioning engineering. Heat. Vent. Air Cond. 2011, 41, 20–23. [Google Scholar]
  8. Wu, J.; Zhang, G.; Zhang, Q.; Zhou, J.; Guo, Y.; Shen, W. Experimental Investigation of the Performance of a Reversibly Used Cooling Tower Heating System Using Heat Pump in Winter. In Proceedings of the 2011 Asia-Pacific Power and Energy Engineering Conference (APPEEC), Wuhan, China, 25–28 March 2011; pp. 1–4.
  9. Liang, C.; Wen, X.; Liu, C.; Zhang, X. Performance analysis and experimental study of heat-source tower solution regeneration. Energy Convers. Manag. 2014, 85, 596–602. [Google Scholar] [CrossRef]
  10. Wen, X.; Liang, C.; Zhang, X. Experimental study on heat transfer coefficient between air and liquid in the cross-flow heat-source tower. Build. Environ. 2012, 57, 205–213. [Google Scholar] [CrossRef]
  11. Cheng, J.L.; Zou, S.; Chen, S. Application Research on the Closed-loop Heat-source-Tower Heat Pump Air Conditioning System in Hot-summer and Cold-winter Zone. Proced. Eng. 2015, 121, 922–929. [Google Scholar] [CrossRef]
  12. Cheng, J.; Li, N.; Wang, K. Study of Heat-source-Tower Heat Pump System Efficiency. Proced. Eng. 2015, 121, 915–921. [Google Scholar] [CrossRef]
  13. Zhang, Q.; Wu, J.S.; Zhang, G.Q.; Zhou, J.; Guo, Y.H.; Wei, S. Calculations on performance characteristics of counterflow reversibly used cooling towers. Int. J. Refrig. 2012, 35, 424–433. [Google Scholar] [CrossRef]
  14. Wu, J.; Yu, Y.; Cao, L.; Zhang, G. Analysis on Influence Factors of Lewis Number in a Crossflow Reversibly Used Cooling Tower by Experimental Investigation. In Proceedings of 8th International Symposium on Heating, Ventilation and Air Conditioning, Volume 2: Hvac&R Component and Energy System; Springer: Berlin Heidelberg, Germany, 2014; Volume 262, pp. 327–332. [Google Scholar]
  15. Wu, J.S.; Zhang, G.Q.; Zhang, Q.; Zhou, J.; Wu, Y. Artificial neural network analysis of the performance characteristics of a reversibly used cooling tower under cross flow conditions for heat pump heating system in winter. Energy Build. 2011, 43, 1685–1693. [Google Scholar] [CrossRef]
  16. Wu, J.S.; Zhang, G.Q.; Zhang, Q.; Zhou, J.; Guo, Y.H.; Shen, W. A reversibly used cooling tower with adaptive neuro-fuzzy inference system. J. Cent. South Univ. 2012, 19, 715–720. [Google Scholar] [CrossRef]
  17. Tan, K.; Deng, S. A simulation study on a water chiller complete with a desuperheater and a reversibly used water cooling tower (RUWCT) for service hot water generation. Build. Environ. 2002, 37, 741–751. [Google Scholar] [CrossRef]
  18. Tan, K.X.; Deng, S.M. A method for evaluating the heat and mass transfer characteristics in a reversibly used water cooling tower (RUWCT) for heat recovery. Int. J. Refrig. Rev. Int. Froid 2002, 25, 552–561. [Google Scholar] [CrossRef]
  19. Tan, K.X.; Deng, S.M. A numerical analysis of heat and mass transfer inside a reversibly used water cooling tower. Build. Environ. 2003, 38, 91–97. [Google Scholar] [CrossRef]
  20. Cortinovis, G.F.; Paiva, J.L.; Song, T.W.; Pinto, J.M. A systemic approach for optimal cooling tower operation. Energy Convers. Manag. 2009, 50, 2200–2209. [Google Scholar] [CrossRef]
  21. Cortinovis, G.F.; Ribeiro, M.T.; Paiva, J.L.; Song, T.W.; Pinto, J.M. Integrated analysis of cooling water systems: Modeling and experimental validation. Appl. Therm. Eng. 2009, 29, 3124–3131. [Google Scholar] [CrossRef]
  22. Panjeshahi, M.H.; Ataei, A.; Gharaie, M.; Parand, R. Optimum design of cooling water systems for energy and water conservation. Chem. Eng. Res. Des. 2009, 87, 200–209. [Google Scholar] [CrossRef]
  23. Rubio-Castro, E.; Serna-González, M.; Ponce-Ortega, J.M.; El-Halwagi, M.M. Synthesis of cooling water systems with multiple cooling towers. Appl. Therm. Eng. 2013, 50, 957–974. [Google Scholar] [CrossRef]
  24. Gao, M.; Sun, F.; Zhou, S.; Shi, Y.; Zhao, Y.; Wang, N. Performance prediction of wet cooling tower using artificial neural network under cross-wind conditions. Int. J. Therm. Sci. 2009, 48, 583–589. [Google Scholar] [CrossRef]
  25. Hosoz, M.; Ertunc, H.M.; Bulgurcu, H. Performance prediction of a cooling tower using artificial neural network. Energy Convers. Manag. 2007, 48, 1349–1359. [Google Scholar] [CrossRef]
  26. Qi, X.; Liu, Z.; Li, D. Numerical simulation of shower cooling tower based on artificial neural network. Energy Convers. Manag. 2008, 49, 724–732. [Google Scholar] [CrossRef]
  27. Melinder, Å. Thermophysical Properties of Aqueous Solutions Used as Secondary Working Fluids. Ph.D. Thesis, Energiteknik, Helsingborg, Sweden, January 2007. [Google Scholar]
  28. Mohammad, A.T.; Mat, S.B.; Sulaiman, M.Y.; Sopian, K.; Al-Abidi, A.A. Artificial neural network analysis of liquid desiccant dehumidifier performance in a solar hybrid air-conditioning system. Appl. Therm. Eng. 2013, 59, 389–397. [Google Scholar] [CrossRef]
  29. Islamoglu, Y. A new approach for the prediction of the heat transfer rate of the wire-on-tube type heat exchanger––Use of an artificial neural network model. Appl. Therm. Eng. 2003, 23, 243–249. [Google Scholar] [CrossRef]
  30. Chow, T.T.; Zhang, G.Q.; Lin, Z.; Song, C.L. Global optimization of absorption chiller system by genetic algorithm and neural network. Energy Build. 2002, 34, 103–109. [Google Scholar] [CrossRef]
  31. González, P.A.; Zamarreño, J.M. Prediction of hourly energy consumption in buildings based on a feedback artificial neural network. Energy Build. 2005, 37, 595–601. [Google Scholar] [CrossRef]
  32. Yetilmezsoy, K.; Demirel, S. Artificial neural network (ANN) approach for modeling of Pb(II) adsorption from aqueous solution by Antep pistachio (Pistacia Vera L.) shells. J. Hazard. Mater. 2008, 153, 1288–1300. [Google Scholar] [CrossRef] [PubMed]
  33. Xie, Q.S. Neural Net Method in Mechanical Engineering; China Machine Press: Beijing, China, 2003. [Google Scholar]
  34. Gao, M.; Shi, Y.; Wang, N.; Zhao, Y.; Sun, F. Artificial neural network model research on effects of cross-wind to performance parameters of wet cooling tower based on level Froude number. Appl. Therm. Eng. 2013, 51, 1226–1234. [Google Scholar] [CrossRef]
  35. Xin, F. Basic Theory and Method of Neural Net Intelligence; Southwest Jiaotong University Press: Chengdu, China, 2000. [Google Scholar]
  36. Yao, Y.B.; Wang, J.L. Research on raising BP network training speed. Inf. Technol. 2002, 1, 4–6. [Google Scholar]
  37. Conde, M.R. Properties of aqueous solutions of lithium and calcium chlorides: Formulations for use in air conditioning equipment design. Int. J. Therm. Sci. 2004, 43, 367–382. [Google Scholar] [CrossRef]
  38. China Academy of Building Research. CECS 362–2014 Technical Specification for Heat-Source-Tower Heat Pump System; China Planning Press: Beijing, China, 2014. [Google Scholar]
Figure 1. Schematic diagram of the test rig.
Sustainability 08 00410 g001
Figure 2. The structure of the back-propagation (BP) network.
Sustainability 08 00410 g002
Figure 3. Dependence between MSE and the neuron number at the hidden layer for the variable learning rate backpropagation algorithm.
Sustainability 08 00410 g003
Figure 4. Training, validation and test mean squared errors for the variable learning rate backpropagation algorithm.
Sustainability 08 00410 g004
Figure 5. Freezing point temperature and relative density of CaCl2 aqueous solution vs. CaCl2 mass fraction.
Sustainability 08 00410 g005
Figure 6. Specific heat capacity of CaCl2 aqueous solution vs. CaCl2 mass fraction and temperature.
Sustainability 08 00410 g006
Figure 7. Thermal conductivity of CaCl2 aqueous solution vs. CaCl2 mass fraction and temperature.
Sustainability 08 00410 g007
Figure 8. Dynamic viscosity of CaCl2 aqueous solution vs. CaCl2 mass fraction and temperature.
Sustainability 08 00410 g008
Figure 9. ANN predictions for the tower effectiveness (a) and the COP of the HP (b).
Sustainability 08 00410 g009
Figure 10. The tower effectiveness and the COP of HP vs. CaCl2 mass fraction.
Sustainability 08 00410 g010
Table 1. Specifications of instruments.
Parameters (Test Point As Shown in Figure 1)Instruments (Type)Accuracy
Dry- and wet-bulb temperature of inlet (T1) and outlet (T2) airPlatinum resistance thermometer (PT100)±0.2 °C
Discharge temperature of condensate water(T3)
Inlet (T4) and outlet (T5) aqueous solution temperature
Inlet (T6) and outlet (T7) water temperatures
Aqueous solution flow rate(F1)Ultrasonic flowmeter (PFSE)±1%
Water flow rate (F2)
Outlet air velocity (V)Hot-wire anemometer (TSI 8347)±0.01 m/s
Input power of antifreeze solution pump (P1), fan (P2), circuiting pump (P3), compressor (P4)Digital Clamp Multimeters (UT202A UNI-T)±1.5%
Convenient data statisticsColor paperless recorders (EN880)Sampling interval
Table 2. Value ranges of input parameters in the ANN model.
Input ParametersValue Ranges
Ta,i (°C)8.1–20.3
Twb,i (°C)6.3–14.2
Tw,i (°C)31.2–43.7
w (%)3, 9, 15, 21, 27

