Article

Risk Assessment in the Istanbul Strait Using Black Sea MOU Port State Control Inspections

by
Esma Gül Emecen Kara
Maritime Transport Management Engineering, Engineering Faculty, University of Istanbul, Istanbul 34320, Turkey
Sustainability 2016, 8(4), 390; https://doi.org/10.3390/su8040390
Submission received: 8 February 2016 / Revised: 12 April 2016 / Accepted: 18 April 2016 / Published: 20 April 2016

Abstract

:
The Istanbul Strait has intense maritime traffic while, at the same time, it poses significant navigational challenges. Due to these properties, there is always a high risk arising from maritime shipping in this region. Especially, substandard ships threaten life, as well as the marine environment. In this aspect, Black Sea Memorandum of Understanding (MOU) Port State Control Inspections are important for maritime safety in the Istanbul Strait, because they directly reflect the performance of ships passing through the Istanbul Strait. Stringent and effective inspections assist in the enhancement of navigation safety and help to develop sustainable environment management. In this context, this study aims to assess maritime safety for the Strait region concerning passing flag states. Firstly, to assess the performance of flag states in general, the Black Sea MOU Black-Grey-White lists were generated for the period 2004–2014 and the change in the performance of these flags was examined. Secondly, the risk level of each flag state passing from the Strait region was determined using the method of weighted points based on the Black-Grey-White List, deficiency index level, casualty index level, and passing index level.

1. Introduction

For centuries the Istanbul Strait has been an important link between the Black Sea, which is a closed sea, and the rest of the world. It is one of the seaways with the most intense maritime traffic in the world [1]. Moreover, it presents significant navigational challenges due to its geographic and oceanographic characteristics. It is approximately 31 km long, with an average width of 1500 m. It has several sharp turns requiring that ships alter course at least 12 times to safety navigate through it. At its narrowest point, which measures only 700 m, the current can reach 7–8 knots and a 45 degree course alteration is required, while at some sections the necessary course alteration reaches 80 degrees [2]. In addition to these factors, there is another factor making navigation hazardous: that is the intense volume of local maritime traffic. On a daily basis, many passenger boats, passenger and car ferries, and sea buses traverse the Strait [3]. Therefore, maritime shipping poses a particularly high risk to the region. Additionally, substandard ships increase the risk and threaten not only the marine environment but also life in this region. Over the years, serious accidents causing environmental disasters, such as those involving the Independenta, the Nassia, and Volganeft-248, have taken place in this region [4,5,6]. These causalities resulted in the loss of lives as well as caused significant amounts of oil to spill into the sea and the burning of oil causing air pollution. The Independenta accident resulted in the spillage of around 65,000 tons of crude oil into the Strait, and is one of the worst oil spills on record [4].
According to records of the Turkish Coastal Safety and Salvage, there have been several maritime incidents, such as grounding, contact, collusion, and fire [7]. These include the frequent occurrence of ships ramming into seaside buildings or contact with local maritime vessels and fishing boats due to engine failure or navigation failure.
The 1994 Turkish Maritime Traffic Regulations were revised with the 1998 modified regulations after being adopted by the IMO and in 2004, the Vessel Traffic Services (VTS) were established to provide maritime safety in the region. These regulations, together with the establishment of the VTS, have decreased the number of collision-related accidents, but they have not had any effect on other types of accidents [8]. There are various international rules and recommendations in order to reduce the risks arising from maritime transportation on the world’s seas, as well as to provide maritime safety and protect the marine environment which are regulated by the International Maritime Organization (IMO), such as the convention for the safety of life at sea (SOLAS), the international convention for the prevention of pollution from ships (MARPOL), and the convention of the international regulations for preventing collisions at sea (COLREG). The primary responsibility for the implementation and enforcement of these regulations for all ships flying their flags lies with the flag states [9]. Classification societies perform, statutorily, surveys and related activities on behalf of flag states by authorization of a flag state. Classification societies play an important role in the case of certain states, such as open registers (Flags of Convenience—FOCs), which do not have the resources or personnel needed to carry out the inspections [10,11]. Additionally, Port States have the right to inspect a foreign-flagged ship coming into their port to ensure that the ship meets the requirements of international regulations, which is described as Port State Control (PSC). If a ship cannot comply with the standards required by the relevant conventions, the IMO Standards, it is called a substandard ship. PSC is often accepted as a measure to consolidate the former maritime safety net constructed by flag states and classifications societies; that is, the last safety net [12]. It was due to a problem that PSC originally emerged. Many flag states were unable to adequately perform their mandated duties of ensuring that ships flying their flags complied with the IMO standards. This was especially the case with FOCs which were forced to do this because a ship flying with an open register flag rarely visit its ports of registry in its service life and additional costs are required for control mechanisms [13]. After a series of tanker accidents in the 1970s, the control mechanism used by flag states and classification societies were deemed as ineffective in eradicating all substandard ships from the seas and the PSC emerged to assist in the enforcement of the procedures relating to international conventions [9,14].
Regional agreements on the PSC (Memorandum of Understanding on Port State Control—MOU) have been created in order to develop an effective and sustainable inspection mechanism by balancing the demand for ports in the same region, exchanging information on ships inspected, unifying the standards for inspection and detention and the training of officers conducting inspections under the PSC [15,16]. The first regional agreement was the Paris MOU which includes Europe and the North Atlantic region. Since then, another eight regional agreements have been established and are, respectively, the Acuerdo de Vina del Mar Agreement, the Tokyo MOU, the Caribbean MOU, the Mediterranean MOU, the Indian Ocean MOU, the Abuja MOU, the Black Sea MOU, and the Riyadh MOU. In addition to these regional agreements, the USA conducts PSC over its territorial waters [15,16,17].
Despite the fact that all regional PSC regimes are the same, there are differences in their implementation, such as the evaluation of performance of flag states and selecting priority ships for inspection [15]. Moreover, each port in the same regime does not carry out the inspections with the same strictness due to geographic and cultural differences; therefore, the average detention and deficiency rates may be different from one to another [18]. The largest and most stringent inspections are made in the Paris MOU and the Tokyo MOU with leader memorandums [15]. According to research by Li and Zheng, the Paris MOU and the Tokyo MOU have the most efficient ship selecting methods [12]. The Paris and Tokyo MOUs use “The Black, Grey and White List” (BGW list) of flag states as one of the parameters for determining a ship’s risk profile. The BGW list which represents the performances of flag states is generated based on the statistics of inspections and detentions conducted during the previous three years. From time to time, amendments are necessary by PSC regimes in order to improve the effectiveness of inspections and to ensure sustainability.
Several academic studies based on detentions and deficiencies detected in the various regional MOUs have been carried out to determine the effect of the PSC on maritime safety, taking into account various parameters such as ship age, ship type, recognizing organizations and flag states. These studies have concluded that the PSC has been successful in reducing risk and in raising the maritime safety level [12,13,14,18,19,20,21,22,23]. The PSC mechanism is regarded as one of the most important tools to ensure maritime safety.
In this context, although the risks arising from maritime shipping cannot be completely eliminated due to the aforementioned characteristics of the Istanbul Strait, they may be reduced and the safety of navigation in this region may be improved by means of PSC inspections. The Black Sea MOU inspections are of special importance for maritime safety in this region because ships passing through this region, which visit a seaport of the Black Sea, are inspected in the Black Sea MOU. At the same time, these inspections are an important indicator of maritime safety in this region because these inspections directly reflect the performance of flag states passing through this region.
In this study, for the assessment of risks arising from maritime transportation in the Istanbul Strait, the risk level of passing flag states from this region has been taken into consideration. Firstly, in order to evaluate the performance of flag states, the Black Sea BGW lists are generated, as is the case with those of the Paris MOU and the Tokyo MOU. Secondly, in order to determine the risk level of flag states passing through the Istanbul Strait, the weighted point method, which includes the criteria of the BGW list, deficiency index level, casualty index level, and passing index level, is used.

2. Literature Review

Various studies on the casualty rates of flag states and the relationship between PSC inspections and flag states’ related risk have been carried out. In these studies the risks arising from maritime transportation are evaluated based on flag state data on PSC and the casualty rate of ships from flag states like this study. Li and Wonham investigated total loss statistics from 1977 to 1996 and analyzed the world fleet, dividing it into groups according to the total accidental loss rate. They concluded that the total loss rate had declining for this period due to the implementation of safety measures and confirmed that open registers (FOCs) had the worst safety record, generally [24]. Alderton and Winchester examined the casualty record of flag states for the years 1997–1999 by comparing the average casualty rates of flag states according to the types of register and their findings indicated that FOCs had generally a worst record than national flags [25]. Li investigated the relationship between the total loss rate of FOCs and Port State Control detentions, and found that there was a high correlation between the loss rate and detention rate and the age of a ship [26]. Cariou et al. showed that the main determinants of the number of reported deficiencies were the age of the vessel at inspection, the type of vessel, and the flag of registry [13]. Knapp and Franses analyzed the effect of PSC inspections on the probability of casualty according to targeting ships, ship types, flag states, classification societies, and detained vessels. One of the conclusions drawn in this study is that black-listed flag states showed a higher probability of a serious casualty compared to the gray- and white-listed flag states [27]. Robert and Marlow investigated casualties in dry bulk shipping from 1963–1996 and stressed that the risk would increase with ship age and the ship’s flag of registration [28]. Piniella et al. studied the influences of PSC policies concerning FOCs using detention and deficiency data of the Paris and Tokyo MOUs and the USCG. As part of this study, the relationship between FOCs fleets and the detection of substandard ships is determined using the detention index and they found that all FOCs have different results in the ranking of the highest detention index [29]. Degre generated the Black-Gray-White list of categories of vessels according to their observed casualties using similar methods to those of the Black-Grey-White list of the Paris MOU to complement flag state performances [30].
Furthermore, there are several studies, which take differing angles, based on maritime traffic of the Istanbul Strait and risk assessment. In these studies the risks arising from maritime transportation in the Istanbul Strait are evaluated using various parameters and methods, and the common finding of all these studies is that the Istanbul Strait is a high-risk waterway. Emecen Kara and Okşaş evaluated maritime safety in the Istanbul Strait according to average detention and deficiency rates of flag states passing through it in all regional MOUs [15]. Using several maritime traffic safety parameters such as traffic flow, traffic volume of local vessel, and probability of collusion Aydoğdu et al. found that the areas most at risk were at the southern entrance to the Istanbul Strait [31]. Arslan and Turan investigated maritime casualties in the Istanbul Strait analytically and found various factors causing shipping accidents and the weights of each factor using the SWOT-AHP method [32]. Or and Kahraman analyzed possible factors contributing to accidents in the Istanbul Strait using Bayesian analysis and simulations modelling. Their results indicated significant increases in the number of accidents in maritime conditions such as higher transit traffic rates, denser local traffic conditions, and adverse weather conditions [33]. Ulusçu et al. analyzed safety risks pertaining to the transit vessel maritime traffic in the Istanbul Strait by dividing it into slices incorporating a probabilistic accident risk model into the simulation model. They also investigated the impact of various factors, which included vessel arrivals, scheduling policies, pilotage, overtaking, and local traffic density, on the risk profile of the Strait. Local traffic density and pilotage were found to be two main factors affecting the level of risk [3]. Contrary to these studies, in this study the risk arising from maritime transportation in the Istanbul Strait are determined based on the performances of flag states on the Black Sea MOU, as well as the number of passing and casualty rates of flag states in this region.

3. Ship Traffic in the Istanbul Strait

The number of ships passing through the Istanbul Strait from 2005 to 2014 are shown in Table 1. The average annual number of ships is approximately 54000 between 2005 and 2009. The annual number of ships have decreased since 2009.
The 16 flag states with the highest number of ships passing through the Istanbul Strait for the period of 2005–2014 are given in Figure 1. The four flags states with the highest total number of ships passing through the Strait are Turkey, Malta, Russia, and Panama, respectively.

4. Materials and Methods

4.1. Method for Flag State Risk Level Determination

The risk level of flag states passing through the Istanbul Strait is determined based on the parameters of detentions, deficiencies, number of casualties, and number of passing ships. Each flag state risk level is determined by the following equation:
F R L = B G W   l i s t   p o i n t + D I L   p o i n t + C I L   p o i n t + P I L   p o i n t
In the formula (1), F R L is Flag State Risk Level, B G W   L i s t   P o i n t is Black-Grey-White List point, D I L   p o i n t is the Deficiency Index Level point, C I L   p o i n t is the Casualty Index Level point and P I L   p o i n t is the Passing Index Level point.

4.1.1. Method of Generating the BGW List and Calculations of Excess Factor

The BGW list determines the performance of each flag state depending on its detentions and inspections. The BGW list is generated [35,36] using “Equations (2) and (3) assuming that the number of detentions follows a binominal distribution” in the Paris and Tokyo MOUs.
u b l a c k t o g r e y = N . p + 0.5 + z ( N   p ( 1 p ) )
u g r e y t o w h i t e = N . p 0.5 z ( N   p ( 1 p ) )
In the equations; u b l a c k t o g r e y is the black to grey limit, u g r e y t o w h i t e is the grey to white limit, N is total number of inspections, p is allowable detention limit, z is statistical constant. Where p = 0.07 (with 0.03 incremental steps) and z = 1.645 (for certainty level of 95%) is taken. These limits are used to calculate the excess factor (EF) of each flag state in order to compare them. These calculations are applied to flags that have had more than 30 inspections in the previous three-year period.

4.1.2. Calculation of the Flag Deficiency Index Level

D I L is determined by the following equation:
D I L = D e f i c i e n c y   I n d e x R e g i o n a l   A v a r a g e   D e f i c i e n c y   I n d e x
where, “ R e g i o n a l   A v e r a g e   D e f i c i e n c y   I n d e x " denotes “the ratio of the total number of deficiencies to the total number of all inspections in the regional MOU over three years”. “Deficiency Index” of a flag state is the ratio of the total number of a flag’s deficiencies to the total number of inspections in this flag over three years [37].

4.1.3. Calculation of the Casualty Index Level

This index level is determined by using the following equation:
C I L = C a s u a l t y   I n d e x R e g i o n a l   A v e r a g e   C a s u a l t y   I n d e x
In the equation, the C a s u a l t y   I n d e x is the ratio of the total number of a flag’s casualties over three years to the total number of ships of a flag passing in the same period, the R e g i o n a l   A v e r a g e   C a s u a l t y   I n d e x is the ratio of the total number of overall casualties to the total number of all ships passing in this region over three years.

4.1.4. Calculation of Passing Index Level

Passing Index Level ( P I L ) is determined by:
P I L = P a s s i n g   R a t e R e g i o n a l   A v e r a g e   P a s s i n g   R a t e
R e g i o n a l   A v e r a g e   P a s s i n g   R a t e is the average of all flags’ passing rate over three years for the Strait region. P a s s i n g   R a t e is the ratio of the total passing number of a flag state to the total number of passing all ships over three years.

4.2. Determining Risk Level of Criteria and Weighted Points

The criteria and weighted points within each parameter for each Flag State Risk Level are shown in Table 2. F R L groups flag states into “high risk”, “standard risk”, and “low risk”; these risk groups are used to determine ship risk profile in the Paris MOU [38]. According to the weighted points in Table 2, flags having a total of four or more points are grouped as having a high risk level, while flags having between zero and four total points are grouped as having a standard risk level. Other flags that have a total point of zero are grouped as having a low risk level.
According to criteria values, risk levels are categorized as the following.
The BGW list is divided into three levels by EF value (EF ≤ 0 is the white list, EF ≥1 is the black list, and 0 > EF > 1 the grey list). Additionally, the black list has been divided into four risk levels—VHR, HR, M to HR, and MR according to EF value. The relationship between the number of inspections and detentions is illustrated graphically in Figure 2.
D I L is categorized as:
D I L = {   < 1.0   L o w   R i s k   1.0   H i g h   R i s k
C I L is categorized as:
C I L   {   <   1.0   L o w   R i s k 1.0   a n d   2.0   H i g h   R i s k   > 2.0   V e r y   H i g h   R i s k
P I L is categorized as:
P I L { < 1 L o w   R i s k 1   a n d   < 2 M e d i u m   R i s k 2   a n d   < 3 M e d i u m   t o   H i g h   R i s k 3   a n d   < 4 H i g h   R i s k 4   V e r y   H i g h   R i s k

4.3. Data

The statistics of inspections/detentions/deficiencies conducted on the Black Sea MOU and the statistics of passing ships and casualties in the Istanbul Strait have been used for this study.
The data used to evaluate performance of flag states was obtained from annual reports (from 2004 to 2014) which are found on the Black Sea MOU website [39].
The data used to determine the Flag State Risk Level were obtained from the annual reports for 2012, 2013, and 2014 from the Black Sea MOU website [39] and from the passing ships and the Marine Causalities and Incidents statistics of the Turkish Ministry of Transport, Maritime Affairs and Communications [7].

5. Results

5.1. Port State Control Inspections in the Black Sea MOU Region

The Black Sea MOU was signed by Bulgaria, Georgia, Romania, Russia, Turkey, and Ukraine in 2000. The Black Sea MOU includes the Black Sea region and it aims to improve maritime safety in the Black Sea region. Foreign-flagged ships visiting a seaport in the region are inspected according to the international regulations in force [37]. Inspection statistics will be published in the annual report printed by the middle of the following year. For example, the 2015 annual report has not yet been published.
The Black Sea MOU inspection statistics over the period 2005–2014 are summarized in Table 3. These inspection statistics were obtained from annual reports of the Black Sea MOU [39]. It shows that over 60% deficiencies were detected in inspections and that the detention rate decreased over the period.
The percentage of deficiencies by categories over the period of 2012–2014 are shown in Figure 3. This shows that navigation safety, lifesaving appliances, working conditions, and fire safety measures are the top four categories in terms of deficiency.

5.2. Examination of Flag State Performance Depending on Detention Rate in the Black Sea MOU

The Black Sea MOU BGW lists are generated annually using data from inspections and detentions on the Black Sea MOU over the preceding three years. According to the excess factor, calculated to compare the performance of flags, all flags inspected on the Black Sea MOU are included in the lists. Thus, a general evaluation has been carried out by means of examining the performance of flag states and the change in this performance over time.
The change in excess factor flag states listed in the black list over time are shown in Figure 4. The DPR of Korea, the Comoros, Georgia, Cambodia, Sierra Leone, Saint Kitts and Nevis, Syria, and Moldova were in the black list in 2006 (covering the years 2004–2006). In 2008 Panama was in the black list, as was Togo in 2009. The DPR of Korea was removed from the BGW list after 2009 due to a decrease in the number of inspections of the DPR of Korea-flagged ships in this period (inspections below 30 in the preceding three years related to a decrease in ship numbers calling to regional seaports). Tanzania and Bolivia were in the black list in 2010. Bolivia was removed from the BGW in 2012. Tanzania, Georgia, Moldova, and Togo were still in the black list in 2014. Tanzania has high risk status and Georgia has medium to high risk status, while Moldova and Togo have medium risk status. Other flags have moved to the grey list. The black list risk level has generally decreased over time.
The change in excess factor flag states located in the grey list are shown in Figure 5. Antigua and Barbuda, Norway, China, Belize, Gibraltar, and the Isle of Man have moved to the white list over time. Azerbaijan was removed from the BGW list after 2009 because the total number of inspections fell below 30 in the preceding three years relative to the number of visiting ships. In the same way Mongolia, India, and Slovakia were removed from the list in 2011.

5.3. Flag State Risk Level of Ships Passing through the Istanbul Strait

5.3.1. Results about Parameters

To determine the risk Level of flags passing through the Istanbul Strait, firstly, the BGW list, the deficiency index, the casualty index, and the passing rate of flags are calculated.
We generate the BGW list taking account of the inspection and detention data for the years 2012–2014. The BGW list limits are calculated for all flags that had 30 or more inspections during this period using Equations (2) and (3). All flags are listed in Table 4 with respect to the calculated excess factor.
According to this list, Tanzania, Georgia, Moldova, and Togo are in the black list. Tanzania is classified as high risk and Georgia has medium to high risk status, while Moldova and Togo have medium risk status. Cambodia, the Comoros, Sierra Leone, Ukraine, the Cook Islands, and Vanuatu are the top six flags in the grey list. Grey-listed flag states have medium to low risk status.
The deficiency index and the index level are calculated for all flags using inspection and deficiency data from the Black Sea MOU for the period 2012–2014. It is calculated that the Regional Average Deficiency Index value equals 0.63 for this period. All flags inspected over three consecutive years (from 2012 to 2014) are listed in Table 5 according to index level that is calculated using Equation (4). Algeria, Togo, Cambodia, the Comoros, Tanzania, and Sierra Leone are the top six flags that have deficiency rates above the regional average deficiency. According to the risk level defined in Equation (7), in the table, while flags whose index level is less than one are evaluated as low risk flags, the others are evaluated as high risk flags.
The casualty index of flags are calculated using data of casualty rates occurring in the Strait region for the period 2012–2014. Casualties occurring due to weather conditions have been eliminated from the evaluation. When the statistics are examined, it becomes evident that most of the casualties are due to collision/contact/grounding and resulted in minor damage, and most of the ships involved in such accidents were dry bulk ships.
The casualty rate and casualty index level values of flags that have been calculated using Equation (5) are shown in Table 6. Flag states that have zero casualty are not shown in this table. Flag states that suffered casualties during this period are listed according to the index level. According to the risk level defined in Equation (8), these calculations show that Sierra Leone, the United Kingdom, Cambodia, Hong Kong, Togo, Moldova, and Tanzania have very high risk status.
The passing rate of flags are calculated using data of ships passing in the Strait region for the period 2012–2014. The flag states are listed by the value calculated using Equation (6) in Table 7. About 108 different flag states passed through the Istanbul Strait during the period of 2012–2014. 24 of these flag states have a passing percentage of 1% or more. They constitute 93% of all passing ships.
Flags that have passing rates less than 0.005 are not shown in this table. Flags that have the highest passing rate are Turkey, Malta, Panama, Russia, and Liberia. According to the risk level defined in Equation (9), Turkey has a very high risk status, Malta has high risk, and Panama has medium to high risk, while Russia, Liberia, and Marshall Islands have medium risk status.

5.3.2. Results of the Risk Level of Flag States

The risk level of flags passing the Istanbul Strait was determined using Equation (1). Each flag was given points according to the index level shown in Table 4, Table 5, Table 6 and Table 7. The total points of flags, which determines the risk level of flag states passing through the Istanbul Strait, are shown in Table 8. With respect to the risk level given in Table 2, flags are listed as having a high risk, or standard risk in Table 8.
Table 9 shows flag states that have zero total points. These flags have been grouped as low risk level. FOCs have been marked with italics in these tables.

6. Discussion

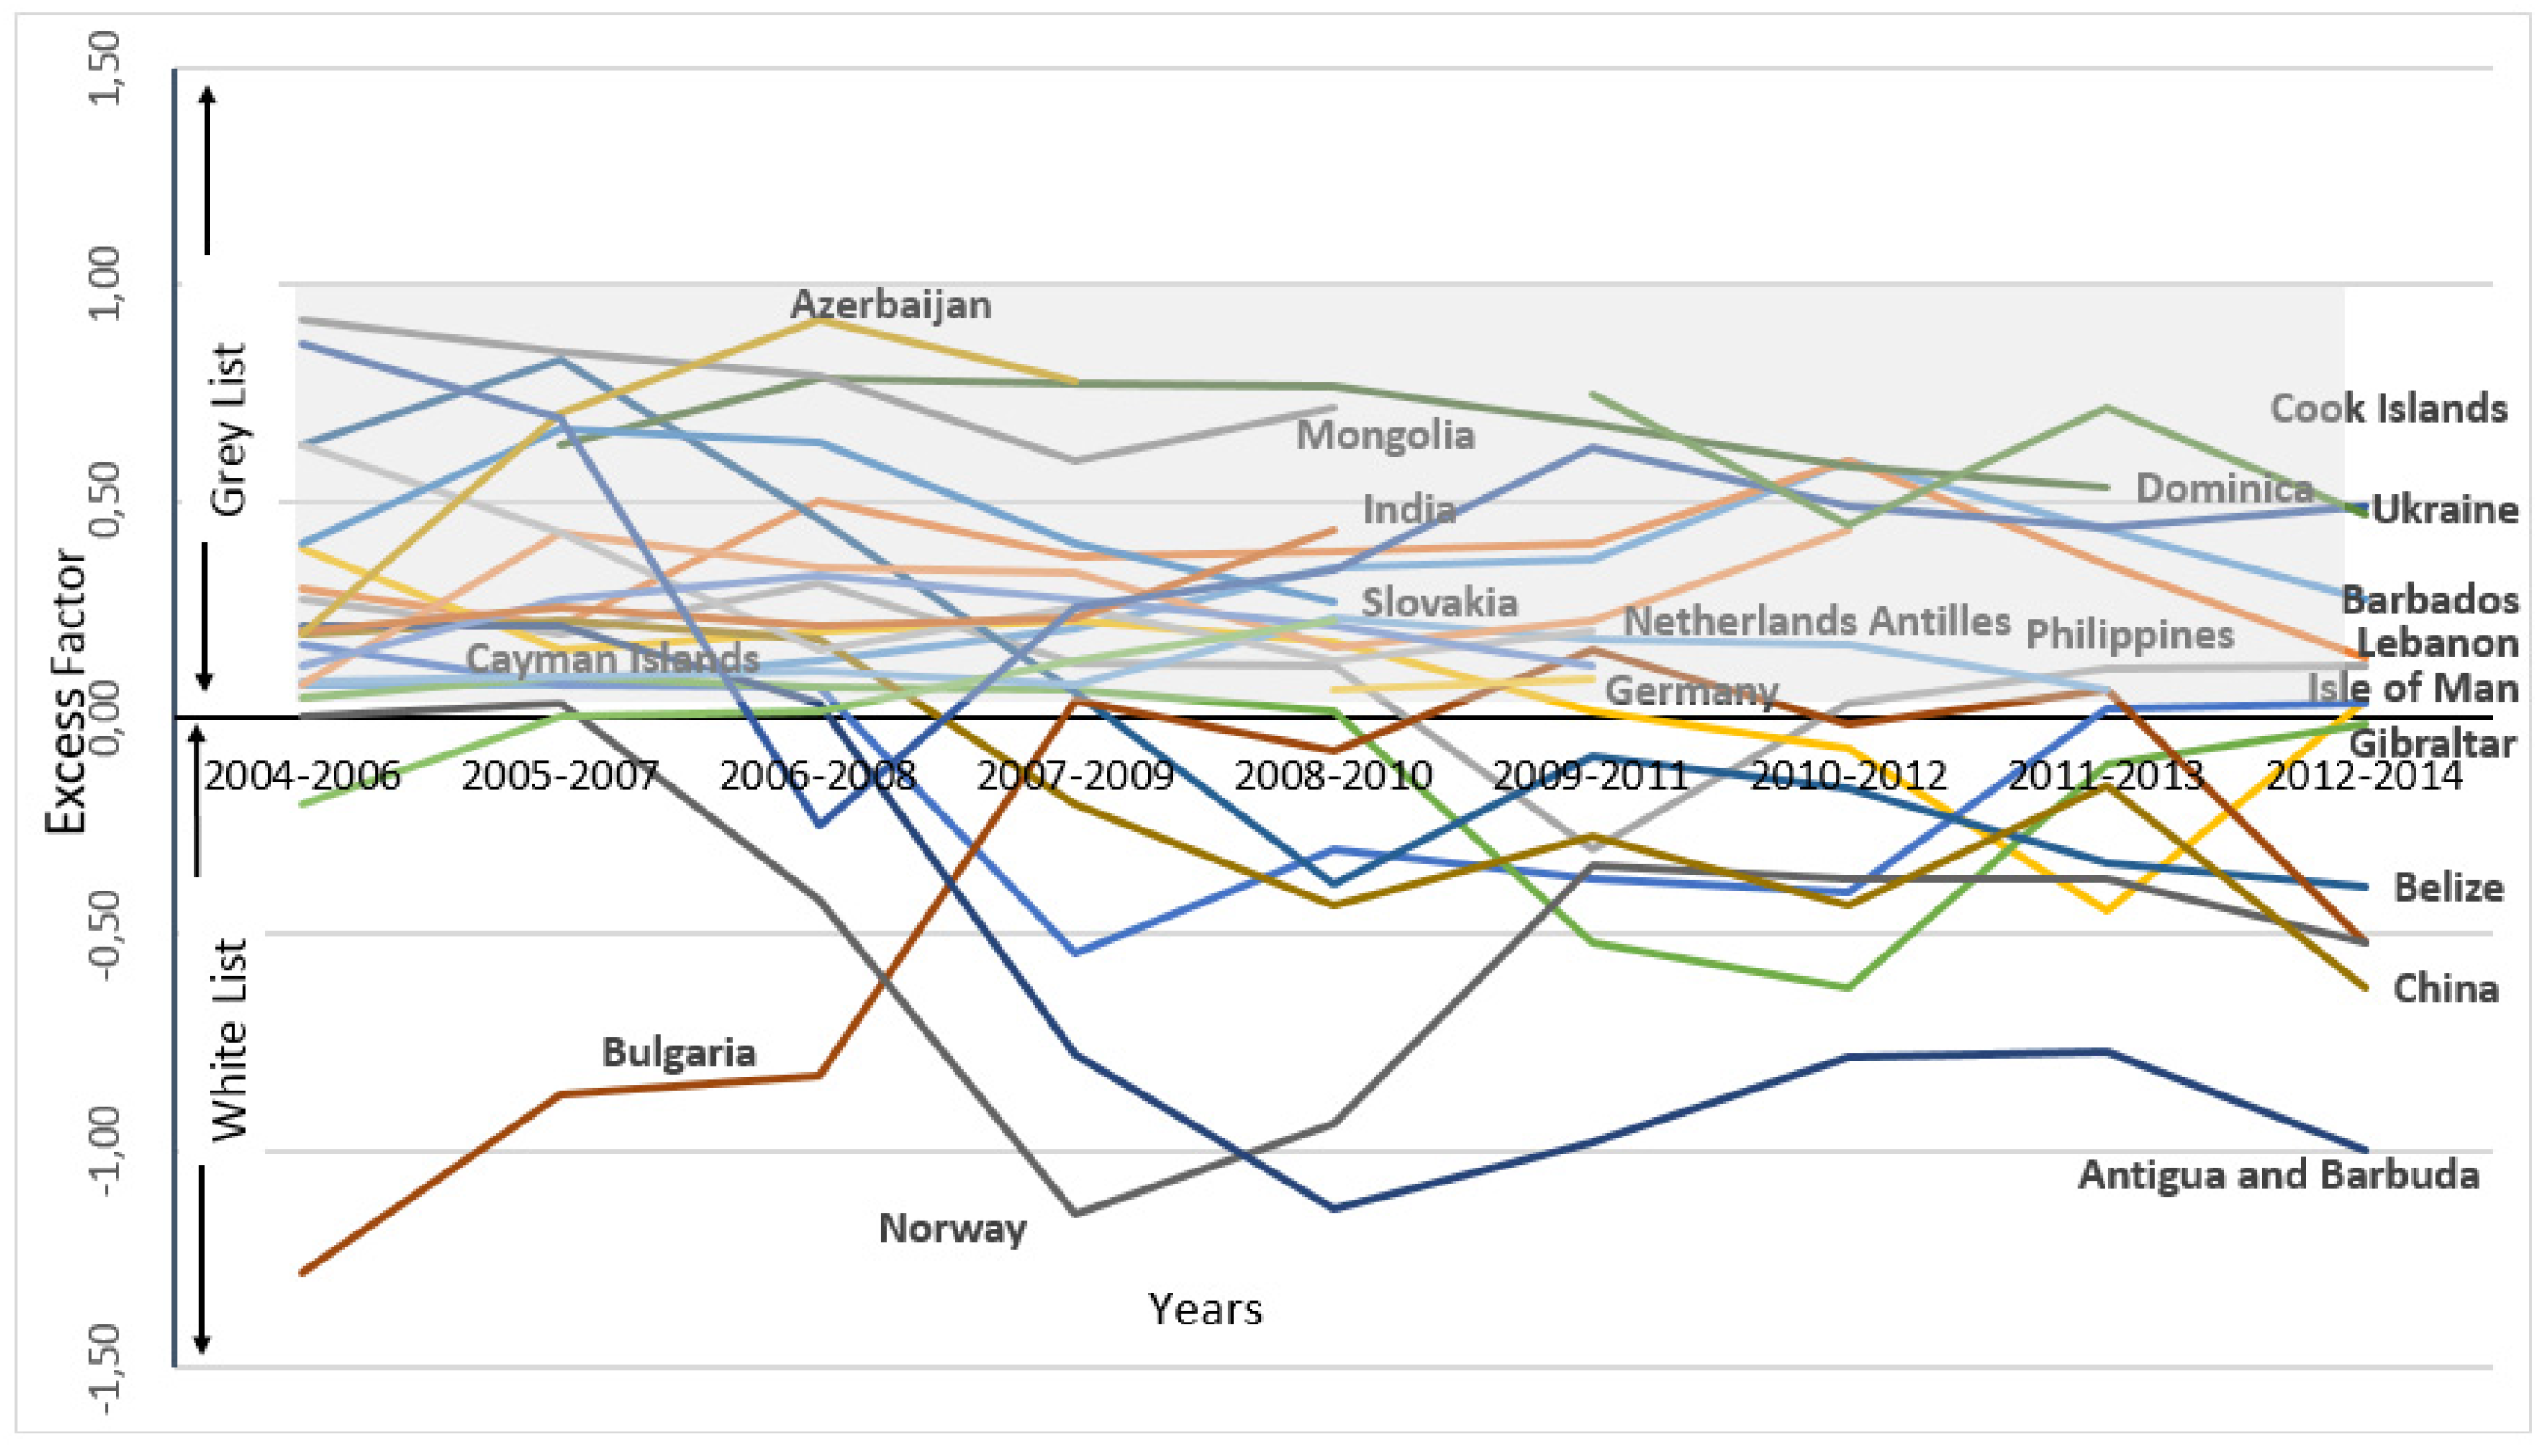
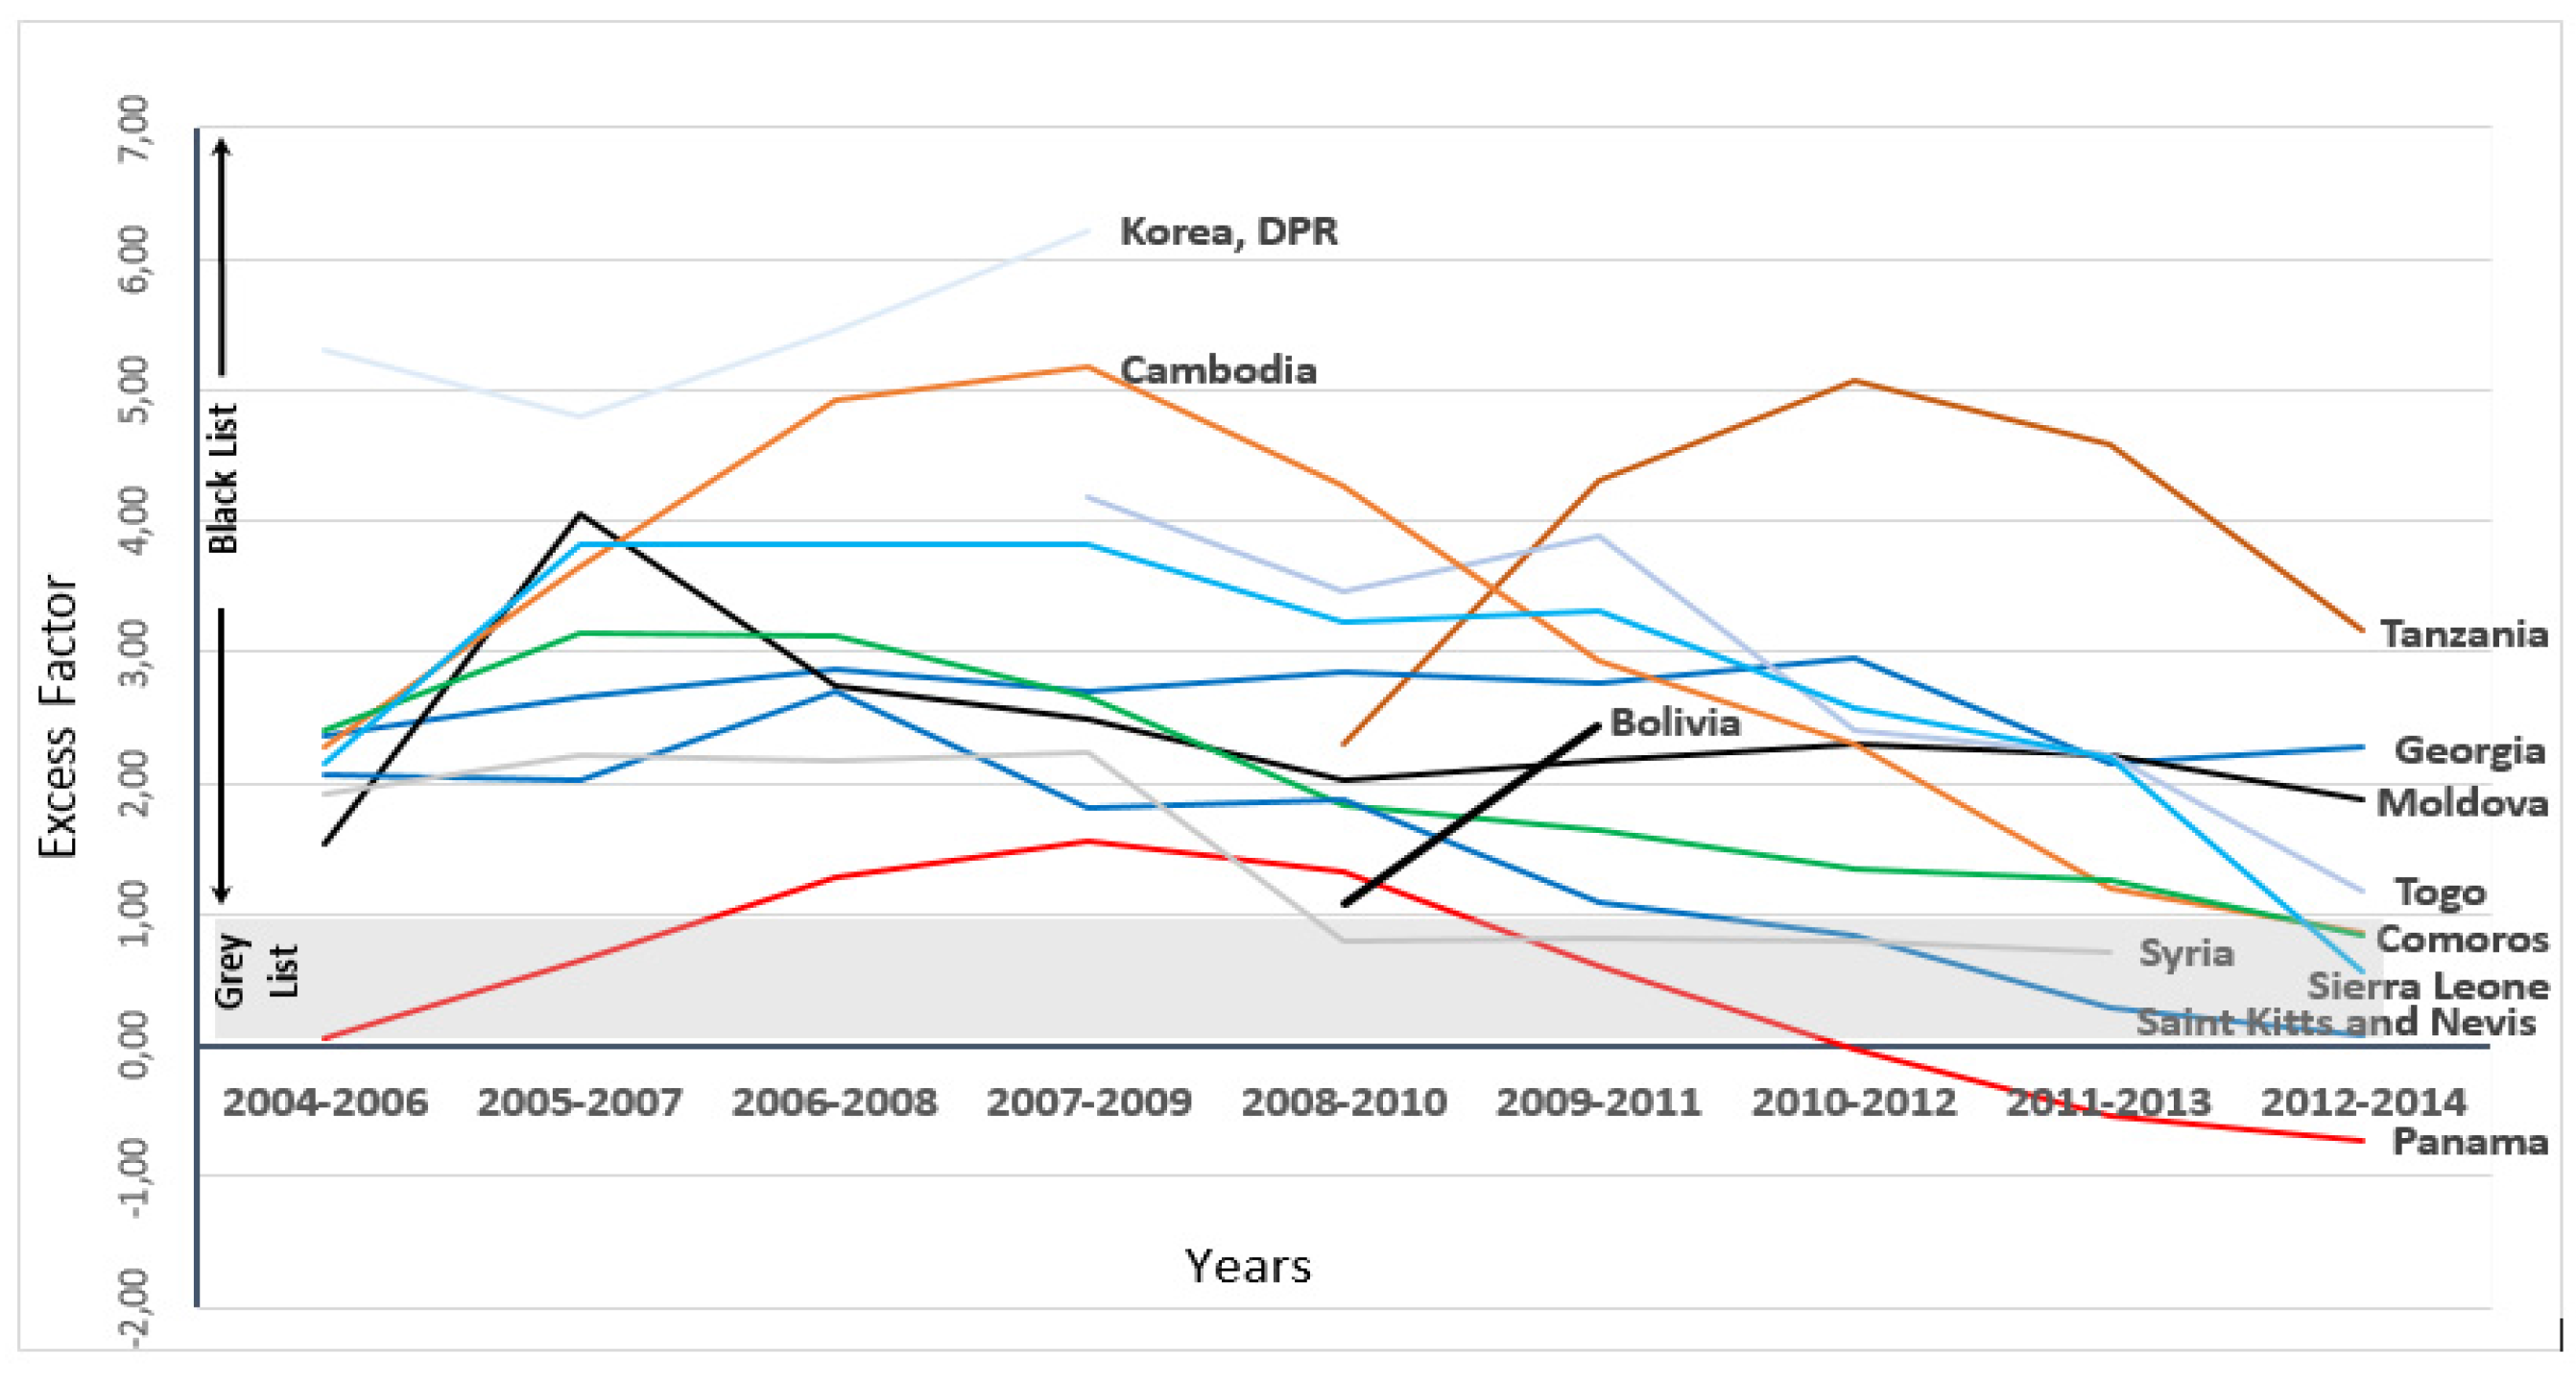
The percentage of inspections with deficiencies in the Black Sea MOU is over 60% and the detention rate has decreased since 2010. According to the BGW lists generated, a decrease can be seen in the flag states risk level from the years 2004 to 2014. The risk level of black-listed flags has shown a declining trend from 2009, except for Tanzania and Bolivia. This result indicates that PCS inspections have been effective in decreasing the risk in the Black Sea Region. The Comoros, Sierra Leone, Cambodia, and Saint Kitts and Nevis have moved from the black list to the grey list over time, and Panama has moved to the white list. Additionally, some flags, such as the DPR of Korea, Bolivia, Dominica, Syria, Mongolia, India, and Azerbaijan have been removed from the BGW lists over time, because the number of inspection is lower than 30 in the previous three-year period related to the number of ships visiting the Black Sea region seaports. However, this does not mean that these flags have no risk.
Moreover the BGW lists show that there was an overall improvement in the performance of FOCs from 2004 to 2014. In particular, the number of DPR of Korea-flagged ships, which had the highest value of excess factor in the black list from 2004 to 2009, have decreased significantly.
According to the 2014 BGW list, while some FOCs such as Cambodia, the Comoros, Vanuatu, Barbados, Lebanon, and St. Vincent and the Grenadines, are in the grey list, and Georgia and Moldova are in the black list. Some others, such as Liberia, Malta, and Panama, which have the highest passing percentage, are in the white list. This demonstrates that there are differences among the performances of FOCs. This finding complies with the findings of Alderton and Winchester, Li and Wonham, and Piniella et al.
Some flags such as Algeria, Bangladesh, Dominica, Egypt, Honduras, Kiribati, Switzerland, Syria and Tuvalu have not been included in the 2014 BGW list, because they have not had 30 or more inspections. However, this does not show that these flags are not at risk, these flag states have a high risk status according to the deficiency index.
Flag states’ performances in the 2014 BGW list are, in general, similar to those in the Paris MOU. Tanzania, Georgia, Moldova, and Togo are black-listed flags in the BGW list of the Black Sea MOU. Tanzania, Moldova, and Togo are also in the black list on the Paris MOU and Tanzania has the highest risk in both the Black Sea MOU and the Paris MOU. However, there are more flag states in the black list of the Paris MOU than the Black Sea MOU. While Sierra Leone, Cambodia, St. Vincent and the Grenadines, the Comoros, and the Cook Islands are grey-listed flags in Black Sea MOU, they are black-listed flags in the Paris MOU. Additionally, a surprising result is that Belize, which is a white-listed flag in the Black Sea MOU and Dominica, which is not listed in the Black Sea MOU, are found on the black list of the Paris MOU, and Georgia which is a black-listed flag in the Black Sea MOU is not listed in the Paris MOU.
Flag states’ performances in the 2014 black list of the Black Sea MOU differ from those in the Tokyo MOU significantly, but with the exception of Tanzania. Togo is in the grey list on the Tokyo MOU, and Moldova and Georgia are not listed on the Tokyo MOU. There are 12 flag states in the black list of the Tokyo MOU. Most of these flag states are not listed in the Black Sea MOU due to the fact that the number of inspected ships was lower than 30. While Sierra Leone and Cambodia are black-listed flags in the Tokyo MOU, they are grey-listed flags in the Black Sea MOU. Moreover, Belize, one of black-listed flags in the Tokyo MOU is in the white list of the Black Sea MOU.
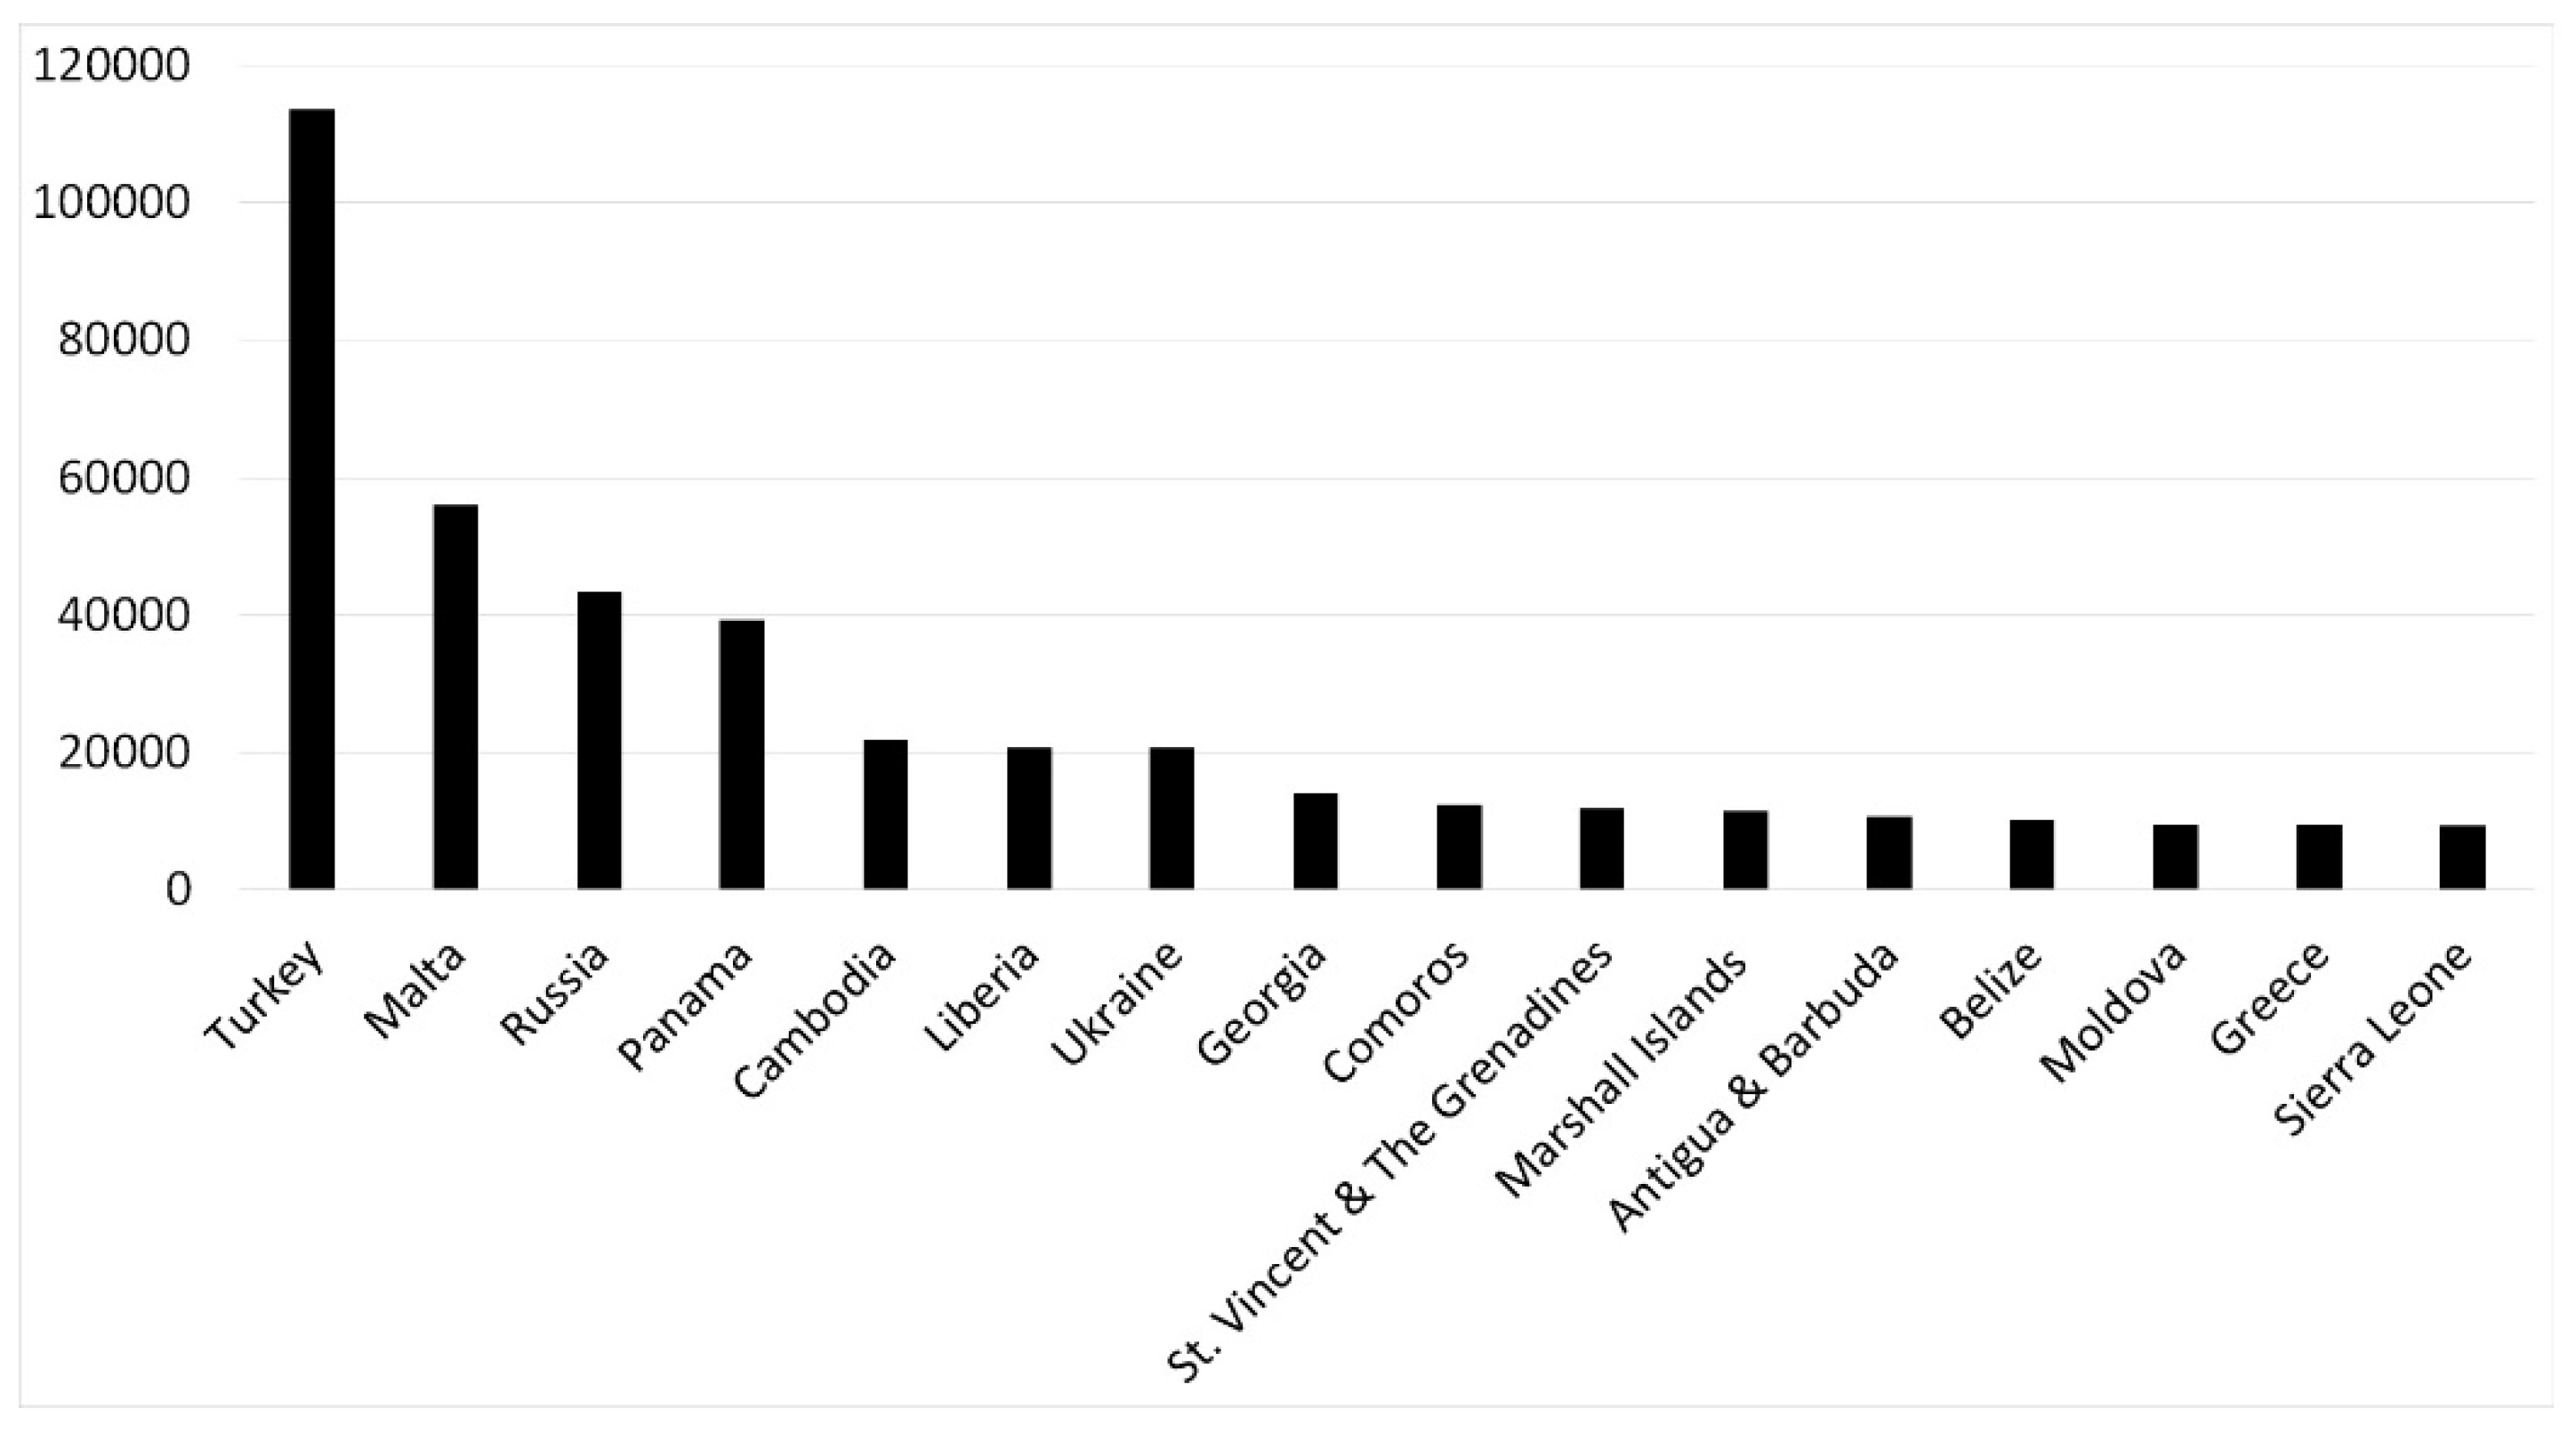
According to the flag state Risk Level of ships passing through the Istanbul Strait, Tanzania, Moldova, Togo, Cambodia, Georgia, Sierra Leone, and Turkey are classified as having high-risk flags. Tanzania, Moldova, Togo, and Georgia are already in the black list. Despite Cambodia and Sierra Leone being in the grey list, they are classified as having a high risk level because they have very high casualty index points. In the same way, despite the fact that Turkey is in the white list, it has a high risk level because it has very high passing percentage points. About 108 different flag states have passed through the Istanbul Strait during this period. 24 of these flag states, which have a passing percentage of 1% or more, constitute 93% of all passing ships. 25% of them have a high risk level, 62.5% of them have a standard risk level, and 12.5% have a low risk level. Another 84 flag states, which have a passing percentage below 1%, constitute 7% of all passing ships. Only one of these, Georgia, has a high risk level. 19% of these flag states have a standard risk level. Algeria, Bangladesh, Dominica, Egypt, Honduras, Kiribati, Switzerland, Syria, and Tuvalu have been included in the ranking of standard risk because these flags have larger deficiency index scores.
Additionally, it has become evident that the risk level of FOCs and national flags are not significantly different from each other in terms of evaluating high risk levels and standard risk levels. However, 16% of flag states with low-risk levels are FOCs. Eight of the top ten flag states in the ranking of passing percentage are FOCs. However, it should be noted that these FOCs generally have a standard risk level, except for Cambodia and Moldova, which are classed as high risk.
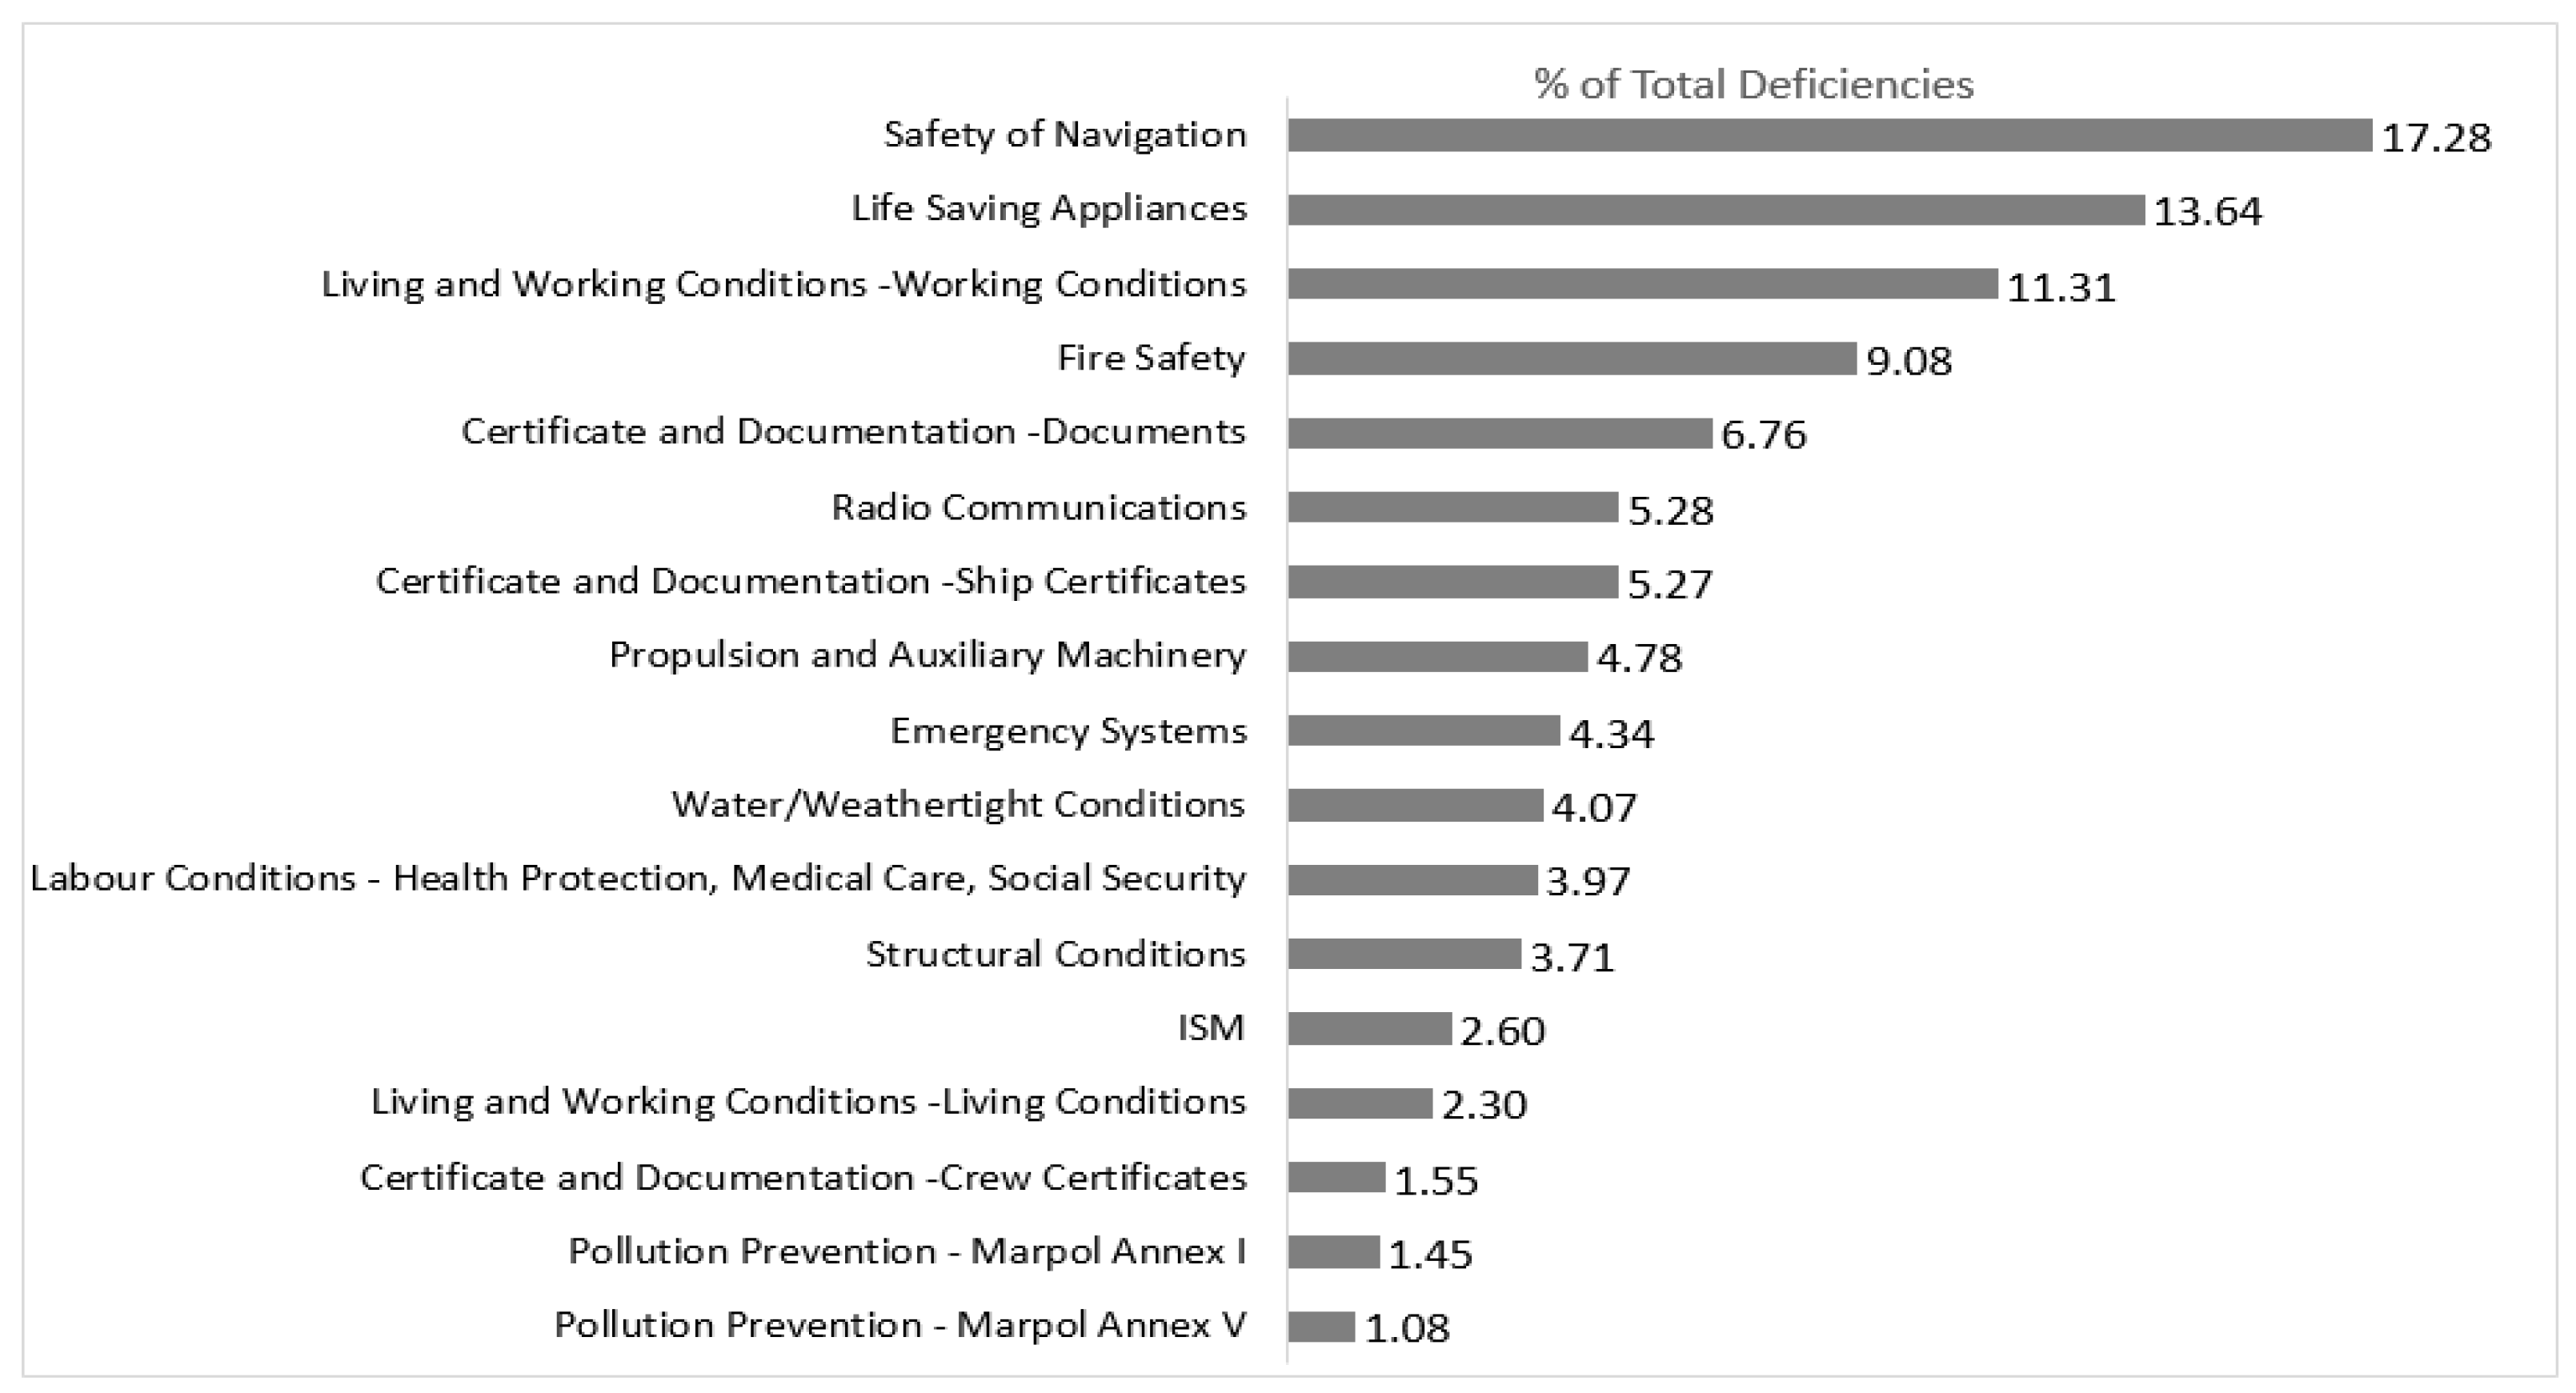
Safety of navigation, lifesaving appliances, and fire safety measures were the top deficiency categories in the Black Sea MOU during the period of 2012–2014. Research indicates that most of the casualties in the Strait region occurred due to navigational factors, such as collision or grounding in this period.

7. Conclusions

This study evaluates the risks arising from maritime transportation in the Istanbul Strait depending on the flag states of passing ships. The performance of these flags in the Black Sea MOU are a very important indicator because it directly demonstrates their risk level.
According to the Black Sea BGW lists, a decrease can be seen in the flag states risk level from the years 2004 to 2014. PCS inspections seem to be effective in decreasing the risk level in the Black Sea Region. There appears to be a similarity between the risk levels of flag states on the Black Sea MOU and the Paris MOU.
According to the flag state risk level of ships passing through the Istanbul Strait, Tanzania, Moldova, Togo, Cambodia, Georgia, Sierra Leone, and Turkey are classified as having high-risk flags. The risk level of FOCs and national flags are not significantly different from each other. About 25% of flag states constitute 93% of all passing ships have a high risk level, 62.5% of them have a standard risk level.
Sustainable inspection mechanisms on the Black Sea MOU will ensure the removal of substandard ships from the region’s seas over time and improve safety at sea. A New Black Sea Inspection Regime, with a risk-based targeting and inspection system is to be introduced from 1 January 2016 by the Black Sea MOU Committee. It is believed that the new inspection system will improve navigation safety in the Black Sea region and decrease risks in the Strait region arising from maritime transportation more than ever.

Acknowledgments

Author thanks two anonymous referees for their valuable comments.

Conflicts of Interest

The authors declare no conflict of interest.

References

  1. Chamber of Shipping, Istanbul & Marmara, Aegean, Mediterranean and Black Sea Region, Maritime Sector Reports. Available online: http://www.denizticaretodasi.org.tr/en-en/pages/Sector-Report.aspx (accessed on 12 May 2011).
  2. Class, N.K. Istanbul, the World’s Capital City. Available online: https://www.google.com/url?sa=t&rct=j&q=&esrc=s&source=web&cd=2&ved=0ahUKEwiFi-qrkZzMAhWG8ywKHfrzBywQFggkMAE&url=https%3a%2f%2fwww.classnk.or.jp%2fhp%2fpdf%2fpublications%2fPublications_image%2fclassnk_magazine_no60.pdf&usg=AFQjCNEXY5mIXM98ELvPRoP-6jUk3UyyVw&sig2=yh2k_Kt4-sfmBvkpDglgfw&bvm=bv.119745492,d.bGg&cad=rja (accessed on 1 March 2016).
  3. Ulusçu, Ö.S.; Özbaş, B.; Altıok, T.; İlhan, O.; Özhan, A.A. Risk Analysis of the Vessel Traffic in the Strait of Istanbul. Risk Anal. 2009, 29, 1454–1471. [Google Scholar] [CrossRef] [PubMed]
  4. ITOPF, the Independenta Accident. Available online: http://www.itopf.com/in-action/case-studies/case-study/independenta-boshporus-turkey-1979 (accessed on 1 March 2016).
  5. Graham, N.A.; Graham, A.K. Implementing and Enforcing Regional Environmental Policies in Comparative Perspective. Available online: http://ceres.isp.msu.edu/occasionalpapers/EnvironmentalChallengesPolicyREV.pdf (accessed on 1 March 2016).
  6. ITOPF, Recovery of Sunken Oil in the Sea of Marmara. Available online: http://www.itopf.com/fileadmin/data/Documents/Papers/recovery.pdf (accessed on 1 March 2016).
  7. Republic of Turkey Ministry of Transport. Maritime Affairs and Communications, Marine Causalities and Incident Statistics. Available online: http://aakkm.udhb.gov.tr/ (accessed on 14 November 2015).
  8. Kara, G. Evaluation of Turkish Straits Vessel Traffic Services (TSVTS) Applications in the Istanbul Strait. In Proceedings of the International Conference on Engineering and Natural Sciences, Skopje, Macedonia, 15–19 May 2015.
  9. Özçayır, O.Z. Port State Control; LLP Professional Publishing: London, UK, 2001. [Google Scholar]
  10. Knapp, S.; Franses, P.H. Comprehensive Review of the Maritime Safety Regimes. Econ. Inst. Res. Pap. 2007, 30, 241–270. [Google Scholar]
  11. Sılos, J.M.; Piniella, F.; Monedero, J.; Walliser, J. The Role of the Classification Societies in the Era of Globalization: A Case Study. Marit. Policy Manag. 2013, 40, 384–400. [Google Scholar] [CrossRef]
  12. Li, K.X.; Zheng, H. Enforcement of Law by the Port State Control (PSC). Marit. Policy Manag. 2008, 35, 61–71. [Google Scholar] [CrossRef]
  13. Cariou, P.; Mejia, M.Q., Jr.; Wolf, F.-C. An Econometric analysis of deficiencies noted in port state control inspections. Marit. Policy Manag. 2007, 34, 243–258. [Google Scholar] [CrossRef]
  14. Heij, C.; Bijwaard, G.E.; Knapp, S. Ship Inspections Strategies: Effects on maritime Safety and environmental protection. Transp. Res. D 2011, 16, 42–48. [Google Scholar] [CrossRef]
  15. Emecen Kara, E.G.; Okşaş, O. Evaluation of Maritime Safety in Istanbul Strait using Port State Control Inspections. In Proceedings of the International Conference on Engineering and Natural Sciences (ICENS), Skopje, Macedonia, 15 May–19 June 2015.
  16. Emecen, E.G.; Yıldız, M. Limanlarımızda Liman Devleti Kontrolü Uygulamaları. In Türkiye’nin Kıyı ve Deniz Alanları VI; Ulusal Konferans: Muğla, Turkey; 7–11 November 2006.
  17. Emecen, E.G.; Karaoğlu, M. Liman Devleti Kontrolü İncelemeleri ve Risk Değerlendirmesi. In Türkiye’nin Kıyı ve Deniz Alanları VIII; Ulusal Konferansı: Ankara, Turkey; 27–30 May 2008.
  18. Xu, R.-F.; Lu, Q.; Li, W.-J.; Li, K.X.; Zheng, H.-S. A Risk Assessment System for Improving Port State Control Inspection. In Proceedings of the Sixth International Conference on Machine Learning and Cybernetics, Hong Kong, 19–22 August 2007.
  19. Bang, H.-S.; Jang, D.-J. Recent Developments in Regional Memorandums of Understanding on Port State Control. Ocean Dev. Int. Law 2012, 43, 170–187. [Google Scholar] [CrossRef]
  20. Bang, H.-S. Is Port State Control an Effective Means to Combat Vessel-Source Pollution? An Empirical Survey of the Practical Exercise by Port States of Their Powers of Control. Int. J. Mar. Coast. Law 2008, 23, 715–759. [Google Scholar] [CrossRef]
  21. Payoyo, P.B. Implementation of International Conventions through Port State Control: An assessment. Mar. Policy 1994, 18, 379–392. [Google Scholar] [CrossRef]
  22. Cariou, P.; Mejia, M.Q., Jr.; Wolf, F.-C. On the Effectiveness of port state control inspections. Transp. Res. E 2008, 44, 491–503. [Google Scholar] [CrossRef]
  23. Knapp, S.; Franses, P.H. Econometric analysis to differentiate effects of various ship safety inspections. Mar. Policy 2008, 32, 653–662. [Google Scholar] [CrossRef]
  24. Li, K.X.; Wonham, J. Who is safe and who is at risk: A study of 20-years record on accident total loss in different flags. Marit. Policy Manag. 1999, 26, 137–144. [Google Scholar] [CrossRef]
  25. Alderton, T.; Winchester, N. Flag States and Safety: 1997–1999. Marit. Policy Manag. 2002, 29, 151–162. [Google Scholar] [CrossRef]
  26. Li, K.X. The safety and quality of open registers and a new approach for classifying risky ships. Transp. Res. E 1999, 35, 135–143. [Google Scholar] [CrossRef]
  27. Knapp, S.; Franses, P.H. Econometric analysis on the effect of port state control Inspection on the probability of casualty Can targeting of substandard ships for inspections be improved? Mar. Policy 2007, 31, 550–563. [Google Scholar] [CrossRef]
  28. Roberts, S.E.; Marlow, P.B. Causalities in dry bulk shipping (1963–1996). Mar. Policy 2002, 26, 437–450. [Google Scholar] [CrossRef]
  29. Piniella, F.; Rasero, J.C.; Aragones, J. Maritime Safety Control Instruments in the Era of The Globalization. J. Mar. Res. 2005, 2, 19–39. [Google Scholar]
  30. Degre, T. From Black-Grey-White Detention-based Lists of Flags to Black-Grey-White Casualty-based Lists of Catogories of Vessel. J. Navig. 2008, 61, 485–497. [Google Scholar] [CrossRef]
  31. Aydoğdu, V.; Park, J.-S.; Keçeli, Y.; Park, Y.-S. Analysis of Marine Traffic Feature for Safety Assessment at Southern Entrance of the Istanbul Strait-I. J. Korean Navig. Port Res. 2008, 32, 521–527. [Google Scholar] [CrossRef]
  32. Arslan, Ö.; Turan, O. Analytical Investigation of Marine Causalities at the Strait of Istanbul with SWOT-AHP method. Marit. Policy Manag. 2009, 36, 131–145. [Google Scholar] [CrossRef] [Green Version]
  33. Or, I.; Kahraman, I. A Simulation study of the accident risk in the Istanbul Channel. Int. J. Emerg. Manag. 2002, 1, 110–124. [Google Scholar] [CrossRef]
  34. Republic of Turkey Ministry of Transport. Maritime Affairs and Communications, Ship Passing Statistics. Available online: http://atlantis.udhb.gov.tr/ (accessed on 14 November 2015).
  35. Tokyo MOU. Available online: http://www.tokyo-mou.org/ (accessed on 3 January 2016).
  36. Paris MOU. Available online: https://www.parismou.org/files/ (accessed on 27 October 2015).
  37. Black Sea MOU. Available online: http://www.bsmou.org/about/ (accessed on 11 November 2015).
  38. Paris MOU. Explanatory Note-White, Gray and Black List. Available online: https://www.parismou.org/files/Explanatory%20Notes%20Annual_0.pdf (accessed on 27 October 2015).
  39. Black Sea MOU. Annual Reports. Available online: http://www.bsmou.org/ (accessed on 5 October 2015).
Figure 1. Top 16 flags with respect to the total number of ships passing (2005–2014).
Sustainability 08 00390 g001
Figure 2. Relations between the number of inspections and detentions [38].
Sustainability 08 00390 g002
Figure 3. Major deficiencies as a percent of total deficiencies (2012–2014).
Sustainability 08 00390 g003
Figure 4. The change of excess factor of black-listed flag states from 2006 to 2014.
Sustainability 08 00390 g004
Figure 5. The change of excess factor of grey-listed flag states from 2006 to 2014.
Sustainability 08 00390 g005
Table 1. Number of ships passing through the Istanbul Strait between 2005 and 2014 [34].
Years2005200620072008200920102011201220132014
Number of Ships54,79454,88056,60654,39651,42250,87149,79848,32946,53245,529
Table 2. Flag state risk criteria and risk level.
ParameterCriteriaWeighting Points
DetentionsBlack-Grey-White List ( B G W   l i s t ) Black-VHR 1, HR 2, M to HR 33
Black-MR 42
Grey-M to LR 51
White0
DeficienciesDeficiency Index Level ( D I L ) HR1
LR 60
Number of Casualties Casualty Index Level ( C I L ) VHR2
HR1
LR0
Number of Passing ShipsPassing Index Level ( P I L )HR, VHR2
MR, M to HR1
LR0
1 VHR-Very High Risk; 2 HR-High Risk; 3 M to HR-Medium to High Risk; 4 MR-Medium Risk; 5 M to LR-Medium to Low Risk; 6 LR-Low Risk.
Table 3. Number of inspections, percent of deficiencies and detention (2005–2014) [39].
Years2005200620072008200920102011201220132014
Number of Inspections5069465844995161480549294657460750805092
Deficiencies Percentage (%)62.9369.3972.4267.8966.9364.7467.7765.1665.0859.92
Detention Rate (%)6.235.568.166.375.795.805.354.673.622.97
Table 4. The Black Sea MOU BGW list (2012–2014).
Black ListFlagInspectionsDetentions u b l a c k t o g r e y u g r e y t o w h i t e Excess Factor
Tanzania2694626.21 3.16
Georgia3375.22 2.27
Moldova6087153.41 1.88
Togo2472624.39 1.19
Grey ListFlagInspectionsDetentions u b l a c k t o g r e y u g r e y t o w h i t e Excess Factor
Cambodia4844143.6124.150.87
Comoros2462224.3010.140.84
Sierra Leone2561925.1410.700.57
Ukraine1881319.416.910.49
Cook Islands2201522.138.670.47
Vanuatu4836.77−0.050.45
Barbados3315.000.000.27
Lebanon5016.970.030.14
Denmark5317.270.150.12
Saint Kitts and Nevis208921.118.010.08
Saint Vincent and The Grenadines2691226.2111.450.04
Isle of Man 6618.530.710.04
White ListFlagInspectionsDetentions u b l a c k t o g r e y u g r e y t o w h i t e Excess Factor
Gibraltar731 1.02−0.02
United Kingdom831 1.49−0.29
Belize41816 20.18−0.39
Bulgaria640 1.00−0.52
Norway640 0.62−0.52
China680 1.00−0.62
Panama171368 102.04−0.72
Bahamas3208 14.39−0.81
Turkey141347 82.63−0.92
Antigua and Barbuda3979 18.93−1.00
Russia96324 53.89−1.16
Netherlands2393 9.74−1.20
Marshall Islands81815 44.76−1.38
Liberia105519 59.72−1.45
Cyprus1530 5.02−1.55
Malta174327 103.99−1.62
Italy2861 12.42−1.72
Singapore2620 11.05−1.88
Greece3871 18.33−1.88
Hong Kong4191 20.24−1.92
Table 5. Deficiency index and index level for 1012–2014.
FlagDeficiency IndexDeficiency Index LevelFlagDeficiency IndexDeficiency Index LevelFlagDeficiency IndexDeficiency Index Level
Algeria1.001.58Curacao0.741.17Malta0.500.79
Togo0.971.53Russia0.721.13Liberia0.490.77
Cambodia0.951.49Denmark0.701.10India0.480.76
Comoros0.931.48Switzerland0.701.10Italy0.470.75
Tanzania0.931.47Egypt0.681.07Singapore0.470.74
Sierra Leone0.921.46Turkey0.681.07Marshall Islands0.470.74
Moldova0.921.45Panama0.641.00Belgium0.460.73
Syria0.921.45Antigua and Barbuda0.610.97Cyprus0.460.72
Dominica0.911.44Jamaica0.600.95Netherlands0.450.71
Georgia0.881.39Luxembourg0.600.95Portugal0.420.66
Bangladesh0.881.38Thailand0.600.95Ireland0.400.63
Kiribati0.881.38Bulgaria0.590.94Hong Kong0.380.61
Lebanon0.861.36Philippines0.590.93Isle of Man0.380.60
St. Kitts and Nevis0.841.32Lithuania0.580.92Norway0.340.54
St. Vincent and The Grenadines0.831.31Gibraltar0.580.91Bolivia0.330.53
Tuvalu0.831.31Korea of Republic0.570.90Poland0.330.53
Belize0.821.30Libya0.560.89Croatia0.310.49
Barbados0.821.29France0.530.84Greece0.260.42
Cook Islands0.821.29Bahamas0.520.81China0.180.28
Honduras0.801.26United Kingdom0.510.80Bermuda0.170.26
Vanuatu0.771.22Germany0.500.79Cayman Islands0.110.18
Ukraine0.751.18
Table 6. Casualty rate and index for 2012–2014.
FlagCasualty RateCasualty Index Level
Sierra Leone0.001193.54613
United Kingdom0.001143.3982
Cambodia0.001043.1005
Hong Kong0.000952.85157
Togo0.000942.81662
Moldova0.000822.44337
Tanzania0.000802.39153
Belize0.000491.47653
Bahamas0.000491.46638
Netherlands0.000481.4465
Turkey0.000471.39566
St. Vincent and The Grenadines0.000431.27541
Comoros0.000421.25769
Liberia0.000391.16046
Italy0.000371.10426
Panama0.000170.5027
Malta0.000060.17972
Table 7. Passing rate and passing index level per flag for 2012–2014.
FlagPassing RatePassing Index LevelFlagPassing RatePassing Index Level
Turkey0.21346.08Tanzania0.01780.51
Malta0.11843.37Comoros0.01690.48
Panama0.08462.41St. Vincent and The Grenadines0.01670.48
Russia0.06941.98Togo0.01510.43
Lıberia0.05501.57Singapore0.01500.43
Marshall Islands0.03911.11Hong Kong0.01490.43
Moldova0.03480.99Netherlands0.01470.42
Cambodia0.03430.98Bahamas0.01450.41
Belıze0.02880.82Saint Kitts and Nevis0.01440.41
Antıgua and Barbuda0.02310.66Cook Islands0.01260.36
Ukraine0.02050.58Cyprus0.00640.18
Greece0.01930.55United Kingdom0.00630.18
Italy0.01930.55Gibraltar0.00500.14
Sierra Leone0.01800.51
Table 8. Risk level of each flag state passing through the Istanbul Strait 2012–2014.
High Risk LevelStandard Risk Level
FlagTotal PointFlagTotal PointFlagTotal Point
Tanzania6Comoros3Algeria1
Moldova *5St. Vincent & The Grenadines3Bahamas1
Togo5Barbados2Bangladesh1
Cambodia4Belize2Dominica1
Georgia4Cook Islands2Egypt1
Sierra Leone4Denmark2Honduras1
Turkey4Hong Kong2Isle Of Man1
Lebanon2Italy1
Liberia2Kiribati1
Malta2Netherlands1
Panama2Switzerland1
Russia2Syria1
St. Kitts and Nevis2Tuvalu1
Ukraine2Curacao1
United Kingdom2Marshall Islands1
Vanuatu2
* Italics denotes FOCs.
Table 9. Low-risk leveled flag states passing through the Istanbul Strait 2012–2014.
Low Risk Flag States
Antigua & BarbudaPhilippinesMongolia
GreeceFranceQatar
SingaporeGermanyTunisia
CyprusBermudaAlbania
GibraltarIndiaVietnam
BulgariaKorea of RepublicIsrael
NorwayBoliviaAzerbaijan
ChinaLuxembourgEstonia
Netherlands AntillesThailandPakistan
LithuaniaLibyaSweden
PortugalUSAFinland
CroatiaIrish RepublicPoland
Cayman IslandsRomaniaSpain
PalauEthiopiaLatvia
BelgiumJamaica1 Others
1 Others: Flags having the total number of ships passing less than 10.

