Article

A Study on Location-Based Priority of Soil and Groundwater Pollution Remediation

1
Department of Natural Resources, Chinese Culture University, Taipei 11114, Taiwan
2
Department of Leisure and Recreation Administration, Ming Chuan University, Taipei 33348, Taiwan
3
Department of Land Economics, National Chengchi University, Taipei 11605, Taiwan
*
Author to whom correspondence should be addressed.
Sustainability 2016, 8(4), 377; https://doi.org/10.3390/su8040377
Submission received: 19 February 2016 / Revised: 11 April 2016 / Accepted: 11 April 2016 / Published: 18 April 2016
(This article belongs to the Section Sustainable Urban and Rural Development)

Abstract

:
Under the circumstances of limited government funds, the future pollution remediation policies and practical implementation may need contemplation from the perspective of maximized efficacy, in order to pursue the most effective resource allocation. In fact, different pollution sources and types affect the value of surrounding properties differently in significance and scope. Therefore, benefits from the remediation may vary depending on the polluted locations. Currently, however, decision-making on the location-based priority of pollution remediation still seems to be in need of a clear index system to evaluate the post-remediation benefits. Therefore, this article discusses the use of the fuzzy Delphi method to determine factors of the location-based priority of soil and groundwater pollution remediation and an analytic network process to determine the weights of each factor. The empirical results show that the top 3 priority indicators are resident population, land value and natural resources. Hopefully, this finding can be used in future decision-making on the priority of pollution remediation to maximize the effect of limited funds.

1. Introduction

Soil and groundwater pollution not only affect the normal usage of the land site, but also may bring in negative impacts on the surrounding environment, for example, health hazards through diets, drinking water and direct contact; the generated stench and dirtiness that sabotage the quality of the living environment; reduced agricultural plantation and growth; restricted land use and development that diminish the property values, and neighborhoods that suffer reduced property values due to the external health risk in the surrounding area. Moreover, the reduced real estate values can further decrease the local property-related tax revenues, which will correspondingly confine the local financial expenses and thus affect the quality of local public services. It is worth mentioning that water and land pollution is closely related; the water footprint includes “blue water”, a measure of the consumptive use of blue water resources; “green water”, the relevant consumption of green water resources (rainwater stored in the soil as soil moisture); and “gray water”, defined as the volume of freshwater that is required to assimilate the load of pollutants given the existing ambient water quality standards [1,2,3]. This is helpful for us to know the impact of groundwater and soil remediation.
To avoid pollution-related health hazards and land usability damage, countries all over the world are endeavoring to develop and apply pollution remediation technologies. Based on the concept of sustainability, pollution remediation uses technologies of elimination, destroying and suppression to lower the risk of environmental hazards, in attempts to recover the original quality of the living environment around the polluted land and fulfill the goal of urban redevelopment, and this is the background of the rise of brownfield redevelopment.
When it comes to numerous polluted locations, how to decide the location priority for remediation? Currently, practical measures seem to lack an assessment standard. Taiwan has 2763 lightly polluted sites and 73 heavily polluted sites, scattered all around, some of which are in the urban commercial centers while others are in suburban farmland. These locations have quite different environmental conditions. With limited funds, it is apparently impossible to remediate all of the polluted locations at once and get them totally cleaned up. But then, which polluted sites should have higher remediation priority for best performance? Unfortunately, there is no relevant literature on this discussion.
When pollution is under control or remedied, it is basically possible to recover the original non-polluted state. The post-remediation benefits may extend beyond the polluted land per se, all the way to the surrounding area, and the benefits will be manifested in the improved health, environment, farming, water quality and property values. In other words, aside from the site itself, the elements of pollution or remediation to be considered should also include the neighborhood development and environmental conditions, so as to better grasp the pollution damage and post-remediation effect.
The impact of pollution sites on surrounding areas has location variance. The significance and scope of a polluted site’s impact on the neighborhood property values are closely related to the surrounding urban development and established environment. Discussions in this article are based on limited resources for maximized benefits, and therefore a multi-criteria evaluation method is used to construct an index structure for location-based priority of soil and groundwater pollution remediation. Hopefully, the result can be referenced in future decisions on location-based remediation priority.

2. Literature Review and Theories Discussion

Pollution not only affects the land use of the site, but also drags down the neighborhood land use and property values. Pollution is a classic negative externality, and pollution affects off-site users, and its effects on others are not included in the producers’ price functions [4]. In addition, there is the so-called “proximity stigma,” where property that is close to a source of contamination is not actually contaminated [4,5,6]. Therefore, contaminated soil and groundwater has been the subject of study and research, so that the field of remediation has grown and evolved, continually developing and adopting new technologies in attempts to improve the decontamination [7]. Decisions on remediation are one of the most difficult management issues of municipal and national agencies, since contaminated soil and groundwater have been the subject of great attention in the latest decade, while much assessment and clean-up work have been carried out [8,9].
Remediation is mainly to reduce the negative impact on humans and the environment. Remediation technologies serve to immobilize contaminants, separate them from the soil, or destroy them. Some technologies accomplish two or more of these functions, depending on the type of contaminants present [7]. The social benefits of environmental remediation policies include improved human health and ecological environment, increased agricultural productivity, reduced materials damage, and enhanced landscape aesthetics [10]. The empirical results from Jackson [11] reveal that there are statistically significant impacts on property values in the period before and during remediation, but that these effects dissipate subsequent to cleanup. Remediation benefits mainly come from improved environmental quality, which brings in direct and indirect benefits, or market benefits and non-market benefits, including land value changes, water quality changes, agricultural benefits, health benefits, natural resources and environment benefits [12], and in particular, the recovery of property values of the contaminated land and its neighborhood, increased government tax revenues, and derived industrial activities and employment opportunities [13].
Remediation also results in other effects, of which some are positive and some are negative [14]. The remediation objectives affect the choice and budget of the technologies used. Different technologies are applied depending on the contamination types, and the choice of technologies affects the time and money required for the remediation [15]. Therefore, remediation needs to consider both the cost and benefits, and the latter should be maximized.
In a correlation between the cost and benefits, the contaminated land can be divided into voluntary-remediation land, marginal voluntary remediation land and remediation abandoned land [13].
(1)
The voluntary remediation land has higher benefits and cost, where the contamination is lighter and the location is better with a higher property value, and therefore the polluters or relevant persons are willing to do voluntary remediation.
(2)
The marginal voluntary land has benefits less than or equal to the cost, where the contamination is heavier and the location is not as good with a lower property value, and therefore the polluters or relevant persons are less willing to do voluntary remediation due to a higher financial burden.
(3)
The remediation-abandoned land has benefits much lower than the cost, where the contamination is even heavier and the location condition is poor with low property values, and therefore the polluters or relevant persons are hardly willing to do voluntary remediation.
The result from a questionnaire interview by Lin and Qiu [16] reveals that most of the interviewees tend to actively utilize remedied land, and if the land is suitable for its original usage, basically they will continue the original use, and only when the original use is not valuable or not appropriate will they change the use. Currently, there are quite a few idle contaminated sites, probably due to insignificant post-remediation benefits. This may result from the situation where the polluters or the public agencies are still targeting the remediation itself, without taking into consideration the creation of land value and urban redevelopment. Empirical results identify that not all real estate markets reflect the contamination cost. The commercial and industrial property markets are quickly adjusting to include the additional cost of contamination in the value of property, but the residential property market ignores the cost [17]. In other words, the contamination site does have location variance on benefits or impact.
There are a few studies on remediation site prioritization. In selecting which sites to fund, public agencies must prioritize the cleanup of some sites over others. When faced with such prioritization choices, agencies invariably must confront issues of social and environmental justice [18]. There is less research considering: why are some sites more likely to be remediated than others? Despite the public agency proclamation of “the worst sites first”, the researchers find undergoing remediation projects are mostly implemented on relatively easy sites [19]. They also find that brownfield sites are more likely to be located in both poor and predominantly minority communities, but while sites located in poor communities tend to be cleaned up relatively quickly, sites located in communities with larger minority populations tend to be cleaned up more slowly [18]. This explains the current situation of the lack of an index system for location-based prioritization of remediation. With inadequate literature to build such a prioritization index system, the job is done randomly based on the site conditions.
Environmental remediation involves a wide range of stakeholders with possibly conflicting perspectives and objectives [20]. The present study makes an innovative contribution by classifying a large number of sustainability considerations and establishing structural relationships among stakeholder influence, institutional forces, and sustainable practices [21]. Decision support tools (DST) such as multi-criteria decision analysis (MCDA) have been recognized to play a vital and challenging role in the remediation of contaminated sites [22,23,24,25]. MCDA is an activity that helps making decisions mainly in terms of choosing, ranking or sorting the actions, and the primary goal of research in MCDA is to develop tools to help people to make more reasonable decisions [26]. Moreover, many studies combine two or more different methods. For instance, the fuzzy set theory deals with uncertainty due to imprecision and vagueness [27]; therefore, the MCDM method has been developed for prioritizing the strategies; the fuzzy theory was used as a bridge to link the linguistic variables and crisp numbers by membership functions of the linguistic variables, such as fuzzy AHP [28], fuzzy ANP [29,30]. Another example is AHP and VIKOR combined [31] to solve a discrete decision making problem with non-commensurable (different units) and conflicting criteria [32]. However, there is no vagueness or conflict in our selected criteria; therefore, this paper proposes the use of the Analytic Network Process (ANP) as an MCDA tool to determine the location-based priority of soil and groundwater pollution remediation.
Literature on soil and groundwater pollution remediation factors is listed in Table 1 below. Most of these papers are from the remediation costs considerations, such as cleanup costs [19], capital cost [33,34,35], technical assistance grant, implementability [25], or conditions of contaminated land itself, such as the hazardous ranking score [19], land value [13], future usage [13], but this paper is focused mainly on the benefits within a certain range of the surrounding area resulting from remediation. Therefore, we refer to the location-based priority of soil and groundwater pollution remediation. Besides, Rosén, et al. [36] used the SCORE method in evaluating the sustainability of remediation, based on the social, economic and environmental aspects. These three constructs are referenced in this article to build an index system.

3. Research Methods

Location-based priority decisions on soil and groundwater pollution remediation seemed to lack a solid evaluation index system in the past. Basically, such a decision should be made using a multi-criteria assessment, taking into consideration numerous aspects and factors. Therefore, this article discusses the use of the Fuzzy Delphi Method (FDM) and Analytic Network Process (ANP) for empirical analysis.

3.1. Questionnaire Design and Studied Objects

To build a location-based priority index system for soil and groundwater pollution remediation, this research takes a questionnaire approach. The structure of the questionnaire is built first, followed by setting the research requirements for the design. The questionnaire has two stages. The first stage includes the FDM questionnaire. After collection and compilation, the expert opinions are screened based on the importance of individual indicators. The dependency among the indicators is then identified. The screening result and interdependency of the indicators are then taken for designing the second-stage ANP questionnaire, through which the weights of the criterion constructs are determined.
Academics and professionals with expertise in pollution remediation and benefit evaluation are invited as decision makers to provide opinions and suggestions. This group has 10 members, including 2 land economy experts, 4 urban planning experts, 2 land value appraisers, 1 real estate analyst, and 1 land resources expert. Based on their individual expertise, they evaluate the importance of each indicator to the location-based prioritization of pollution remediation. The evaluation comes with a grading ranging from 0 to 10; a higher grade indicates greater important.

3.2. Fuzzy Delphi Method, FDM

Because the external benefits from pollution remediation can be complex, the FDM is used to assure effective questionnaire interviews and integrate expert opinions, so that the fuzziness and uncertainty are minimized in building the index system. The FDM originates from the traditional Delphi method, which is a procedural methodology to systematically express consensus of a group of experts [37], and it is more efficient in reaching expert consensus [38] through fuzzy sets [30,39]. The proposed procedure is as follows:

3.2.1. Collect All Possible Impact Factors

According to the relevant literature of the pollution remediation benefits, we collect all possible impact factors.

3.2.2. Collect Estimated Score of Each Factor from Each Expert

The score is denoted as S i by M   experts; S i = ( C k i , O k i   ) , i = 1 ,   2 , , M . C k i is the lowest of the M th expert to the i th factor, and O k i is the highest of the M th expert to the i th factor. Both C k i and O k i have a range from 1 to 10.

3.2.3. Calculate the Extreme Values of C k i and O k i for Each Factor

A group average is calculated for both C k i and O k i , calculate the Minimum ( C L i ; O L i ), the Geometric Mean ( C M i ; O M i ) and the Maximum ( C U i ; O U i ) Values of Each Factor.

3.2.4. Establish the Triangular Fuzzy Numbers

The most conservative cognition value of triangular fuzzy numbers (TFNs) is C i = ( C L i , C M i , C U i ) . The TFNs representing the pessimistic, moderate and optimistic estimate are used to represent the opinions of experts for each activity time. The most optimistic cognition value is O i = ( O L i , O M i , O U i ) . The overlap section of the two triangular fuzzy numbers is called the gray zone.

3.2.5. Inspect the Consensus among Experts’ Opinions

The gray zone of each factor is used to calculate the “important degree of consensus” ( G i ). If there is no overlap between two TFNs, this indicates that consensus among the experts’ opinions, and G i = C M i + O M i 2 . If there is overlap between two TFNs, we need to compare the Z i   a n d   M i , where Z i = C U i O L i and M i = O M i C M i , G i is calculated by Equations (1) and (2):
F i ( x j ) = { X   { min   [ C i ( x j ) , O i ( x j ) ] } d x } ,   j U
G i = { x j max   μ F i ( x j ) } ,   j U

3.2.6. Screen out the Critical Factors

Finally, the critical factors can be screened out from numerous factors by setting the threshold value α . In general, the threshold value is determined subjectively by decision makers.

3.3. Analytic Network Process, ANP

The Analytic Hierarchic Process (AHP) and the Analytic Network Process (ANP) are two methods proposed by Saaty [40,41,42,43]. AHP is conceptually easy to use; however, its strict hierarchical structure cannot address the complexities of many real world problems [44] due to interdependence between criteria and alternatives.
ANP is a relatively more generalized approach of AHP to handle such complexities of the decision environment [25,45,46]. Saaty (1996) suggested the use of AHP to solve the problem of independence on alternatives or criteria, and the use of ANP to solve the problem of dependence among alternatives or criteria [41]. The major difference between AHP and ANP is that ANP is capable of handling interrelationships between the decision levels and attributes by obtaining the composite weights through the development of a “supermatrix” [47].
This article discusses the use of ANP to evaluate the weights of indicators for location-based priority of pollution remediation. It is almost impossible to use hierarchy alone to express the internal complexity of the evaluation factors, i.e., the decision factors in the hierarchy may depend on each other and self-feedback in the networked relationship. Therefore, the ANP is required for the indexing job. Its analysis procedure makes reference to the approach adopted by Saaty [43], explained as follows.

3.3.1. Calculation of Relative Weights between the Hierarchical Layers, and Establishment of Paired Comparison Matrices of Each Hierarchical Layer

First, a network hierarchical structure is established for the evaluation of location-based prioritization factors. Then, the mutual affection between groups is identified, called the external dependency. The mutual affection between the criteria within the groups is also identified, called the internal dependency. Based on the dependencies, the evaluation framework of the hierarchical layers is drawn. The ANP method allows these dependencies, also called feedbacks, to be modeled; they are closer to reality and, as a result, yield more accurate results [46].

3.3.2. Calculation of Eigenvalues and Eigenvectors of the Paired Comparison Matrices

Based on the differences in problem identification by individual decision makers, the expert preferences are integrated. Then, the ANP nine-point rating scale along with the paired comparison matrices are used to calculate eigenvalues and eigenvectors between the indicators under each construct.

3.3.3. Consistency Test

This test is to determine whether the decision makers are consistent in performing the paired comparison. Divide the Consistency Index (C.I.) by Random Inconsistency (R.I.) to get the Consistency Ratio (C.R.), to check whether paired comparison matrices constructed with decision makers’ responses are consistent.

3.3.4. Limiting Supermatrix to Obtain the Weight

The supermatrix is an aggregation of all the eigenvectors’ sub-matrices [41]. If there are blanks or 0 values in the super matrix mean the decision-making groups or criteria are independent of each other. The results obtained in order are the unweighted supermatrix, weighted supermatrix and limit supermatrix.

3.3.5. Sorting of Criteria and Solutions

After continuous paired comparison, use the unweighted supermatrix to observe the original weight of each criterion. Then, multiply the unweighted supermatrix’s criterion weight by the related construct’s weight so that adding the values of each row yields a value of 1, and then multiply the supermatrix by itself until the values of each row become consistent. At this point, the supermatrix is approaching stability, and finally each criterion’s final relative priority is obtained. Use the limit supermatrix algorithm to get the sequence of the indicators, which is then used as the basis for indicator evaluation and decision making.

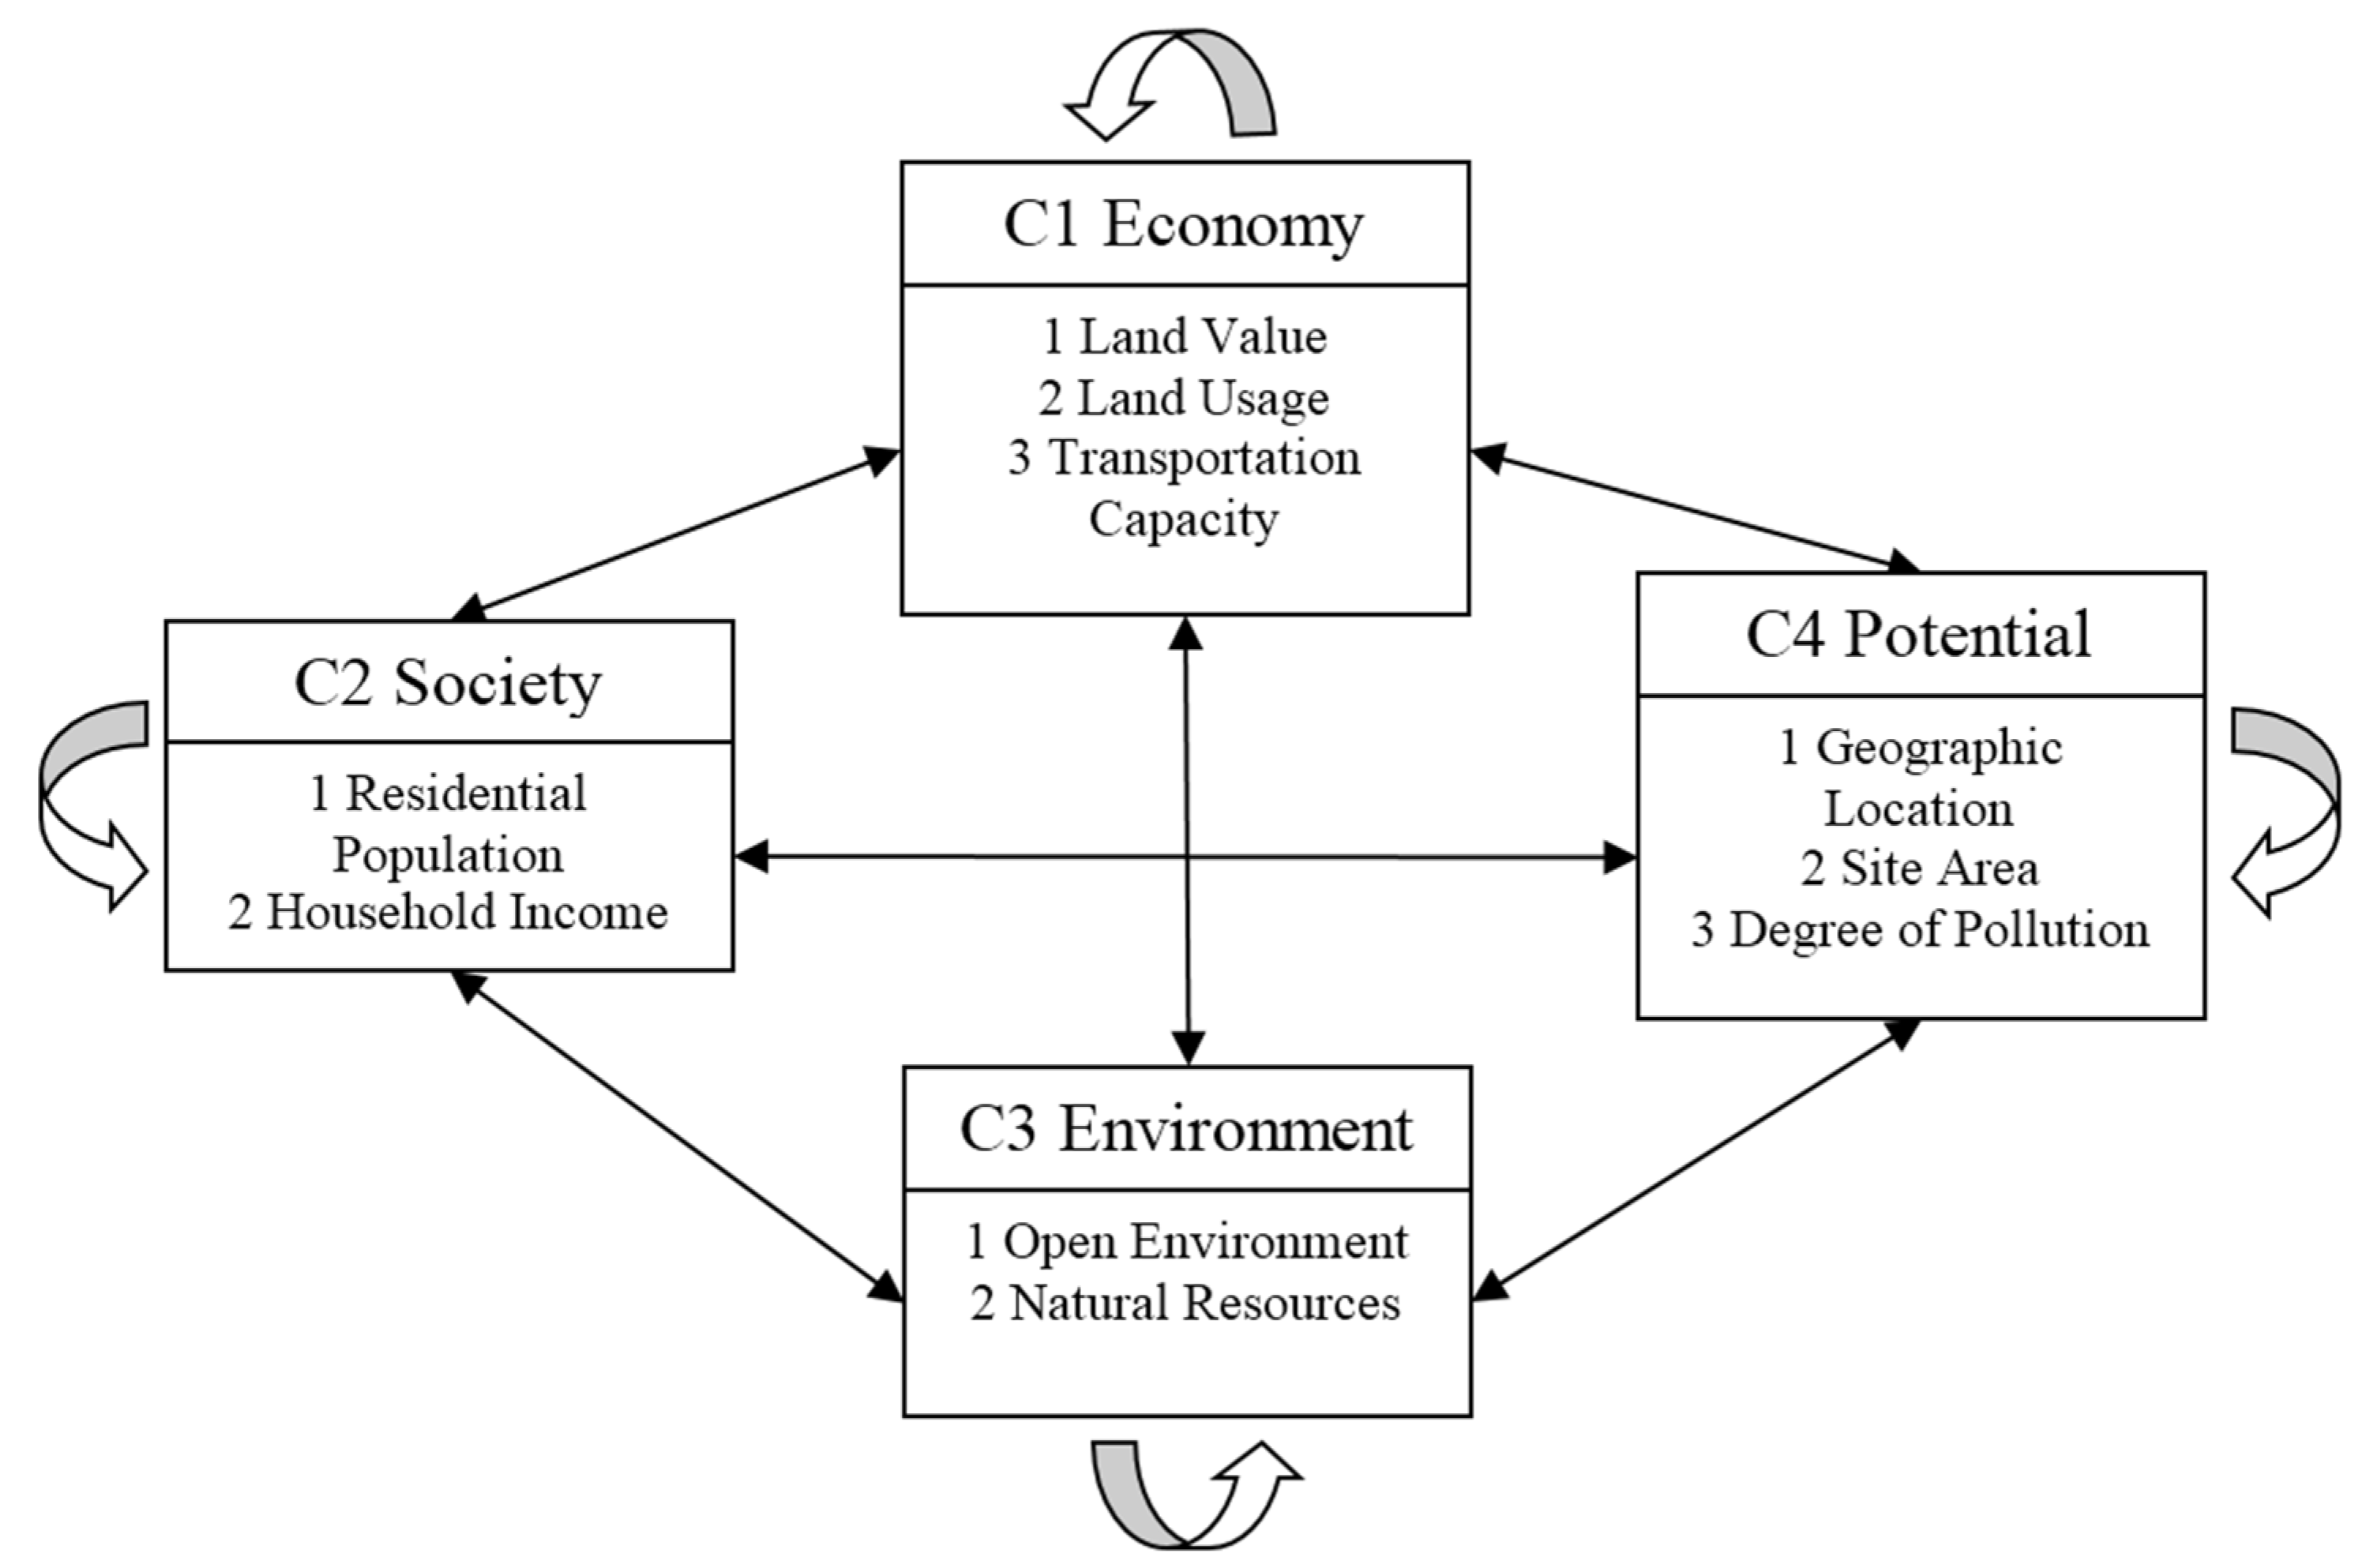
4. Empirical Results and Analysis

Take the indicators compiled from the above relevant literature for the FDM screening, with specific quantification considered, to build the location-based priority index system, and then use the ANP to evaluate the weights of the indicators and determine the indicators’ applicability importance. In the process, we do not need to request experts repeatedly to revise their opinions through the FDM method, but the ANP method allows the decision makers to be easily confused with respect to the pairwise comparison and they need to spend more time thinking, so the follow-up studies should simplify the questionnaire design.

4.1. Determination of Evaluating Criteria by FDM

With reference to relevant literature, this research uses a range of a 0.5-mile radius around the pollution site as the impact scope to screen quantifiable items and initially establish a location-based index system for priority of soil and groundwater pollution remediation. Then, based on a Fuzzy Delphi questionnaire and benchmarked with specific quantification, this program is executed by academics and experts to evaluate the index structure and screen the indicators. In this research, we subjectively set 8.35 as the threshold value. The results are shown in Table 2, and the indicators shaded in gray are selected. At the same time, some attributes are induced and named. Finally, an index system with four constructs and ten indicators is established.

4.2. Construction of Evaluation Model by ANP

Based on the evaluation index system generated from the FDM and the subsequent internal dependency survey, the ANP is used to calculate the weights of the indicators for the location-based priority of pollution remediation. With the result, key factors for the location-based benefits are identified, which can be used as a reference for future decision on pollution remediation priority. Therefore, the index structure is presented in a questionnaire form for decision makers to perform paired comparison, and then the Super Decisions software is used for analysis. The ANP model for location-based index for priority of soil and groundwater pollution remediation is shown in Figure 1 below.

4.3. ANP Model Paired Comparison Matrices and Consistency Test

From the consistency test, it follows that our allowable consistency ratio should not exceed about .10 for a matrix larger than 5 by 5, 8% for a 4 by 4 matrix and 5% for a 3 by 3 matrix [43]. For the questionnaire, any question with a consistency ratio greater than 0.1 needs to be modified by the experts, and therefore the questionnaire qualifies for the consistency test.

4.4. ANP Formation and Analysis of ANP Supermatrix

With the supermatrix deduced, as shown in Table 3, the priority weights of the index system are determined, as shown in Table 4. The decision makers with expertise in urban planning and land economy focus more on social and environmental indicators; natural resources experts more on environmental indicators; real estate experts more on economic indicators. They give their focused indicators more weights. Therefore, we recommend emphasizing the plan target decision at the time of consultation.
The above indicator weights are combined with the constructs and summarized in Table 5.

4.4.1. Order of Importance of the Constructs

Based on the weight analysis result, the importance of the four constructs of the location-based index for soil and groundwater pollution remediation is sorted in sequence order. The sequence of weighted importance is economic (31.80%), social (24.12%), environmental (22.36%) and potential (21.72%). The evaluation result shows that all the constructs have similar importance, i.e., the four constructs established in this research are all important.

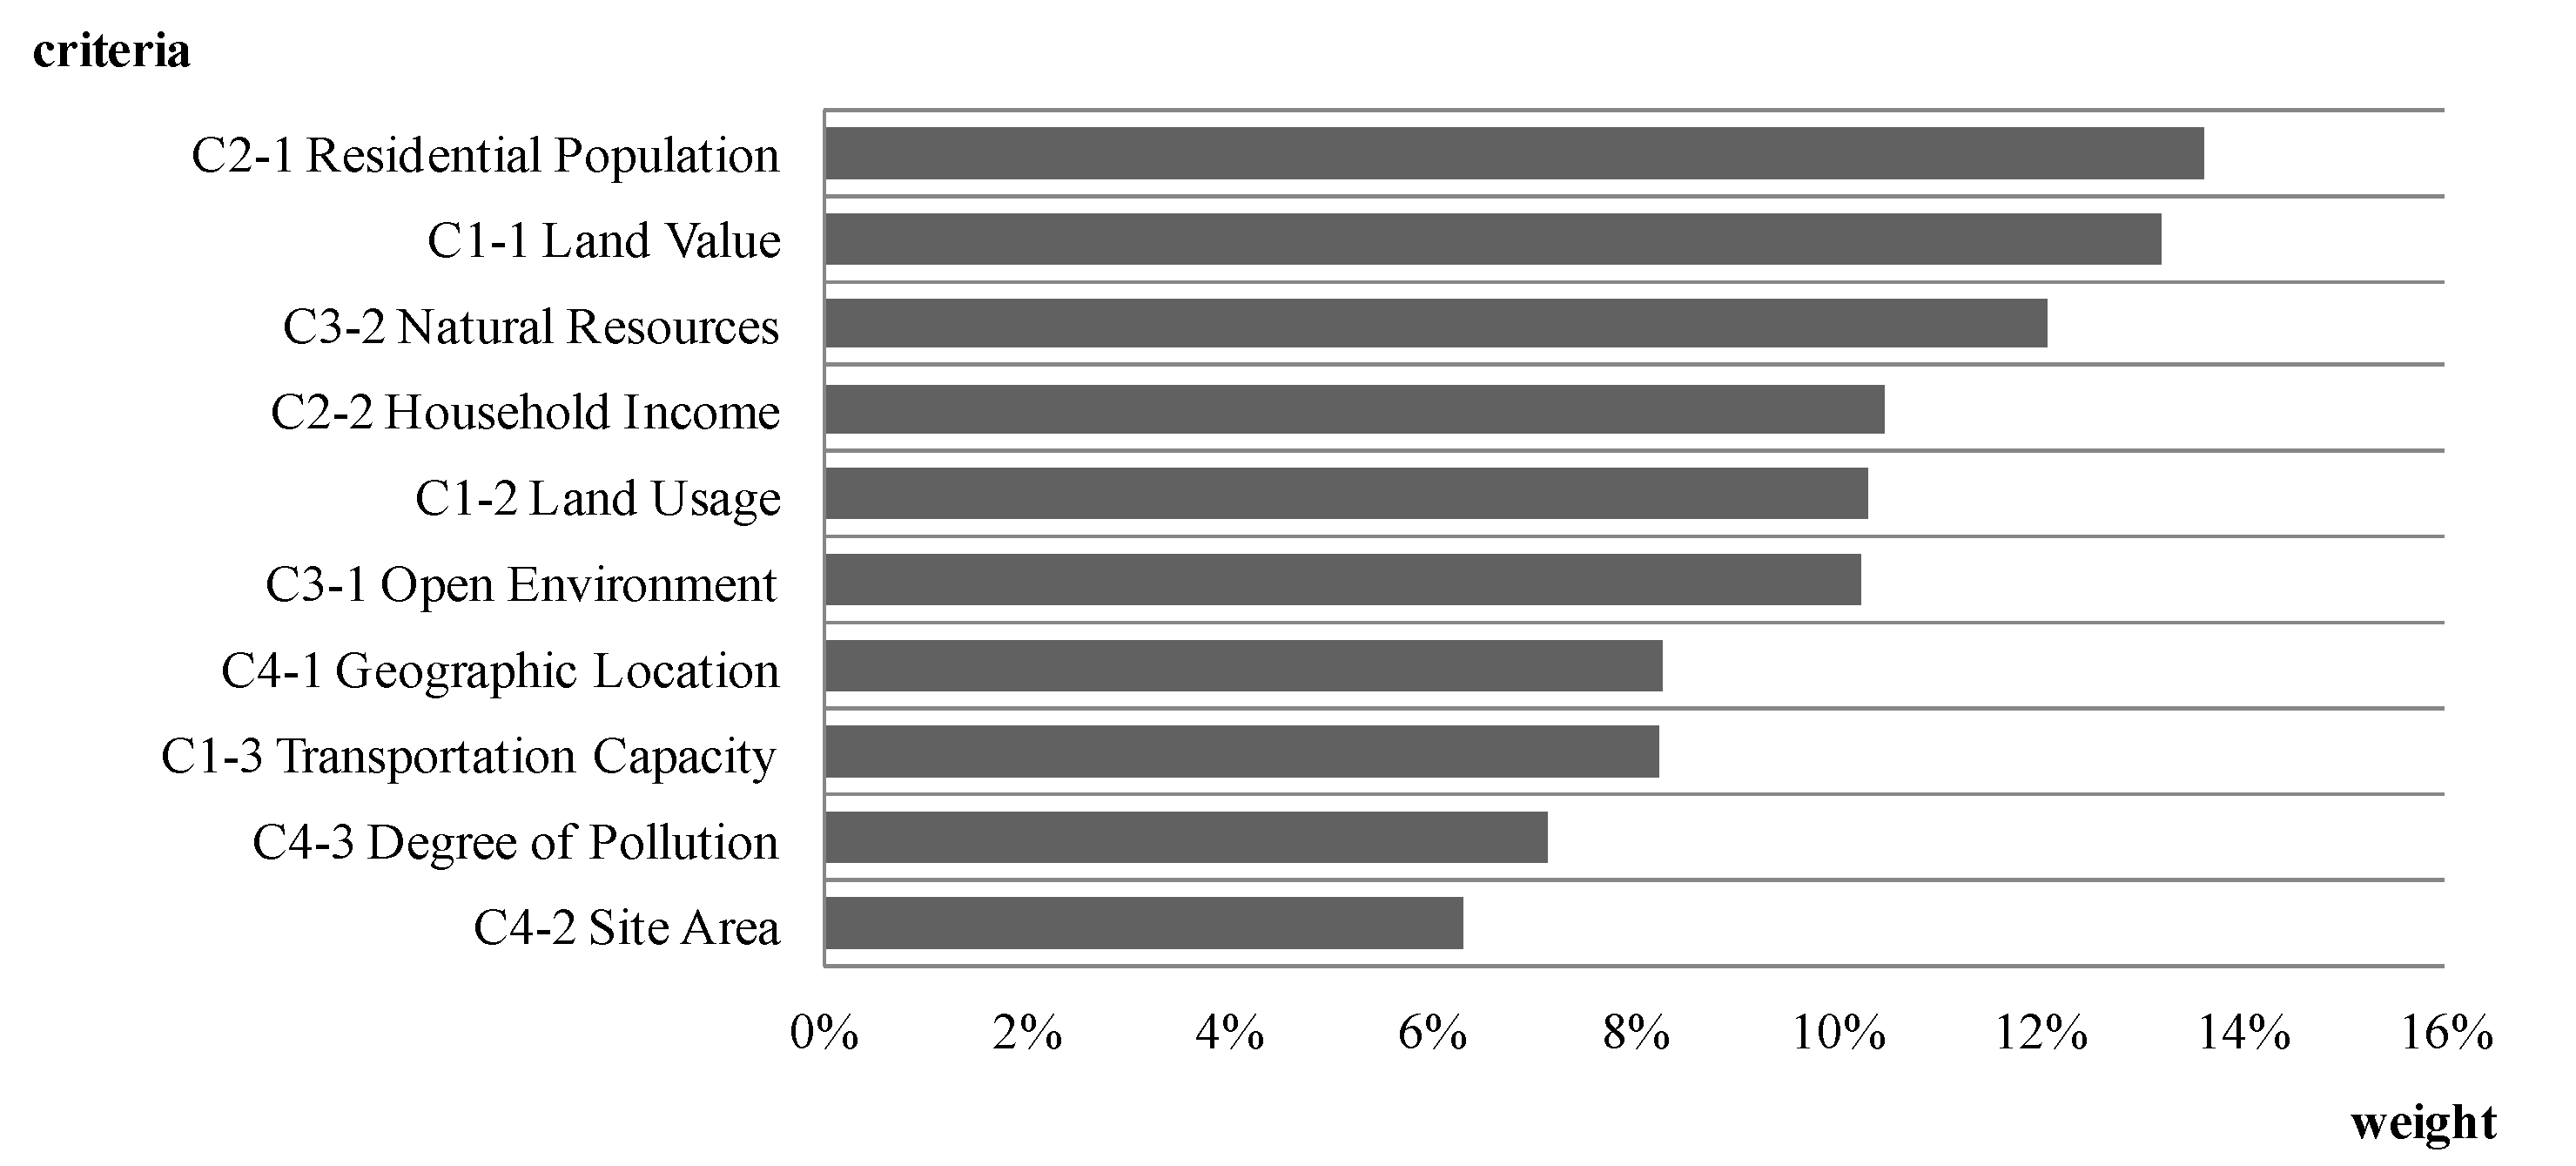
4.4.2. Order of the Criteria Importance

The evaluation indicators’ overall weights are identified and ordered in sequence, as shown in Figure 2. The most important indicators in sequence of order are residential population (13.64%), land value (13.23%) and natural resources (12.10%); while the three least important indicators are pollution site (6.31%), degree of pollution (7.14%) and transportation capacity (8.25%). The analysis result shows that in the selection of pollution remediation locations, based on maximized benefits, the residential population, land value and natural resources within the periphery of a half-mile radius of the contaminated site should be given a higher priority for survey and evaluation. When a contaminated site has high values of these three quantified indicators, it deserves a high priority of pollution remediation for best benefits. In addition, the referenced literature suggests that the location priority should take into account social justice. The empirical results of this research are in line with such a suggestion, i.e., taking the social-aspect peripheral residential population as the most important indicator.

4.4.3. Order of Criteria Importance under the Constructs

For the “economic” construct, the land value is the most important, which is ranked 3rd in the overall priority sequence; on the “social” construct, the residential population is the most important, which is also ranked No. 1 in the overall priority sequence; on the “environmental” construct, the natural resources factor is the most important, which is ranked 3rd overall in priority sequence; on the “potential” construct, the geographical location is the most important, which is ranked 7th overall in the priority sequence. The above empirical result reveals that indicators of the economic, environmental and social constructs are relatively more important, while the indicators of the potential construct are relatively less important in the location evaluation. When a location-based decision on pollution remediation is oriented to benefits, the peripheral environmental condition is more important than the contaminated site per se and, as a result, the future remediation job should consider the factor of peripheral location and include the social, economic and environmental aspects so that the remediation efficiency can be accommodated in the decision making.

5. Conclusions

Pollution remediation is a persistent job, while the public funds are limited. Among numerous contaminated sites, prioritizing tracts with the greatest potential benefits is the purpose of this article. Therefore, through literature reviews, this article discusses the factors affecting pollution remediation. A questionnaire approach for interviews with experts is given, combined with the FDM and ANP methodology, to build a location-based index system for priority of soil and groundwater pollution remediation. In the process, the relevant weights are calculated to explore the key factors for the location-based priority decisions. The empirical result shows that the top three important indicators are residential population (13.64%), land value (13.23%) and natural resources (12.10%), while the least important indicators are area of site (6.31%), degree of pollution (7.14%) and transportation capacity (8.25%). The empirical result also reveals that when location-based decision making is benefit-oriented, the peripheral environmental condition is more important than the site per se. Therefore, evaluation of pollution remediation should not be confined to the survey of the contaminated site per se, but extend to the evaluation of the peripheral environmental condition and accommodate the remediation efficiency in the decision making. Finally, we also suggest the location-based index system to expand the site database of the government and to combine GIS, which will help promote the future remediation work, and maximize the benefits of site remediation.

Acknowledgments

Special thanks to Zhi-Yuan Yang for discussions. Thanks also to Environmental Protection Administration, Executive Yuan, R.O.C. Soil and Groundwater Pollution Remediation Fund Management Board for funding our project.

Author Contributions

This research was designed and written by Chia-Nung Li, Tsu-Kuang Hsieh, Chien-Wen Lo and Wei-Chiang Su.All authors contributed to the analysis and conclusions, and revised the paper. All authors read and approved the final manuscript.

Conflicts of Interest

The authors declare no conflict of interest.

References

  1. Hoekstra, A.Y.; Chapagain, A.K.; Aldaya, M.M.; Mekonnen, M.M. The Water Footprint Assessment Manual: Setting the Global Standard; Earthscan: London, UK, 2011; pp. 2–3. [Google Scholar]
  2. Manzardo, A.; Ren, J.; Piantella, A.; Mazzi, A.; Fedele, A.; Scipioni, A. Integration of water footprint accounting and costs for optimal chemical pulp supply mix in paper industry. J. Clean. Prod. 2014, 72, 167–173. [Google Scholar] [CrossRef]
  3. Chapagain, A.K.; Hoekstra, A.Y.; Savenije, H.H.G.; Gautam, R. The water footprint of cotton consumption: An assessment of the impact of worldwide consumption of cotton products on the water resources in the cotton producing countries. Ecol. Econ. 2006, 60, 186–203. [Google Scholar] [CrossRef]
  4. Simons, R.A. When Bad Things Happen to Good Property; Environmental Law Institute: Washington, DC, USA, 2006; pp. 63–112. [Google Scholar]
  5. Patchin, P.J. Valuation of contaminated Properties. Apprais. J. 1988, 5, 7–16. [Google Scholar]
  6. Mundy, B. Stigma and Value. Apprais. J. 1992, 60, 7–13. [Google Scholar]
  7. Caliman, F.A.; Robu, B.M.; Smaranda, C.; Pavel, L.V.; Gavrilescu, M. Soil and groundwater cleanup: benefits and limits of emerging technologies. Clean Technol. Environ. Policy 2011, 13, 241–268. [Google Scholar] [CrossRef]
  8. Gavrilescu, M. Fate of pesticides in the environment and its remediation. Eng. Life Sci. 2005, 5, 497–526. [Google Scholar] [CrossRef]
  9. Scholz, R.W.; Schnabel, U. Decision making under uncertainty in case of soil remediation. J. Environ. Manag. 2006, 80, 132–147. [Google Scholar] [CrossRef] [PubMed]
  10. Xiao, D.J. Social Benefits and Cost of Setting Environmental Policies and Development Projects: The Evaluation Model; Executive Yuan Environmental Protection Agency: Taipei, Taiwan, 2011.
  11. Jackson, T.O. The effects of environmental contamination on real estate: A literature review. J. Real Estate Lit. 2001, 9, 93–116. [Google Scholar]
  12. Environmental Protection Agency of Executive Yuan. Chung-Hua Institution for Economic Research, Review, Adjustment and Planning of Soil and Groundwater Pollution Remediation Expense Collection System; Environmental Protection Agency of Executive Yuan: Taipei, Taiwan, 2012.
  13. Qiu, J.Y. A Discussion of Promoting Reuse of Polluted Land. Master’s Thesis, Department of Land Economics, National Chengchi University, Taipei, Taiwan, 2012. [Google Scholar]
  14. Soderqvist, T.; Brinkhoff, P.; Norberg, T.; Rosen, L.; Back, P.E.; Norrman, J. Cost-benefit analysis as a part of sustainability assessment of remediation alternatives for contaminated land. J. Environ. Manag. 2015, 157, 267–278. [Google Scholar] [CrossRef] [PubMed]
  15. Xu, Y.T. A Study of Contaminated Land Value Evaluation from the Perspective of Pollution Remediation. Master’s Thesis, Department of Land Administration, FengChia University, Taichung, Taiwan, 2012. [Google Scholar]
  16. Lin, Z.Q.; Qiu, J.Y. Some ideas of reusing polluted land. Taiwan Environ. Land Law J. 2013, 1, 123–138. [Google Scholar]
  17. Page, G.W.; Rabinowitz, H. Groundwater contamination: Its effects on property values and cities. J. Am. Plan. Assoc. 1993, 59, 473–481. [Google Scholar] [CrossRef]
  18. Eckerd, A.; Keeler, A.G. Going green together? Brownfield remediation and environmental justice. Policy Sci. 2012, 45, 293–314. [Google Scholar] [CrossRef]
  19. Daley, D.; Layton, D. Policy implementation and the environmental protection agency: What factors influence remediation at superfund sites? Policy Stud. J. 2004, 32, 375–392. [Google Scholar] [CrossRef]
  20. Sullivan, T.; van Veen, H.J.; Davidson, L.; Bardos, R.P. Review of Discussions about Decision Support Issues in Europe and North America at the NATO/CCMS Special Session, and Overall Conclusions; United States Environmental Protection Agency: Washington, DC, USA, 2001.
  21. Hou, D.; Al-Tabbaa, A.; Chen, H.; Mamic, I. Factor analysis and structural equation modelling of sustainable behaviour in contaminated land remediation. J. Clean. Prod. 2014, 84, 439–449. [Google Scholar] [CrossRef]
  22. Bardos, R.P.; Mariotti, C.; Marot, F.; Sullivan, T. Framework for decision support used in contaminated land management in Europe and North America. In Evaluation of Demonstrated and Emerging Technologies for the Treatment and Clean Up of Contaminated Land and Groundwater (Phase III); NATO Committee on the Challenges of Modern Society; United States Environmental Protection Agency: Washington, DC, USA, 2001; pp. 9–30. [Google Scholar]
  23. Pollard, S.J.T.; Brookes, A.; Earl, N.; Lowe, J.; Kearney, T.; Nathanail, C.P. Integrating decision tools for the sustainable management of land contamination. Sci. Total Environ. 2004, 325, 15–28. [Google Scholar] [CrossRef] [PubMed] [Green Version]
  24. Linkov, I.; Vargee, S.; Jamil, S.; Seager, T.P.; Kiker, G.; Bridges, T. Multi-criteria decision analysis: A framework for structuring remedial decisions at contaminated sites. In Comparative Risk Assessment and Environmental Decision Making; Linkov, I., Ramadan, A., Eds.; Springer Science & Business Media: New York, NY, USA, 2006; pp. 15–54. [Google Scholar]
  25. Promentilla, M.A.B.; Furuichi, T.; Ishii, K.; Tanikawa, N. Evaluation of remedial countermeasures using the Analytic Network Process. Waste Manag. 2006, 26, 1410–1421. [Google Scholar] [CrossRef] [PubMed]
  26. Figueira, J.; Greco, S.; Ehrogott, M. Multiple Criteria Decision Analysis: State of the Art Surveys; Springer Science + Business Media, Inc.: New York, NY, USA, 2005. [Google Scholar]
  27. Zadeh, L.A. Fuzzy sets. Inf. Control 1965, 8, 338–353. [Google Scholar] [CrossRef]
  28. Ren, J.; Gao, S.; Tan, S.; Dong, L. Hydrogen economy in China: Strengths-weaknesses-opportunities-threats analysis and strategies prioritization. Renew. Sustain. Energy Rev. 2015, 41, 1230–1243. [Google Scholar] [CrossRef]
  29. Dağdeviren, M.; Yüksel, I. A fuzzy analytic network process (ANP) model for measurement of the sectoral competition level (SCL). Expert Syst. Appl. 2010, 37, 1005–1014. [Google Scholar] [CrossRef]
  30. Ren, J.; Tan, S.; Goodsite, M.E.; Sovacool, B.K.; Dong, L. Sustainability, shale gas, and energy transition in China: Assessing barriers and prioritizing strategic measures. Energy 2015, 84, 551–562. [Google Scholar] [CrossRef]
  31. Ren, J.; Manzardo, A.; Mazzi, A.; Zuliani, F.; Scipioni, A. Prioritization of bioethanol production pathways in China based on life cycle sustainability assessment and multicriteria decision-making. Int. J. Life Cycle Assess. 2015, 20, 842–853. [Google Scholar] [CrossRef]
  32. Sayadi, M.K.; Heydari, M.; Shahanaghi, K. Extension of VIKOR method for decision making problem with interval numbers. Appl. Math. Model. 2009, 33, 2257–2262. [Google Scholar] [CrossRef]
  33. Zhang, W.; Dong, W.; Su, X.; Liu, F. Comprehensive evaluation of groundwater remediation technologies. Water Resour. Prot. 2006, 22, 1–4. [Google Scholar]
  34. Wei, X. A Study on Multiple Criteria Decision Analysis of Pollution and Restoral in Groundwater. Master’s Thesis, Hunan University, Hunan, China, 2006. [Google Scholar]
  35. Banar, M.; Özkan, A.; Kulaç, A. Application of ANP and ELECTRE for the assessment of different site remediation technologies. Proc. World Congr. New Technol. 2015, 151, 1–5. [Google Scholar]
  36. Rosén, L.; Back, P.E.; Söderqvist, T.; Norrman, J.; Brinkhoff, P.; Norberg, T.; Volchko, Y.; Norin, M.; Bergknut, M.; Döberl, G. SCORE: A novel multi-criteria decision analysis approach to assessing the sustainability of contaminated land remediation. Sci. Total Environ. 2015, 511, 621–638. [Google Scholar] [CrossRef] [PubMed]
  37. Landaeta, J. Current validity of the Delphi method in social sciences. Technol. Forecast. Soc. Chang. 2006, 73, 467–482. [Google Scholar] [CrossRef]
  38. Yeh, C.C.; Weng, S.L.; Wu, J.H. A Study Comparing of Delphi method and fuzzy Delphi method. Investig. Methods Appl. 2007, 21, 31–58. [Google Scholar]
  39. Murrary, T.J.; Pipino, L.L.; van Gigch, J.P. A Pilot Study of Fuzzy Set Modification of Delphi. Hum. Syst. Manag. 1985, 5, 76–80. [Google Scholar]
  40. Saaty, T.L. The Analytic Hierarchy Process; McGraw-Hill: New York, NY, USA, 1980. [Google Scholar]
  41. Saaty, T.L. Decision Making with Dependence and Feedback: The Analytic Network Process; RWS Publication: Pittsburgh, PA, USA, 1996. [Google Scholar]
  42. Saaty, T.L. Theory and Applications of the Analytic Network Process: Decision Making with Benefits, Opportunities, Costs, and Risks; RWS Publications: Pittsburgh, PA, USA, 2005. [Google Scholar]
  43. Saaty, T.L. The Analytic Hierarchy and Analytic Network Measurement Processes: Applications to Decisions under Risk. Eur. J. Pure Appl. Math. 2008, 1, 122–196. [Google Scholar]
  44. Aragonés-Beltrán, P.; Pastor-Ferrando, J.P.; García-García, F.; Pascual-Agulló, A. An Analytic Network Process approach for siting a municipal solid waste plant in the Metropolitan Area of Valencia (Spain). J. Environ. Manag. 2010, 91, 1071–1086. [Google Scholar] [CrossRef] [PubMed]
  45. Ishizaka, A.; Nemery, P. Multi-Criteria Decision Analysis: Methods and Software; John Wiley & Sons, Ltd.: Chichester, UK, 2013. [Google Scholar]
  46. Pastor-Ferrando, J.P.; Aragones-Beltran, P.; Hospitaler-Perez, A.; García-Melón, M. An ANP- and AHP-based approach for weighting criteria in public works bidding. J. Oper. Res. Soc. 2010, 61, 905–916. [Google Scholar] [CrossRef]
  47. Shyur, H.J. COTS evaluation using modified TOPSIS and ANP. Appl. Math. Comput. 2006, 177, 251–259. [Google Scholar] [CrossRef]
Figure 1. ANP model for location-based index for priority of soil and groundwater pollution remediation.
Sustainability 08 00377 g001
Figure 2. Order of importance of location-based priority index.
Sustainability 08 00377 g002
Table 1. Literature on soil and groundwater pollution remediation factors.
LiteratureAspectCriteria
Daley and Layton [19]Administrative convenience
Problem severity
Political pressure
1. Hazardous ranking score
2. Estimated cleanup costs
3. Number of responsible parties named for the site
4. Notes: if a Community Advisory Group exists for a Superfund site
5. Technical Assistance Grant
6. Population density
7. Homeowners
8. Education
9. Income
10. House committee
Zhang et al. [33] Wei [34]Economic
Technological
Social
1. Capital cost
2. Detection and analysis costs
3. Operation and maintenance costs
4. Effectiveness
5. Time for remediation
6. Effect on ecology, environment and public health
Eckerd and Keeler [18](The discussion should be based on social justice.)1. Population density
2.Proportion of housing units built before 1940
3.Proportion of residents with bachelor’s degrees
4. Proportion of residents receiving welfare
5. Proportion of hispanic residents
6. Proportion of black residents
7. Proportion of tract classified as urban
Jian-Ying Qiu [13]Individual factors1. remediation budget
2. land value
3. future usage and operational losses during remediation
General factors1. consultation market
2. environmental regulations
3. remediation standards
Promentilla, et al. [25]1. Goal
2. Environmental effectiveness
3. Financial affordability
4. Implementability
5. Social acceptability
Banar, et al. [35]Benefit
Cost
Risk
1. Remediation time
2. Chemical usage
3. Easy application
4. Effiency
5. Operation cost
6. Preoperation cost
7. Capital cost
8. Effective depth
9. Climate conditions
10. Waste generation
11. Destroying of soil quality
Table 2. Location-based index for priority of soil and groundwater pollution remediation.
ConstructIndicatorGIEvaluation Meaning (Quantification Indicators)
C1 EconomyC1-1 Land Value8.36Peripheral promulgated average land value
C1-2 Land Usage10.00Areas of peripheral urban residential tract, commercial tract or non-urban rural tract
C1-3 Transportation Capacity8.52Peripheral primary and secondary road service level
C1-4 Around the industry7.57The proportion of the industry
C1-5 Tax Revenue7.36Total annual government revenue
C2 SocietyC2-1 Residential Population9.00Peripheral residential population
C2-2 Household Income8.60Peripheral average household income
C2-3 Employment Rate6.95The employment rate
C3 EnvironmentC3-1 Open Environment8.52Areas of peripheral open green land, parks and squares
C3-2 Natural Resources9.00Areas of natural resources of peripheral rivers, lakes, and woods
C4 PotentialC4-1 Geographic Location8.73Distance of pollution site from urban center or developed settlement
C4-2 Site Area8.51Pollution site area
C4-3 Degree of Pollution8.53Pollution site of remediation site (heavier polluted) or controlled site (lighter polluted)
C4-4 Operating Loss during Remediation7.32Monthly sales amount
Note: The number of indicators has been selected: 10 (Gi ≥ S (8.35), shown in gray). The threshold value is the arithmetic mean value of expert consensus.
Table 3. Limited matrix of location-based priority index for soil and groundwater pollution remediation.
NodeC1-1C1-2C1-3C2-1C2-2C3-1C3-2C4-1C4-2C4-3
C1-10.13230.13230.13230.13230.13230.13230.13230.13230.13230.1323
C1-20.10320.10320.10320.10320.10320.10320.10320.10320.10320.1032
C1-30.08250.08250.08250.08250.08250.08250.08250.08250.08250.0825
C2-10.13640.13640.13640.13640.13640.13640.13640.13640.13640.1364
C2-20.10480.10480.10480.10480.10480.10480.10480.10480.10480.1048
C3-10.10260.10260.10260.10260.10260.10260.10260.10260.10260.1026
C3-20.12100.12100.12100.12100.12100.12100.12100.12100.12100.1210
C4-10.08280.08280.08280.08280.08280.08280.08280.08280.08280.0828
C4-20.06310.06310.06310.06310.06310.06310.06310.06310.06310.0631
C4-30.07140.07140.07140.07140.07140.07140.07140.07140.07140.0714
Table 4. Statistics of priority weights of indicators for soil and groundwater pollution remediation.
Decision MakersUrban PlanningLand EconomicNatural ResourceAppraisal of Real EstateAverage
12345678910
C1-1 Land Value9.27%12.25%3.24%5.97%4.65%4.76%11.88%34.29%25.45%20.51%13.23%
C1-2 Land Usage8.94%10.41%3.06%7.87%5.14%5.15%6.96%13.70%19.90%22.07%10.32%
C1-3 Transportation Capacity7.50%10.25%3.03%7.18%4.38%4.11%7.07%10.33%12.05%16.60%8.25%
C2-1 Residential Population9.14%24.49%4.41%10.88%21.69%34.10%6.17%2.31%15.01%8.21%13.64%
C2-2 Household Income14.13%18.28%4.14%8.44%15.97%15.72%5.40%2.14%11.37%9.25%10.48%
C3-1 Open Environment10.33%7.75%15.36%12.15%14.68%14.19%11.81%10.57%2.67%3.07%10.26%
C3-2 Natural Resources8.85%8.09%25.70%15.63%14.68%16.92%11.81%13.08%2.57%3.66%12.10%
C4-1 Geographic Location9.73%3.01%19.51%11.94%7.41%1.67%15.08%4.25%3.95%6.25%8.28%
C4-2 Site Area10.22%2.71%10.78%10.81%5.45%1.62%8.74%4.00%3.60%5.12%6.31%
C4-3 Degree of Pollution11.89%2.78%10.78%9.13%5.95%1.76%15.08%5.34%3.42%5.26%7.14%
Total100.00%100.00%100.00%100.00%100.00%100.00%100.00%100.00%100.00%100.00%100.00%
Note: the weights shaded in gray are the top three of each expert.
Table 5. Order of importance of location-based priorities of soil and groundwater pollution remediation.
ConstructWeightOrderIndicatorWeightOrder
C1 Economy31.80%1C1-1 Land Value13.23%2
C1-2 Land Usage10.32%5
C1-3 Transportation Capacity8.25%8
C2 Society24.12%2C2-1 Residential Population13.64%1
C2-2 Household Income10.48%4
C3 Environment22.36%3C3-1 Open Environment10.26%6
C3-2 Natural Resources12.10%3
C4 Potential21.72%4C4-1 Geographic Location8.28%7
C4-2 Site Area6.31%10
C4-3 Degree of Pollution7.14%9
Note: the indicators shaded in gray are the top three of weight.

