Article

Recent NDVI-Based Variation in Growth of Boreal Intact Forest Landscapes and Its Correlation with Climatic Variables

1
Jiangsu Provincial Key Laboratory of Geographic Information Science and Technology, Nanjing University, Xianlin Road 163, Nanjing 210023, China
2
International Institute for Earth System Science, Nanjing University, Xianlin Road 163, Nanjing 210023, China
*
Author to whom correspondence should be addressed.
Sustainability 2016, 8(4), 326; https://doi.org/10.3390/su8040326
Submission received: 25 December 2015 / Revised: 23 March 2016 / Accepted: 29 March 2016 / Published: 1 April 2016

Abstract

:
Intact Forest Landscape (IFL) is of great value in protecting biodiversity and supporting core ecological processes. It is important to analyze the spatial variation in the growth dynamics of IFL. This study analyzed the change of the Normalized Difference Vegetation Index (NDVI) during the growing season (April–October) for boreal (45° N–70° N) IFLs and the correlation with climatic variables over the period of 2000–2013. Our results show 85.5% of boreal IFLs did not show a significant change in the NDVI after 2000, and only 10.2% and 4.3% exhibited a statistically significant increase (greening) or decrease (browning) in NDVI, respectively. About 60.9% of the greening boreal IFLs showed that an increasing NDVI was significantly correlated to climatic variables, especially an increasing growing season temperature (over 47.0%). For browning boreal IFLs, a decrease in temperature or an increase in dormancy period precipitation could be the prime reason for a significant decrease in the NDVI. However, about 64.6% of the browning boreal IFLs were insensitive to any of the climatic variables, indicating other factors, such as fire, had caused the browning. Although it did not show a significant trend, the NDVI of 51.3% of no-change boreal IFLs significantly correlated to climatic variables, especially growing season temperatures (over 37.6%).

1. Introduction

Forest landscape composes a major part of the terrestrial landscape, occupying about 30% of the world’s land area. Forest landscape plays an important role in planetary matter and energy cycles [1], especially the global carbon cycle because of its huge C pool and high productivity [2]. Currently, intact forest landscapes (IFLs) are becoming increasingly important due to their significant ecological values [3].
An intact forest landscape (IFL) is an unbroken expanse of natural ecosystem which contains forest and non-forest ecosystems within a current forest zone, showing no signs of significant human activity [4]. This IFL definition was proposed by Greenpeace in 2001 as an approach to provide timely mapping and monitoring of variations in forest extent [5]. Forest landscapes that remain undeveloped and unfragmented by human activity exhibit stronger resistance and resilience to disturbance, and are invaluable for preserving natural habitats and biological diversity [6]. Furthermore, intact forest landscapes are quite capable of supporting core ecological processes and services, such as carbon-nitrogen-water coupling cycles, energy budget, and control of natural hazards [7]. More importantly, intact forest landscapes supply an invaluable natural resource in the study of responses of terrestrial ecosystems to climate without human interference, such as land use change [8]. Hence, it is of great significance for understanding not only the quantitative but also the qualitative variations in IFLs in current climatic condition to maintain ecological safety and sustainability. However, the global IFL map and its update are currently used to measure and differentiate rates and causes of forest alteration and degradation across a landscape [4,9]. To the best of our knowledge, studies focused on variations in the growth of intact forest landscapes and their relationship with local climates based on IFL have rarely been reported.
Climate change has become pronounced in the northern hemisphere (NH), especially at mid-high latitudes, over the last few decades [10]. Prominent annual and seasonal variations in climate have exhibited an obvious spatial heterogeneity, which has resulted in different temporal and spatial responses of plant growth [11,12,13]. The changes of plant growth over the mid-high latitudes in the NH have been investigated using various approaches [14], especially satellite-based remotely-sensed vegetation indices, which can exhibit a temporal and spatial pattern on the integrated responses of plant growth to environmental influences [15,16]. The Normalized Difference Vegetation Index (NDVI), which is derived from the infrared channel and the near-infrared channel and has proved to positively correlate with productivity [17], has been widely used as a growth indicator to explore responses of terrestrial ecosystems to climate changes at regional and global scales [18]. Previous studies has shown that an increased temperature has boosted plant growth over recent decades through enhanced photosynthesis [19,20]. At a continental scale, a statistically significant increase in the growing season NDVI was observed in Eurasia and North America from the 1980s. However, there were two distinct periods with different trends in growing season NDVI. Growing season NDVI first significantly increased from 1982 to the mid-1990s, and then decreased from the late 1990s [21]. The retardation of the growing season NDVI trend over Eurasia [12] and North America [22] was largely caused by spring and summer NDVI changes associated with local climate changes. In Inner Mongolia, Northwest China, and the northwestern region of North America, a significant reversal in the growing season NDVI trend occurred in the 1990s and early 2000s mainly due to higher temperature and less precipitation [23,24]. Nevertheless, there are still many uncertainties that have not been adequately quantified [25]. More importantly, current regional findings could not absolutely reflect variations in boreal IFLs because these did not exclude influences of significant human activities, such as settlements, agriculture, timber production, and industrial activities.
In this study, we investigated NDVI-based variations in the growth of boreal intact forest landscapes and their correlation with local climatic variables from 2000 to 2013. We assume that sensitivities of growth to climatic variables may differ among IFLs in different regions. Such analysis would be useful in improving our knowledge of the spatial pattern and climatic regulation mechanism of developments of boreal intact forest landscapes in recent years, as well as supporting studies on the sustainability of intact forest landscapes.

2. Material and Methods

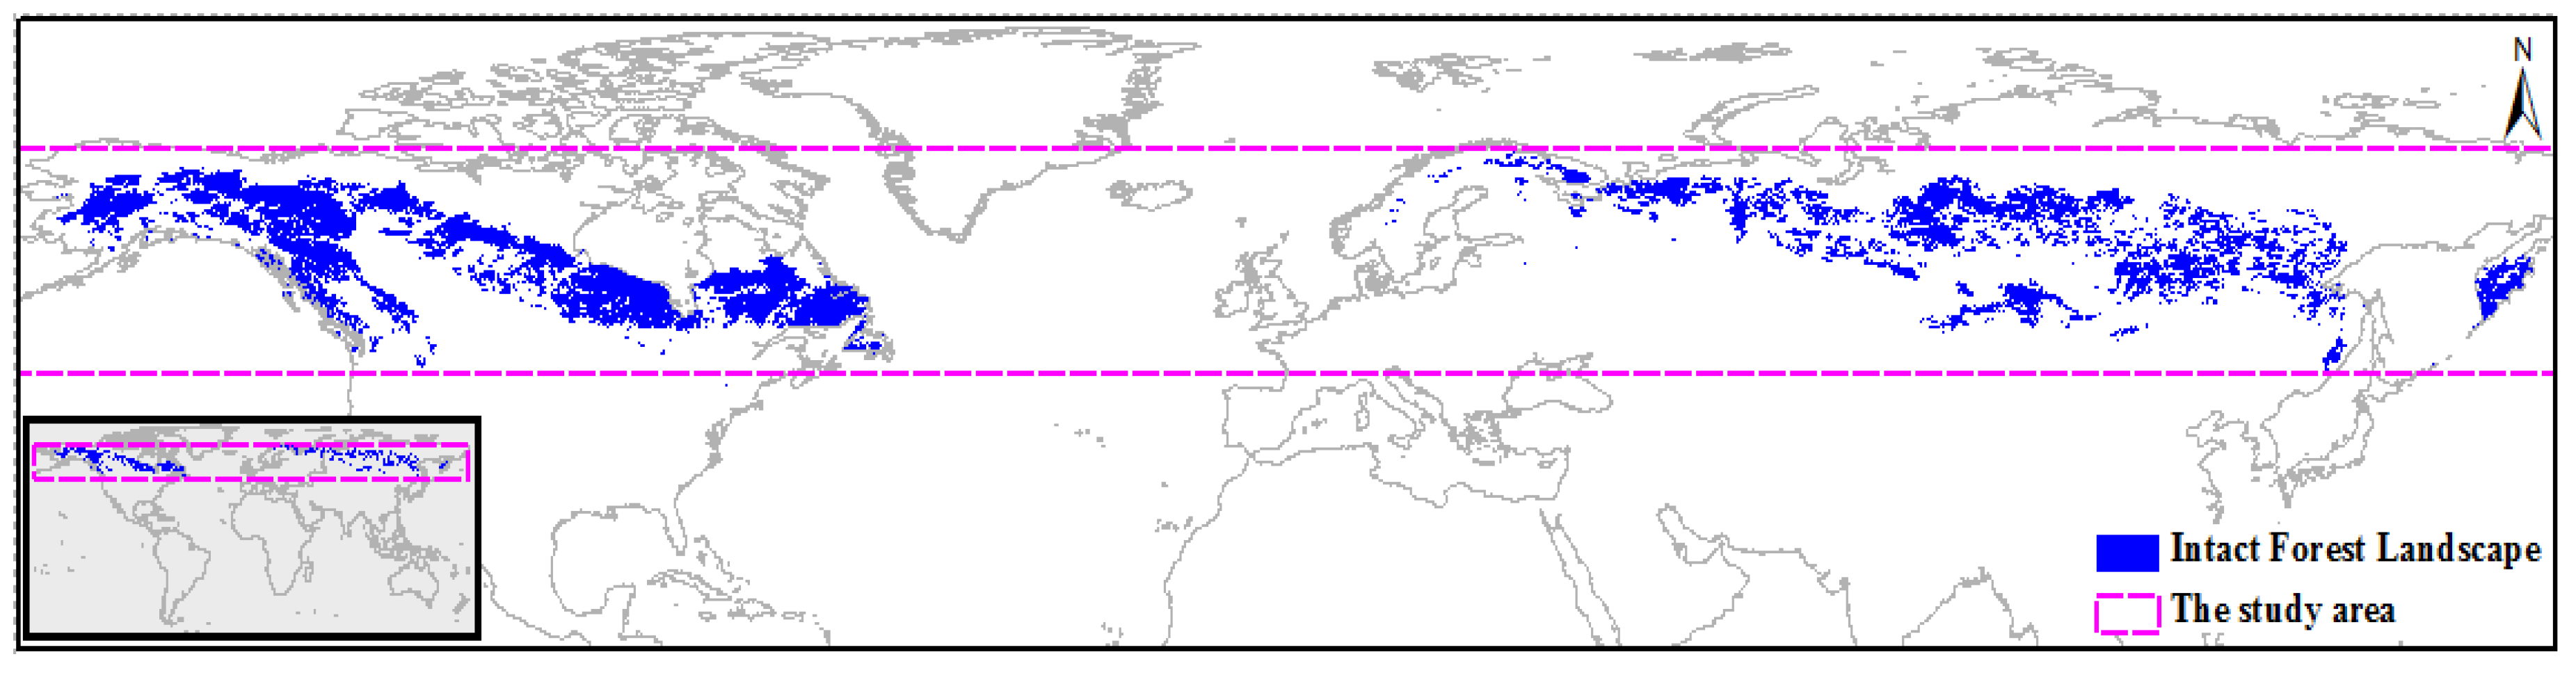
2.1. Study Area and Intact Forest Landscape

In our present work, a boreal transect (45° N–70° N) that covered most boreal IFLs was chosen as the study area (Figure 1). The IFL is defined as a large unbroken expanse of forest landscape without signs of significant human activity, with an area of at least 500 km2, and with a minimum IFL patch width of 10 km and a minimum corridor/appendage width of 2 km. This definition builds on the definition of Frontier Forest developed by the World Resources Institute (WRI) [26]. Although IFLs are located in forest zones, some may contain extensive naturally tree-less ecosystems, including grassland, tundra, wetlands, etc.
The boreal IFL map used in this study was derived from the world’s IFL map (scale 1:1,000,000) for years 2000 and 2013 [27] (http://www.intactforests.org). Satellite images with 30 m resolution from Landsat TM and ETM+ were used to map the extent of the global IFLs for year 2000 and 2013 based on the approach of inverse logic with additional thematic and topographic map layers [3]. An overlapping IFL boundary was derived from the IFL maps for years 2000 and 2013, and the IFLs during 2000–2013 were obtained in our study area, to ensure that anomalies in growth of boreal IFLs were driven by climatic variables rather than significant human activities or serious natural disasters. Then, these boreal IFLs were rasterized at a spatial resolution of 0.5° × 0.5° to match the following climate data, and all further calculations and analyses were done based on each IFL pixel in this study.

2.2. Climate Data

Climate data used in this study was obtained from the Climatic Research Unit, University of East Anglia [28,29]. Our dataset included monthly average temperature and precipitation data at a spatial resolution of 0.5° from 2000 to 2013. In consideration of the direct and lag effects of climate to boreal plants, climatic variables during the growing season (GS) and dormancy period (DP) were also taken into account in our work. In this study, the GS was defined as the duration from April to October when the main physiological activities of boreal plants occur [12,21,22], and the DP was from the previous November to the current March. The monthly climate data were aggregated by GS and DP per year. Then the annual time series of GS temperature (GS-TMP) and GS precipitation (GS-PRE) from 2000 to 2013 and DP temperature (DP-TMP) and DP precipitation (DP-PRE) from 1999 to 2012 were obtained for each IFL pixel.

2.3. MODIS NDVI

In the present work, we focused on inter-annual variations of boreal plant growth during the GS. Monthly satellite-based NDVI from 2000 to 2013 was used and the degree of plant growth was inferred from the average NDVI during the GS (GS-NDVI). The NDVI dataset was derived from the MODIS NDVI product (MOD13C2, https://lpdaac.usgs.gov/dataset_discovery/modis/modis_products_table/mod13c2) [30], containing atmospherically-corrected bi-directional surface reflectances masked for water, clouds, and cloud shadows. The MODIS NDVI data originally at 0.05° spatial resolution was up-scaled to 0.5° spatial resolution to match the climate data resolution by calculating the average. The GS-NDVI per year was calculated to obtain an inter-annual time series of GS-NDVI from 2000 to 2013 for each IFL pixel.

2.4. Statistical Analyses Strategy

To quantify the changing trends of GS-NDVI of IFLs, we performed the linear least squares regression analysis pixel by pixel using the GS-NDVI as a dependent variable and the year as an independent variable. The slope of the regression (k) was then delineated as the changing trend (annual mean change amount) of GS-NDVI. The IFLs with different changing trends were divided into three categories according to the slope (k) and statistical significance (p) of the regression, including “greening IFL” (GS-NDVI of IFL significantly increased: k > 0, p < 0.05), “browning IFL” (GS-NDVI of IFL significantly decreased: k < 0, p < 0.05), and “no-change IFL” (GS-NDVI of IFL did not significantly change: p ≥ 0.05).
Path analysis was used to detect direct effects of climatic variables on growth of boreal IFLs pixel by pixel, where the GS-NDVI was a dependent variable and the four climatic variables were independent variables. Path coefficients are standardized versions of linear regression weights which can be used in examining the possible causal linkage between statistical variables in the structural equation modeling approach [31,32]. By comparison, the climatic variable with the highest absolute value of path coefficient (direct effect) was determined as the dominant climatic variable for plant growth in the IFL pixel.

3. Results and Discussion

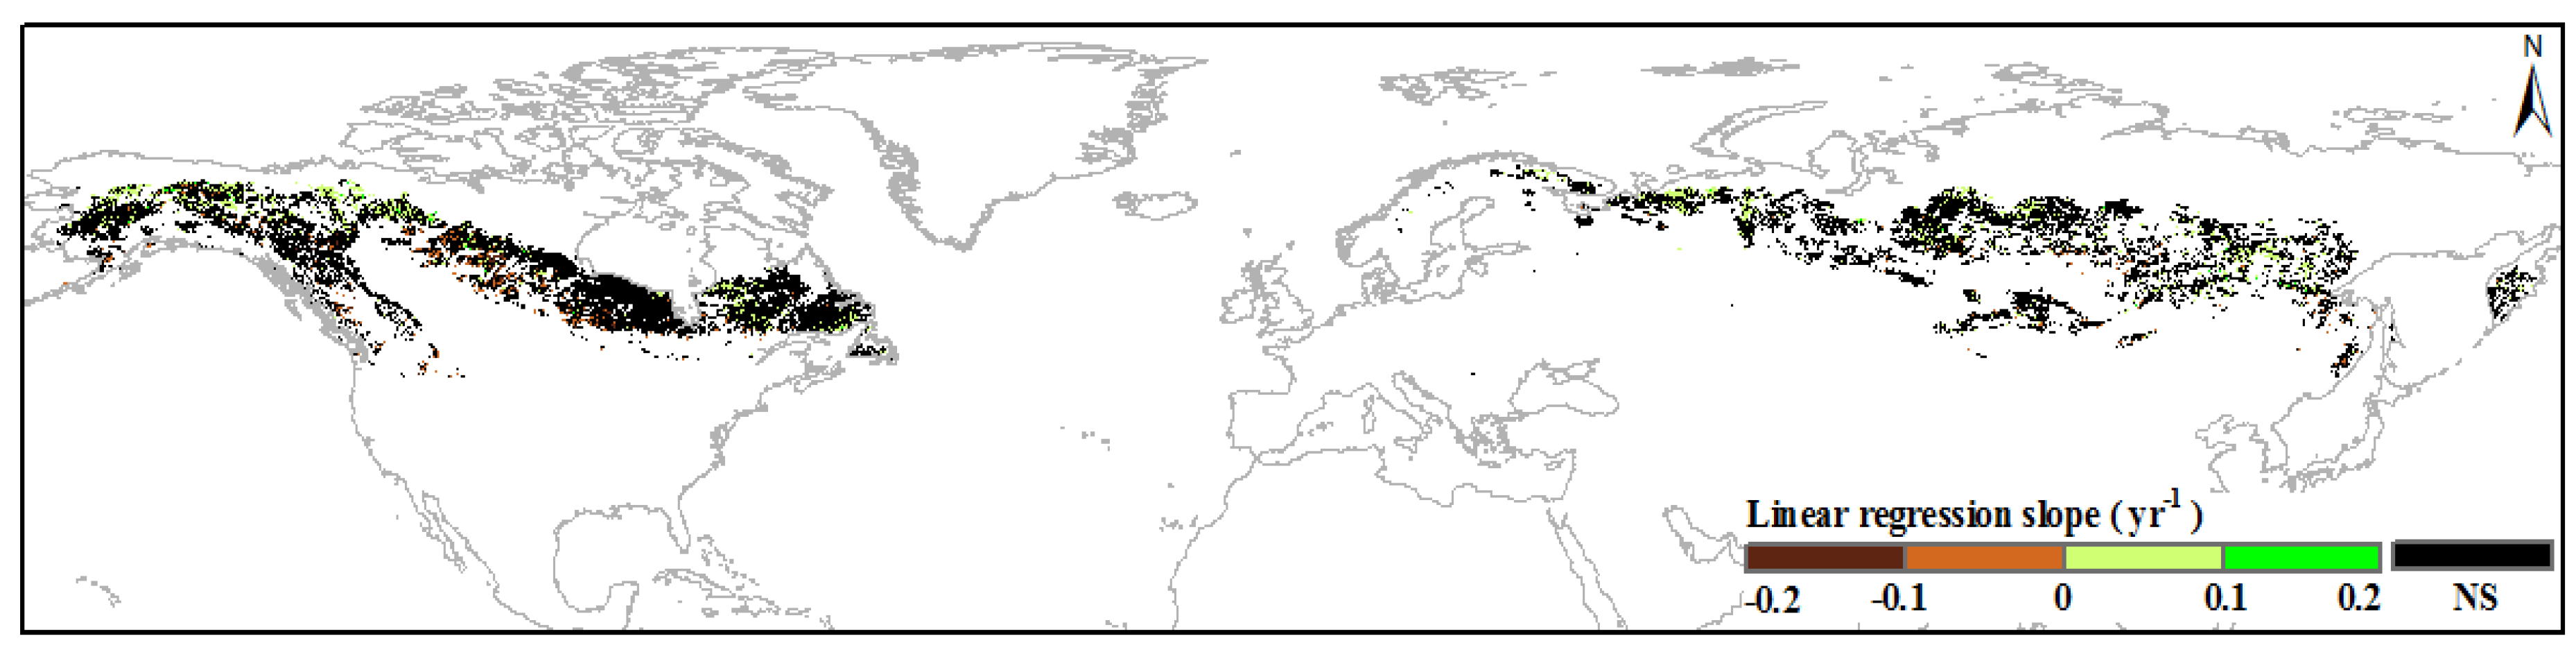
3.1. Annual Variations in Boreal IFLs

Figure 2 shows the changing trend of growth of the boreal IFLs in the study area from 2000 to 2013. The color of Figure 2 denotes the changing trend of GS-NDVI in each IFL pixel: the (dark and light) green and brown denotes the statistically significant (p < 0.05) increase or decrease in the GS-NDVI from 2000 to 2013, respectively; the gray color indicates that the GS-NDVI did not significantly (p ≥ 0.05) change during the study period. We found that the changing trends showed a significant difference (p < 0.05) among categories by ANOVA. The statistical result (Figure 3) showed that there had been no significant change in NDVI over 80% of boreal IFL during the past 14 years, and 44.8% and 55.2% of these no-change IFLs were located in Eurasia (e.g., the East/West Siberian taiga) and North America (e.g., Eastern Canadian Shield taiga and Interior Alaska-Yukon lowland taiga), respectively. Only 14.5% of boreal IFLs showed significant greening (10.2%) or browning (4.3%). For the greening boreal IFLs, 47.1% and 52.9% of these IFLs were located in Eurasia and North America, respectively, including the East/West Siberian taiga, Interior Alaska-Yukon lowland taiga, Northwest Territories taiga, Scandinavian, and Russian taiga. For the browning IFLs, 27.9% and 72.1% of the IFLs were located in Eurasia and North America, respectively, including the Midwestern Canadian Shield forests, East Siberian taiga, Northern Canadian Shield taiga, Mid-Continental Canadian forests, and Interior Alaska-Yukon lowland taiga. Previous studies have shown that a significant increase in growing season NDVI in the mid-high latitudes of the northern hemisphere during the 1980s and early 1990s, but then decreased from the late 1990s [12,21], showing an obvious “turning point”. Although our results partly support this view, we found the vast majority of boreal IFLs did not exhibit a significant change after 2000.

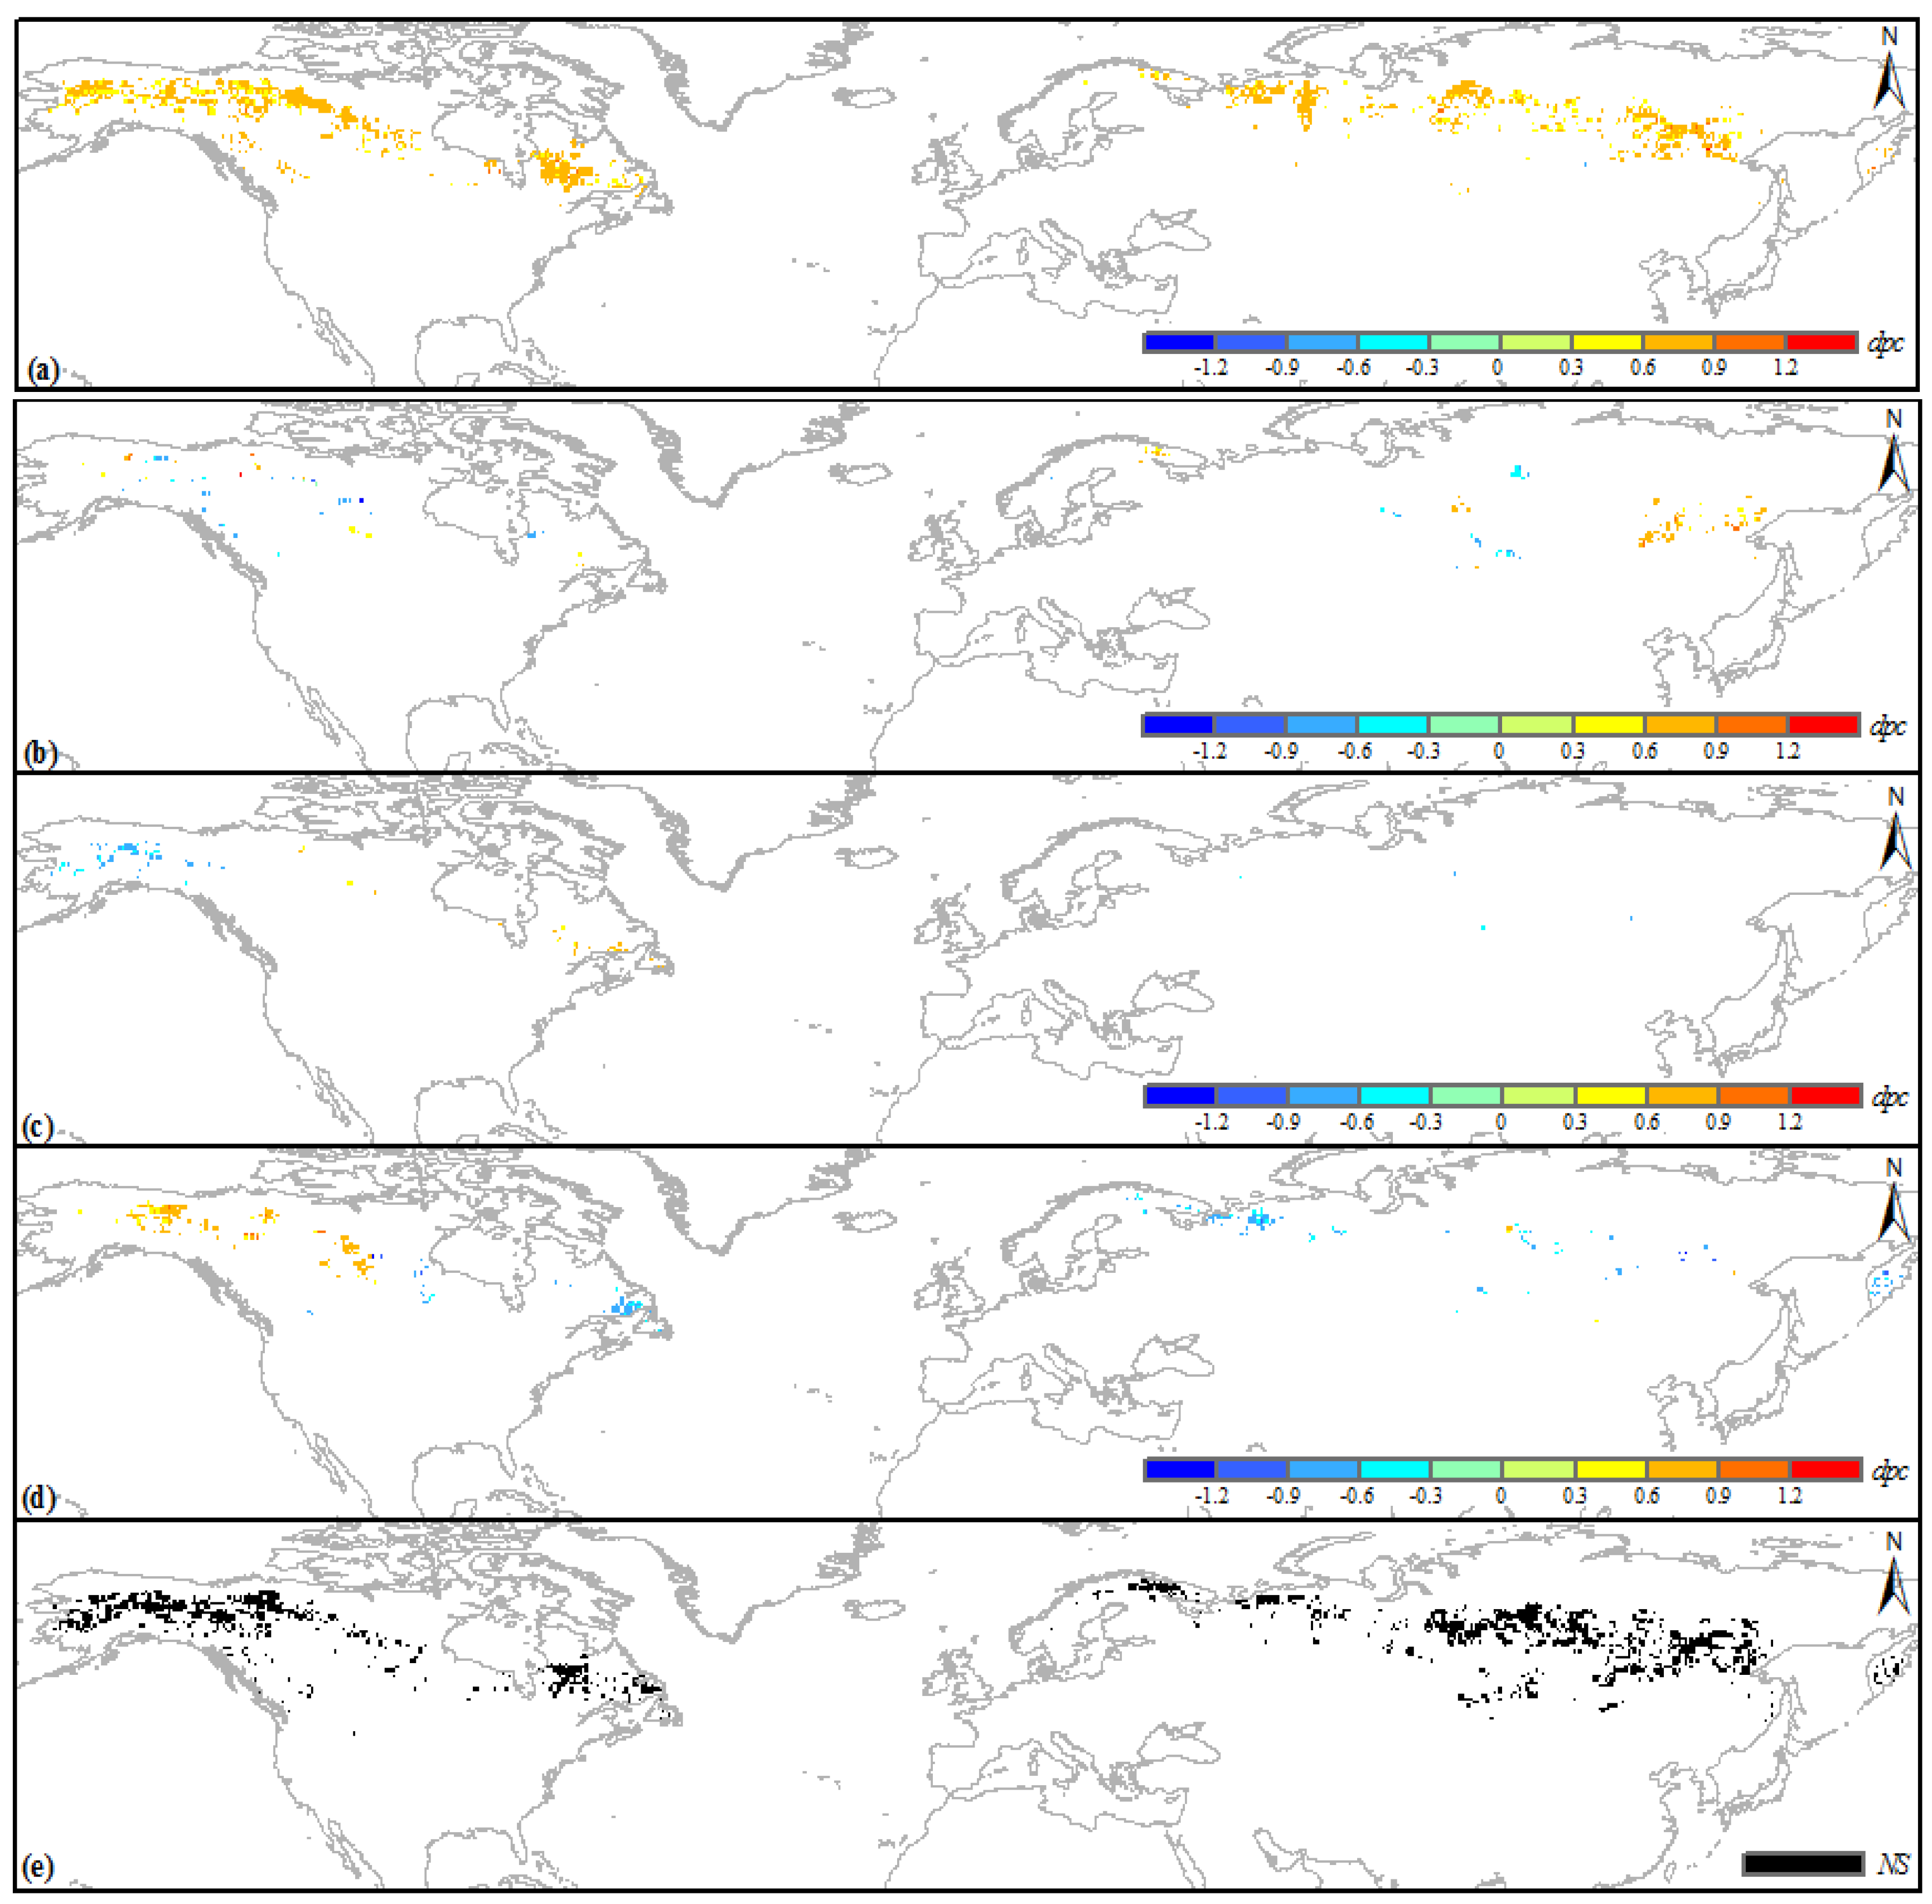
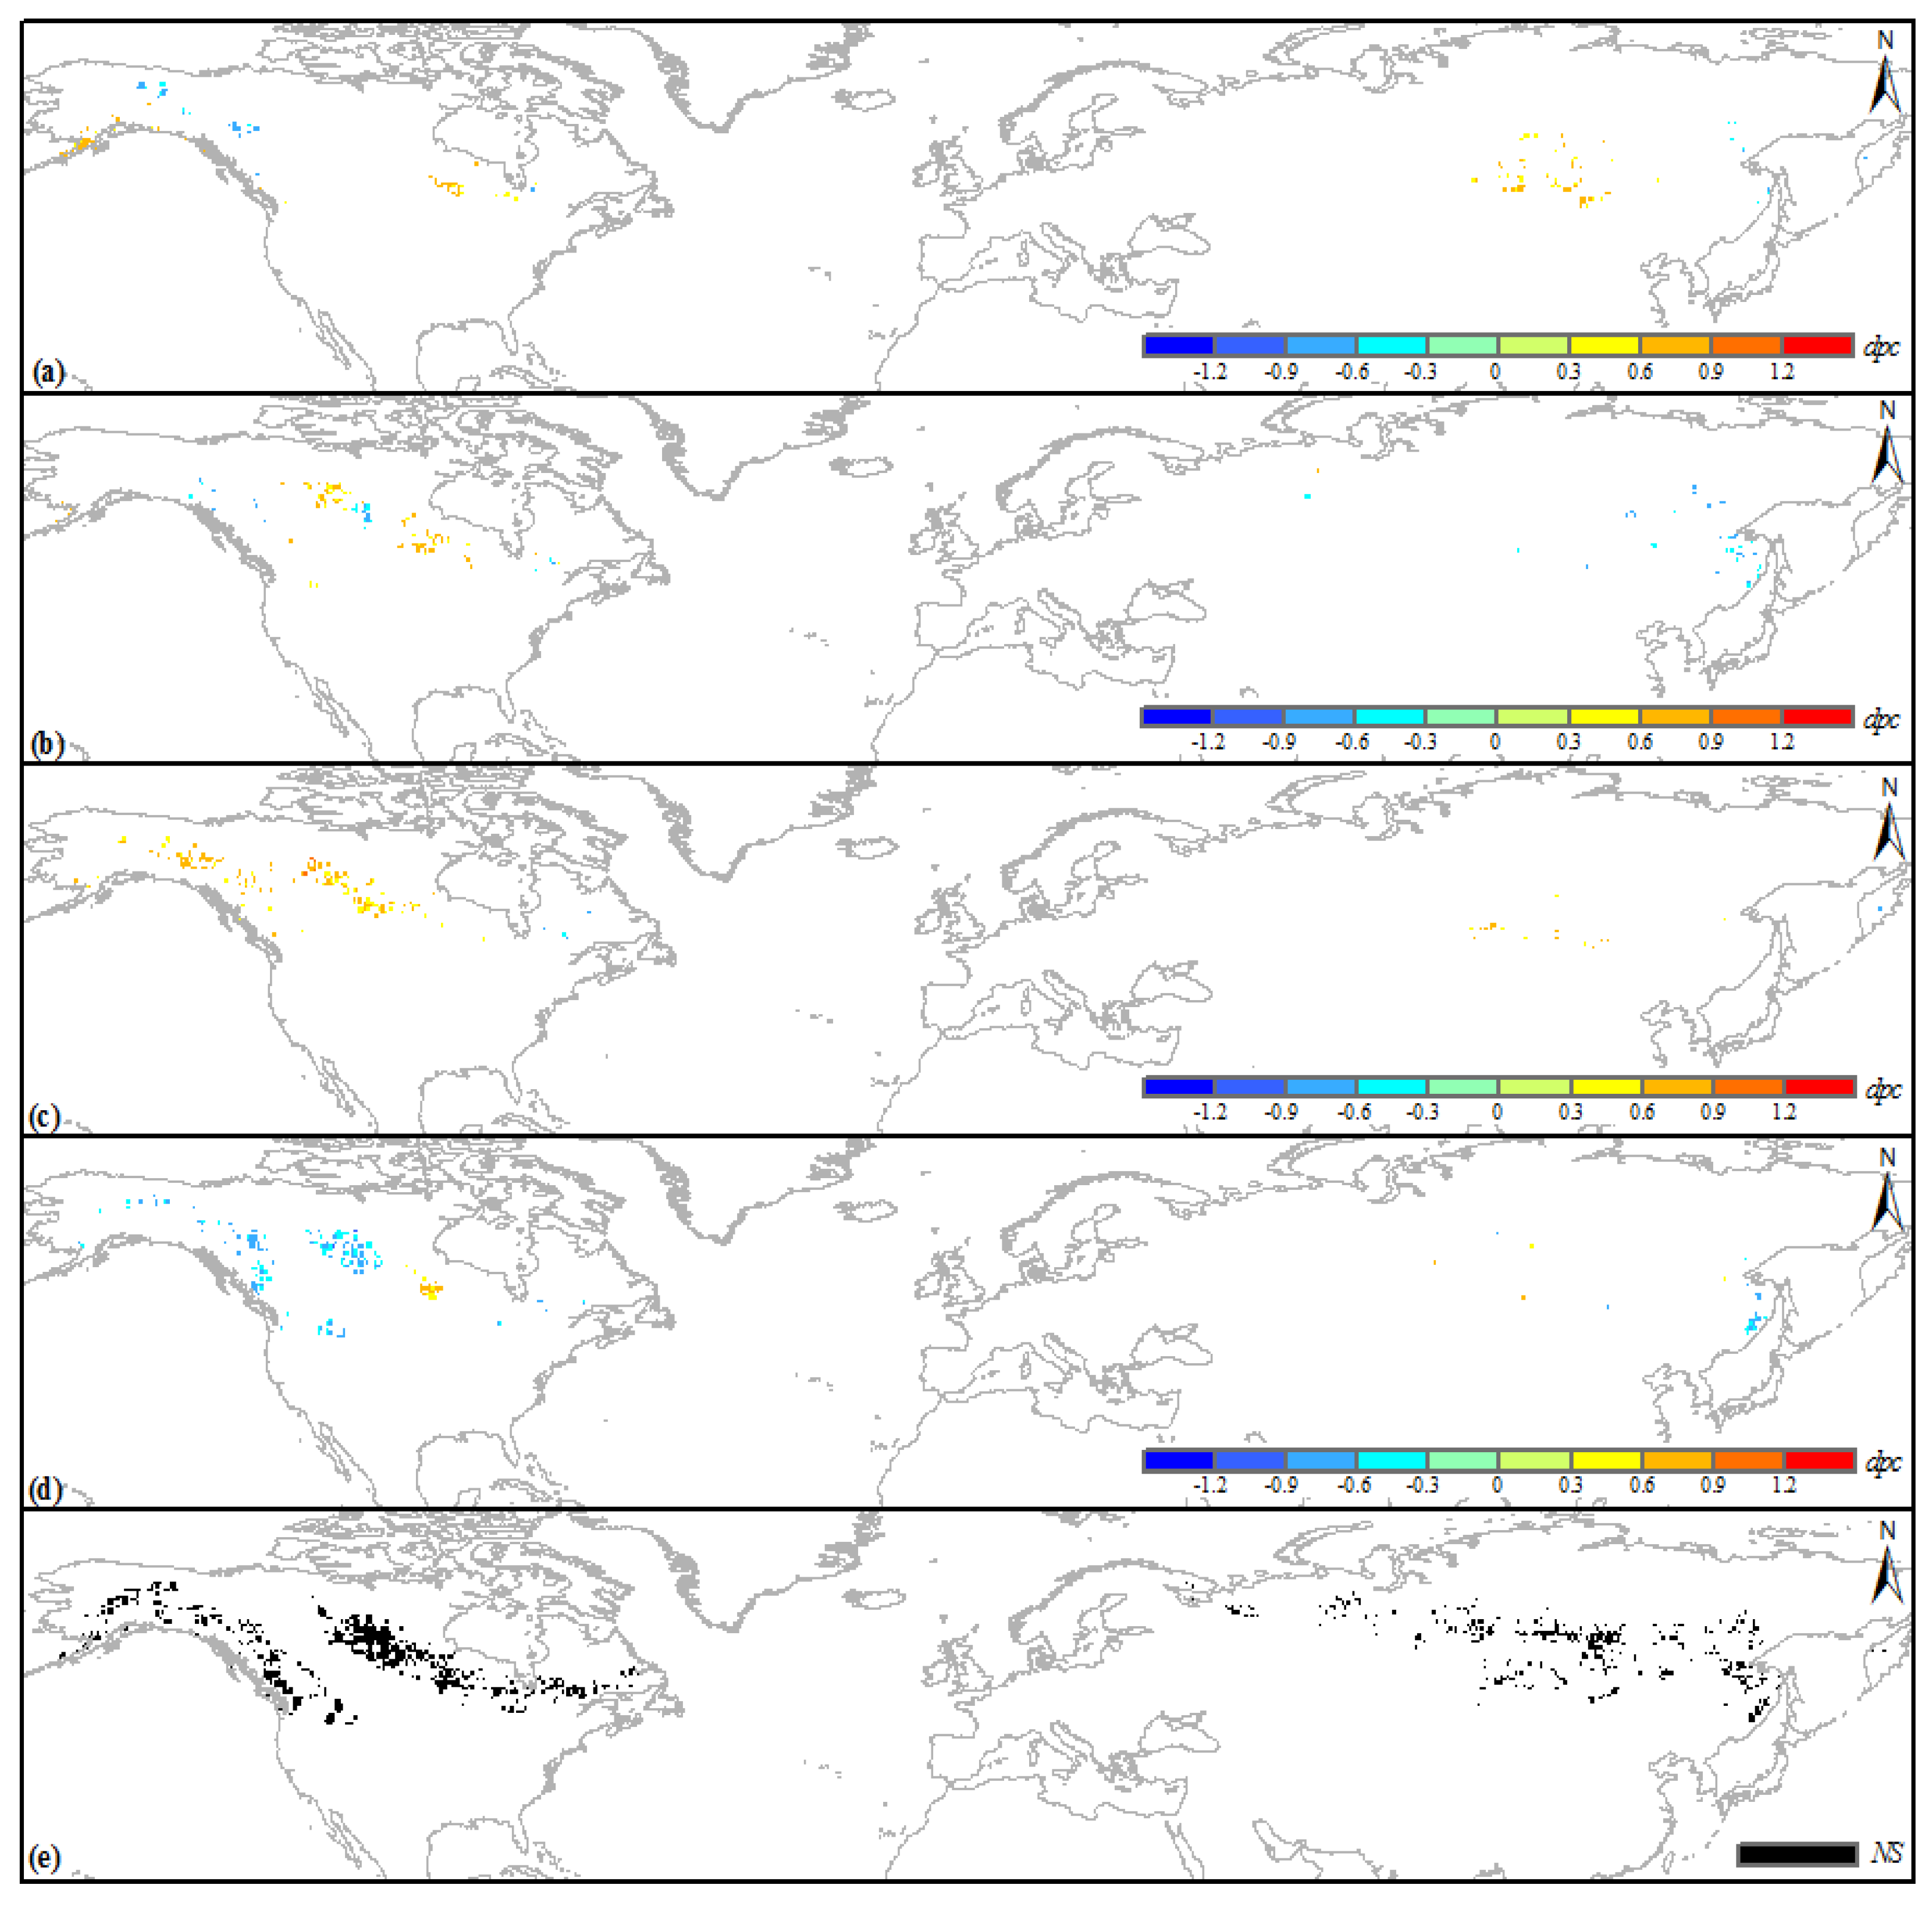
3.2. Climatic Sensitivity of the Greening Boreal IFLs

Here, we investigated the direct effect of climatic variables on GS-NDVI for each boreal IFL pixel. Figure 4 shows the spatial patterns of the greening boreal IFLs dominated by different climatic variables, including GS-TMP (a); GS-PRE (b); DP-TMP (c); and DP-PRE (d). The colors denote the direct path coefficient (dpc) between GS-NDVI and the dominant climatic variable over the study period. Figure 4e shows the greening IFLs of which GS-NDVI did not significantly directly response to any of the climatic variables chosen in this study. The ratio of greening IFLs, where GS-NDVI was dominated by GS-TMP, GS-PRE, DP-TMP, and DP-PRE to the total greening IFLs was 47.0%, 3.2%, 1.6%, and 9.2%, respectively, whereas 39.1% of the greening IFLs did not show a significant relationship between GS-NDVI and any of the climatic variables (Figure 3). Further, we explored the positive or negative effects of the dominant climatic variables to the greening IFLs. For the greening boreal IFLs dominated by GS-TMP, almost all individual pixel-level correlations between GS-NDVI and GS-TMP were positive (99.9% significant). This suggests that an increase in growing season temperature may be an important stimulus for the greening of boreal IFLs [21]. Those greening boreal IFLs dominated by GS-TMP mainly included the East Siberian taiga, Northwest Territories taiga, Interior Alaska-Yukon lowland taiga, and Northern Canadian Shield taiga. However, the other three climatic variables seemed to play ambiguous roles in the growth of greening boreal IFLs. By comparison, the variation in DP-PRE was another important reason for greening of boreal IFLs compared to GS-PRE and DP-TMP, especially for the Ogilvie-MacKenzie alpine tundra and Eastern Canadian forests.

3.3. Climatic Sensitivity of the Browning Boreal IFLs

Figure 4 show the climatic sensitivity of browning boreal IFLs, and the panels are the same as in Figure 3. For the browning boreal IFLs, 7.4%, 7.3%, 8.0%, and 12.9% of the IFLs were dominated by GS-TMP, GS-PRE, DP-TMP, and DP-PRE, respectively, and 64.6% did not exhibit a significant correlation between GS-NDVI and any of the climatic variables (Figure 4). It suggests that the recent degeneration of boreal forest landscapes was less influenced by local climate. Overall, a decrease in (both growing season and dormancy period) TMP or an increase in DP-PRE could lead to a decrease in GS-NDVI. For the browning boreal IFLs, GS-NDVI of 5.9% and 7.8% of IFLs exhibited a significant positive response to GS-TMP and DP-TMP, respectively. GS-TMP and DP-TMP dominated browning IFLs mainly located in the Beringia lowland tundra and Interior Alaska-Yukon lowland taiga, respectively. Meanwhile, 11.2% of the browning boreal IFLs showed a significant negative correlation between GS-NDVI and DP-PRE, which were mainly located in the Midwestern Canadian Shield forests and the Northern Cordillera forests. Previous studies have suggested that the increase in DP-PRE (snow) cover extent and duration was a direct cause of the decreasing temperature [33,34] due to altering surface albedo and the surface energy partitioning. The decline in DP-TMP may increase the risk of frost damage and mitigate the accumulation of a certain amount of heat to trigger spring leaf onset [35], which would delay or even inhibit the growth of IFLs.

3.4. Climatic Sensitivity of the No-Change Boreal IFLs

Figure 5 show spatial patterns and ratios of no-change boreal IFLs with different dominant climatic variables, and the panels are the same as in Figure 3. For the no-change IFLs, there were 37.6%, 3.5%, 6.0%, and 4.2% of IFLs where GS-NDVI was dominated by GS-TMP, GS-PRE, DP-TMP, and DP-PRE, respectively. This suggests growing season temperature has a major climatic stimulus on the growth of boreal intact forest landscapes. Nevertheless, over half of no-change IFLs (48.7%) did not show sensitivity to any climate as well as a significant change trend. This could be partially explained by the strong resistance of IFLs to variations in climate variables, as well as the effects of variations in climate variables, as they are offset against each other [21].
For almost all of the no-change boreal IFLs dominated by GS-TMP (99.8%), GS-NDVI responded significantly positively to GS-TMP. These IFLs mainly included the East/West Siberian taiga, Eastern/Northern Canadian Shield taiga and Southern Hudson Bay taiga. Similar to GS-TMP, a higher DP-TMP mainly promoted the growth of no-change boreal IFLs in the study area. However, 12.4% of the no-change IFLs dominated by DP-TMP showed a significant negative correlation between GS-NDVI and DP-TMP, which mainly occurred in the Scandinavian and Russian taiga and the Eastern Canadian Shield taiga. Generally, DP-PRE exhibited a negative effect on growth of the boreal IFLs as mentioned above. An increase in DP-PRE significantly correlated with a decrease of GS-NDVI for 73.4% of the no-change IFLs dominated by DP-PRE, which mainly occurred in the Scandinavian and Russian taiga, Interior Alaska-Yukon lowland taiga, and Mid-Continental Canadian forests.
The results showed that the vast majority (85.5%) of boreal IFLs in this study had not exhibited a statistically significant variation in growing season NDVI over the last 14 years, and are consistent with previous studies which have suggested temperate and boreal vegetation greening trend that occurred during 1982–1997 was either stalled or reversed during 1997–2006 [12,22]. However, about half of the no-change IFLs seemed to be quite sensitive to local climates, especially growing season temperature. In the future, if the projected dramatic climate change occurs in these habitats, perhaps the intact forest landscapes in these regions will inevitably show significant responses to the variations in climatic variables.

4. Conclusions

In this study, we investigated a NDVI-based variation in the growth of boreal intact forest landscapes and the correlation with local climatic variables from 2000 to 2013. Compared to a significant increase in growing season NDVI in the mid-high latitudes of the northern hemisphere during the 1980s and early 1990s, the NDVI of the vast majority of boreal IFLs in the study did not exhibit a significant change after 2000. Only about 10.2% of the boreal IFLs exhibited a significant greening, while 4.3% showed a significant browning over the study period. About 60% of the greening boreal IFLs showed that a significant increase in growing season NDVI correlated to the climatic variables, especially an increasing growing season temperature. For the browning boreal IFLs, a decrease in temperature or an increase in dormancy period precipitation may be a prime reason for the significant decrease in growing season NDVI. However, approximately two-thirds of the browning boreal IFLs did not respond to any of the climatic variables, indicating that other disturbance factors, such as fire, may dominate the browning. Nearly half of the no-change boreal IFLs showed a significant correlation between climatic variables and growing season NDVI, and most of these responded significantly positively to growing season temperature. Hence, more attention should be paid to these sensitive no-change boreal IFLs in light of future projected climate change.

Acknowledgments

Financial support for the study was provided by the China Postdoctoral Science Foundation (2015M570431), the Jiangsu Provincial Natural Science Foundation of China (BK20150579), the NSF China Major Program (41171324 & 41471343).

Author Contributions

Jiaxin Jin and Hong Jiang had the original idea for the study and, with all co-authors carried out the design. Ying Wang and Ming Cheng were responsible for recruitment and follow-up of study participants. Jiaxin Jin and Ming Cheng were responsible for data cleaning, Jiaxin Jin, Ying Wang and Hong Jiang carried out the analyses. Jiaxin Jin and Ying Wang drafted the manuscript, which was revised by all authors. All authors read and approved the final manuscript.

Conflicts of Interest

The authors declare no conflict of interest.

References

  1. Bonan, G.B. Forests and climate change: Forcings, feedbacks, and the climate benefits of forests. Science 2008, 320, 1444–1449. [Google Scholar] [CrossRef] [PubMed]
  2. Yu, G.; Zhang, L.; Sun, X.; Fu, Y.; Wen, X.; Wang, Q.; Li, S.; Ren, C.; Song, X.; Liu, Y.; et al. Environmental controls over carbon exchange of three forest ecosystems in eastern china. Glob. Chang. Biol. 2008, 14, 2555–2571. [Google Scholar] [CrossRef]
  3. Potapov, P.; Yaroshenko, A.; Turubanova, S.; Dubinin, M.; Laestadius, L.; Thies, C.; Aksenov, D.; Egorov, A.; Yesipova, Y.; Glushkov, I.; et al. Mapping the world’s intact forest landscapes by remote sensing. Ecol. Soc. 2008, 13, 51. [Google Scholar]
  4. Zhuravleva, I.; Turubanova, S.; Potapov, P.; Hansen, M.; Tyukavina, A.; Minnemeyer, S.; Laporte, N.; Goetz, S.; Verbelen, F.; Thies, C. Satellite-based primary forest degradation assessment in the democratic Republic of the Congo, 2000–2010. Environ. Res. Lett. 2013, 8, 279–288. [Google Scholar] [CrossRef]
  5. IFL Method-Intact Forest Landscapes. Available online: http://www.intactforests.org/method.html (accessed on 1 February 2016).
  6. Turner, I.M. Species loss in fragments of tropical rain forest: A review of the evidence. J. Appl. Ecol. 1996, 33, 200–209. [Google Scholar] [CrossRef]
  7. Yaroshenko, A.Y.; Potapov, P.V.; Turubanova, S.A. The Last Intact Forest Landscapes of Northern European Russia; Greenpeace Russia and Global Forest Watch: Moscow, Russia, 2001. [Google Scholar]
  8. Mollicone, D.; Achard, F.; Federici, S.; Eva, H.D.; Grassi, G.; Belward, A.; Raes, F.; Seufert, G.; Stibig, H.-J.; Matteucci, G.; et al. An incentive mechanism for reducing emissions from conversion of intact and non-intact forests. Clim. Chang. 2007, 83, 477–493. [Google Scholar] [CrossRef]
  9. Pptapov, P.; Laestadius, L.; Yaroshenko, A.; Turubanova, S. Global mapping and monitoring the extent of forest alteration: The intact forest landscapes method. Forest Resources Assessment Working Paper. 2009. Available online: http://www.fao.org/docrep/012/k7611e/k7611e00.pdf (accessed on 30 March 2016).
  10. IPCC. Summary for Policymakers. In Climate Change 2013: The Physical Science Basis; Cambridge University Press: Cambridge, UK; New York, NY, USA, 2013. [Google Scholar]
  11. Angertz, A.; Biraud, S.; Bonfils, C.; Henning, C.C.; Buermann, W.; Pinzon, J.; Tucker, C.J.; Fung, I. Drier summers cancel out the CO2 uptake enhancement induced by warmer springs. Proc. Natl. Acad. Sci. USA 2005, 102, 10823–10827. [Google Scholar] [CrossRef] [PubMed]
  12. Piao, S.; Wang, X.; Ciais, P.; ZHU, B.; Wang, T.; Liu, J. Changes in satellite-derived vegetation growth trend in temperate and boreal eurasia from 1982 to 2006. Glob. Chang. Biol. 2011, 17, 3228–3239. [Google Scholar] [CrossRef]
  13. Jin, J.; Jiang, H.; Peng, C.; Zhang, X.; Wang, Y.; Wang, J. Climate change contribution to forest growth in eastern china over past two decades. Terr. Atmos. Ocean. Sci. 2014, 25, 49–60. [Google Scholar] [CrossRef]
  14. Piao, S.; Ciais, P.; Friedlingstein, P.; Cadule, P.; Viovy, N.; Wang, T. Spatiotemporal patterns of terrestrial carbon cycle during the 20th century. Glob. Biogeochem. Cycles 2009, 23, 2191–2196. [Google Scholar] [CrossRef]
  15. Tan, K.; Piao, S.; Peng, C.; Fang, J. Satellite-based estimation of biomass carbon stocks for northeast china’s forests between 1982 and 1999. For. Ecol. Manag. 2007, 240, 114–121. [Google Scholar] [CrossRef]
  16. Piao, S.; Yin, G.; Tan, J.; Cheng, L.; Huang, M.; Li, Y.; Liu, R.; Mao, J.; Myneni, R.B.; Peng, S.; et al. Detection and attribution of vegetation greening trend in China over the last 30 years. Glob. Chang. Boil. 2015, 21, 1601–1609. [Google Scholar] [CrossRef] [PubMed]
  17. Tucker, C.; Pinzon, J.; Brown, M.; Slayback, D.; Pak, E.; Mahoney, R.; Vermote, E.; El Saleous, N. An extended AVHRR 8-km NDVI dataset compatible with MODIS and SPOT vegetation NDVI data. Int. J. Remote Sens. 2005, 26, 4485–4498. [Google Scholar] [CrossRef]
  18. De Jong, R.; Verbesselt, J.; Zeileis, A.; Schaepman, M.E. Shifts in global vegetation activity trends. Remote Sens. 2013, 5, 1117–1133. [Google Scholar] [CrossRef] [Green Version]
  19. Piao, S.; Fang, J.; Zhou, L.; Ciais, P.; Zhu, B. Variations in satellite-derived phenology in China’s temperate vegetation. Glob. Chang. Biol. 2006, 12, 672–685. [Google Scholar] [CrossRef]
  20. Zhou, L.; Tucker, C.J.; Kaufmann, R.K.; Slayback, D.; Shabanov, N.V.; Myneni, R.B. Variations in northern vegetation activity inferred from satellite data of vegetation index during 1981 to 1999. J. Geophys. Res. 2001, 106, 20069–20083. [Google Scholar] [CrossRef]
  21. Piao, S.; Nan, H.; Huntingford, C.; Ciais, P.; Friedlingstein, P.; Sitch, S.; Peng, S.; Ahlström, A.; Canadell, J.G.; Cong, N.; et al. Evidence for a weakening relationship between interannual temperature variability and northern vegetation activity. Nat. Commun. 2014, 5. Article 5018. [Google Scholar] [CrossRef] [PubMed] [Green Version]
  22. Wang, X.; Piao, S.; Ciais, P.; Li, J.; Friedlingstein, P.; Koven, C.; Chen, A. Spring temperature change and its implication in the change of vegetation growth in north america from 1982 to 2006. Proc. Natl. Acad. Sci. USA 2011, 108, 1240–1245. [Google Scholar] [CrossRef] [PubMed]
  23. Park, H.S.; Sohn, B.J. Recent trends in changes of vegetation over East Asia coupled with temperature and rainfall variations. J. Geophys. Res. 2010, 115, 1307–1314. [Google Scholar] [CrossRef]
  24. Zhao, M.; Running, S.W. Drought-induced reduction in global terrestrial net primary production from 2000 through 2009. Science 2010, 329, 940–943. [Google Scholar] [CrossRef] [PubMed]
  25. Peng, S.; Chen, A.; Xu, L.; Cao, C.; Fang, J.; Myneni, R.B.; Pinzon, J.E.; Tucker, C.J.; Piao, S. Recent change of vegetation growth trend in China. Environ. Res. Lett. 2011, 6, 44027–44039. [Google Scholar] [CrossRef]
  26. Bryant, D.; Nielsen, D.; Tangley, L.; Sizer, N.; Miranda, M.; Brown, P.; Johnson, N.; Malk, A.; Miller, K. The last frontier forests: Ecosystems and economies on the edge. What is the status of the worlds remaining large natural forest ecosystems? 1997. Available online: http://www.popline.org/node/526187 (accessed on 20 April 2015).
  27. Intact Forest Landscapes. Available online: http://www.intactforests.org/data.ifl.html (accessed on 10 October 2015).
  28. Centre for Environmental Data Analysis. Available online: http://browse.ceda.ac.uk/browse/badc/cru/data/cru_ts/cru_ts_3.23/data (accessed on 30 June 2015).
  29. New, M.; Hulme, M.; Jones, P. Representing twentieth-century space-time climate variability. Part ii: Development of 1901–96 monthly grids of terrestrial surface climate. J. Clim. 2000, 13, 2217–2238. [Google Scholar] [CrossRef]
  30. Land Processes Distributed Active Archive Center. Available online: https://lpdaac.usgs.gov/dataset_discovery/modis/modis_products_table/mod13c2 (accessed on 28 April 2015).
  31. Farrer, E.C.; Ashton, I.W.; Spasojevic, M.J.; Fu, S.Y.; Gonzalez, D.J.X.; Suding, K.N. Indirect effects of global change accumulate to alter plant diversity but not ecosystem function in alpine tundra. J. Ecol. 2015, 103, 351–360. [Google Scholar] [CrossRef]
  32. Chen, C.; Chen, D.L.; Pan, J.J.; Lam, S.K. Analysis of factors controlling soil N2O emission by principal component and path analysis method. Environ. Earth Sci. 2014, 72, 1511–1517. [Google Scholar] [CrossRef]
  33. Brown, R.D.; Robinson, D.A. Northern hemisphere spring snow cover variability and change over 1922–2010 including an assessment of uncertainty. Cryosphere Discuss. 2010, 5, 219–229. [Google Scholar] [CrossRef]
  34. Peng, S.; Piao, S.; Ciais, P.; Friedlingstein, P.; Zhou, L.; Wang, T. Change in snow phenology and its potential feedback to temperature in the northern hemisphere over the last three decades. Environ. Res. Lett. 2013, 8, 1880–1885. [Google Scholar] [CrossRef]
  35. Piao, S.; Tan, J.; Chen, A.; Fu, Y.H.; Ciais, P.; Liu, Q.; Janssens, I.A.; Vicca, S.; Zeng, Z.; Jeong, S.-J.; et al. Leaf onset in the northern hemisphere triggered by daytime temperature. Nat. Commun. 2015. [Google Scholar] [CrossRef] [PubMed]
Figure 1. Boreal intact forest landscapes (IFLs) during 2000–2013 in the study area.
Sustainability 08 00326 g001
Figure 2. GS-NDVI trends of the boreal IFLs from 2000 to 2013 in the study area. The color represents the regression slope of IFL GS-NDVI as a function of time. NS represents no significant change.
Sustainability 08 00326 g002
Figure 3. Spatial patterns of the greening boreal intact forest landscapes dominated by (a) growing season temperature; (b) growing season precipitation; (c) dormancy period temperature; (d) dormancy period precipitation; and (e) none of the climatic variables. PCC presents the Pearson correlation coefficient between the growing season NDVI and dominant climatic variable. NS represents no significant correlation.
Sustainability 08 00326 g003
Figure 4. Spatial patterns of the browning boreal intact forest landscapes dominated by (a) growing season temperature; (b) growing season precipitation; (c) dormancy period temperature; (d) dormancy period precipitation; and (e) none of the climatic variables. PCC presents the Pearson correlation coefficient between the growing season NDVI and dominant climatic variable. NS represents no significant correlation.
Sustainability 08 00326 g004
Figure 5. Spatial patterns of the no-change boreal intact forest landscapes dominated by (a) growing season temperature; (b) growing season precipitation; (c) dormancy period temperature; (d) dormancy period precipitation; and (e) none of the climatic variables. PCC presents the Pearson correlation coefficient between the growing season NDVI and dominant climatic variable. NS represents no significant correlation.
Sustainability 08 00326 g005

