Article

Spatio-Temporal Variations of Rain-Use Efficiency in the West of Songliao Plain, China

School of Geographical Sciences, Northeast Normal University, Renmin Street 5268, Changchun 130024, China
*
Author to whom correspondence should be addressed.
Sustainability 2016, 8(4), 308; https://doi.org/10.3390/su8040308
Submission received: 31 January 2016 / Revised: 16 March 2016 / Accepted: 21 March 2016 / Published: 26 March 2016

Abstract

:
Spatio-temporal patterns of rain-use efficiency (RUE) can explicitly present the steady-state of ecosystem water use and thus ecosystem functioning. The west of Songliao Plain, located along the east fringe of the agro-pasture transitional zone in northern China, is highly sensitive to global change. In this study, satellite-based RUE was calculated using time series SPOT VEGETATION (SPOT-VGT) Normalized Difference Vegetation Index (NDVI) images and precipitation data for the study area from 1999 to 2011. Based on regression model by fitting simple linear regression through the pixel-based time series of RUE in the growing season and calculating the slopes, the change trend of RUE was determined. The grey relational analysis (GRA) method was extended to the spatial scale, and used to select sensitive climate and socio-economic factors that affected RUE variations. The result demonstrated that vegetation RUE increased slightly with an undulating trend, implying the ecosystem function tended to improve between 1999 and 2011. In total, 4.23% of the total area had experienced a significant increase in RUE, whereas 1.29% of the total area presented a significant decrease. Areas showing increased RUE trends mostly coincided with areas of land cover conversions from grassland to forest, shrub to forest and cropland to forest, which suggested a positive linkage with ecological protection policy and projects at national and local levels. Based on the obtained spatial Grey Relation Grade (GRG) values, the pattern of the impact factors clearly showed a spatial heterogeneity. Spatially, sunshine duration, temperature and population density were most closely related to RUE in the west of Songliao Plain between 1999 and 2011.

1. Introduction

Vegetation affects several processes, including water balance, absorption and reemission of solar radiation, latent and sensible heat fluxes, the carbon cycle, etc. The demand for latest information on the vegetation cover with regard to climate and ecosystems change has increased recently. Aboveground net primary production (ANPP) indicates an ecosystem’s ability to capture solar energy and convert it to organic carbon or biomass [1]. ANPP has been suggested as an integrative measure of ecosystem functioning and a key variable in assessing the effects of land use changes on ecosystem conditions [2]. Rain-use efficiency (RUE) is defined as the ratio of ANPP to precipitation, i.e., the number of kilograms of aerial dry matter phytomass produced over one ha in a year per one millimeter of rain fallen [3]. Le Houérou et al. stated that a stable value (≈ four kilogram dry matter/ha/year/mm rainfall) could be found throughout the various arid and semi-arid zones of the world and is independent of the plant species [4]. A decrease in RUE reflects a declined capacity of the vegetation to transform water (and nutrients) into biomass [5,6]. The process of vegetation degradation may involve a range of processes including the loss of vegetation cover, the decreasing availability of plant nutrients or the increases in run off due to compaction of top soil [7]. It has been suggested that RUE can normalize the inter-annual variability in ANPP caused by rainfall variability. Consequently, RUE provides an index of degradation that is independent of the effects of rainfall [8,9,10].
The spatio-temporal patterns of RUE can explicitly present the steady-state of ecosystem water use and thus ecosystem functioning. RUE is an essential parameter used in ecosystem management [9,11,12,13,14]. More recently, much work has been done to assess the relationship between non-precipitation and land degradation in arid and semi arid area by using time-series of RUE estimated wholly or partly based on satellite remote sensing or ground measurements [3,9,15,16,17,18,19,20,21,22]. Understanding how RUE responds to climatic changes is critical to accurately forecast terrestrial C-cycle response and feedback to climate change [23]. In the past, many attempts were made to address the relationship between RUE and precipitation at both temporal and spatial scales [11,12,13,14,24,25]. To our knowledge, the analysis of the relationships of RUE with other climatic factors, such as temperature and solar duration, land use/cover change and socio-economic development, is still unavailable.
The west of Songliao Plain, located along the east fringe of farming-pastoral transitional zone in northern China, is highly sensitive to global change. Historically, this region fostered both agricultural and nomadic culture. Owing to the combined effects of vulnerable physical basis, i.e., arid climate, thick sandy soil, strong wind in winter and spring, and excessive human activities, such as increasing population, irrational and large scale land reclamation, and over grazing, the west of Songliao Plain suffers from the high risk of sandy desertification during the past century. The concerns for the aggravation of desertification by Chinese government and local citizens have led to many measures for ecological and environmental protection of the core sandy lands in this area [26]. The ecological and environmental restoration projects, such as the “Three-North Shelterbelt Project” and the “Grain for Green Project” initiated in 1978 and 1999, respectively, have achieved preliminary success. The trend of desertification exacerbation has gradually slowed down [27,28]. Some existing studies have attempted to evaluate land desertification using rain-use efficiency or analyzing primary production and RUE response to precipitation in sandy land area or Inner Mongolia [12,29,30]. However, little has been known about the spatial-temporal pattern of RUE in the west of Songliao Plain. No previous studies took both climate condition and socio-economic factors into account.
The main purposes of this study are: (1) investigate inter-annual variability and trends of the RUE in the west of Songliao Plain for the period of 1999 to 2011 based on multitemporal SPOT VEGETATION (SPOT-VGT) Normalized Difference Vegetation Index (NDVI) and meteorological data; and (2) analyze the relationship between vegetation RUE variations, main climatic variables, local socio-economic factors and land use/cover changes. The result may offer scientific evidence for the land management and landscape ecological regulation in this region.

2. Materials and Methods
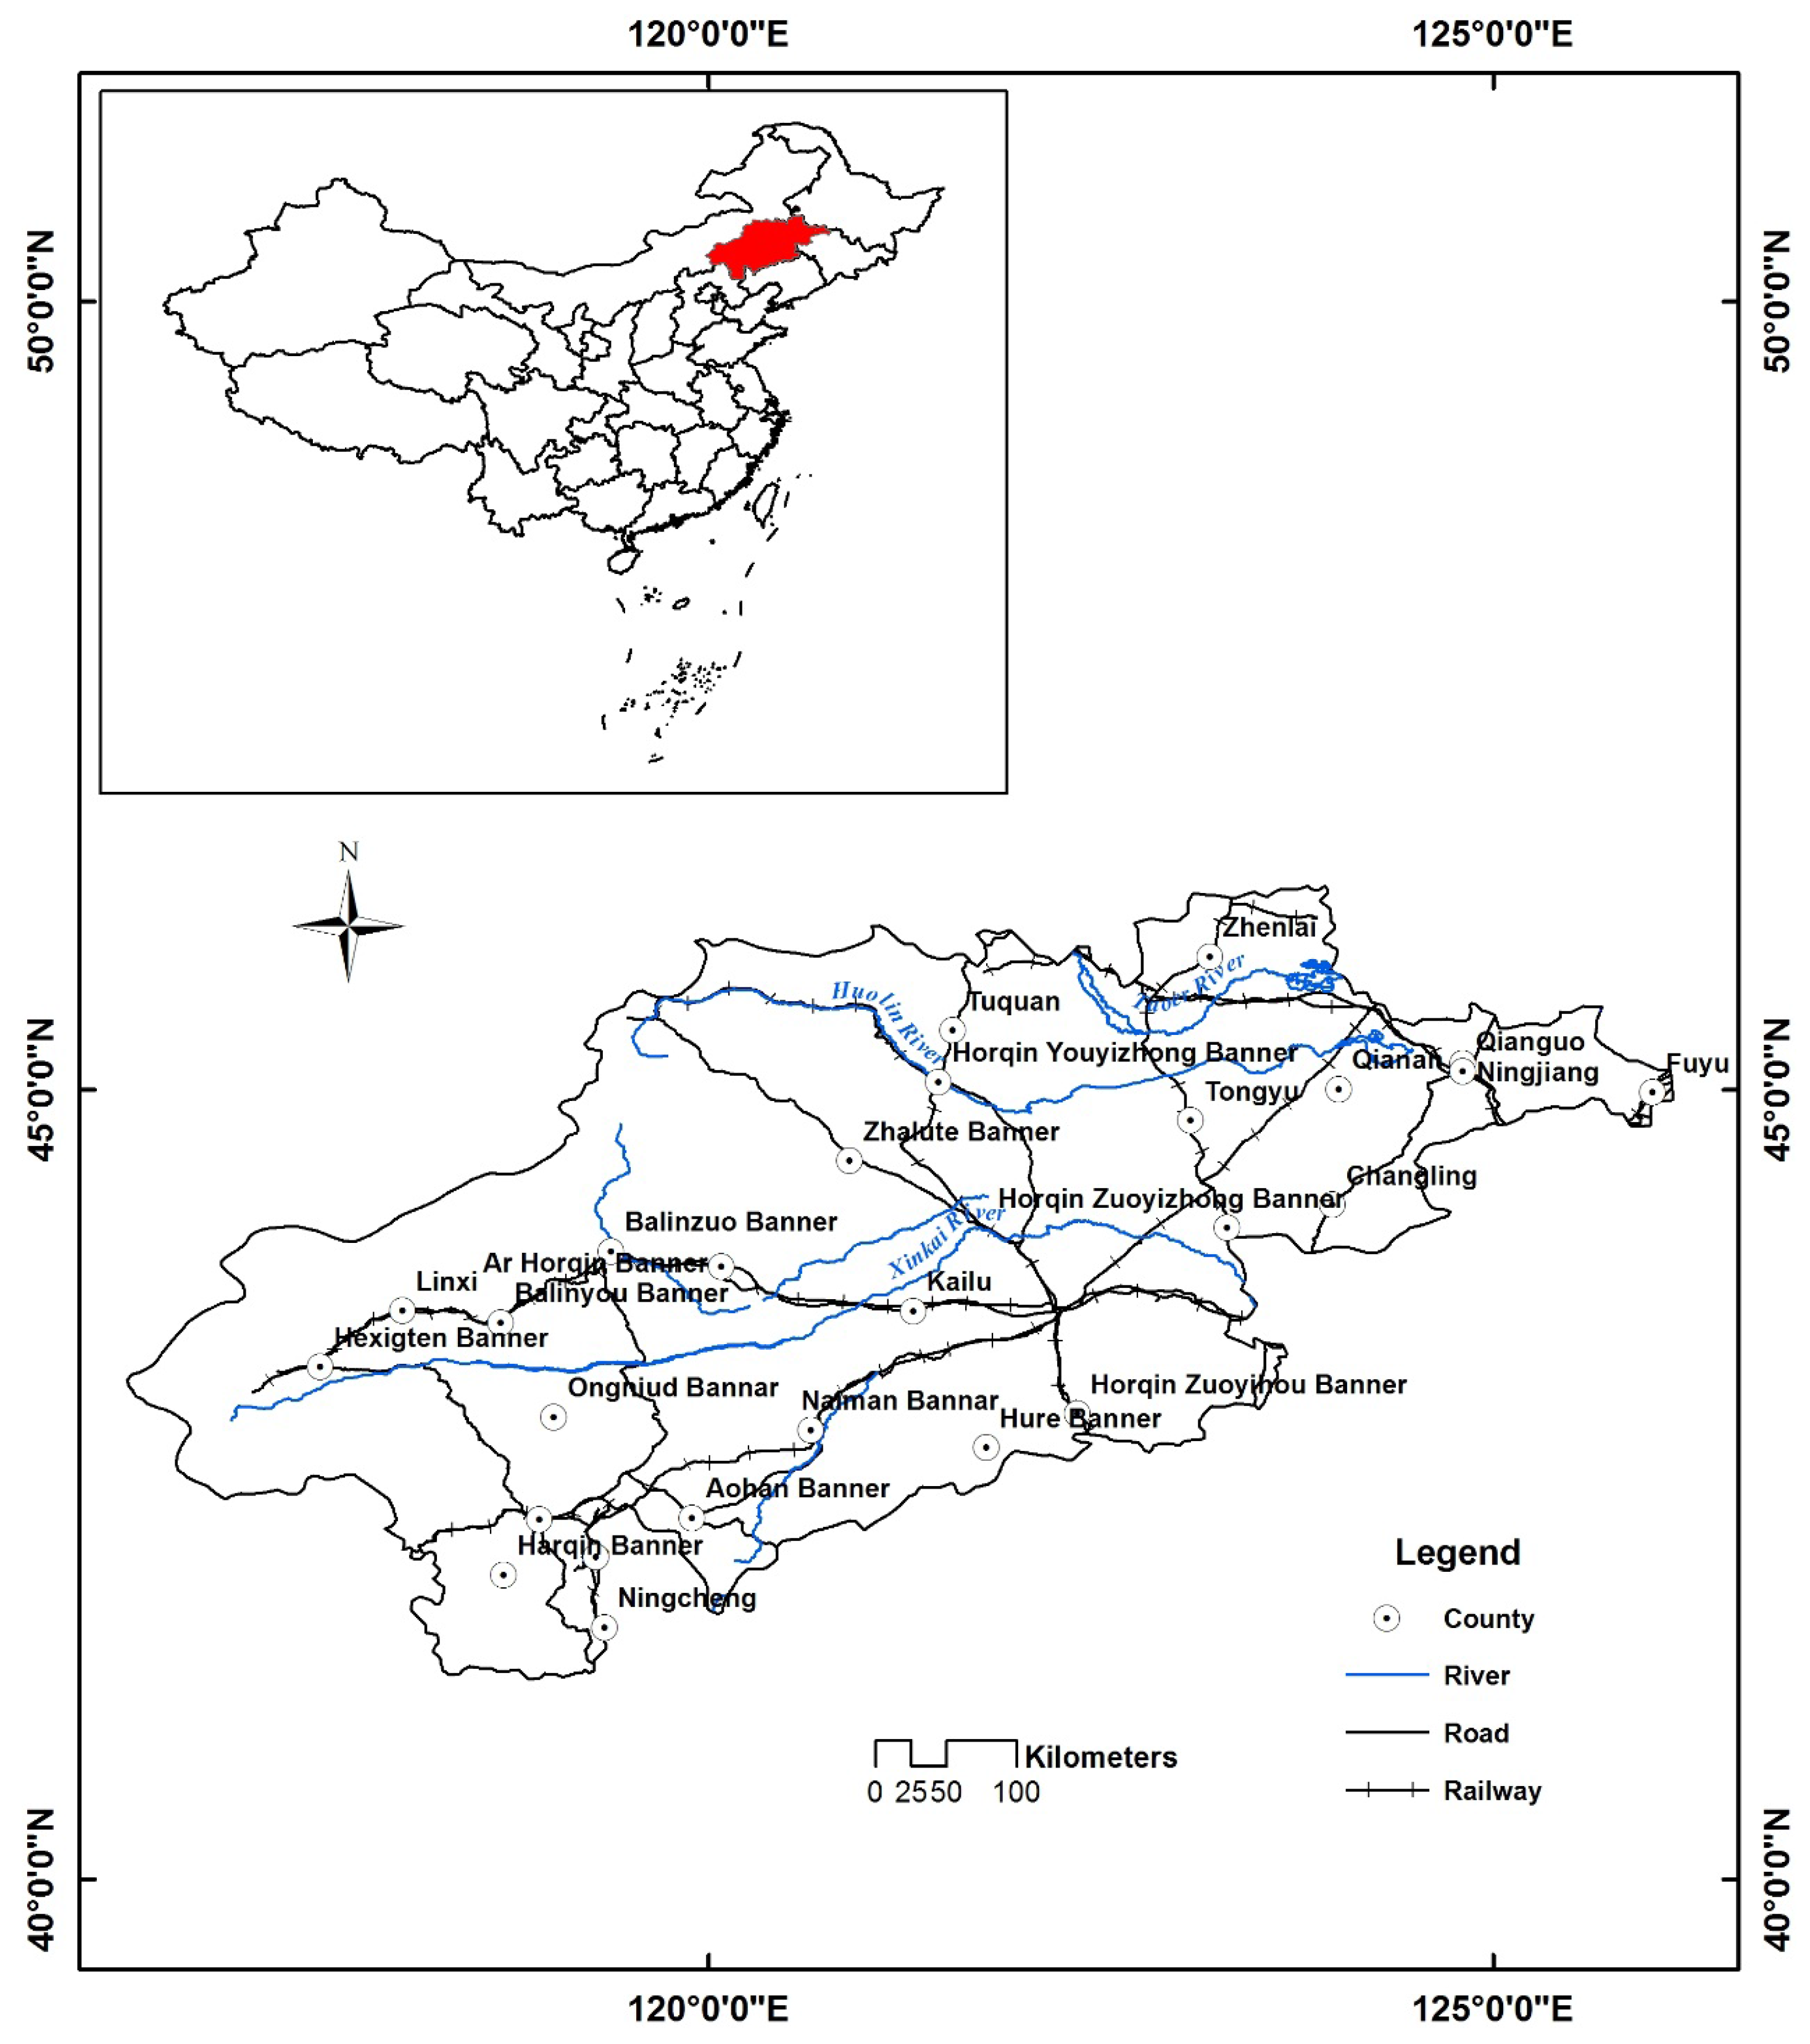
2.1. Study Area

The west of Songliao Plain is located in 121°38′–126°11′E, 43°22′–46°18′N, covering an area of about 216,871 km2 (Figure 1). It is characteristic of temperate continental semi-arid monsoon climate, with windy and dry winters and springs, and warm and comparatively wet summers, followed by short and cool autumns [30]. Based on the meteorological data between 1953 and 2010 from 14 weather stations in this region for the years, the average annual temperature ranges from 4.3 °C (Sanchahe station) to 7.3 °C (Chifeng station). Mean annual precipitation varies from 321 mm (Changling station) to 516 mm (Sanchahe station), with most precipitation occurring between June and August. Annual mean evaporation in this region is 4–6 times annual rainfall. For instance, the average annual precipitation of Chifeng is about 370 mm, while the average evaporation reaches 2029 mm [31]. The probability of spring drought occurrence is 50%–80%, and autumn and summer drought 15%–35%. Soil types include chernozem, chestnut soil, sandy soil, meadow soil and saline-alkali soil. The natural vegetation is mainly composed of Leymus chinensis, Stipa grandis and Agropyron cristatum, Salix flavida, Cleistogenes, Calamagrostis epigeios, and Iris lacteal communities with sparsely scattered woods (mainly Ulmus pumila). The original vegetation has greatly changed during the past several decades, mainly due to long-term overgrazing and over cultivation. Since the mid 1970s, some desertification controlling efforts, such as placing sand arresters (straw checkerboards), planting the indigenous trees, shrubs and grasses adaptive to sandy land, and fencing grassland against grazing, have been carried out in some parts of the region [32]. Administratively, the studied area encompasses 30 banners (counties or cities) in Inner Mongolian Autonomous Region and Jilin Province. The total population increased by 4.38% from 12,797,900 in 1999 to 13,358,889 persons in 2011. In this fragile area of northern China, the livelihood for the majority of the population depends on agriculture and livestock husbandry. In recent years, several large ecological restoration programs have been implemented including the “Grain for Green Project” since 1999 [33] and the “Beijing and Tianjin Sandstorm Source Controlling Project” since 2000 [26], which have been led to the improvements of sand dune area in some counties.

2.2. Data Collection and Processing

The SPOT VEGETATION decadal composite images were the basis of this study. Compared to the AVHRR sensors, SPOT-VGT instruments have some advantages such as improved navigation and radiometric sensitivity [34]. Multi-temporal geo-location accuracy of the VGT data is particularly good (absolute location < 0.8 km, multispectral registration < 0.2 km and multi-temporal registration for 1 year < 0.5 km). Therefore, the data are well suitable for the application in detecting land cover change [35,36,37,38].
VGT products include VGT-P (physical product), VGT-S1 (daily synthesis product) and VGT-S10 (10-day synthesis product). In this study, a total of 468 VGT-S10 composite images for the period of 1–10 January 1999 and 21–31 December 2011 covering Southeast Asia were accessed by the Vlaamse Instelling voor Technologisch Onderzock (VITO) Image Processing center (Mol, Antwerp, Belgium) [39]. The images were clipped using a study area border executed in ENVI 4.8 Software. The VGT images are in Plate carrée projection, with a 0.0089285714-degree spatial resolution and digital number (DN) values ranging from 0 to 255. The original VGT data were projected to the Universal Transverse Mercator (UTM) projection with datum WGS84. The real NDVI was converted from DN values with the formula NDVI = DN × 0.004 − 0.1. All three 10-day-synthesis products in every month were combined into the monthly NDVI dataset using a maximum value composite approach. The growing season NDVI datasets were generated from the monthly NDVI dataset (April to October each year) by cumulative method.
Monthly meteorological data of 23 weather stations in and near the studied area from 1999 to 2011 were acquired from the National Meteorological Information Center of China (http://data.cma.cn) [40]. Total precipitation, accumulated sunshine hours, average temperature and average relative humidity in the growing season were computed for studying the correlation of vegetation RUE change with the above factors. The gridded precipitation, sunshine hours and humidity data with the same spatial resolution (1 km × 1 km) as the NDVI data were obtained through Radial Basis Functions interpolation, while the gridded temperature data were derived from Co-kriging interpolation due to the effects of elevation.
Land cover information is obtained from moderate-resolution imaging spectrometer (MODIS) global land cover type dataset [41]. The MCD12Q1 images with spatial scale of 500 m were acquired between 2001 and 2011. Land cover classes are defined based on the International Geosphere-Biosphere Program (IGBP) 17-class scheme [42]. In this paper, land cover in the western part of the Songliao Plain was grouped into 8 classes, namely, water bodies, forest, shrub, grassland, cropland, urban area, wetland and unused land. These images were transformed into the same projection as the NDVI products and subset for the study area.
The socio-economic variables, including population, gross domestic product (GDP), grain yield and the number of livestock for 30 banners (counties or cities), were collected from local economic statistical datasets during 2000–2012 [43,44]. The annual statistical data of the counties or cities were firstly linked with the attribute table of the administrative map using JOIN function within ArcGIS. The vector maps were then converted to raster format using a grid-cell unit of 1 km2 by Vector to Raster tool of GIS. A total of 52 grid maps of four variables, i.e., population density, GDP, grain yield and the number of livestock were produced within ArcGIS and then used to perform a correlation analysis.

2.3. Methods

2.3.1. Calculation of RUE

RUE can be derived from remote sensing estimation of production (e.g., NDVI) and rainfall data [8,9,10,24,45,46,47,48]. In arid and semi-arid lands, seasonal sums of multi-temporal NDVI are strongly correlated with vegetation production [8,49,50,51]. Annually or seasonally summed NDVI is often assumed to be an appropriate proxy for ANPP in semi-arid areas [9,21,52,53,54]. In this study, monthly NDVI-values were summed over the growing season as a substitute for ANPP. RUE was computed by the following equation:
R U E = i = 4 10 N D V I i P
where N D V I i is the average NDVI value of month i, i = 4 10 N D V I i is the summed NDVI in the growing season (April to October), and P represents the accumulated precipitation over the growing season.

2.3.2. Determination of the Trends in RUE Change

A temporal trend analysis using the ordinary least squares (OLS) regression technique on the basis of a linear regression model (Y = a + bX) [55,56] is applied to estimate the trend in vegetation RUE change in this study, in which X and Y represents year number and RUE over the period from 1999 to 2011, respectively:
S L O P E = n × i = 1 13 i × M i i = 1 13 i i = 1 13 M i n × i = 1 13 i 2 ( i = 1 13 i ) 2
where SLOPE is the slope of the fitted regression line of the growing season RUE at each pixel, n represents year range, and i is 1 for the first year, 2 for the second year, and so on. A negative regression coefficient (SLOPE < 0) indicates a decline of RUE, thereby implying vegetation degradation. A positive value (SLOPE > 0) depicts an increase trend of RUE from the first to the last year, which suggests improved vegetation activity. F-statistics were used to determine the significance of linear regression models. According to the SLOPE value and significant levels, the change trends of RUE are classified into seven types: (1) highly significant decrease (SLOPE < 0, p ≤ 0.01); (2) significant decrease (SLOPE < 0, 0.01 < p ≤ 0.05); (3) moderately significant decrease (SLOPE < 0, 0.05 < p ≤ 0.1); (4) no significant change (p > 0.1); (5) moderately significant increase (SLOPE < 0, 0.05 < p ≤ 0.1); (6) significant increase (SLOPE > 0, 0.01 < p ≤ 0.05); and (7) highly significant increase (SLOPE > 0, p ≤ 0.01).

2.3.3. Grey Correlation Analysis

Grey correlation analysis (GRA) is a systematic analysis method proposed in the Grey System theory [57,58]. Based on geometrical mathematics, GRA complies with the principles of normality, symmetry, entirety, and proximity [59,60]. It is mainly used to conduct a relational analysis of the uncertainty of a system model and the incompleteness of information [61]. With grey correlation analysis, the relationship between multiple factors can be analyzed objectively, and the important evaluation factors are preserved and unimportant factors are deleted. This method is a distinct similarity measurement approach that uses data series to obtain grey relational order to describe the relationship between the related series [62]. The relative distance between a compared data series and the reference data series, which is referred to as grey relational grade (GRG), represents the degree of influence between these series. A small distance indicates a significant influence [63]. GRG value is between 0 and 1. GRG value close to 1 indicates that there is a strong relationship between the two series.
To identify the main impact factors for the changes of RUE, GRA method was extended to the spatial scale by calculating the GRG values for each grid within ArcGIS in this study. Climate change is one of the main drivers of the interannual variation in vegetation activity. We considered precipitation, temperature, relative humidity, solar duration as the natural factors for the period of 1999–2011. Vegetation degradation and restoration in arid and semi arid area are also closely related to human activities. For a typical farming-grazing transitional zone, increasing population and grain yield may indicate the demands and intensity of agriculture activities, while the livestock number reflects the scale of animal husbandry production. GDP is a broad measurement of regional overall economic activity, which may be related to the financial investment of ecological environment protection. Therefore, the impacts of socio-economic factors, such as population, agriculture and economic scale on RUE, were also taken into account. A total of eight factors were finally selected, namely, the total precipitation, accumulated sunshine hours, average temperature, average relative humidity over the growing season, population density, GDP, grain production and the number of livestock.
The original data series of the above eight impact factors were normalized by an averaging method in which all the values of each impact factor series were divided by the mean value of the series. The original series were converted to a set of comparable series. RUE for the studied period is the reference series X0 and the compared series of eight impact factors are represented by X1, X2, …, Xi, (i = 1–8). Then the grey relational coefficient ξxi(t) of compared series Xi(t) to reference series X0(t) at time t for each pixel was calculated using the following equation:
ξ X i ( t ) = min i min t | X 0 ( t ) X i ( t ) | + ρ max i max t | X 0 ( t ) X i ( t ) | | X 0 ( t ) X i ( t ) | + ρ max i max t | X 0 ( t ) X i ( t ) | = Δ min + ρ Δ max Δ x 0 i ( t ) + ρ Δ max
where X0 and Xi are the reference data series (RUE) and compared data series (the impact factors) after normalization; Δ x 0 i ( t ) represents the absolute difference between two series. Δmin and Δmax denote the distance for each time in all compared sequences. ρ is the distinguishing coefficient used to adjust the difference of the relational coefficient ranges between zero and one [64]. Considering the moderate distinguishing effects and good stability of outcomes, the suggested value of ρ is usually 0.1–0.5. We adopted ρ = 0.1 for further analysis in this study. Finally, Yi, namely GRG, is the average value of grey relational coefficient defined as follows:
Y i = 1 13 Σ t = 1 13 ξ i ( t )
where ξ i ( t ) is the distinguishing coefficient. Yi represents the level of correlation between the reference series (RUE) and the compared series (impact factors) during past 13 years. If a particular comparability sequence has more influence on the reference sequence than the other ones, the GRG for comparability and reference sequence will exceed that for the other grey relational grades. The grey relational order is constructed based on the calculated value of Yi. The grey relational grade is correlated with the influence of the specific factor on RUE change.

3. Results

3.1. RUE Changes

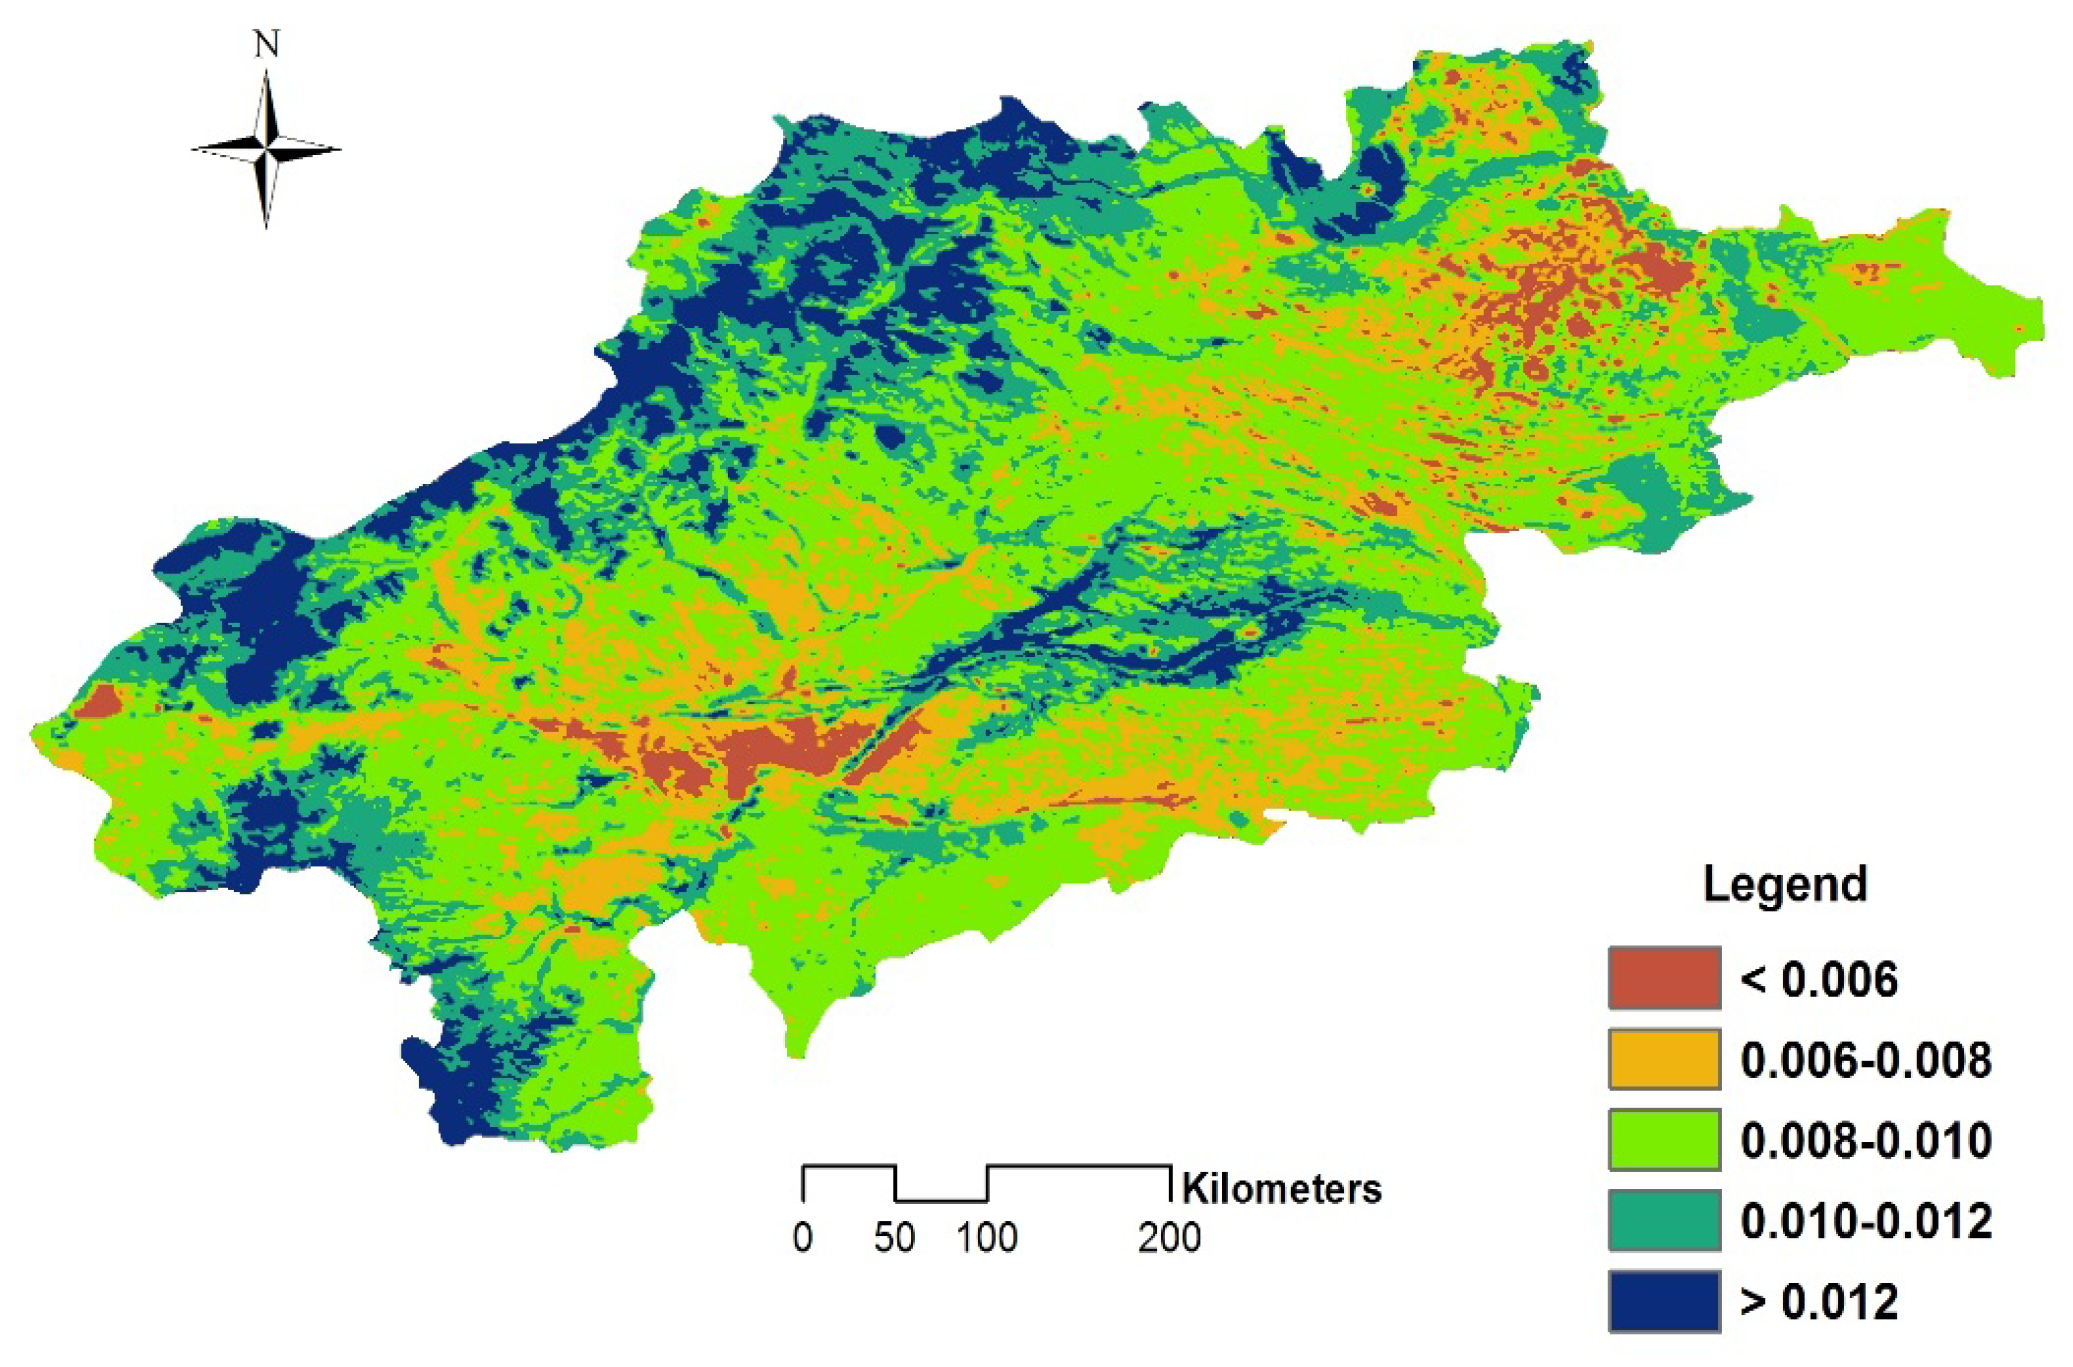
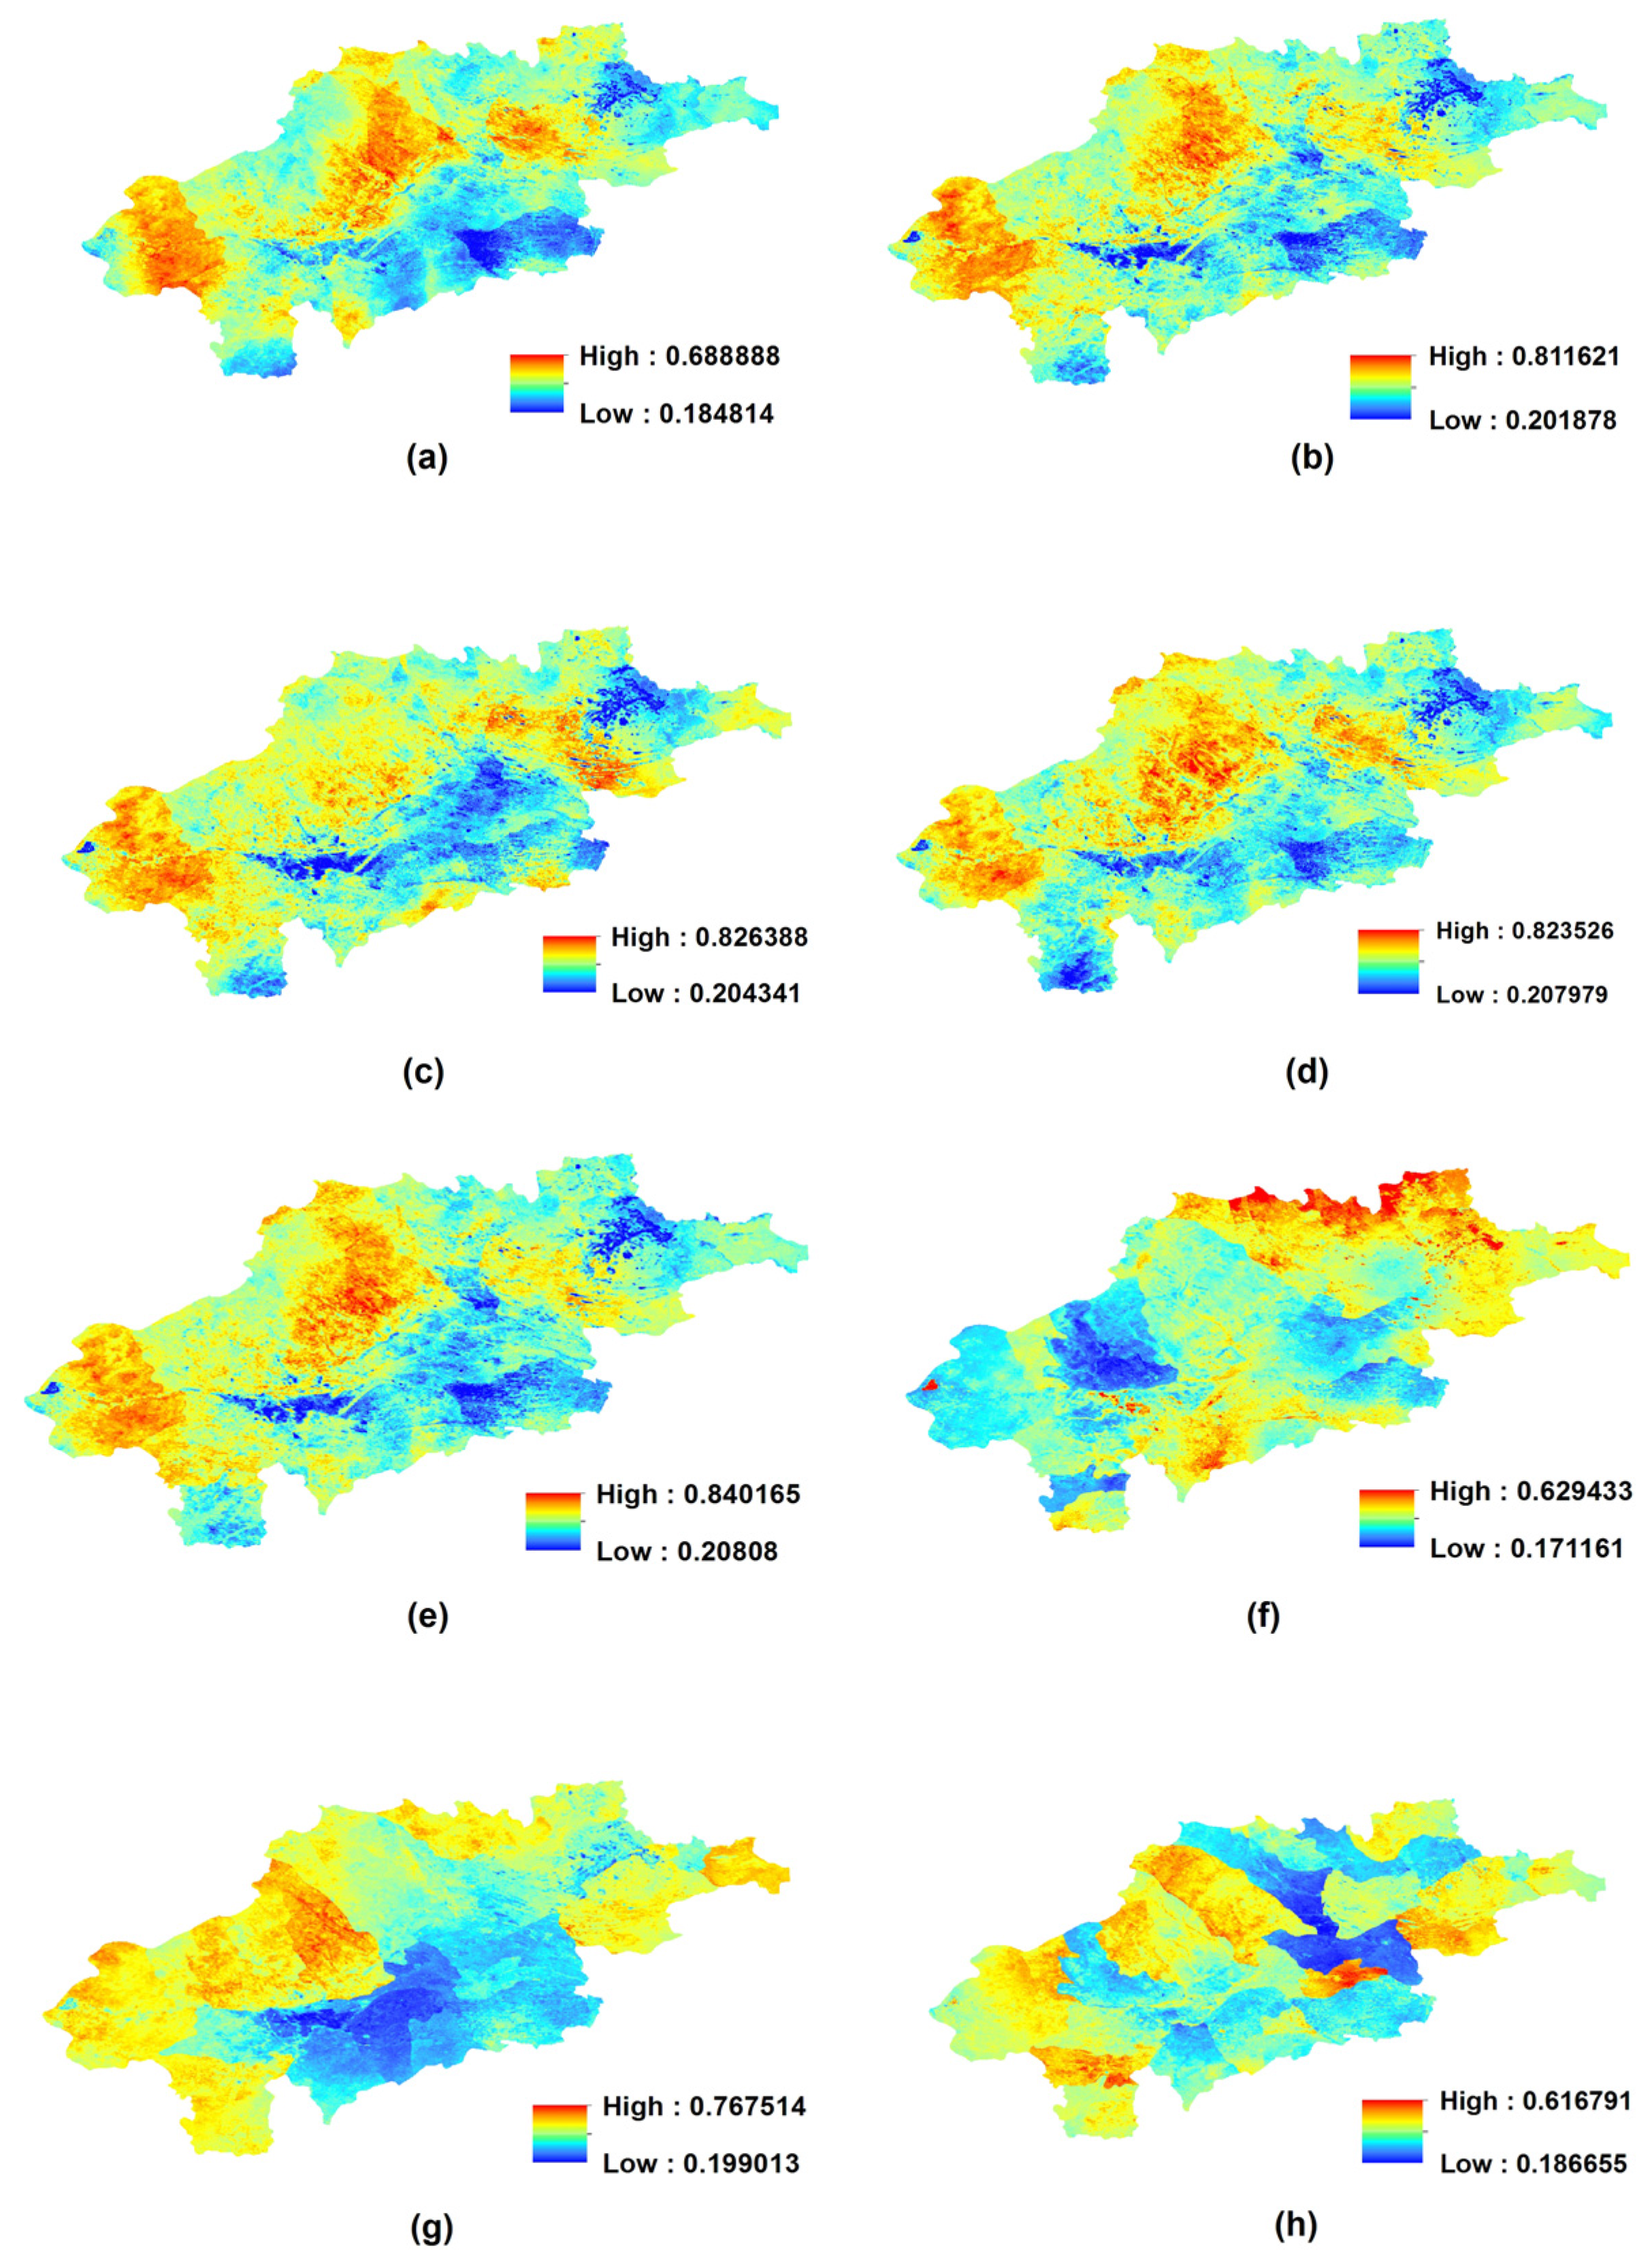
3.1.1. Spatial Pattern

Spatial characteristic of average RUE in the west of Songliao Plain is shown in Figure 2. RUE values were increased from center to the surrounding in the whole. The regions with mean RUE of less than 0.006 were mostly occupied by saline-alkali land and open shrub land, taking up approximately 3.39% of the land. The places with RUE values of 0.006–0.010 covering 63.13% of the studied area were dominated by grassland and some cropland. RUE values greater than 0.01 were mainly concentrated in the northwest and southwest of the studied area. RUE values ranging from 0.010 to 0.012 and greater than 0.012 covered 22.65% and 10.84% of the land area, respectively. The multi-year average RUE values were greater than 0.010 in northwest of the studied area, which indicated relatively better maintenance of ecosystem function. The average RUE (0.0117) in Baicheng City was the highest, followed by 0.0112 in Tuquan County and 0.0111 in Tongliao City. In Daan City, Qianan County, Hure Banner and Ongniud Bannar, which were covered by large areas of saline-alkali land and open shrubs, the lower RUE (<0.008) in these regions indicated poor vegetation activity.

3.1.2. Interannual Changes
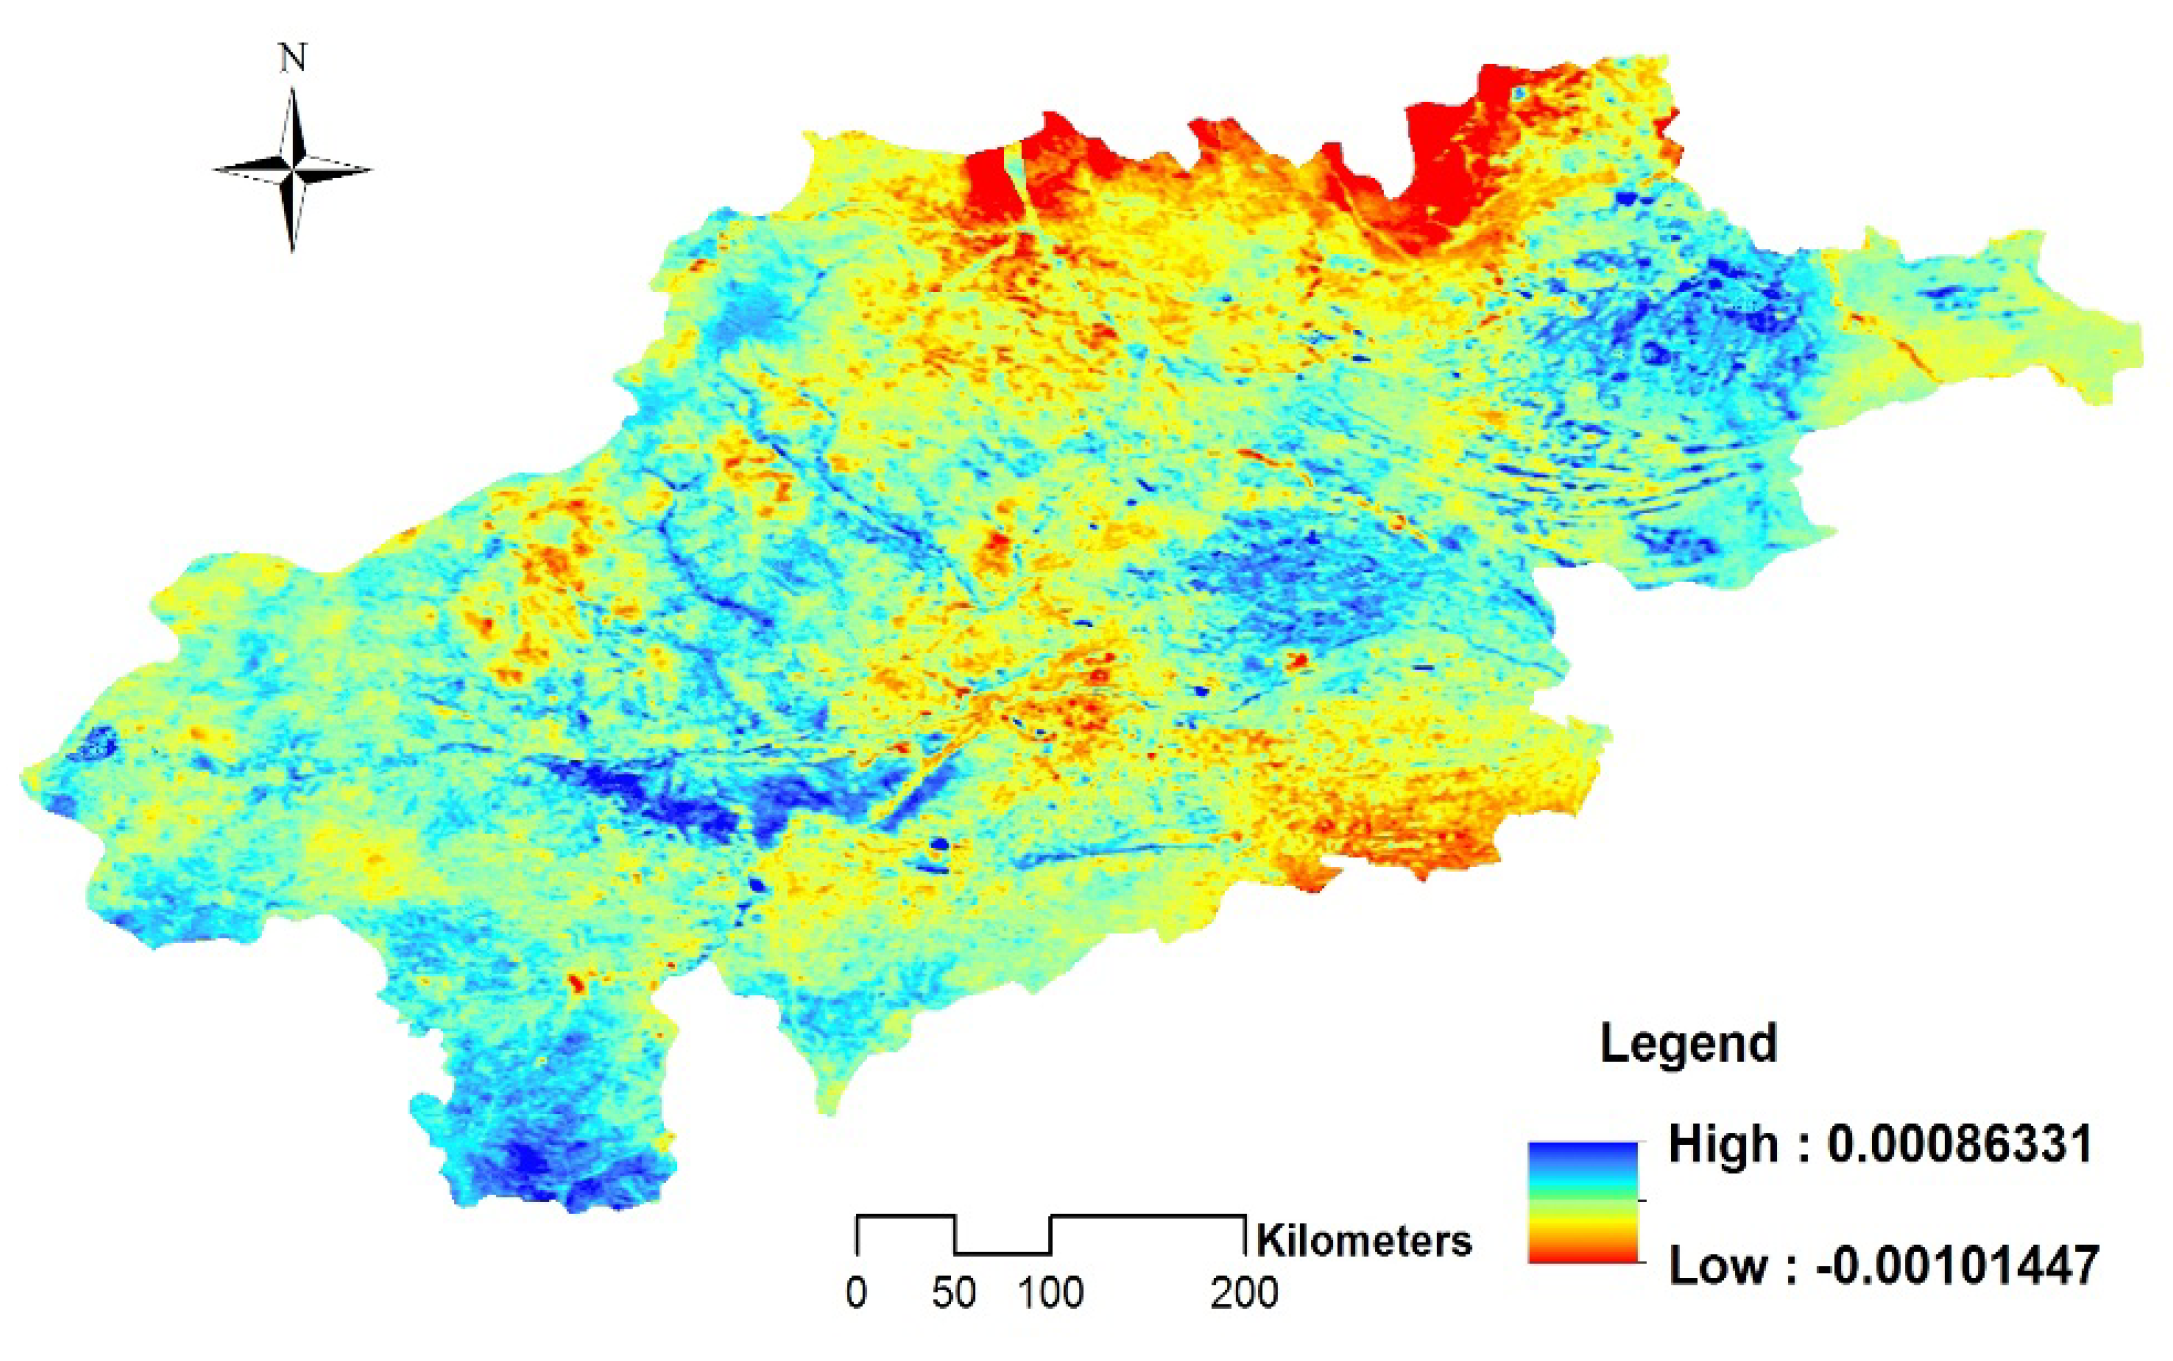
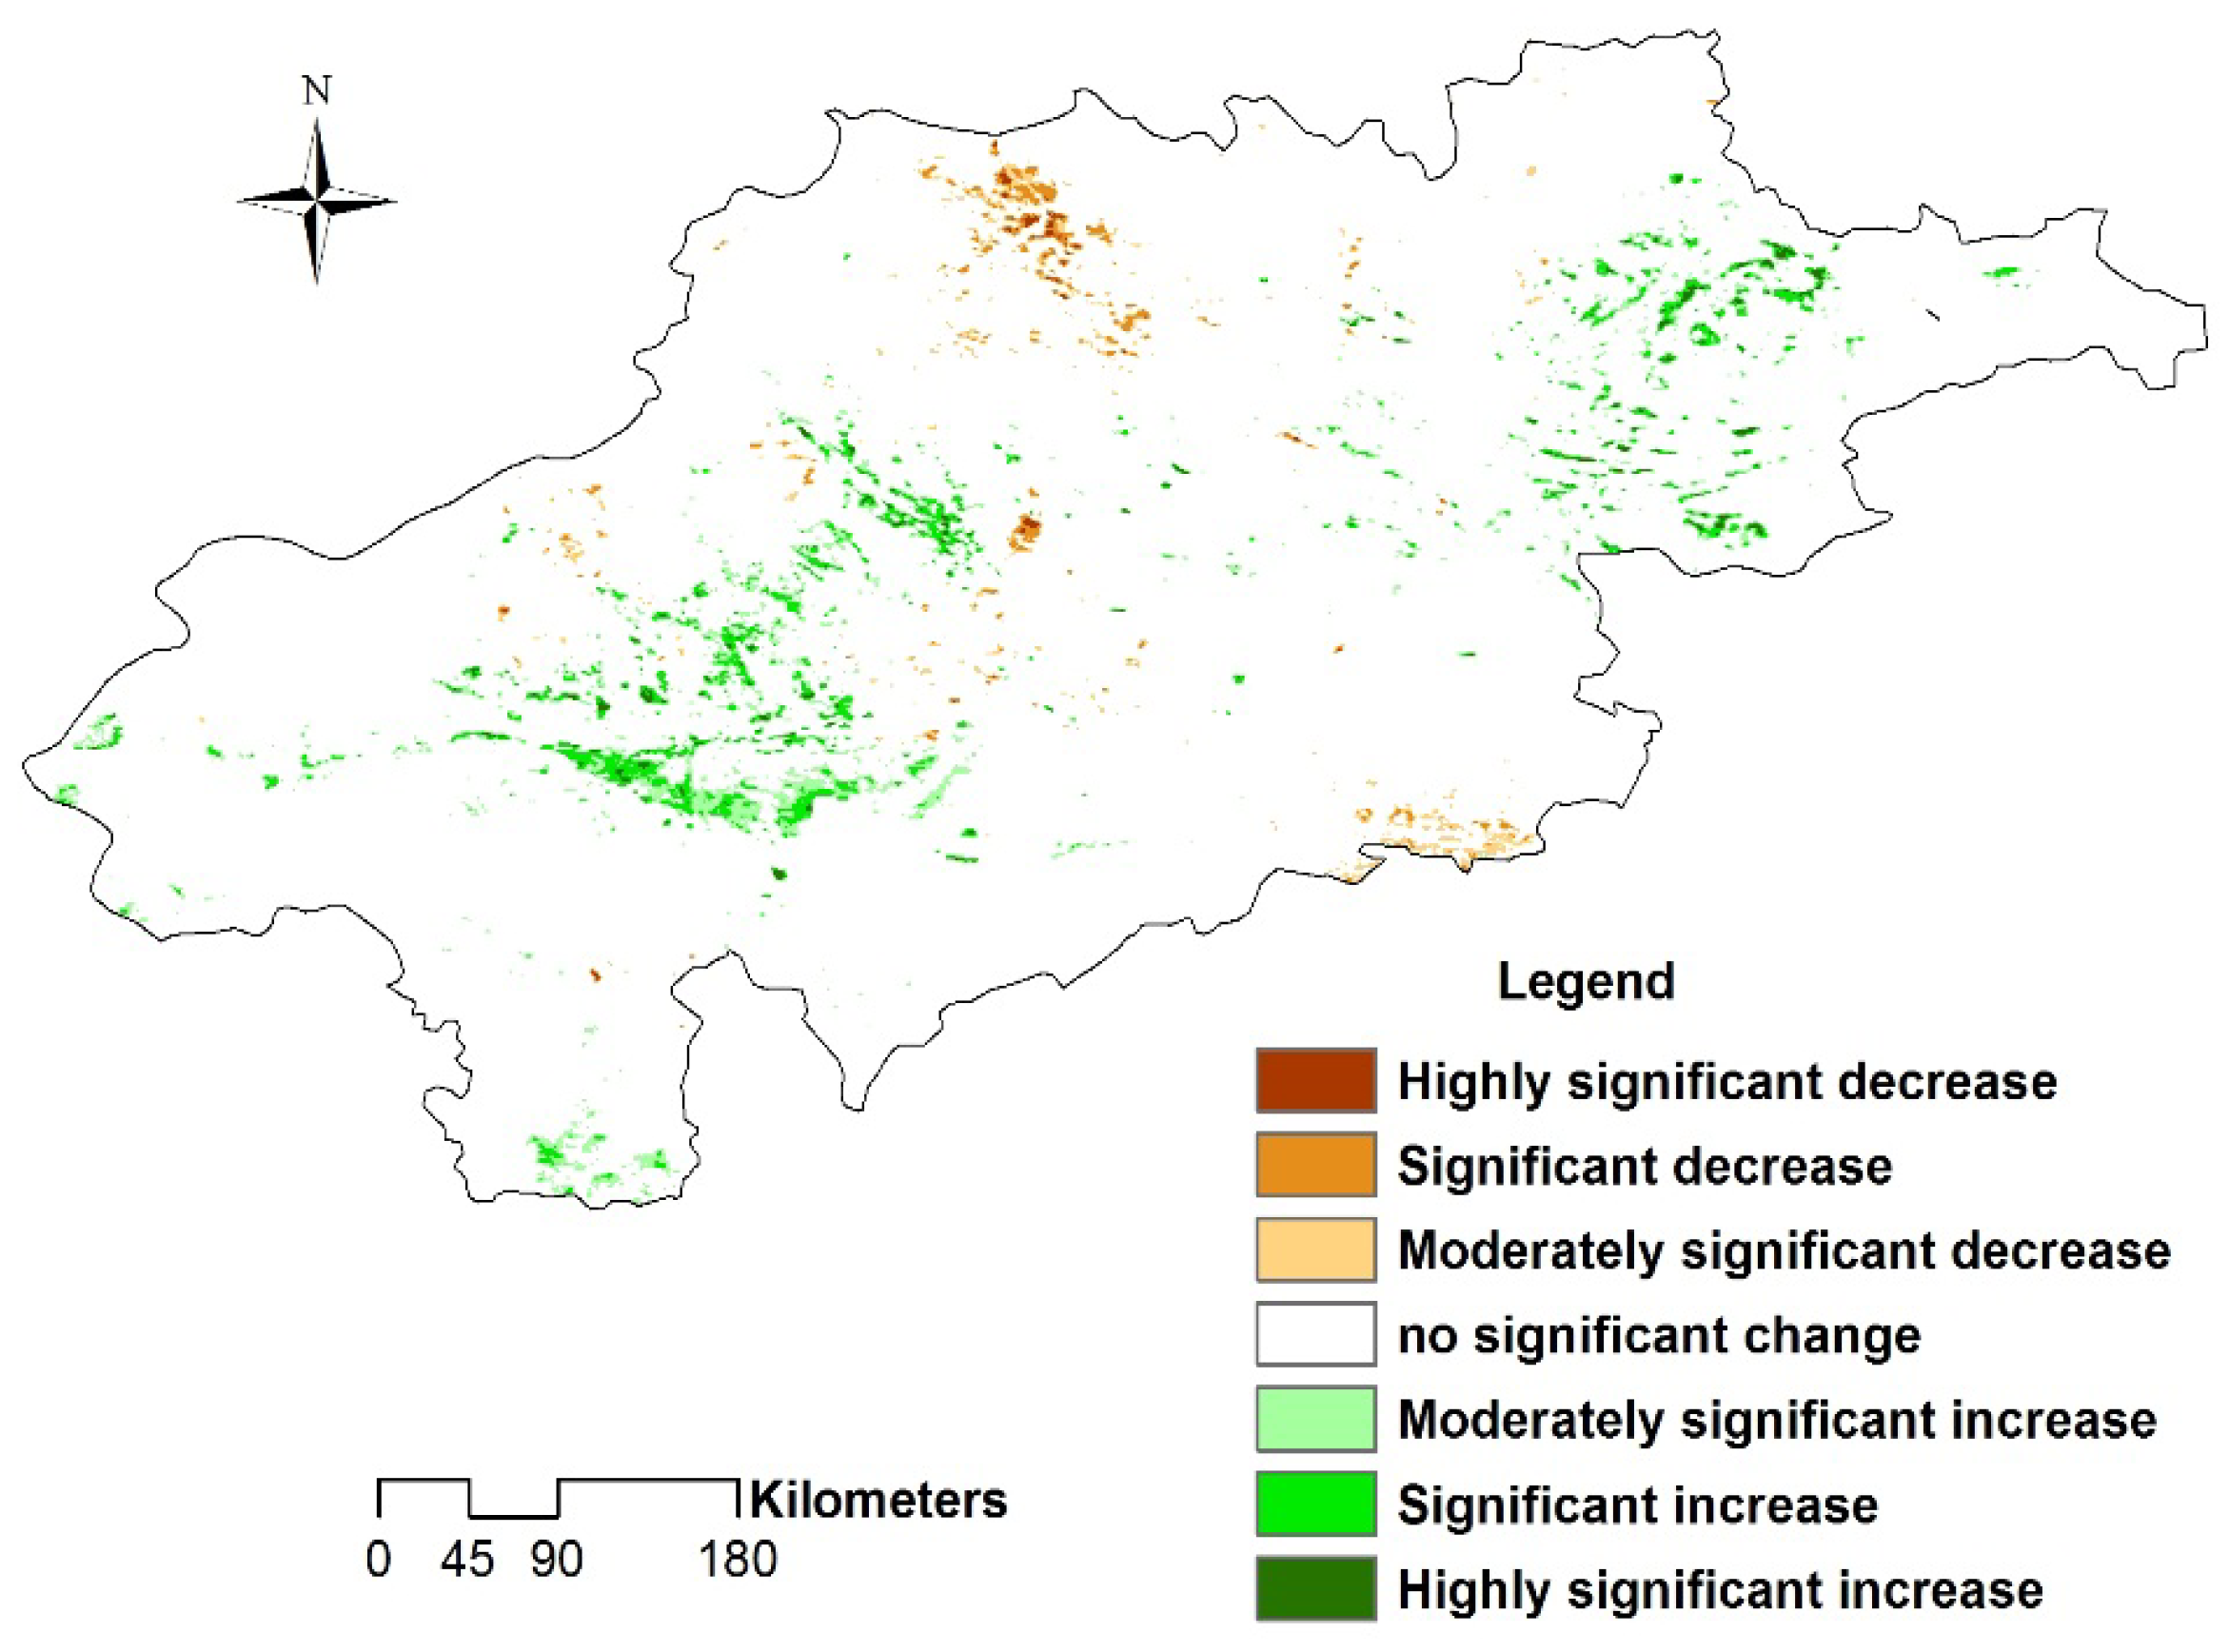
The annual average RUE often used as an indicator for the state of the vegetation cover [20]. The vegetation RUE increased slightly with an undulating trend in the studied area for the period of 1999–2011. During 2001–2005, average RUE value of vegetation kept decreasing and ecosystem function tended to degrade. Since 2005, average RUE has started to fluctuate. Wave crest of the average RUE occurred in 2007, with peak value of 0.0113 implying the best level of rain-use efficiency. High RUE value of 0.0105 in 2009 and 0.0103 in 2001 exhibited a better rain-use efficiency. By comparison, vegetation water use efficiency declined in 2005, 2008 and 2010. The lowest RUE (0.0084) was found in 2005, indicating the decrease in ability of vegetation to utilize water and degraded ecosystem function.

3.1.3. Change Trend

RUE trends for each pixel were estimated according to a linear relationship with years as independent variable. During the period from 1999 to 2011, the spatial pattern of vegetation change varied (Figure 3). Of the total area, 59.53% experienced a RUE increase, while the area with a negative SLOPE occupied the rest of the area. The common interpretation is that statistically significant negative slopes indicate land degradation. Conversely, positive slopes may imply improved ecosystem function.
According to the slopes and F-statistic test, the trends of vegetation RUE change were classified into seven types (Table 1, Figure 4). Of the studied area, 4.23% showed a significant RUE increase, while 1.29% of the studied area showed a significant decrease. The remaining regions (94.47%) had no significant change of vegetation RUE. The area where RUE significantly increased was mainly distributed in saline-alkali land in the counties of Jilin province, and the shrub land and grassland in Ongniud Bannar, Balinyou Banner and Ar Horqin Banner. The negative trends were mainly observed in the north central area of Horqin Youyizhong Banner and the south of Horqin Zuoyihou Banner.

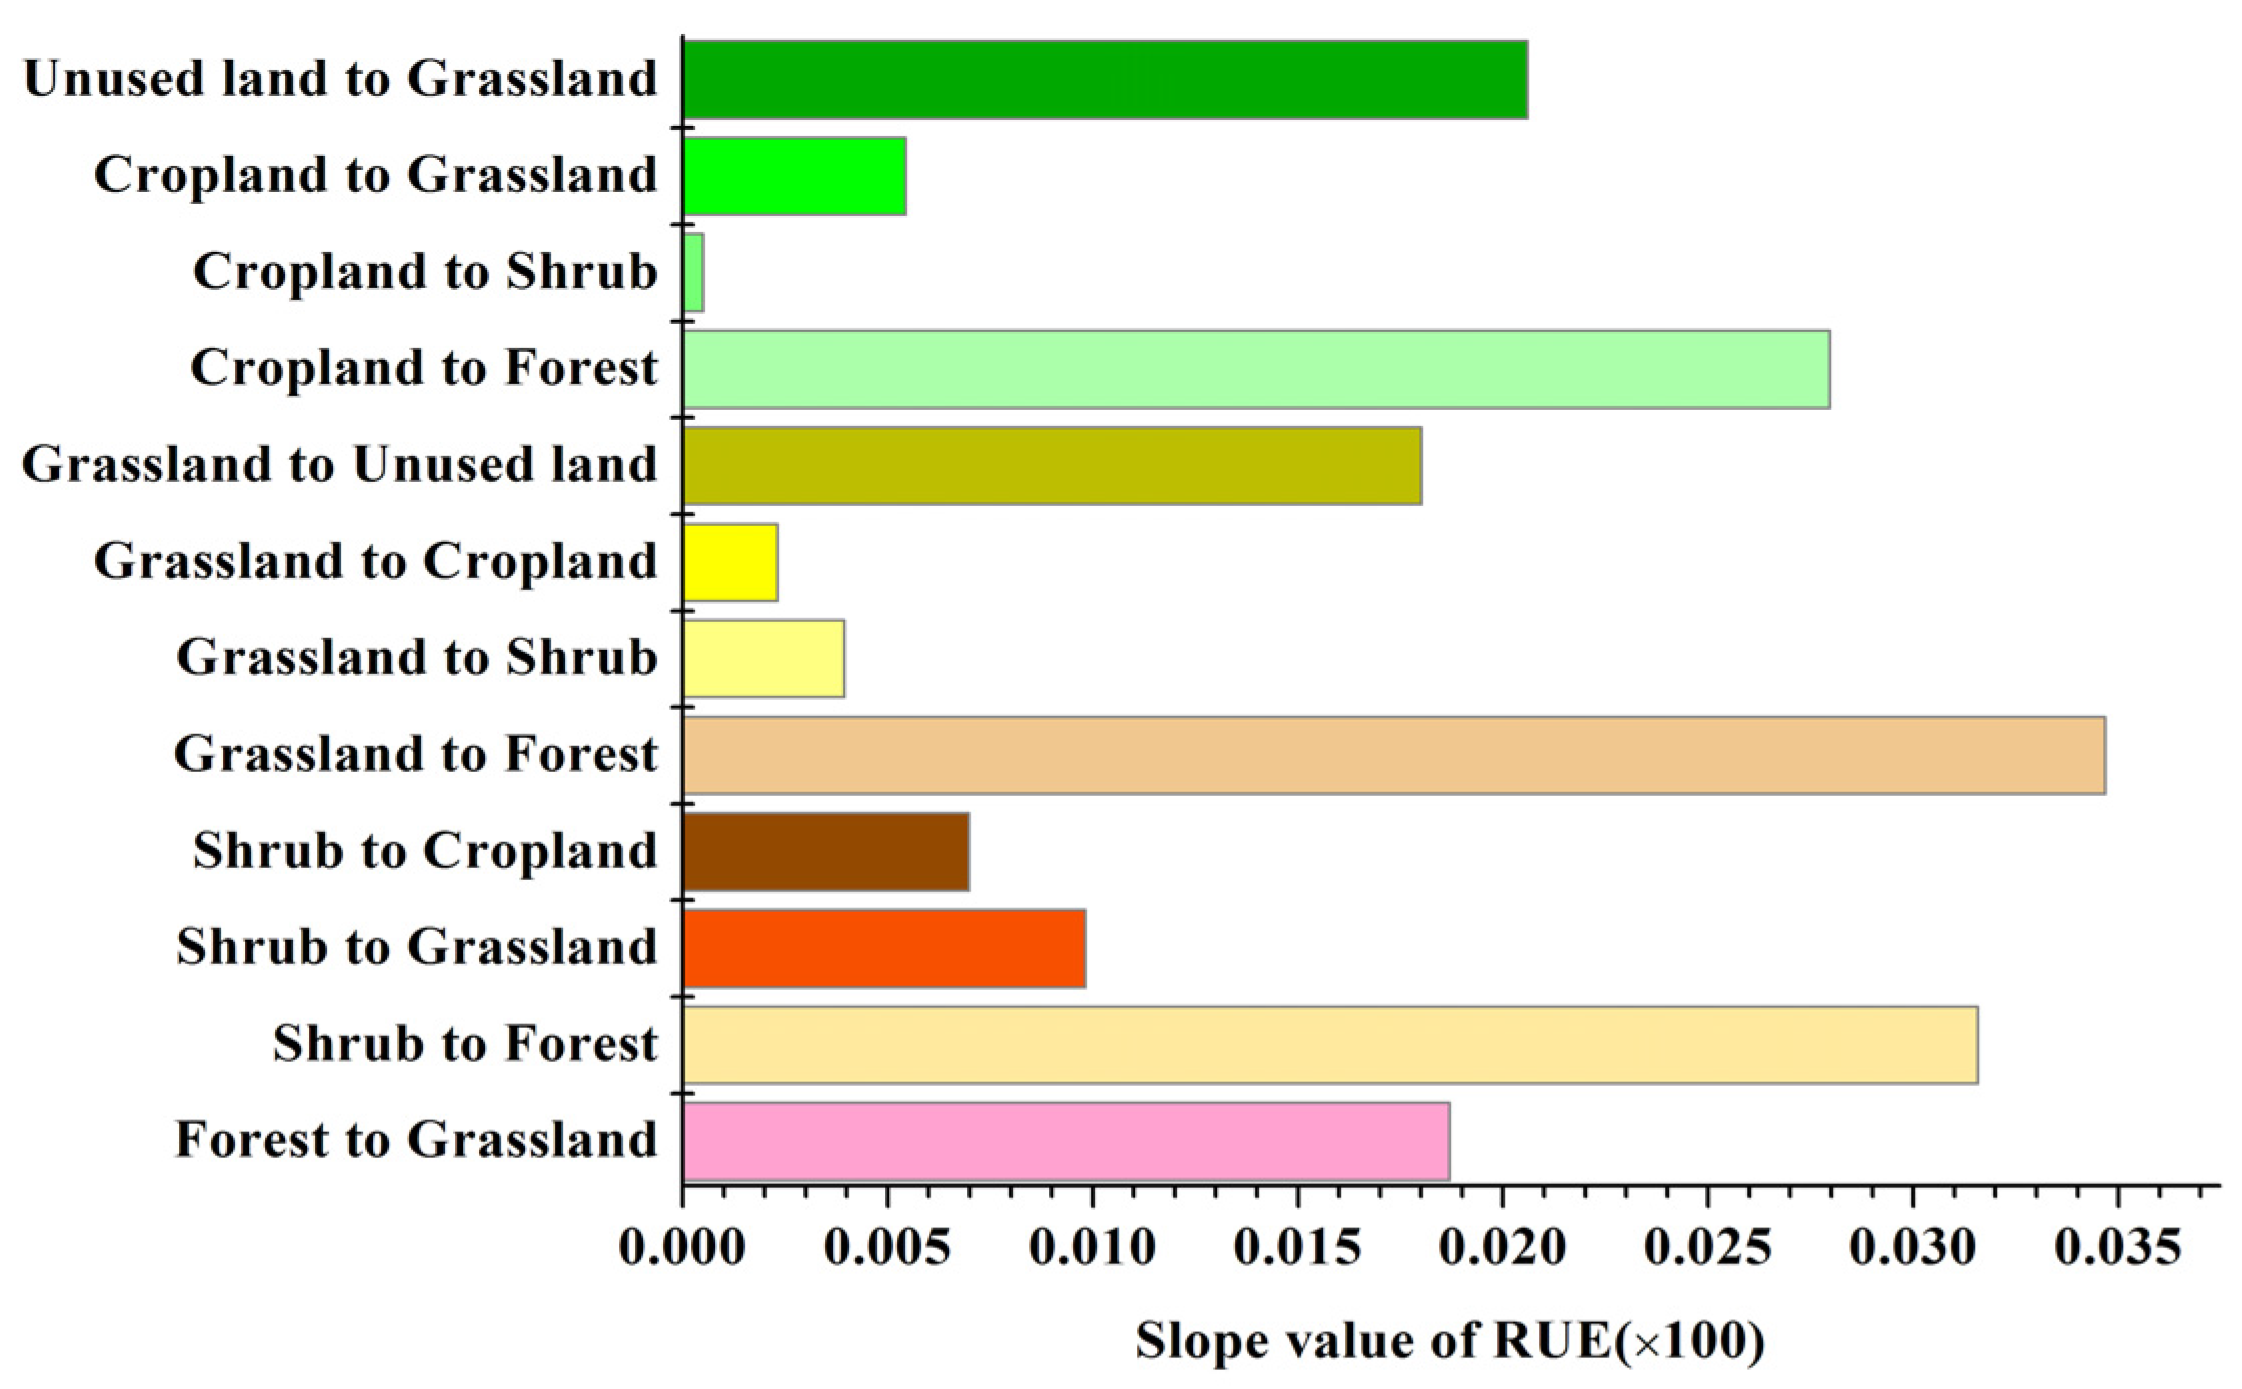
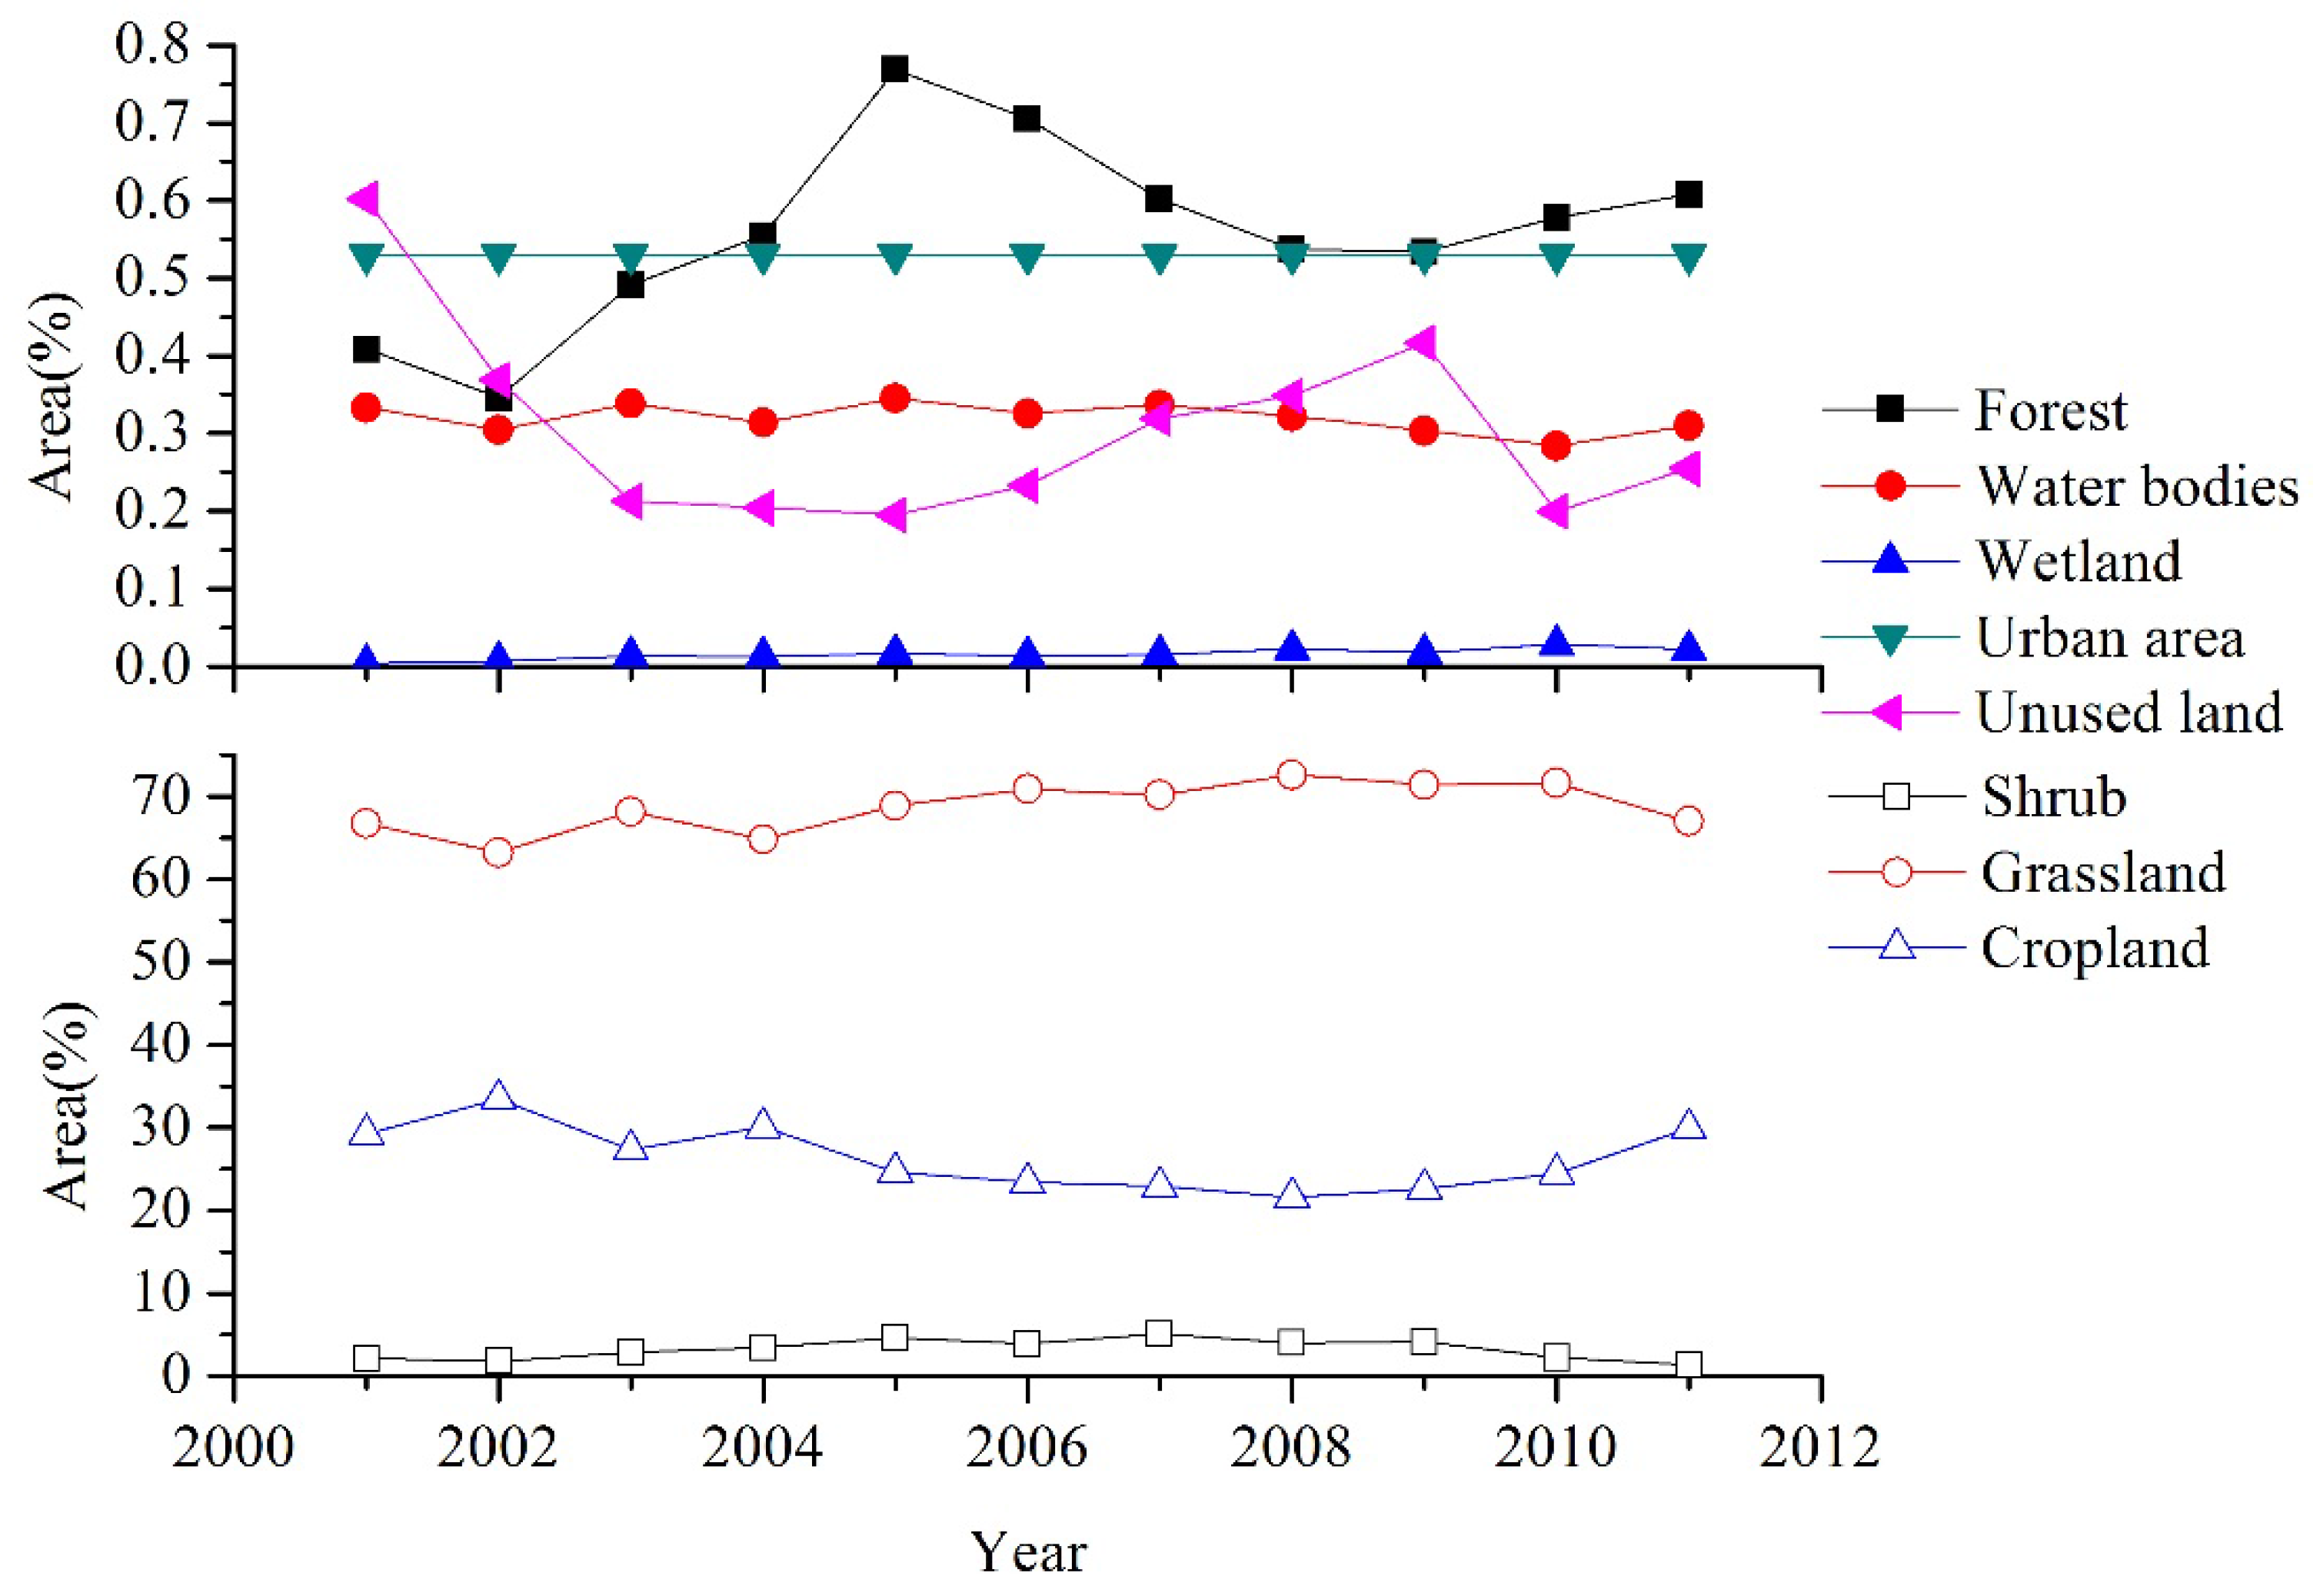
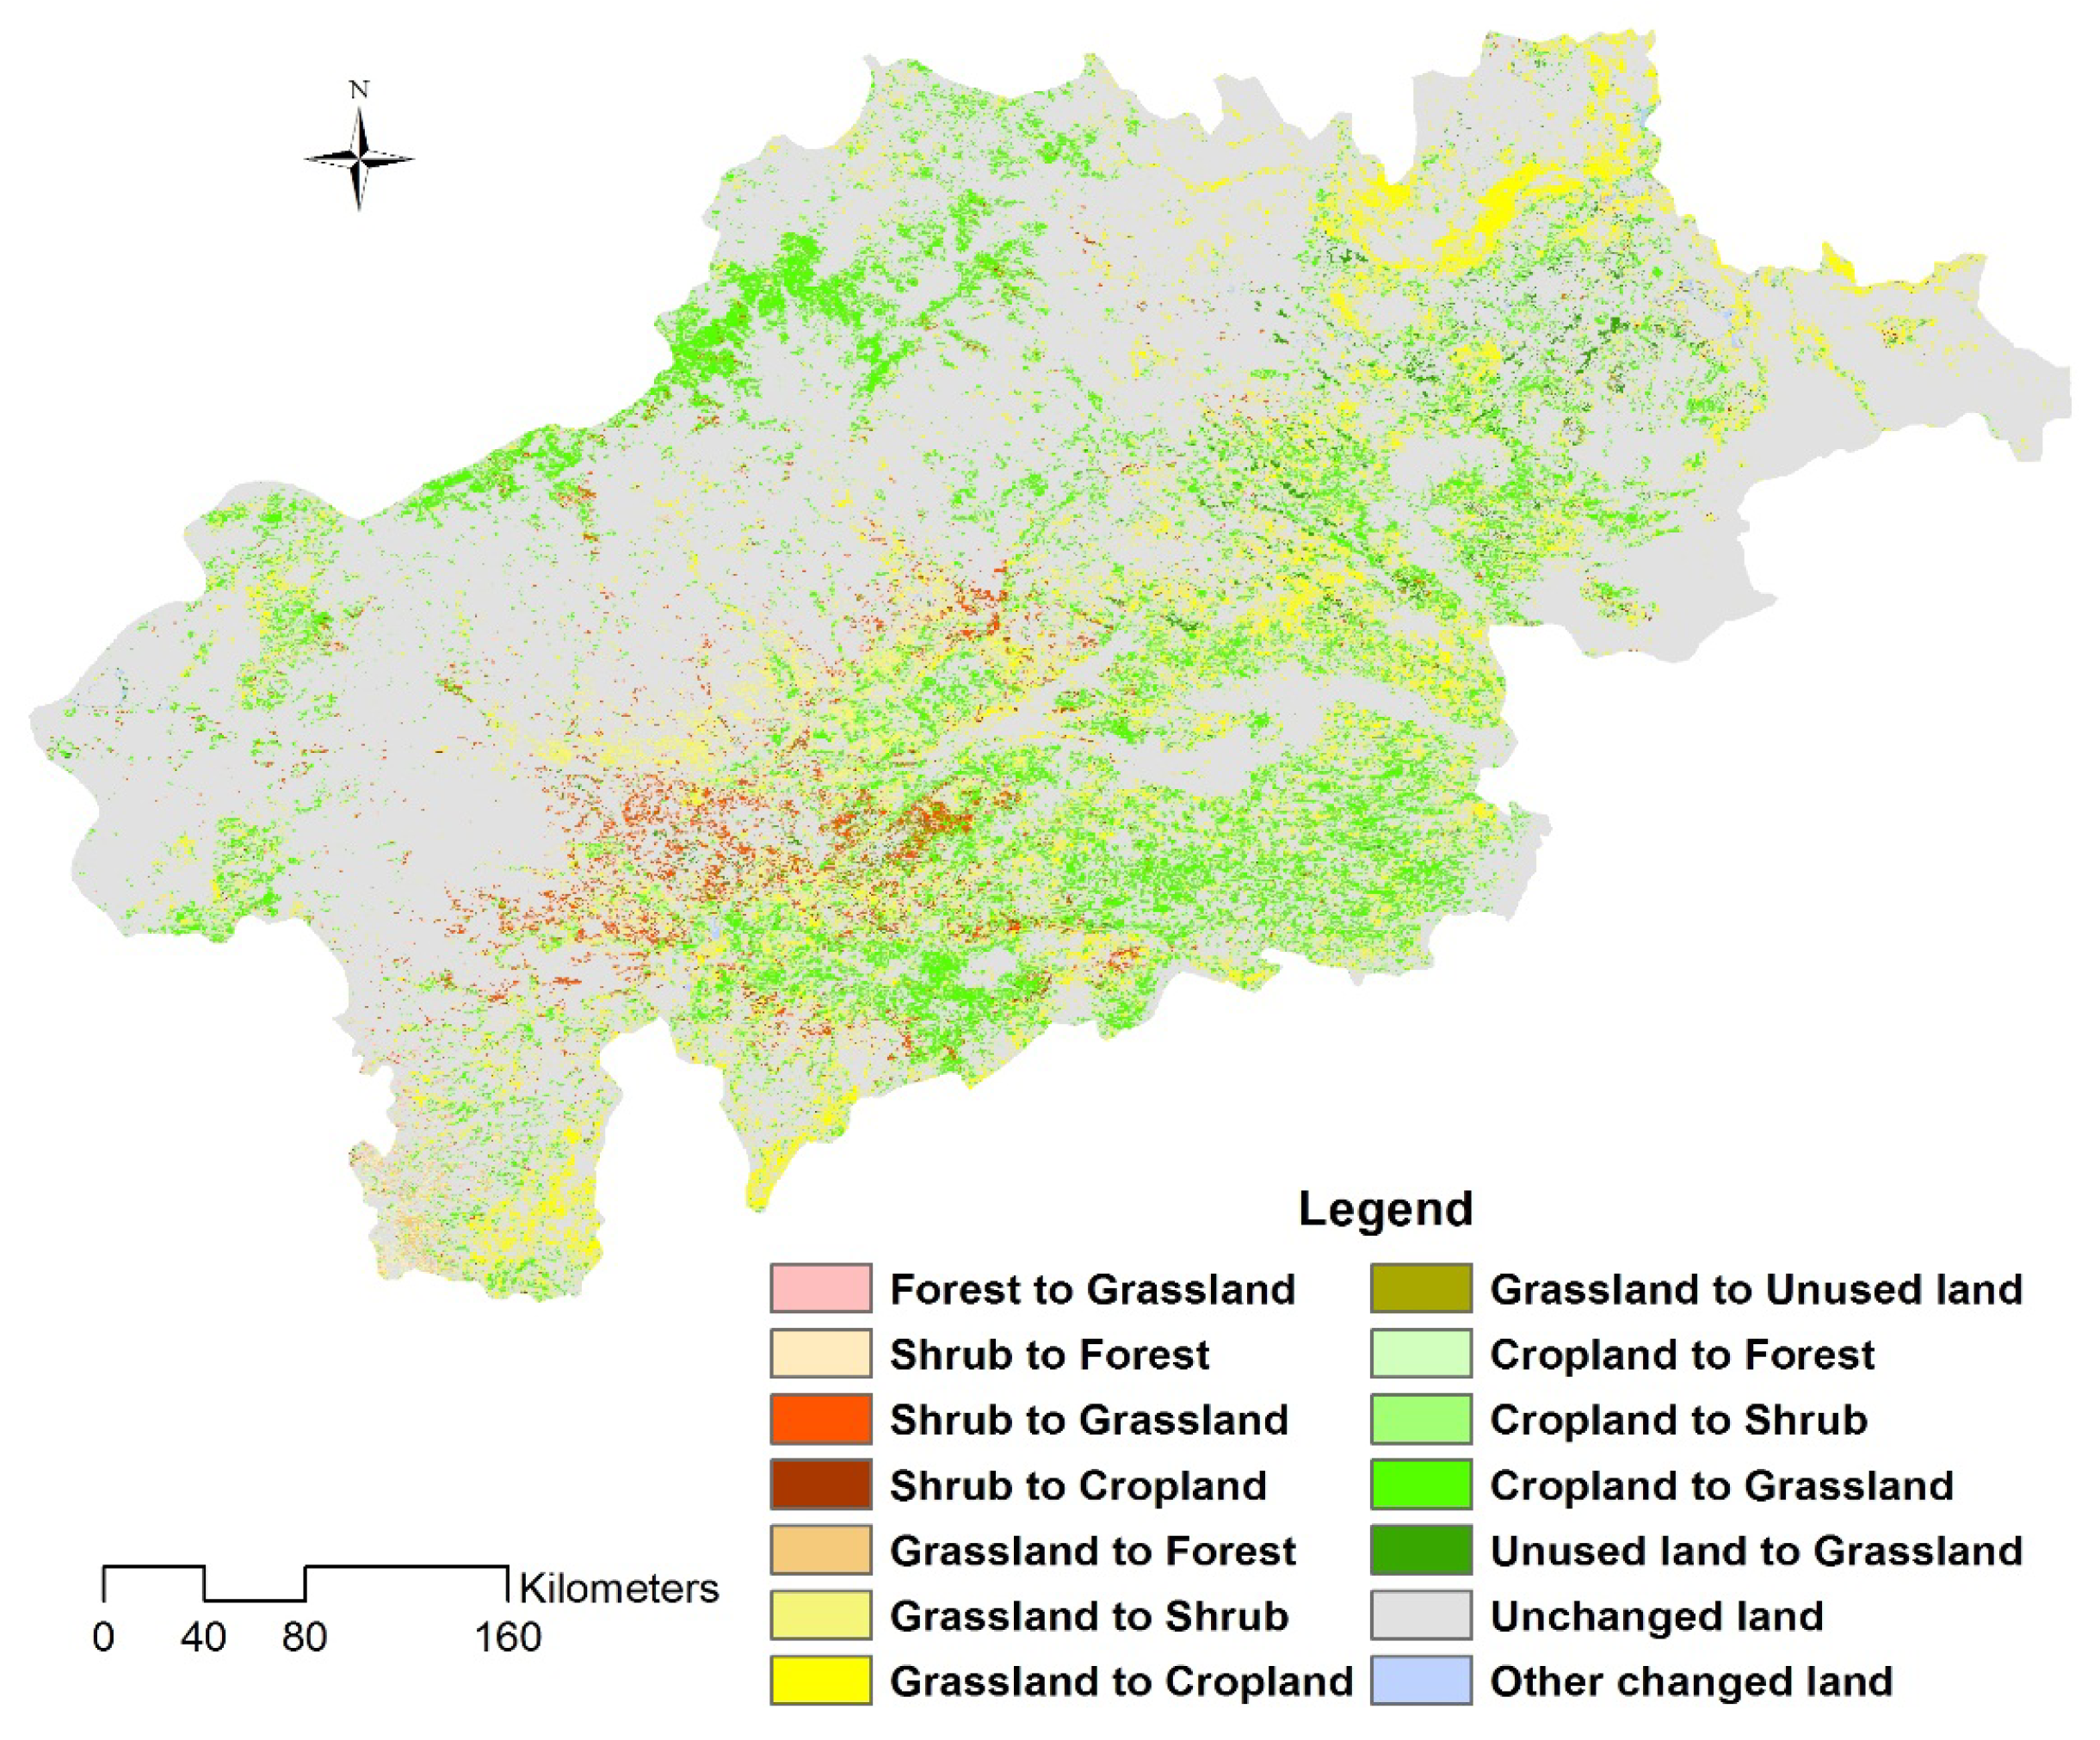
3.2. RUE Variations in Response to Land Use/Cover Changes

To address the potential response of RUE on land use, land use/cover changes (LUCC) were investigated in the west of Songliao Plain from 2001 to 2011. Figure 5 illustrates the changes in the proportion of eight land use/cover classes of the studied area. Grassland and cropland were the dominant land cover types, accounting for more than 60% and 30% of the entire region, respectively. It was found that grassland occupied 66.73% of the landscape in 2001 and rose to 67.01% in 2011. The portion of forest land increased slightly by 0.20% between 2001 and 2011, whereas the area of cropland decreased by 7.44% from 2004 to 2009. The cropland started to grow from the year of 2009 and its percentage reached 29.93% two years later. Wetland area increased slightly from 2004 to 2009, which might be associated with the construction of new wetland reserves. Shrub declined from 2.13% to 1.34% and the proportion of unused land dropped by 0.35% for the period of 2001–2011.
Figure 6 shows the spatial pattern of land use/cover change in the studied area. About 77.85% of the total land was unchanged. The loss of grassland was attributed to its transformation into cropland, which accounted for 6.29% of the landscape. As a result of the policies of the Chinese government concerning ecological protection, about 2.66 × 10⁴ km2 of cropland or abandoned cropland returned to grassland, which accounted for 10.82% of the total land. The areas of conversions were 4012.25 km2 from grassland to shrub and 3903.75 km2 from shrub to grassland, while 1275.25 km2 of the unused land (barren and sparsely vegetated land) turned into grassland, which was contributed to national and local Returning Rangeland to Grassland programs.
In order to exhibit the response of RUE on LUCC in the studied area, the maps of mean RUE, RUE change trends and land use/cover conversion were overlaid each other. The statistical process was carried on with “Zonal statistics As Table” in ArcGIS. The average RUE value of each land use/cover class was extracted based on the unchanged pixels. In general, forest had the highest RUE of 0.0139 and cropland followed with the value of 0.01. Average RUE of grassland and wetland was 0.0093 and 0.008, respectively. In the region covered by shrub, mean RUE was 0.0078. RUE of unused land was lowest with the value of 0.005. Figure 7 depicts the average slope values of RUE multiplied by a constant of 100 for main LUCC types from 2001 to 2011. In the region converted from grassland to forest, the highest RUE slope of 0.00035 was found. The average RUE slopes in area of shrub to forest and cropland to forest were followed by 0.00032 and 0.00028, respectively. Areas showing positive RUE trends mostly coincided with areas of land cover conversions, implying an overall improvement of ecosystem function for the studied period. The findings may reflect the positive effects owing to the implementation of ecological conservation and restoration projects at national and local levels [26,29,30,33,65].

3.3. The Main Causes of RUE Changes

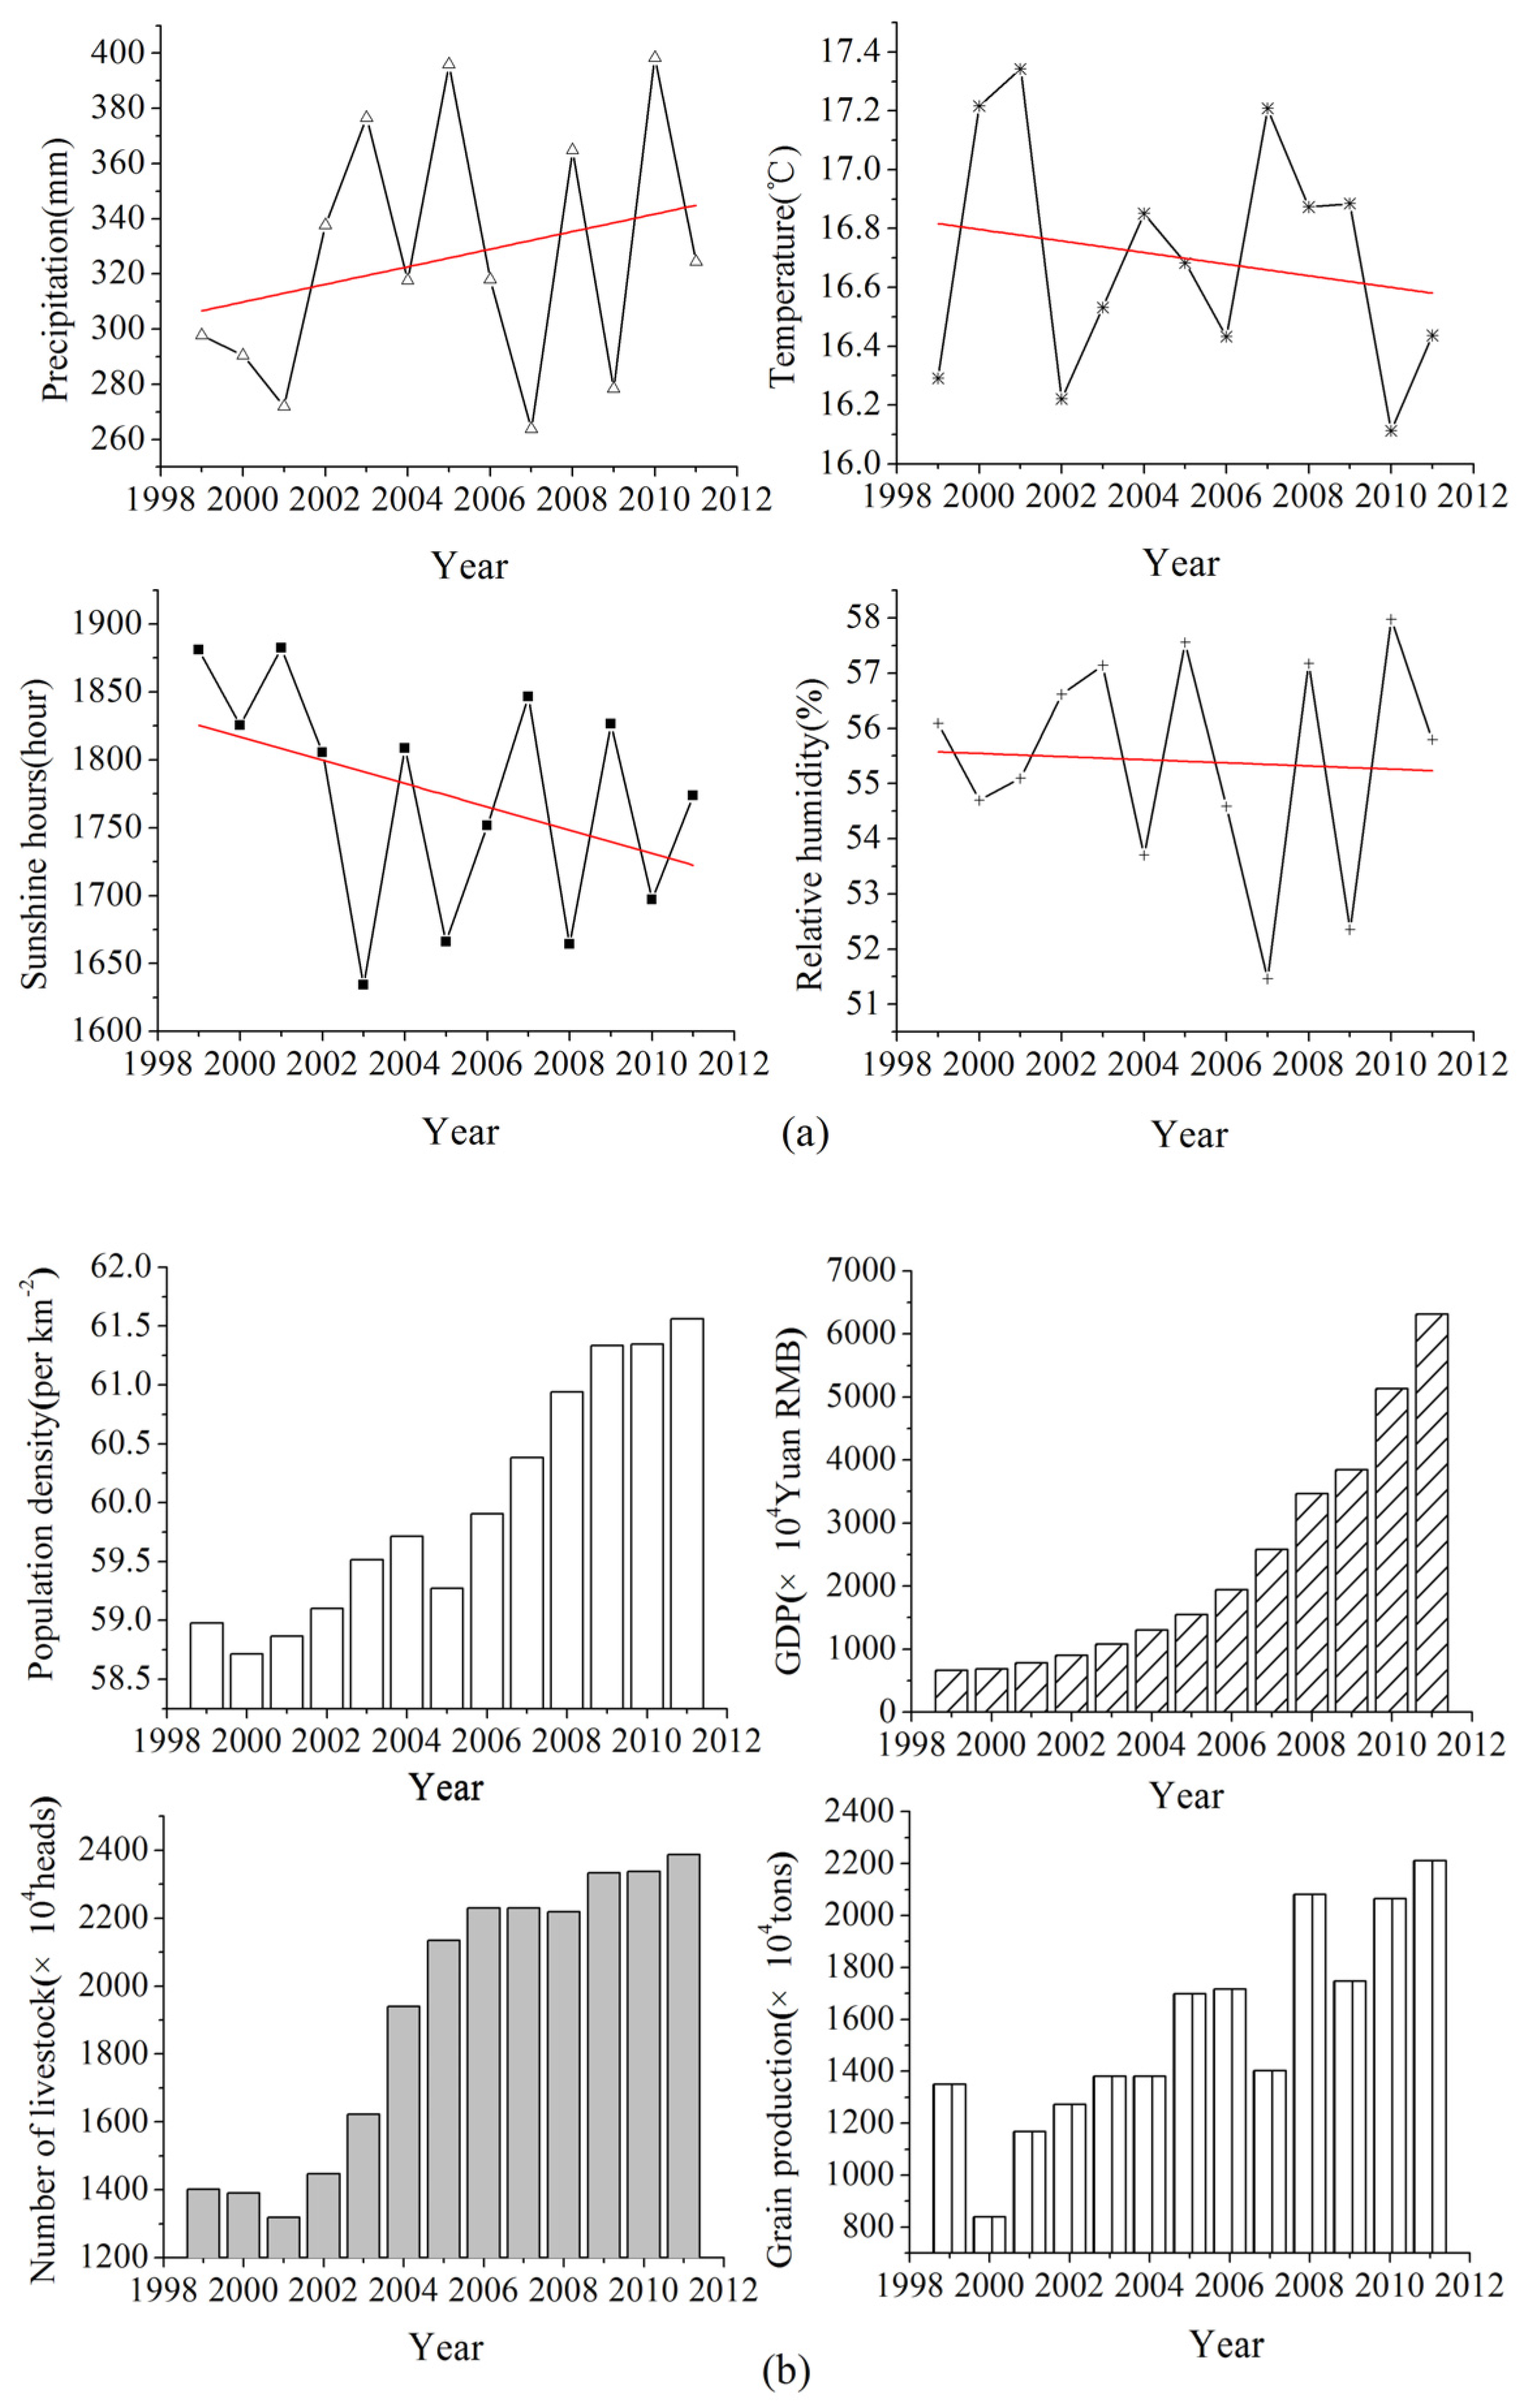
3.3.1. Climate Variations

As shown as Figure 8a, the elevated pattern of precipitation in the growing season was observed with growth rates of 3.19 mm per year in the west Songliao Plain. The year with the highest precipitation of 398.27 mm was 2010, while the lowest value (263.77 mm) was found in 2007. The average temperature over the growing season fluctuated at rates of −0.02 °C per year for the period of 1999–2011. In 2001, the average temperature reached the highest value of 17.34 °C, whereas it dropped to the lowest value of 16.11 °C in 2010. The accumulated sunshine hours during the growing season from 1999 to 2011 declined at rates of −8.60 hours per year. The average relative humidity decreased from 56.09 in 1999 to 55.80 in 2011, which may affect moisture absorption by plant and evapotranspiration.

3.3.2. Socio-Economic Development

Apart from climatic factors, some anthropogenic factors that were hypothesized to be potential determinants of RUE changes were selected. For example, population and grain yield could be representative of “the intensification of agriculture”, while “the number of livestock” might be an indicator of animal husbandry production [66]. The “food first” agricultural policy has exerted the longest influence on the environment since the People’s Republic of China was founded in 1949 [67]. There has been rise in population of this region during the examined 13 years (Figure 8b). The total population increased by 4.38%, from 12,797,900 persons to 13,358,889 persons for the period of 1999–2011. The consequent demand for grain has caused the increased reclamation of cropland, which accelerated the cultivation of grassland. The total grain production rose by 63.89% from 1999 to 2011, partly due to the improvements in agricultural technology and inputs (i.e., irrigation and chemical fertilizer). GDP could be used to represent human economic activities. Based on the statistical data, the size of GDP experienced an intensive change in the study area during 1999–2011 [43,44]. The average annual growth rate of GDP was 18.92%, indicating rapid growth of the regional economy. Animal husbandry is the predominant industry in the studied region. In the past 13 years, the livestock population of the study area increased greatly, from 14.01 million to 23.87 million. The rapid development of stockbreeding might be related to the increasing need for livestock products and higher living standards.

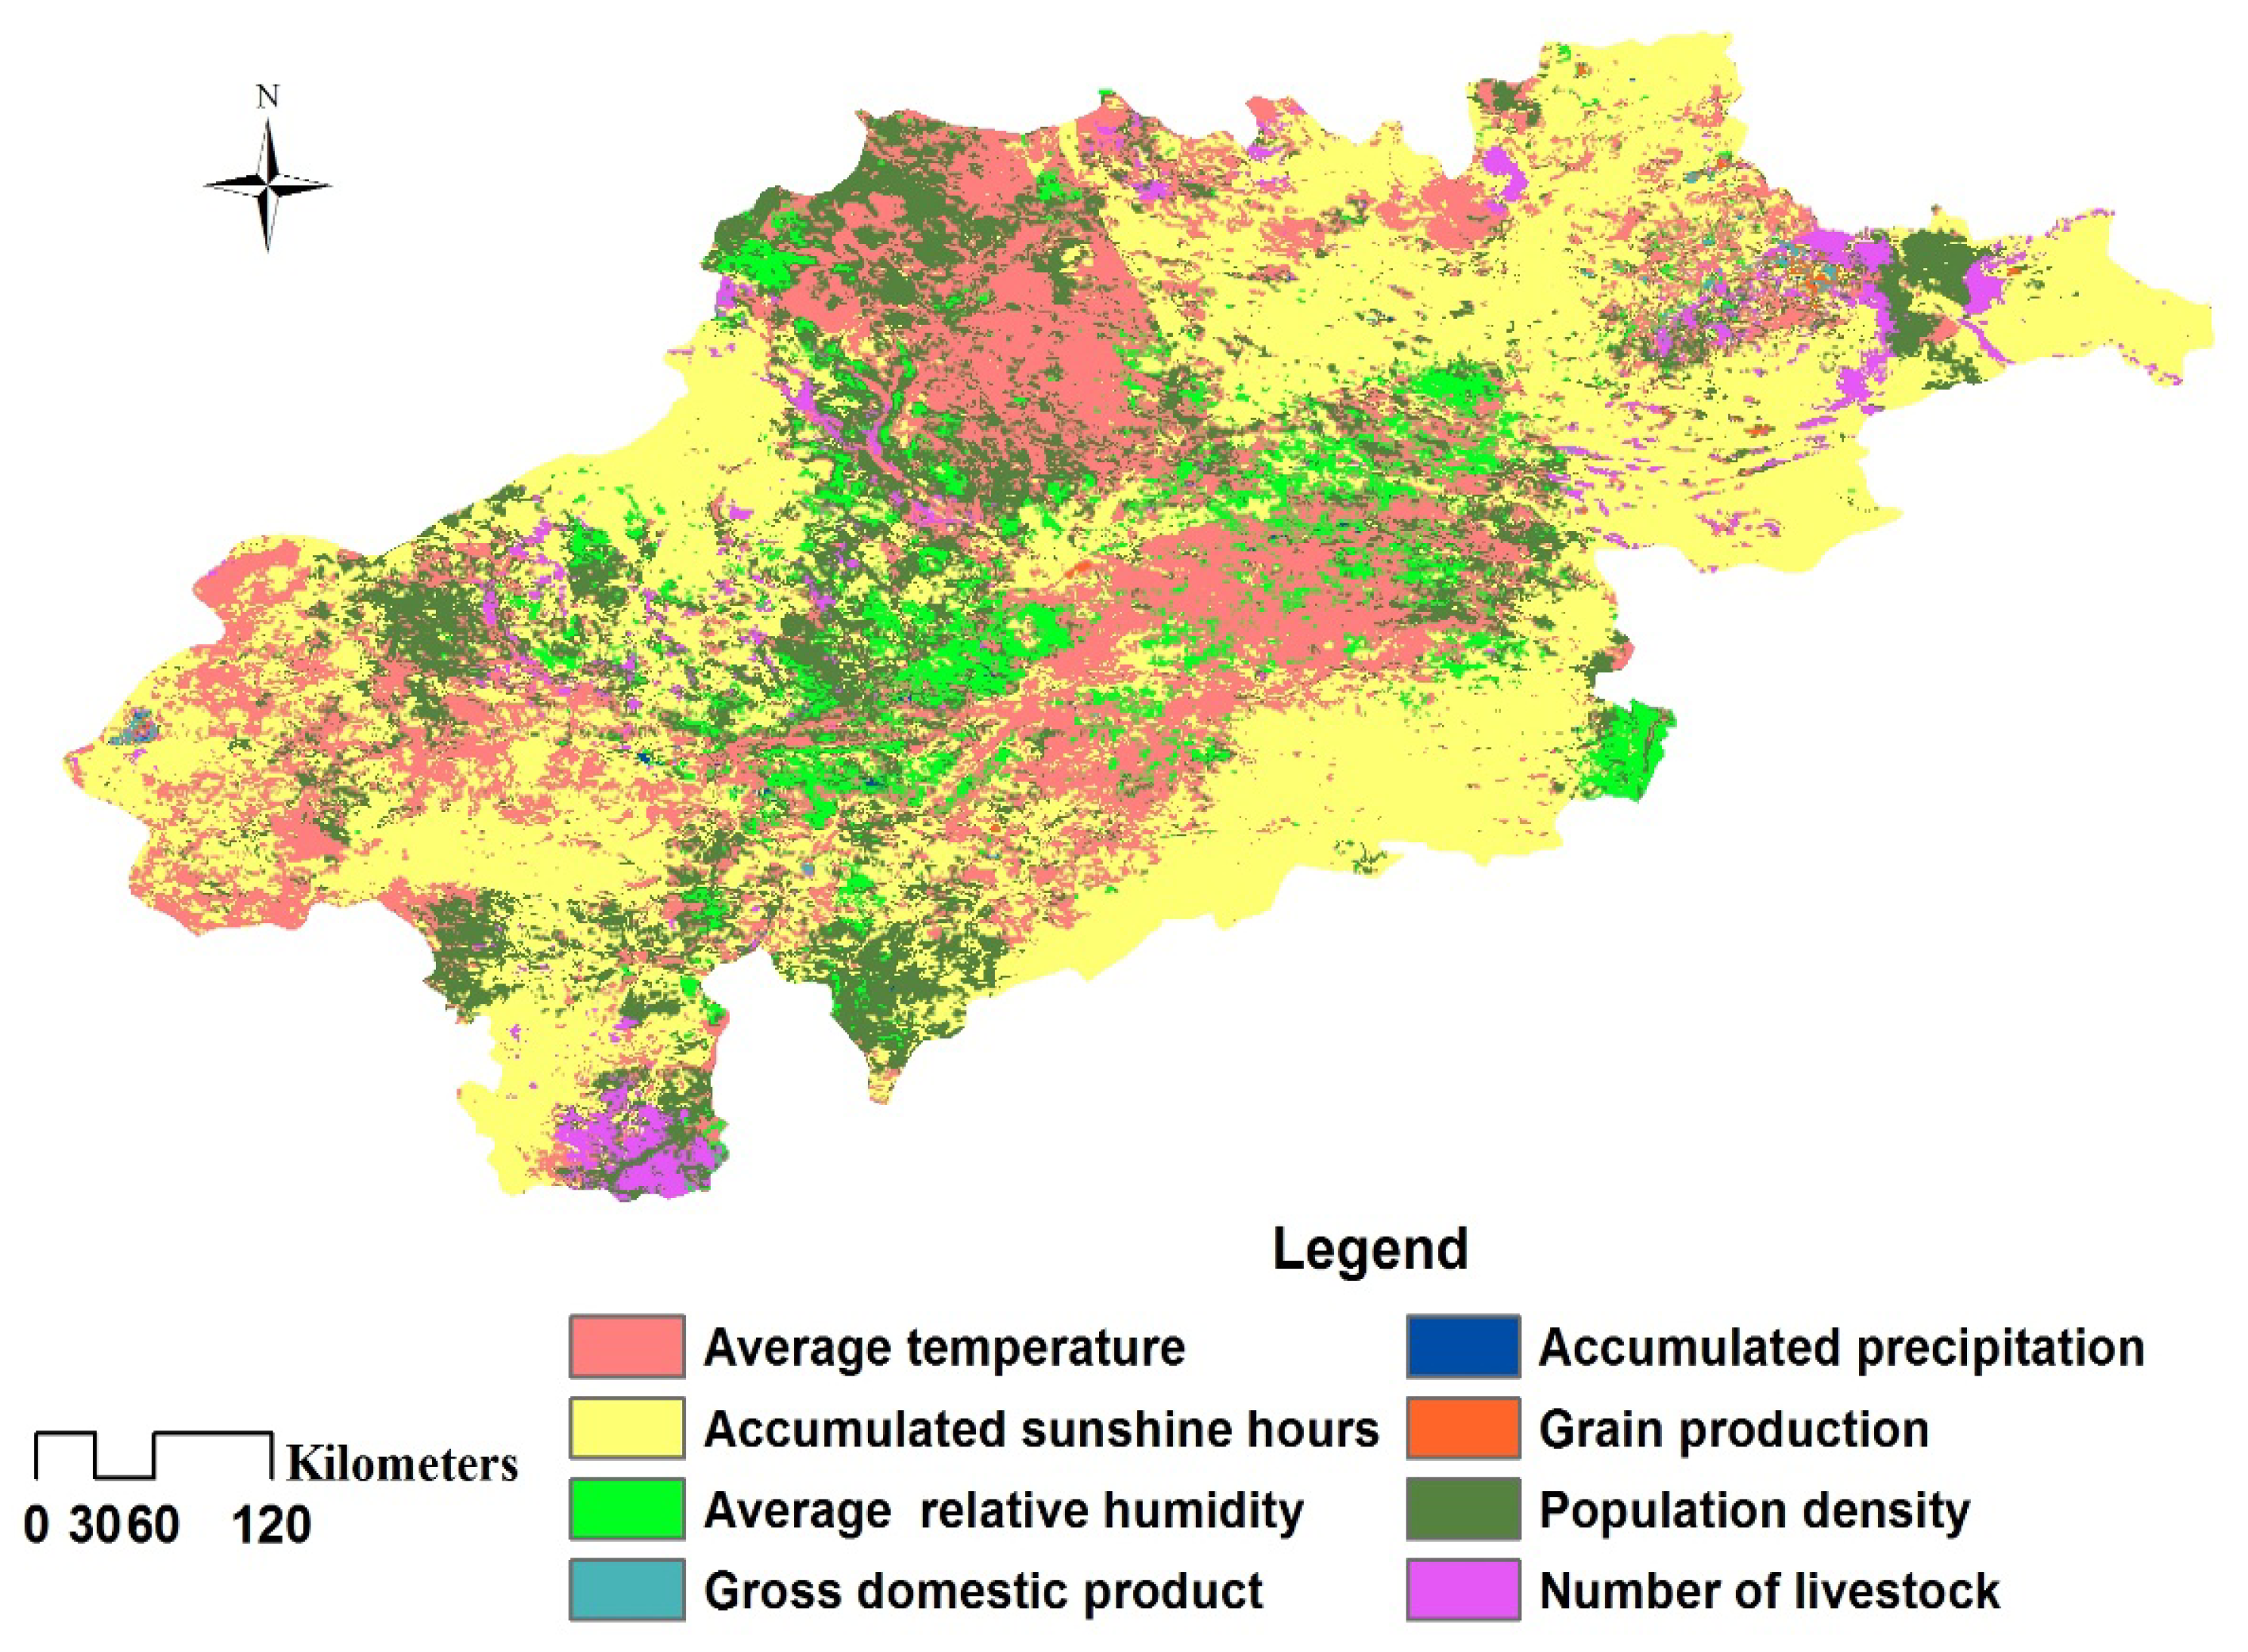
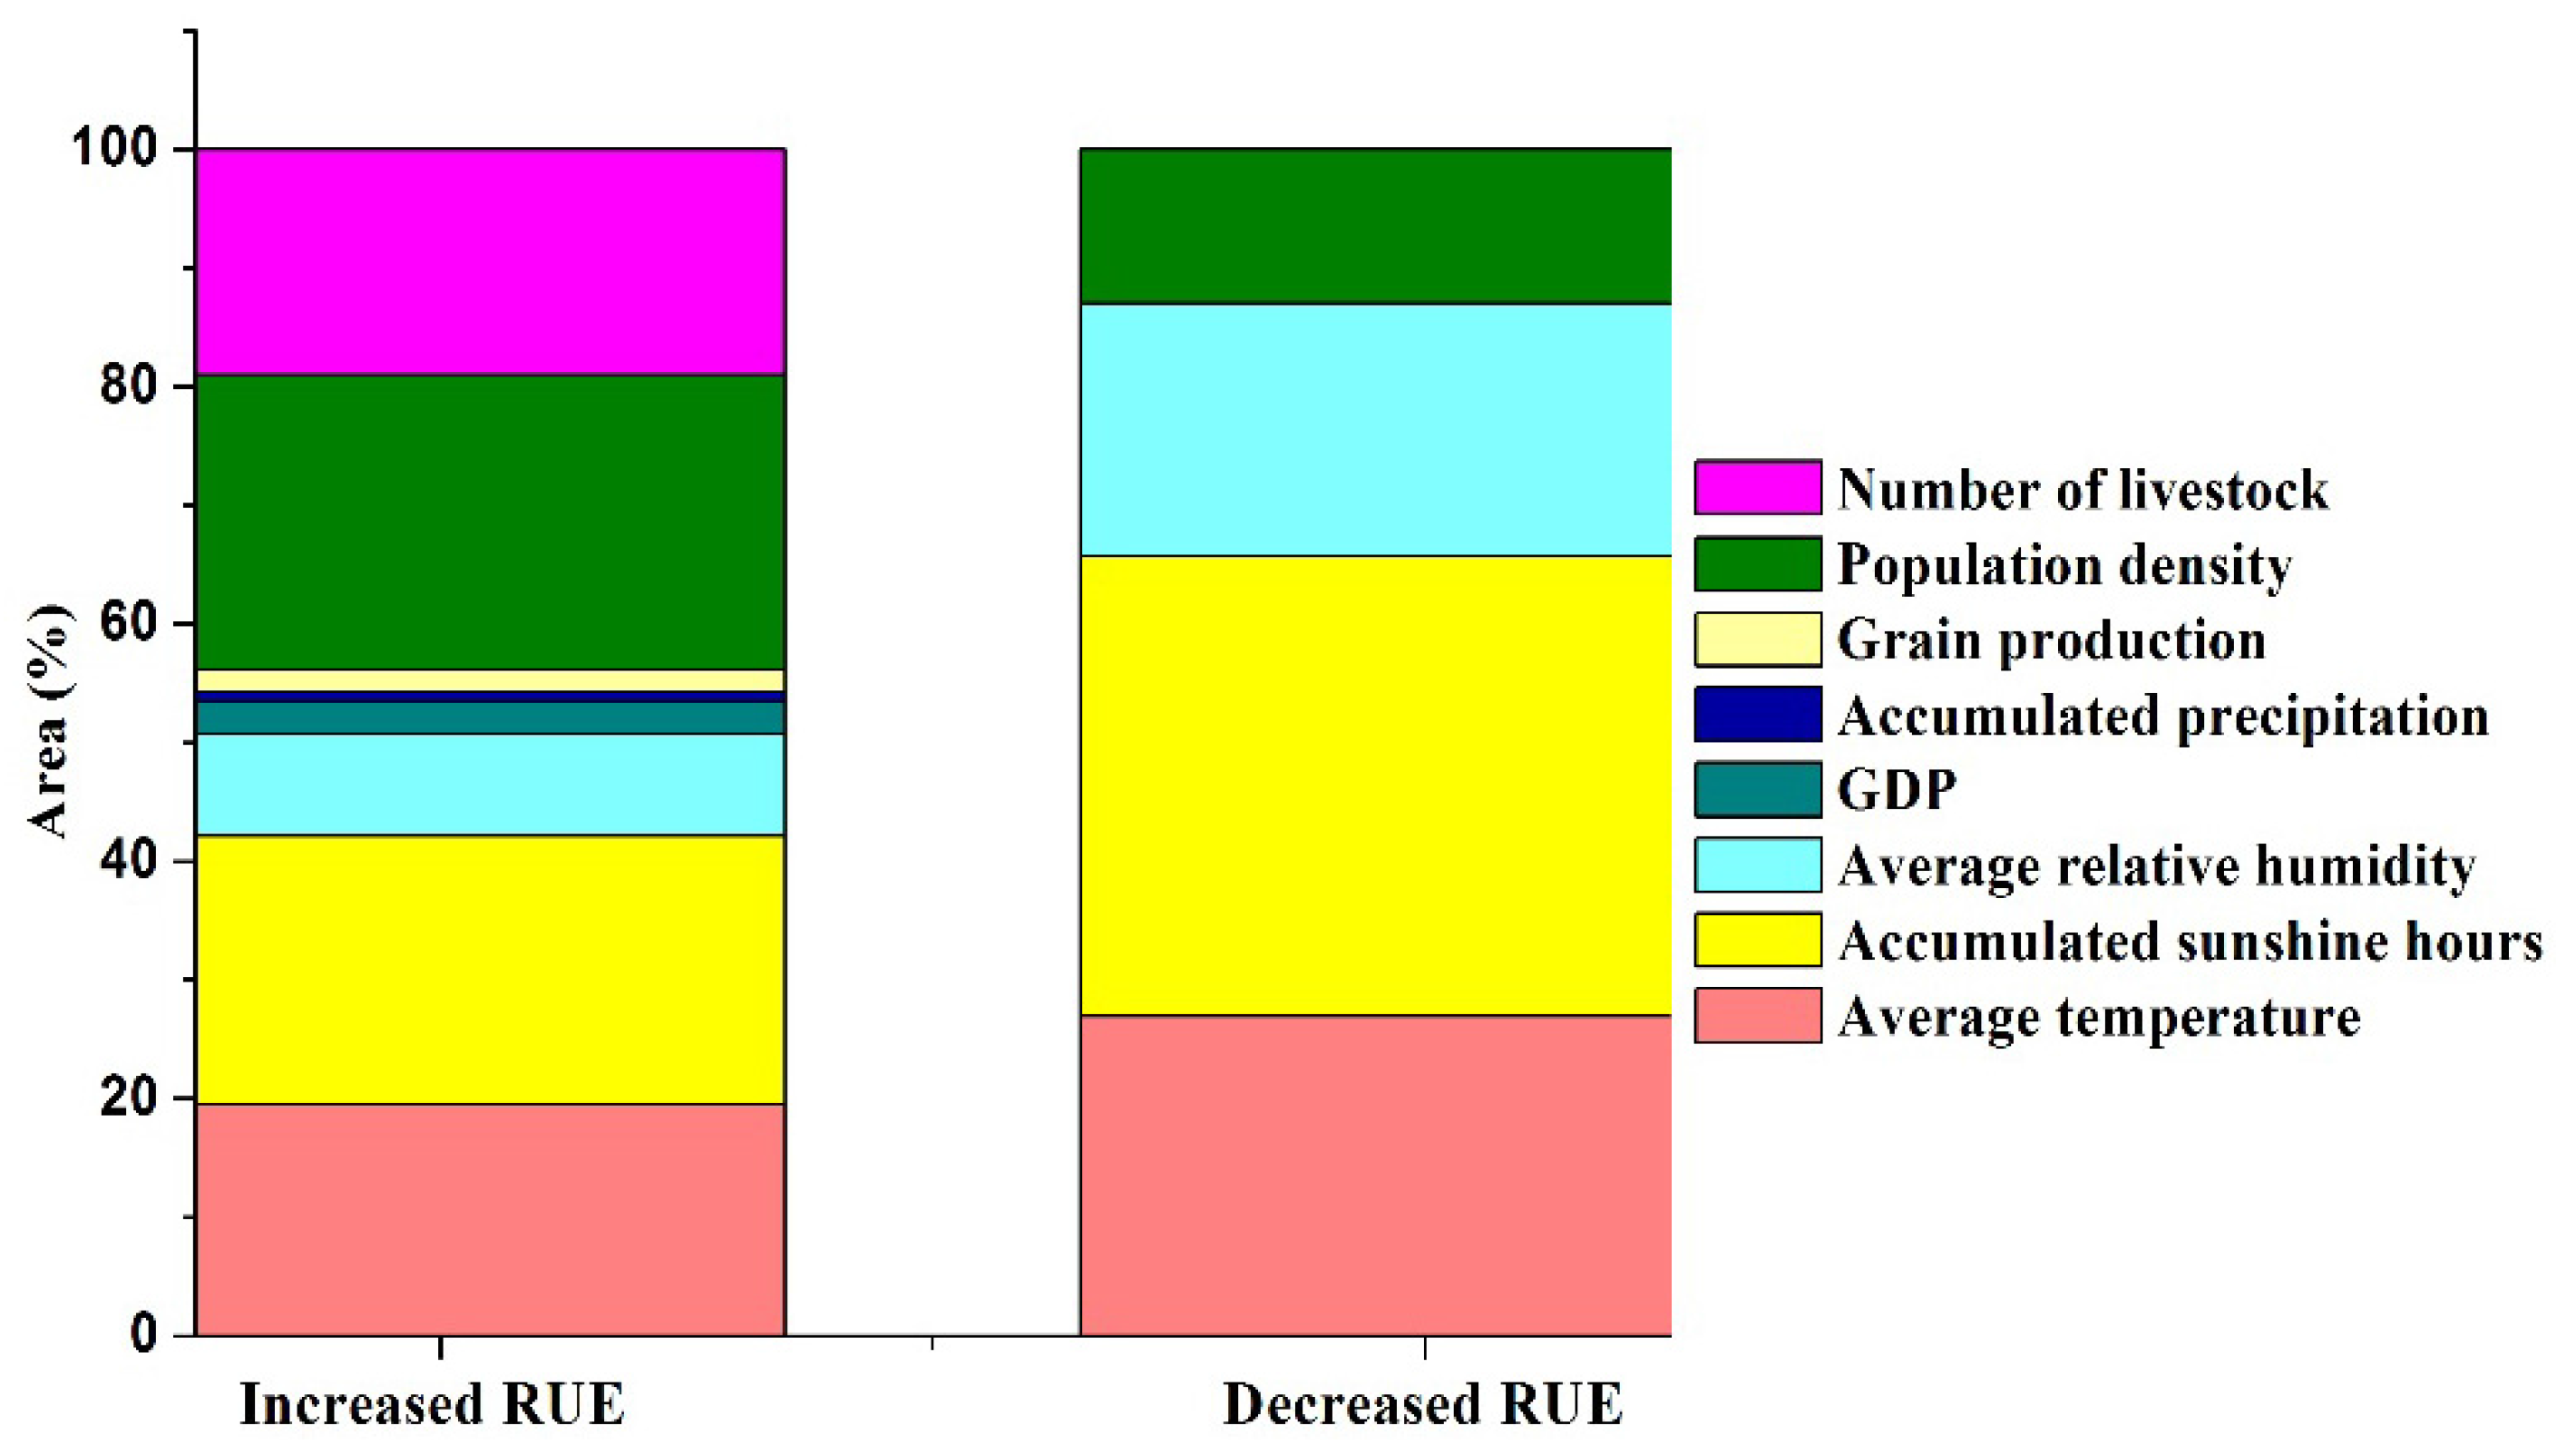
3.3.3. The Influential Determinants of RUE Change

To identify the main causes responsible for RUE spatial changes, the grey relational grade (GRG) values for each grid of eight climatic and socio-economic factors were computed within ArcGIS and shown in Figure 9. According to statistics for the grid values, the regional average GRG of sunshine hours was the highest (0.6115). Average temperature came next with a mean GRG value of 0.6049. The average GRG value of population density (0.5995) ranked the third. The regional GRG of relative humidity varied from 0.8235 to 0.2079 with the mean value of 0.5713. The average GRG value of livestock number and total precipitation was 0.4754 and 0.4610, respectively. The linkages between grain production, GDP and RUE appeared to be weak due to the low average GRG values of 0.3885 and 0.2908.
In accordance with the principle of grey relation analysis method, the higher grey relational grade (GRG) between the main sequence and the reference sequence, the more closely the sequences are related. Conversely, the lower GRG suggests less relation between the sequences. In this study, the higher GRG per grid value indicated the greater influence of a certain factor on RUE change. Firstly, the GRG values of each grid were sorted into descending order. Then the highest GRG value was retained for each grid and defined as the most influential determinant of RUE. The grid-based map of the most influential determinants was finally produced (Figure 10).
According to the statistics, the grid area of accumulated sunshine hours with the highest GRG occupied 47.26% of the total area, implying its greatest influence on RUE spatially. Of that grid area, 25.06% were classified as average temperature, which was regarded as the second most influential determinant of RUE. The population density was the third factor closely correlated with RUE, because the grids with the highest GRG accounted for 17.70% of the total land. Based on the obtained proportions of grid area of GRG values, the order of importance of the rest factors impacting RUE was: relative humidity, number of livestock, grain production, GDP and accumulated precipitation. The pattern of these factors on RUE showed a clearly spatial heterogeneity. Spatially, the higher grey correlation grade, sunshine duration, temperature and population affected RUE changes in the west of Songliao Plain the most for the period of 1999–2011.

4. Discussion

4.1. Characteristics of RUE Variations

The current analyses and results suggest that the west of Songliao Plain has been characterized by a slight increase in RUE over the period 1999–2011. The average RUE tended to fluctuate from year to year, implying the instability of the water use status in the studied area. Increases in rain use efficiency over the growing season were observed in the years of 2001, 2007 and 2009, but the precipitation presented a decreased trend concurrently. At temporal scale, RUE negatively correlated with precipitation, which was consistent with the results of many previous studies [11,12,13,14,18]. Spatially, areas showing increased RUE trends accounted 59.53% of the total land (Figure 3). However, 4.23% of the total area experienced a significant increase in RUE, probably suggesting improved ecosystem function (Figure 4). This pattern is consistent with partial results of Yin et al. conducted desertification evaluation via RUE in the whole Inner Mongolia Autonomous Region [30]. They concluded that parts of Inner Mongolia showed a significant increase trend of RUE from 1999 to 2009 and vegetation function might enhance especially in some areas with more than 300 mm precipitation.
RUE is closely related to vegetation type, probably caused by differences in following aspects including community structure, photosynthetic efficiency of plants, soil conditions, vegetation cover, geomorphic units and management and so on [11,12]. This study revealed that RUE showed differences among land use/cover types in the study area. Averaging RUE at land use/cover level, this followed a descending order of forest, cropland, grassland, wetland, shrub and used land. The results are similar but not identical to the finding from Mu et al., who reported that the average RUE of different vegetation types, in sequence, was shrub, forest, cropland, grassland and desert in the whole district of Inner Mongolia during 2001–2010 [68].
The analyses and results demonstrate that the regions presenting strongly positive RUE trends are in accordance with those areas of conversions among land cover types, especially grassland to forest, shrub to forest, and cropland to forest, showing an improvement of ecosystem function in the west of Songliao Plain over the studied period (Figure 7). We infer that increased vegetation activity may be attributed to the effectiveness of some ecological and environmental restoration projects implemented during the past decade, such as the “Grain for Green Project”, the “Natural Forest Protection Project” and the “Beijing and Tianjin sandstorm source controlling project”. Similar findings have been reported in several existing studies for adjacent regions [26,29,30,33,65].

4.2. Spatial Pattern of Climate, Human Activities Impacts on RUE

Climate change is regarded as one of the crucial controlling factors of vegetation changes. Some efforts have been made for exploring the relationship between spatio-temporal pattern of RUE with climatic factors, particular precipitation and temperature at both temporal and spatial scales [11,12,13,14,24,25,68]. In this study, relative humidity and solar duration were selected as potential factors affecting RUE variations. Several recent studies indicate that vegetation change has been impacted by increasing intensity of human activities in the whole Inner Mongolia Autonomous Region since the beginning of 21 century [69,70,71]. For instance, Mu et al. stated that the correlation coefficients between vegetation coverage and climatic factor decrease, implying the reduced sensitivity of vegetation to climate change in Inner Mongolia from 2001 to 2010 due to anthropogenic factors. In this sense, four socio-economic factors representing population pressure, agricultural activities and economic scale were taken into account in this study.
To identify the main impact factors responsible for RUE variations, GRA method was extended to the spatial scale. The results revealed that the spatial pattern of GRG for eight impact factors differed from each other (Figure 9). The ranges of GRG of each factor were obviously different. The maximum GRG values of population density, accumulated sunshine hours, relative humidity and average temperature were greater than 0.8, implying close relation with RUE. According to average level of GRG, the accumulated sunshine duration was the most important impact factor of RUE variations, whereas GDP might marginally affect RUE. Based on the proportions of grid area of GRG values, the order of importance of the factors affecting RUE was accumulated sunshine hours, average temperature, population density, relative humidity, number of livestock, grain yield, GDP, and accumulated precipitation. Spatially, climatic factors could suggest closer relation with RUE in the west of Songliao Plain.
Figure 11 illustrates the area portions of the most influential determinant with significant increased or decreased trends in RUE at the 0.1 level. Significant decrease in RUE might be attributed to accumulated sunshine hours, average temperature and average relative humidity with the portions of 38.77%, 26.93% and 21.30%, respectively. By contrast, significant increase RUE was mostly related to first three factors including population density, accumulated sunshine hours and average temperature, accounting for 24.83%, 22.58% and 19.52%, respectively.
Long sunshine duration could be beneficial to plant photosynthesis and nutrients storage, resulting in improvement of vegetation quality. Temperature increases may lead to an earlier initiation of the growing season and more robust vegetation growth [72,73]. Relative humidity helps to increase moisture availability for plants, whereas plant growth will be inhibited in the long-time saturated air humidity condition. The decreases in temperature and sunshine duration, combined with the increases in relative humidity might weaken evapotranspiration and eventually decrease plant activity. In this study, in the areas where RUE decreased significantly, the trends positively correlated with accumulated sunshine hours and average temperature, but showed negative correlation with relative humidity. Contrastingly, the increased temperature during the growing season may also accelerate water evaporation, which subsequently results in water scarcity and restricts vegetation growth in semi-arid and arid areas. Accordingly, in the regions showing significantly increased RUE trends, the slopes positively correlated with accumulated sunshine hours and population density, while average temperature had negative effects on RUE trends. The increased sunshine duration, together with decreased average temperature and relative humidity, helped to store plant nutrients and caused vegetation improvement.
In some densely-populated regions of the studied area, most of the land was used as cropland. With the improvement of agricultural technology and investment, the biomass of cropland might increase. The result of this study suggested high RUE in cropland probably related to the fertilizer and effective irrigation, which agreed with the previous studies [68,74]. Additionally, due to the implementation of shed feeding policies in the past decade, the increasing livestock population may have not contributed significantly to the destruction of young vegetation. GDP growth will benefit the financial support for ecological and environmental restoration and protection projects. According to statistic, in the Inner Mongolia Autonomous Region, the funds for ecological environment protection rose from 0.267 billion Yuan RMB to 3.116 billion Yuan RMB during 2001–2011. The percentage of accounted for GDP increased by 0.06%. It was found GDP was positively related to RUE, which suggested that vegetation function easily tended to improve in developed counties or banners. Existing studies have reported that RUE negatively correlates with precipitation based on temporal model [11,13,18]. However, in this paper, because the proportion of precipitation grids with highest GRG values was the lowest, precipitation was least closely related to RUE at the spatial scale.
GRA method in this study is suitable for solving problems with complicated interrelationships between multiple factors or variables [75]. It could be conducted in the case of incompleteness of information. If the change trends of two factors reflecting from sample data are basically consistent, there exists high relation grade between them. GRA provides a quantitative basis for determining the main impact factors of changes. The GRA procedure is a simple and straightforward in calculations. This study attempted to extend this method to the spatial scale. The spatial relation between impact factors and RUE was presented to some extent. Nevertheless, GRA method remains some shortcomings. For example, it requires for determining currently the optimal value of the factors or variables, which may induce subjectivity. Meanwhile, it is difficult to determine the optimal values of some indicators. Better methods for revealing the spatially complicated relation between factors should be explored in further study.

5. Conclusions

Rain-use efficiency (RUE) is a key to understanding the coupling between ecosystem carbon and water cycles. SPOT-VGT datasets of NDVI and rainfall were used in this paper to analyze variations in vegetation rain-use efficiency and their relationship with climate and human activity in the west of Songliao Plain, China. The results demonstrate that RUE increased weakly during 1999–2011. The lowest RUE was found in 2005, indicating the decrease in ability of vegetation to utilize water and degraded vegetation cover. While 59.53% of the studied area demonstrated increases in RUE, only 4.23% significantly improved at the 0.1 level.
Land use/cover changes occurred in 22.15% of the total area for the period of 2001–2011. The area portion of grassland increased slightly by 0.28%. As a result of the policies of the Chinese government concerning ecological protection, about 2.66 × 10⁴ km2 of cropland or abandoned cropland returned to grassland. Additionally, 1275.25 km2 of the unused land (barren and sparsely vegetated land) turned into grassland. Average RUE was highest in forest and lowest in used land. The positive RUE slopes were found in main land use/cover conversions, implying an overall improvement of ecosystem function for the studied period. The findings may reflect the positive effects owing to the implementation of ecological protection projects at national and local levels.
RUE variations were related to natural factors and human activities as well. The proposed grid-based grey relational analysis indicated that the contributing factors to RUE changes showed noticeable spatial differences. The regional average grey relational grade (GRG) value of sunshine hours was the highest (0.6115). Average temperature came next with a mean GRG value of 0.6049. The average GRG value of population density (0.5995) ranked the third. At a spatial scale, because of their higher proportions of grid area of higher GRG values, accumulative sunshine hours (47.26%), average temperature (25.06%) and population density (17.70%) had the greatest influence on RUE changes in the west of Songliao Plain for the past 13 years. Climate forcing was a dominant controlling factor that affected the vegetation function, and the anthropogenic behavior exhibited some effects as well. The results have important consequences for the use of RUE as an ecosystem indicator and as a tool in ecosystem monitoring and decision-making in the study area and similar regions.

Acknowledgments

Project 41571405 supported by National Natural Science Foundation of China.

Author Contributions

Fang Huang and Shuangling Xu conceived and designed the research. Shuangling Xu performed the data collection. Fang Huang and Shuangling Xu analyzed the data. Fang Huang wrote the manuscript. All authors read and approved the final manuscript.

Conflicts of Interest

The authors declare no conflict of interest.

References

  1. An, N.; Price, K.P.; Blair, J.M. Estimating above-ground net primary productivity of the tallgrass prairie ecosystem of the Central Great Plains using AVHRR NDVI. Int. J. Remote Sens. 2013, 34, 3717–3735. [Google Scholar] [CrossRef]
  2. Buyantuyev, A.; Wu, J. Urbanization alters spatiotemporal patterns of ecosystem primary production: A case study of the Phoenix metropolitan region, USA. J. Arid Environ. 2009, 73, 512–520. [Google Scholar] [CrossRef]
  3. Le Houèrou, H.N. Rain use efficiency: Unifying concept in arid-land ecology. J. Arid Environ. 1984, 7, 213–247. [Google Scholar]
  4. Fensholt, R.; Rasmussen, K. Analysis of trends in the Sahelian “rain-use efficiency” using GIMMS NDVI, RFE and GPCP rainfall data. Remote Sens. Environ. 2011, 115, 438–451. [Google Scholar] [CrossRef]
  5. Hein, L.; Ridder, D.E. Desertification in the Sahel: A reinterpretation. Glob. Chang. Biol. 2006, 12, 751–758. [Google Scholar] [CrossRef]
  6. Verón, S.R.; Paruelo, J.M.; Oesterheld, M. Assessing desertification. J. Arid Environ. 2006, 66, 751–763. [Google Scholar] [CrossRef]
  7. Snyman, H.A.; Fouché, H.J. Production and water-use efficiency of semi-arid grasslands of South Africa as affected by veld condition and rainfall. Water S. Afr. 1991, 17, 263–268. [Google Scholar]
  8. Nicholson, S.E.; Tucker, C.J.; Ba, M.B. Desertification, drought, and surface vegetation: An example from the West African Sahel. Bull. Am. Meteorol. Soc. 1998, 79, 815–829. [Google Scholar] [CrossRef]
  9. Prince, S.D.; de Colstoun, E.B.; Kravitz, L.L. Evidence from rain use efficiencies does not support extensive Sahelian desertification. Glob. Chang. Biol. 1998, 4, 359–374. [Google Scholar] [CrossRef]
  10. Wessels, K.J.; Prince, S.D.; Malherbe, J.; Small, J.; Frost, P.E.; VanZyl, D. Can human-induced land degradation be distinguished from the effects of rainfall variability? A case study in South Africa. J. Arid Environ. 2007, 68, 271–297. [Google Scholar] [CrossRef]
  11. Huxman, T.E.; Smith, M.D.; Fay, P.A.; Knapp, A.K.; Shaw, M.R.; Loik, M.E.; Smith, S.D.; Tissue, D.T.; Zak, J.C.; Weltzin, J.F.; et al. Convergence across biomes to a common rain-use efficiency. Nature 2004, 429, 651–654. [Google Scholar] [CrossRef] [PubMed]
  12. Bai, Y.F.; Wu, J.G.; Xing, Q.; Pan, Q.M.; Huang, J.H.; Yang, D.L.; Han, X.G. Primary production and rain use efficiency across a precipitation gradient on the Mongolia Plateau. Ecology 2008, 89, 2140–2153. [Google Scholar] [CrossRef] [PubMed]
  13. Hu, Z.M.; Yu, G.R.; Fan, J.W.; Zhong, H.P.; Wang, S.Q.; Li, S.G. Precipitation-use efficiency along a 4500-km grassland transect. Glob. Ecol. Biogeogr. 2010, 19, 842–851. [Google Scholar]
  14. Li, H.X.; Liu, G.H.; Fu, B.J. Spatial variations of rain-use efficiency along a climate gradient on the Tibetan Plateau: A satellite-based analysis. Int. J. Remote Sens. 2013, 34, 7487–7503. [Google Scholar] [CrossRef]
  15. Diouf, A.; Lambin, E.F. Monitoring landcover change in semi arid regions: Remote sensing data and field observati on in Ferlo, Senegal. J. Arid Environ. 2001, 48, 129–148. [Google Scholar] [CrossRef]
  16. Symeonakis, E.; Drake, N. Monitoring desertification and land degradation over sub-Saharan Africa. Int. J. Remote Sens. 2004, 25, 573–592. [Google Scholar] [CrossRef]
  17. Prince, S.D.; Wessels, K.J.; Tucker, C.J.; Nicholson, S.E. Desertification in the Sahel: A reinterpretation of a reinterpretation. Glob. Chang. Biol. 2007, 13, 1308–1313. [Google Scholar] [CrossRef]
  18. Bai, Z.G.; Dent, D.L.; Olsson, L.; et al. Proxy global assessment of land degradation. Soil Use Manag. 2008, 24, 223–234. [Google Scholar] [CrossRef]
  19. Del Borrio, G.; Puigdefabregas, J.; Sanjuan, M.E.; Stellmes, M.; Ruiz, A. Assessment and monitoring of land condition in the Iberian Peninsula, 1989–2000. Remote Sens. Environ. 2010, 114, 1817–1832. [Google Scholar] [CrossRef]
  20. Hein, L.; de Ridder, N.; Hiernaux, P.; Leemans, R.; de Wit, A.; Schaepman, M. Desertification in the Sahel: Towards better accounting for ecosystem dynamics in the interpretation of remote sensing images. J. Arid Environ. 2011, 75, 1164–1172. [Google Scholar] [CrossRef]
  21. Fensholt, R.; Rasmussen, K.; Kaspersen, P.; Swinnen, E. Assessing land degradation/recovery in the African Sahel from long-term earth observation based primary productivity and precipitation relationships. Remote Sens. 2013, 5, 664–686. [Google Scholar] [CrossRef] [Green Version]
  22. Dardel, C.; Kergoat, L.; Hiernaux, P.; Grippa, M.; Mougin, E.; Ciais, P.; Nguyen, C. Rain-Use-Efficiency: What it Tells us about the Conflicting Sahel Greening and Sahelian Paradox. Remote Sens. 2014, 6, 3446–3474. [Google Scholar] [CrossRef]
  23. Xu, X.; Sherry, R.A.; Niu, S.L.; Li, D.J.; Luo, Y.Q. Net primary productivity and rain-use efficiency as affected by warming, altered precipitation, and clipping in a mixed-grass prairie. Glob. Chang. Biol. 2013, 19, 2753–2764. [Google Scholar] [CrossRef] [PubMed]
  24. Paruelo, J.M.; Lauenroth, W.K.; Burke, I.C.; et al. Grassland precipitation-use efficiency varies across a resource gradient. Ecosystems 1999, 2, 64–68. [Google Scholar] [CrossRef]
  25. Li, H.X.; Wei, X.H.; Zhou, H.Y. Rain-use efficiency and NDVI-based assessment of karst ecosystem degradation or recovery: A case study in Guangxi, China. Environ. Earth Sci. 2015, 74, 977–984. [Google Scholar] [CrossRef]
  26. Zhang, G.L.; Dong, J.W.; Xiao, X.M.; Hua, Z.M.; Sheldon, S. Effectiveness of ecological restoration projects in Horqin Sandy Land, China based on SPOT-VGT NDVI data. Ecol. Eng. 2012, 38, 20–29. [Google Scholar] [CrossRef]
  27. Li, A.M.; Han, Z.W.; Xu, J.; Ma, S.X.; Huang, C.H. Transformation dynamics of desertification in Horqin Sandy Land at the beginning of 21st Century. Acta Geogr. Sin. 2006, 61, 976–984. [Google Scholar]
  28. Du, Z.T.; Zhan, Y.L.; Wang, C.Y.; Song, G.Z. The dynamic monitoring of desertification in Horqin Sandy Land on the basis of MODIS NDVI. Remote Sens. Land Resour. 2009, 20, 14–18. [Google Scholar]
  29. Peng, F.; Wang, T.; Xue, X. Study of human impact on vegetation in desertified regions based on rainfall use efficiency-A case study of Horqin region, Inner Mongolia. J. Desert Res. 2010, 30, 896–902. [Google Scholar]
  30. Yin, H.; Li, Z.G.; Wang, Y.L.; Cai, F. Assessment of desertification using time series analysis of hyper-temporal vegetation indicator in Inner Mongolia. Acta Geogr. Sin. 2011, 66, 653–661. [Google Scholar]
  31. An, N.; Wei, X.; Luan, J.; Fu, Y.L. Analysis of the dynamic characteristics of groundwater for recently ten years in Chifeng urban area. Inn. Mong. Agric. Sci. Technol. 2015, 43, 120–122. [Google Scholar]
  32. Zhao, H.L.; Zhou, R.L.; Su, Y.Z.; Zhang, H.; Zhao, L.Y.; Drake, S. Shrub facilitation of desert land restoration in the Horqin Sand Land of Inner Mongolia. Ecol. Eng. 2007, 31, 1–8. [Google Scholar] [CrossRef]
  33. Stokes, A.; Sotir, R.; Chen, W.; Chestem, M. Soil bio- and eco-engineering in China: Past experience and future priorities preface. Ecol. Eng. 2010, 36, 247–257. [Google Scholar] [CrossRef]
  34. Gobron, N.; Pinty, B.; Verstraete, M.M.; Widlowski, J.L. Advanced vegetation indices optimized for upcoming sensors: Design, performance and applications. IEEE Trans. Geosci. Remote Sens. 2000, 38, 2489–2505. [Google Scholar]
  35. Liu, S.L.; Wang, T.; Guo, J.; Qu, J.J.; An, P.J. Vegetation change based on SPOT-VGT data from 1998 to 2007, northern China. Environ. Earth Sci. 2010, 60, 1459–1466. [Google Scholar] [CrossRef]
  36. Telesca, L.; Lasaponara, R.; Lanorte, A. Intra-annual dynamical persistent mechanisms in mediterranean ecosystems revealed SPOT-VEGETATION time series. Ecol. Complex. 2008, 5, 151–156. [Google Scholar] [CrossRef]
  37. Huang, F.; Wang, P. Vegetation change of ecotone in west of Northeast China Plain using time-series remote sensing Data. Chin. Geogr. Sci. 2010, 20, 167–175. [Google Scholar] [CrossRef]
  38. Amri, R.; Zribi, M.; Lili-Chabaane, Z.; Duchemin, B.; Gruhier, C.; Chehbouni, A. Analysis of vegetation behavior in a North African semi-arid region, using SPOT-VEGETATION NDVI data. Remote Sens. 2011, 3, 2568–2590. [Google Scholar] [CrossRef] [Green Version]
  39. VITO. Product Distribution Portal. Available online: http://www.vito-eodata.be/ (accessed on 21 June 2015).
  40. National Meteorological Information Center of China. Available online: http://data.cma.cn (accessed on 21 June 2015).
  41. NASA's Earth Observing System Data and Information System. Available online: http://reverb.echo.nasa.gov/reverb/ (accessed on 21 June 2015).
  42. Global Land Cover Characteristics Data Base Version 2.0. Available online: http://edc2.usgs.gov/glcc/globdoc2_0.php (accessed on 21 June 2015).
  43. Jilin Provincial Bureau of Statistics. Jilin Statistical Book; China Statistical Press: Beijing, China, 2000–2012.
  44. Statistics Bureau of Inner Mongolia Autonomous Region. Inner Mongolia Statistical Book; China Statistical Press: Beijing, China, 2000–2012.
  45. Tucker, C.J.; Justice, C.O.; Prince, S.D. Monitoring the grasslands of the Sahel 1984–1985. Int. J. Remote Sens. 1986, 7, 1571–1582. [Google Scholar] [CrossRef]
  46. Justice, C.O.; Eck, T.; Tanre, D.; Holben, B. The effect of water vapor on the normalized difference vegetation index derived for the Sahelian Region from NOAA AVHRR data. Int. J. Remote Sens. 1991, 12, 1165–1188. [Google Scholar] [CrossRef]
  47. Pickup, G. Estimating the effects of land degradation and rainfall variation on productivity in rangelands: An approach using remote sensing and models of grazing and herbage dynamics. J. Appl. Ecol. 1996, 33, 819–832. [Google Scholar] [CrossRef]
  48. Holm, A.M.; Cridland, S.W.; Roderick, M.L. The use of time-integrated NOAA NDVI data and rainfall to assess landscape degradation in the arid shrubland of Western Australia. Remote Sens. Environ. 2003, 85, 145–158. [Google Scholar] [CrossRef]
  49. Prince, S.D.; Tucker, C.J. Satellite remote sensing of rangelands in Botswana II: NOAA AVHRR and herbaceous vegetation. Int. J. Remote Sens. 1986, 7, 1555–1570. [Google Scholar] [CrossRef]
  50. Prince, S.D.; Justice, C.O. Coarse resolution remote sensing in the Sahelian environment. Int. J. Remote Sens. 1991, 12, 1133–1421. [Google Scholar]
  51. Wessels, K.J.; Prince, S.D.; Zambatis, N.; MacFadyen, S.; Frost, P.E.; Van Zyl, D. Relationship between herbaceous biomass and 1-km2 Advanced Very High Resolution Radiometer (AVHRR) NDVI in Kruger National Park, South Africa. Int. J. Remote Sens. 2006, 27, 951–973. [Google Scholar] [CrossRef]
  52. Tucker, C.J.; Vanpraet, C.; Boerwinkel, E.; Gaston, A. Satellite remote-sensing of total dry-matter production in the Senegalese Sahel. Remote Sens. Environ. 1983, 13, 461–474. [Google Scholar] [CrossRef]
  53. Paruelo, J.M.; Epstein, H.E.; Lauenroth, W.K.; Burke, I.C. ANPP estimates from NDVI for the central grassland region of the United States. Ecology 1997, 78, 953–958. [Google Scholar] [CrossRef]
  54. Rasmussen, M.S. Developing simple, operational, consistent NDVI-vegetation models by applying environmental and climatic information: Part I. Assessment of net primary production. Int. J .Remote Sens. 1998, 19, 97–117. [Google Scholar] [CrossRef]
  55. Hope, A.; Boynton, W.; Stow, D.; Douglas, D.C. Inter-annual growth dynamics of vegetation in the Kuparuk River watershed based on the normalized difference vegetation index. Int. J. Remote Sens. 2003, 24, 3413–3425. [Google Scholar] [CrossRef]
  56. Ma, M.G.; Frank, V. Interannual variability of vegetation cover in the Chinese Heihe River Basin and its relation to meteorological parameters. Int. J. Remote Sens. 2006, 27, 3473–3486. [Google Scholar] [CrossRef]
  57. Deng, J.L. The control problems of grey system. Syst. Control Lett. 1982, 1, 288–294. [Google Scholar]
  58. Deng, J.L. Introduction to Grey System Theory. J. Grey Syst. 1989, 1, 1–24. [Google Scholar]
  59. Fu, C.; Zheng, J.; Zhao, J.; Xu, W. Application of grey relational analysis for corrosion failure of oil tubes. Corros. Sci. 2001, 43, 881–889. [Google Scholar] [CrossRef]
  60. Sallehuddin, R.; Shamsuddin, S.M.; Hashim, S.Z.M. Hybridization model of linear and nonlinear time series data for forecasting. In Proceedings of the Second Asia International Conference on Modeling & Simulation, Kuala Lumpur, Malaysia, 13–15 May 2008; pp. 597–602.
  61. Lin, S.T.; Horng, S.J.; Lee, B.H.; Khan, M.K. Application of Grey-Relational Analysis to Find the Most Suitable Watermarking Scheme. Int. J. Innov. Comput. Inf. Control 2011, 7, 5389–5401. [Google Scholar]
  62. Tan, X.R.; Li, Y.G. Using grey relational analysis to analyze the medical data. Kybernetes 2004, 33, 355–362. [Google Scholar]
  63. Song, Q.; Shepperd, M. Predicting software project effort: A grey relational analysis based method. Expert Syst. Appl. 2011, 38, 7302–7316. [Google Scholar] [CrossRef]
  64. Deng, J.L. Properties of relational space for grey systems. In Grey Systems; China Ocean Press: Beijing, China, 1988; pp. 1–13. [Google Scholar]
  65. Huang, L.; Xiao, T.; Zhao, Z.P.; Sun, C.Y.; Liu, J.Y.; Shao, Q.Q.; Fan, J.W.; Wang, J.B. Effects of grassland restoration programs on ecosystems in arid and semiarid China. J. Environ Manag. 2013, 117, 268–275. [Google Scholar] [CrossRef] [PubMed]
  66. Li, X.Y.; Song, K.S.; Zhang, B.; Liu, D.W.; Guo, Z.X. Assessment for salinized wasteland expansion and land use change using GIS and remote sensing in the west part of Northeast China. Environ. Monit. Assess. 2007, 131, 421–437. [Google Scholar] [CrossRef] [PubMed]
  67. Gao, J.; Liu, Y.S.; Chen, Y.F. Land cover changes during agrarian restructuring in Northeast China. Appl. Geogr. 2006, 26, 312–322. [Google Scholar] [CrossRef]
  68. Mu, S.J.; Zhou, K.X.; Qi, Y.; Chen, Y.Z.; Fang, Y.; Zhu, C. Spatio-temporal patterns of precipitation-use efficiency of vegetation and their controlling factors in Inner Mongolia. Chin. J. Plant Ecol. 2014, 38, 2–16. [Google Scholar]
  69. Wang, J.; Li, B.L.; Yu, W.L. Analysis of vegetation trend and their causes during recent 30 years in Inner Mongolia Autonomous Region. J. Arid Land Resour. Environ. 2012, 26, 132–137. [Google Scholar]
  70. Mu, S.J.; Li, J.L.; Chen, Y.Z.; Gang, C.C.; Zhou, W.; Ju, W.M. Spatial Differences of Variations of Vegetation Coverage in Inner Mongolia during 2001–2010. Acta Geogr. Sin. 2012, 67, 1255–1268. [Google Scholar]
  71. Zhang, Q.Y.; Zhao, D.S.; Wu, S.H.; Dai, E.F. Research on Vegetation Changes and Influence Factors Based on Eco-geographical Regions of Inner Mongolia. Sci. Geogr. Sin. 2013, 33, 594–601. [Google Scholar]
  72. Tucker, C.J.; Slayback, D.A.; Pinzon, J.E.; Los, S.O.; Myneni, R.B.; Taylor, M.G. Higher northern latitude normalized difference vegetation index and growing season trends from 1982 to 1999. Int. J. Biometeorol. 2001, 45, 184–190. [Google Scholar] [CrossRef] [PubMed]
  73. Yu, F.F.; Price, K.P.; Ellis, J.; Shi, P.J. Response of seasonal vegetation development to climatic variations in eastern central Asia. Remote Sens. Environ. 2003, 87, 42–54. [Google Scholar] [CrossRef]
  74. Ye, H.; Wang, J.B.; Huang, M.; Qi, S.H. Spatial pattern of vegetation precipitation use efficiency and its response to precipitation and temperature on the Qinghai-Xizang Plateau of China. Chin. J. Plant Ecol. 2012, 36, 1237–1247. [Google Scholar] [CrossRef]
  75. Kuo, Y.Y.; Yang, T.H.; Huang, G.W. The use of gray relational analysis in solving multi attribute decision making problems. Comput. Ind. Eng. 2008, 55, 80–93. [Google Scholar] [CrossRef]
Figure 1. Location map of the west of Songliao Plain, China.
Sustainability 08 00308 g001
Figure 2. Spatial pattern of multi-year average rain-use efficiency (RUE) in studied area.
Sustainability 08 00308 g002
Figure 3. Spatial pattern of RUE slope value.
Sustainability 08 00308 g003
Figure 4. Spatial distribution of significance test of RUE change during 1999–2011.
Sustainability 08 00308 g004
Figure 5. Area changes of land use/cover during 2001–2011.
Sustainability 08 00308 g005
Figure 6. Main conversions of land use/cover during 2001–2011.
Sustainability 08 00308 g006
Figure 7. Average RUE slope in main land use/cover change (LUCC) types.
Sustainability 08 00308 g007
Figure 8. The changes of climate variables (a); and socio-economic factors (b) in the study area.
Sustainability 08 00308 g008
Figure 9. The GRG values of eight impact factors: (a) precipitation; (b) sunshine hours; (c) average temperature; (d) relative humidity; (e) population density; (f) gross domestic product (GDP); (g) grain production; and (h) livestock number.
Sustainability 08 00308 g009
Figure 10. The spatial pattern of the most influential determinant.
Sustainability 08 00308 g010
Figure 11. The area portions of contributing factors to significant changes in RUE.
Sustainability 08 00308 g011
Table 1. Rain-use efficiency (RUE) change trend in the studied area (1999–2011).
RUE Change TrendSignificant Level (p)Area (%)
Highly significant decreaseSLOPE < 0, p ≤ 0.010.07
Significant decreaseSLOPE < 0, 0.01 < p ≤ 0.050.41
Moderately significant decreaseSLOPE < 0, 0.05 < p ≤ 0.10.81
no significant changep > 0.194.47
Moderately significant increaseSLOPE > 0, 0.05 < p ≤ 0.12.25
Significant increaseSLOPE > 0, 0.01 < p ≤ 0.051.66
Highly significant increaseSLOPE > 0, p ≤ 0.010.32

