
Network Patterns of Inventor Collaboration and Their Effects on Innovation Outputs


Abstract
:1. Introduction
2. Hypothesis Development
2.1. Structural Holes
2.2. Strength of Ties
2.3. Centralization
2.4. Additional Test: Interaction Effects
3. Research Methodology
3.1. Research Sample
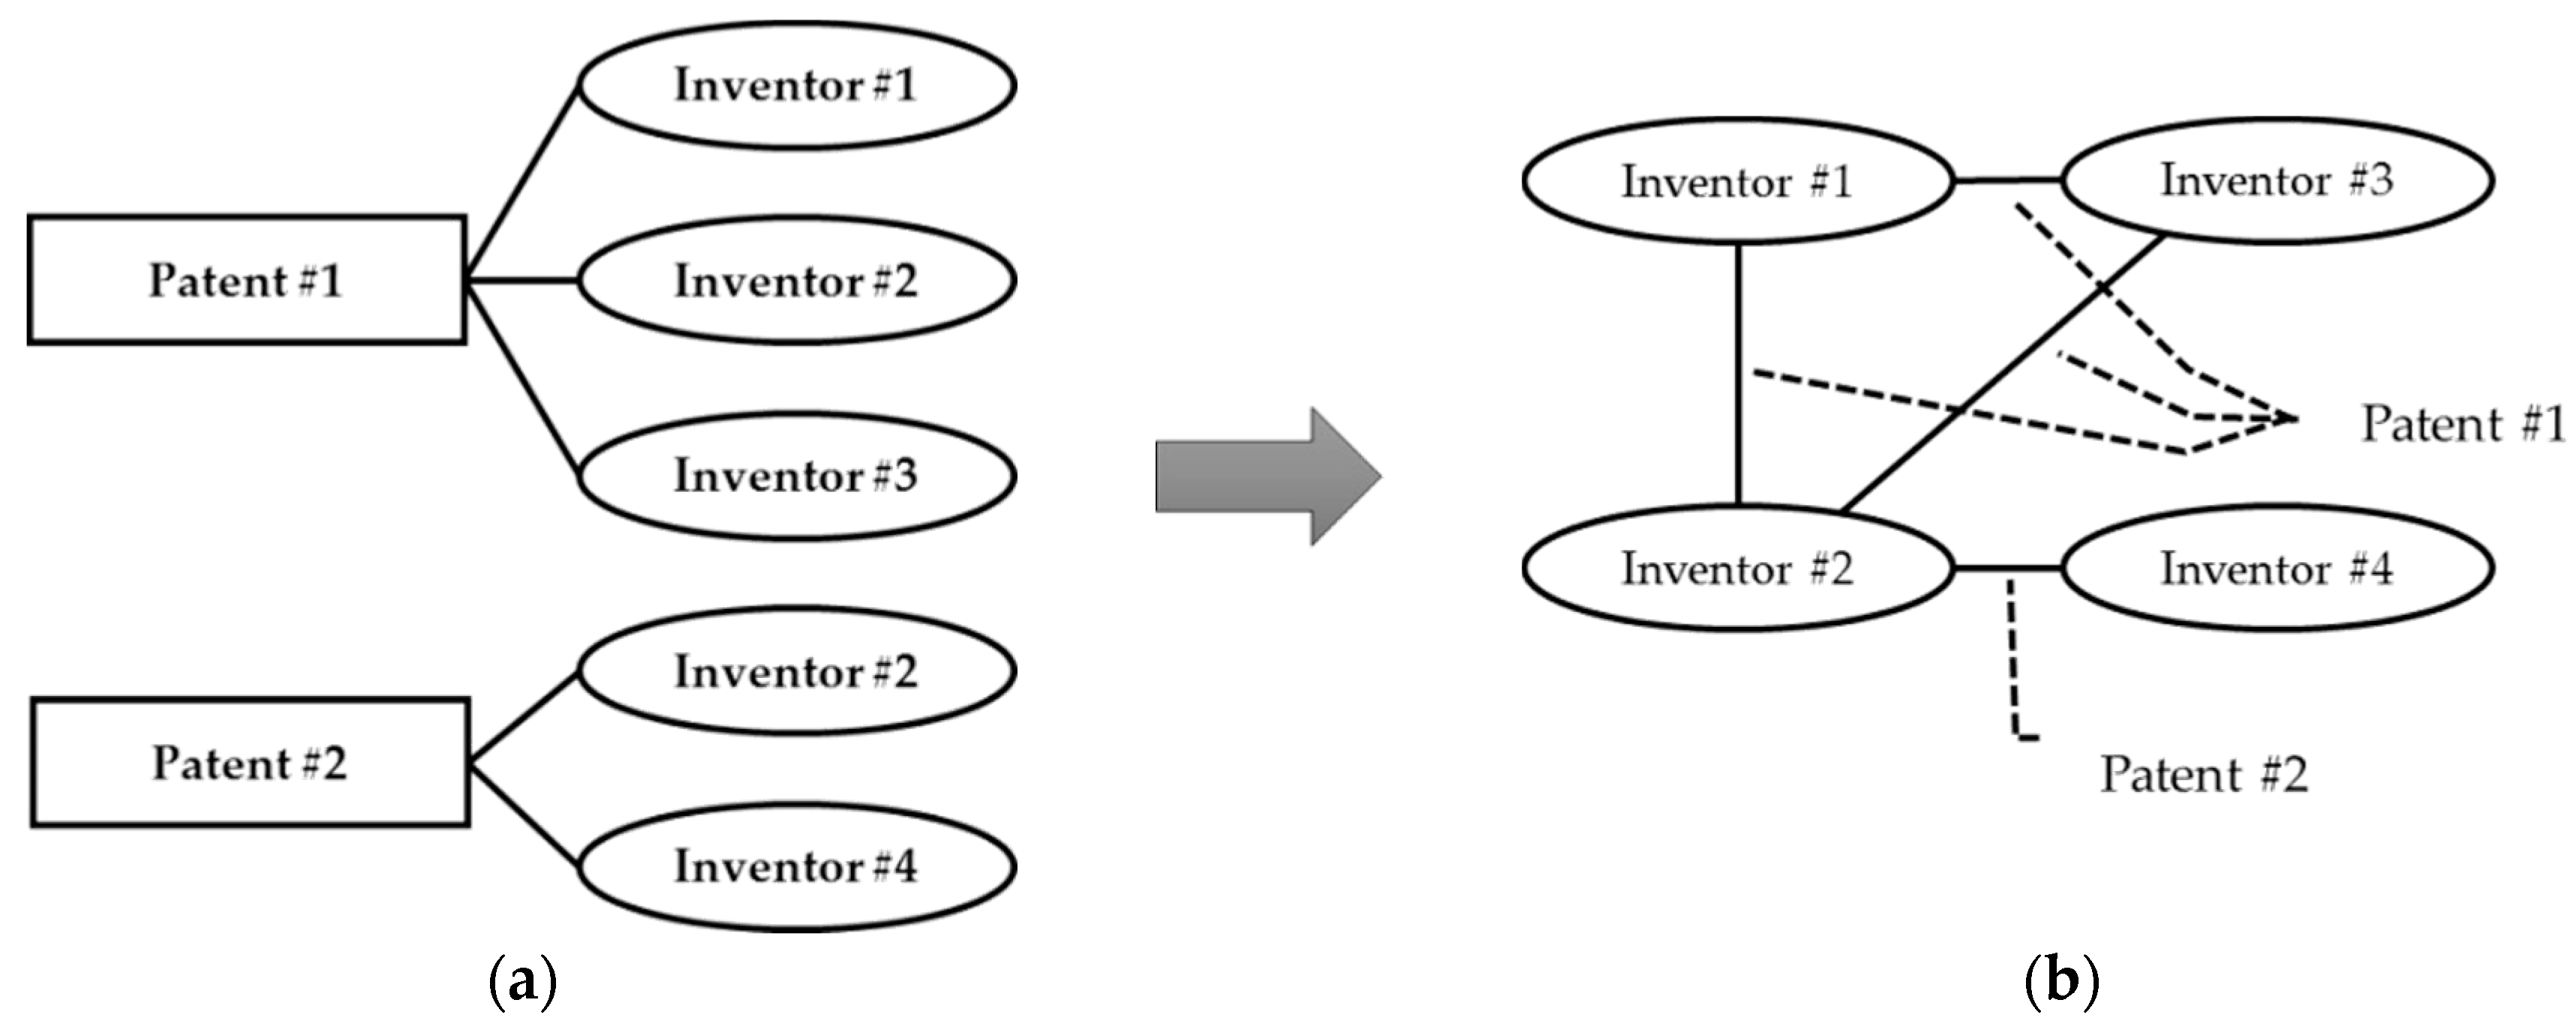
3.2. Construction of Measures
3.2.1. Dependent Variable: Patent Citations
3.2.2. Measures for Structural Holes: Average Degree and Clustering Coefficient
3.2.3. Measures for Centralization: Weighted Degree Centralization, Number of Components, and Component Concentration
3.2.4. Measure for Strength of Ties: The Ratio of Dyads with Multiple Links
3.2.5. Control Variables
4. Results
4.1. Descriptive Analysis
4.2. Estimation Result
4.3. Interaction Effects
5. Conclusions
Acknowledgments
Author Contributions
Conflicts of Interest
Appendix A. List of Sample Firms (1991–2010)

| Firm | Founded | # Links | # Inventors | # Patents | # Citations |
|---|---|---|---|---|---|
| INTERNATIONAL BUSINESS MACHINES | 1911 | 167,637 | 54,594 | 53,106 | 571,419 |
| MATSUSHITA ELECTRIC INDUSTRIAL | 1918 | 136,702 | 53,932 | 48,037 | 333,169 |
| HITACHI LTD | 1910 | 91,468 | 33,105 | 22,156 | 191,322 |
| CANON KABUSHIKI KAISHA | 1937 | 89,595 | 21,945 | 33,652 | 224,142 |
| SAMSUNG ELECTRONICS CO LTD | 1969 | 83,176 | 25,930 | 33,425 | 144,455 |
| KABUSHIKI KAISHA TOSHIBA | 1875 | 61,256 | 22,612 | 24,200 | 193,944 |
| GENERAL ELECTRIC CO | 1892 | 56,337 | 24,146 | 20,248 | 138,294 |
| FUJITSU LTD | 1935 | 54,477 | 24,053 | 22,166 | 146,758 |
| MICROSOFT CORPORATION | 1975 | 52,364 | 16,238 | 16,692 | 111,714 |
| HEWLETT PACKARD COMPANY | 1939 | 48,964 | 18,551 | 20,579 | 166,622 |
| SONY CORPORATION | 1946 | 45,787 | 21,361 | 25,569 | 153,434 |
| INTEL CORPORATION | 1968 | 45,093 | 15,378 | 18,577 | 156,438 |
| MOTOROLA INC | 1928 | 40,186 | 17,055 | 15,713 | 239,520 |
| EASTMAN KODAK COMPANY | 1881 | 36,055 | 11,087 | 14,388 | 105,916 |
| MICRON TECHNOLOGY INC | 1978 | 34,893 | 4422 | 18,587 | 201,065 |
| XEROX CORPORATION | 1906 | 34,322 | 10,058 | 11,768 | 126,900 |
| HONDA GIKEN KOGYO KABUSHIKI KAISHA | 1946 | 33,930 | 15,015 | 11,402 | 50,398 |
| NEC CORPORATION | 1899 | 33,733 | 16,390 | 22,541 | 161,485 |
| BASF AKTIENGESELLSCHAFT | 1865 | 33,651 | 10,413 | 7794 | 28,008 |
| SHARP KABUSHIKI KAISHA | 1912 | 31,048 | 11,481 | 11,566 | 80,433 |
| FUJI PHOTO FILM CO LTD | 1934 | 29,585 | 8872 | 14,104 | 55,910 |
| SIEMENS AKTIENGESELLSCHAFT | 1847 | 29,493 | 15,909 | 13,260 | 60,040 |
| ROBERT BOSCH GMBH | 1886 | 28,931 | 12,732 | 10,348 | 45,856 |
| TEXAS INSTRUMENTS INCORPORATED | 1930 | 28,748 | 11,184 | 13,085 | 150,345 |
| RICOH COMPANY LTD | 1936 | 28,629 | 8,924 | 10,052 | 73,649 |
| BAYER AG | 1863 | 27,444 | 8109 | 6622 | 28,504 |
| SEIKO EPSON CORPORATION | 1942 | 26,542 | 7796 | 12,390 | 53,712 |
| 3M INNOVATIVE PROPERTIES COMPANY | 1902 | 25,702 | 10,443 | 8744 | 108,195 |
| THE PROCTER GAMBLE COMPANY | 1837 | 23,943 | 8784 | 7385 | 68,355 |
| ADVANCED MICRO DEVICES INC | 1969 | 22,720 | 4583 | 9019 | 93,482 |
| LG ELECTRONICS INC | 1958 | 19,830 | 6929 | 8645 | 26,866 |
| TOYOTA JIDOSHA KABUSHIKI KAISHA | 1937 | 19,264 | 8668 | 6836 | 41,132 |
| APPLIED MATERIALS INC | 1967 | 18,567 | 5292 | 5121 | 56,430 |
| E I DU PONT DE NEMOURS AND COMPANY | 1802 | 18,219 | 7875 | 7697 | 49,023 |
| MERCK PATENT GMBH | 1668 | 17,646 | 6422 | 4427 | 22,547 |
| SUN MICROSYSTEMS INC | 1982 | 17,279 | 6390 | 7579 | 83,501 |
| THE REGENTS OF THE UNIVERSITY OF CALIFORNIA | 1868 | 16,801 | 11,357 | 6075 | 53,749 |
| SANYO ELECTRIC CO LTD | 1947 | 16,308 | 7291 | 5599 | 25,476 |
| KONINKLIJKE PHILIPS ELECTRONICS N V | 1891 | 16,114 | 7996 | 7483 | 19,943 |
| AT&T CORP | 1874 | 15,764 | 7389 | 6368 | 129,418 |
| HONEYWELL INC | 1906 | 15,454 | 7484 | 6502 | 32,909 |
| TAIWAN SEMICONDUCTOR MANUFACTURING COMPANY | 1987 | 15,372 | 5834 | 5317 | 31,461 |
| GENERAL MOTORS CORPORATION | 1908 | 14,746 | 7948 | 6101 | 47,719 |
| NOKIA CORPORATION | 1865 | 14,350 | 6968 | 6917 | 42,434 |
| FUJI XEROX CO LTD | 1962 | 14,137 | 5362 | 4545 | 24,498 |
| NISSAN MOTOR CO LTD | 1933 | 11,676 | 5384 | 4718 | 30,425 |
| MINOLTA CO LTD | 1928 | 11,049 | 3383 | 3994 | 26,428 |
| BRISTOL MYERS SQUIBB COMPANY | 1887 | 9913 | 3882 | 2690 | 12,702 |
| SUMITOMO CHEMICAL COMPANY LIMITED | 1913 | 9255 | 3982 | 2884 | 9475 |
| THE DOW CHEMICAL COMPANY | 1897 | 7649 | 3369 | 2659 | 29,045 |
Appendix B. Negative Binomial Regression Results for Different Time Windows
| Negative Binomial Regression Results (Polling of Data in the Three-Year Time Window) | ||||||||||
|---|---|---|---|---|---|---|---|---|---|---|
| Dependent Variable: Patent Citations | ||||||||||
| (1) | (2) | (3) | (4) | (5) | (6) | (7) | (8) | (9) | (10) | |
| Clustering coefficient | −1.507 *** (0.363) | −3.794 *** (0.442) | −3.405 *** (0.439) | |||||||
| Average degree | −0.063 ** (0.029) | −0.216 *** (0.042) | −0.116 *** (0.040) | |||||||
| Strength of ties | 1.127 ** (0.452) | 1.945 *** (0.469) | 3.404 *** (0.495) | 2.409 *** (0.492) | ||||||
| Weighted degree centralization | −13.738 *** (1.775) | −19.018 *** (1.993) | −16.861 *** (1.939) | −18.167 *** (1.979) | ||||||
| # component | 0.0004 ** (0.0002) | 0.001 *** (0.0002) | 0.001 *** (0.0002) | 0.001 *** (0.0002) | ||||||
| Component concentration | 0.083 (0.236) | −0.189 (0.344) | 2.249 *** (0.350) | 0.444 (0.375) | ||||||
| Industry (1) Construction | −0.381 (0.261) | −0.314 (0.258) | −0.431 * (0.261) | −0.383 (0.259) | −0.466 * (0.248) | −0.410 (0.260) | −0.366 (0.265) | −0.436 ** (0.222) | −0.305 (0.231) | −0.411 * (0.221) |
| Industry (2) Manufacturing | −0.267 * (0.155) | −0.281 * (0.152) | −0.240 (0.155) | −0.318 ** (0.156) | −0.246 * (0.147) | −0.308 * (0.157) | −0.271 * (0.155) | −0.600 *** (0.138) | −0.567 *** (0.145) | −0.579 *** (0.139) |
| Industry (3) Transportation | 0.230 (0.168) | 0.299 * (0.165) | 0.215 (0.167) | 0.216 (0.167) | 0.205 (0.159) | 0.171 (0.170) | 0.237 (0.169) | 0.151 (0.144) | 0.172 (0.150) | 0.177 (0.143) |
| Industry (4) Wholesale | −0.278 (0.174) | −0.251 (0.171) | −0.252 (0.173) | −0.363 ** (0.176) | −0.200 (0.166) | −0.317 * (0.176) | −0.280 (0.174) | −0.376 ** (0.154) | −0.504 *** (0.160) | −0.382 ** (0.153) |
| Industry (5) Financial etc. | −0.108 (0.254) | −0.091 (0.250) | −0.133 (0.253) | 0.034 (0.257) | −0.242 (0.242) | −0.108 (0.253) | −0.110 (0.254) | 0.035 (0.219) | 0.023 (0.228) | 0.033 (0.218) |
| Industry (6) Services | −0.263 * (0.142) | −0.247 * (0.139) | −0.201 (0.145) | −0.322 ** (0.144) | −0.279 ** (0.134) | −0.278 * (0.142) | −0.273 * (0.145) | −0.450 *** (0.133) | −0.645 *** (0.140) | −0.447 *** (0.135) |
| Period 1996–1998 | 0.035 (0.142) | 0.012 (0.139) | 0.055 (0.141) | −0.028 (0.142) | −0.037 (0.135) | 0.048 (0.141) | 0.030 (0.142) | −0.208 * (0.120) | −0.269 ** (0.125) | −0.213 * (0.119) |
| Period 1999–2001 | −0.191 (0.143) | −0.252 * (0.141) | −0.146 (0.143) | −0.272 * (0.144) | −0.255 * (0.136) | −0.163 (0.142) | −0.199 (0.144) | −0.520 *** (0.122) | −0.503 *** (0.127) | −0.507 *** (0.122) |
| Period 2002–2004 | −0.828 *** (0.144) | −0.878 *** (0.143) | −0.780 *** (0.145) | −0.889 *** (0.145) | −0.908 *** (0.137) | −0.807 *** (0.143) | −0.834 *** (0.145) | −1.146 *** (0.123) | −1.052 *** (0.129) | −1.105 *** (0.123) |
| Period 2005–2007 | −2.016 *** (0.144) | −2.052 *** (0.142) | −1.960 *** (0.146) | −2.096 *** (0.145) | −2.056 *** (0.137) | −1.994 *** (0.144) | −2.022 *** (0.145) | −2.265 *** (0.122) | −2.229 *** (0.129) | −2.224 *** (0.123) |
| Period 2008–2010 | −4.425 *** (0.145) | −4.435 *** (0.142) | −4.385 *** (0.147) | −4.466 *** (0.144) | −4.505 *** (0.137) | −4.418 *** (0.144) | −4.429 *** (0.145) | −4.597 *** (0.123) | −4.560 *** (0.130) | −4.550 *** (0.125) |
| # inventor | 0.00000 (0.0001) | 0.0001 (0.0001) | 0.00003 (0.0001) | 0.0001 (0.0001) | −0.0001 ** (0.0001) | −0.00001 (0.0001) | 0.00000 (0.0001) | 0.0001 (0.0001) | 0.0001 * (0.0001) | 0.0001 ** (0.0001) |
| # patent | 0.0004 *** (0.0001) | 0.0004 *** (0.0001) | 0.0004 *** (0.0001) | 0.0004 *** (0.0001) | 0.0005 *** (0.0001) | 0.0004 *** (0.0001) | 0.0004 *** (0.0001) | 0.0001 (0.0001) | 0.0001 (0.0001) | 0.00004 (0.0001) |
| Constant | 9.357 *** (0.181) | 10.293 *** (0.295) | 9.561 *** (0.199) | 9.099 *** (0.206) | 9.909 *** (0.188) | 9.354 *** (0.181) | 9.349 *** (0.183) | 12.169 *** (0.369) | 9.779 *** (0.208) | 12.086 *** (0.370) |
| Observations | 300 | 300 | 300 | 300 | 300 | 300 | 300 | 300 | 300 | 300 |
| Log Likelihood | −2893.224 | −2886.954 | −2891.187 | −2890.627 | −2873.980 | −2891.297 | −2893.166 | −2828.017 | −2841.271 | −2825.414 |
| theta | 1.997 *** (0.154) | 2.073 *** (0.160) | 2.021 *** (0.156) | 2.028 *** (0.156) | 2.232 *** (0.173) | 2.020 *** (0.156) | 1.998 *** (0.154) | 2.910 *** (0.228) | 2.692 *** (0.210) | 2.953 *** (0.231) |
| Akaike Inf. Crit. | 5814.447 | 5803.907 | 5812.374 | 5811.253 | 5777.961 | 5812.593 | 5816.333 | 5694.033 | 5720.542 | 5690.827 |
| Negative Binomial Regression Results (Polling of Data in the Three-Year Time Window | ||||
|---|---|---|---|---|
| Dependent Variable: Patent Citations | ||||
| (1) | (2) | (3) | (4) | |
| Clustering coefficient | −0.321 (0.642) | −2.791 *** (0.433) | −3.735 *** (0.719) | −1.372 * (0.751) |
| Average degree | −0.151 *** (0.041) | −0.116 *** (0.041) | −0.115 *** (0.040) | −0.138 *** (0.042) |
| Strength of ties | 2.131 *** (0.475) | 1.020 (0.683) | 1.694 (1.509) | −0.520 (1.513) |
| Weighted degree centralization | 18.269 *** (5.965) | −30.562 *** (3.784) | −18.036 *** (1.981) | 18.786 ** (7.631) |
| # component | 0.001 *** (0.0002) | 0.001 *** (0.0002) | 0.001 *** (0.0002) | 0.0004 ** (0.0002) |
| Component concentration | 0.887 ** (0.384) | 0.549 (0.376) | 0.445 (0.375) | 0.838 ** (0.399) |
| CC:WDC | −59.698 *** (8.712) | −61.241 *** (9.460) | ||
| ST:WDC | 46.146 *** (10.501) | 3.461 (10.473) | ||
| CC:ST | 1.130 (2.046) | 3.824 * (2.105) | ||
| Industry (1) Construction | −0.436 ** (0.208) | −0.405 * (0.217) | −0.417 * (0.221) | −0.457 ** (0.207) |
| Industry (2) Manufacturing | −0.556 *** (0.131) | −0.580 *** (0.137) | −0.565 *** (0.143) | −0.503 *** (0.135) |
| Industry (3) Transportation etc. | 0.195 (0.135) | 0.181 (0.141) | 0.183 (0.144) | 0.213 (0.135) |
| Industry (4) Wholesale trade | −0.388 *** (0.145) | −0.407 *** (0.151) | −0.373 ** (0.156) | −0.355 ** (0.147) |
| Industry (5) Financial etc. | −0.037 (0.205) | −0.027 (0.216) | 0.036 (0.218) | −0.039 (0.206) |
| Industry (6) Services | −0.423 *** (0.128) | −0.458 *** (0.133) | −0.433 *** (0.138) | −0.372 *** (0.130) |
| Period 1996–1998 | −0.213 * (0.113) | −0.188 (0.118) | −0.211 * (0.120) | −0.197 * (0.113) |
| Period 1999–2001 | −0.468 *** (0.115) | −0.458 *** (0.121) | −0.505 *** (0.122) | −0.450 *** (0.115) |
| Period 2002–2004 | −1.065 *** (0.116) | −1.064 *** (0.121) | −1.104 *** (0.123) | −1.057 *** (0.116) |
| Period 2005–2007 | −2.160 *** (0.117) | −2.175 *** (0.122) | −2.227 *** (0.123) | −2.156 *** (0.117) |
| Period 2008–2010 | −4.535 *** (0.118) | −4.522 *** (0.123) | −4.553 *** (0.125) | −4.538 *** (0.117) |
| # inventor | 0.0001 ** (0.0001) | 0.0002 *** (0.0001) | 0.0001 (0.0001) | 0.0001 (0.0001) |
| # patent | 0.0001 (0.0001) | 0.00003 (0.0001) | 0.0001 (0.0001) | 0.0002 ** (0.0001) |
| Constant | 10.265 *** (0.466) | 11.994 *** (0.380) | 12.286 *** (0.521) | 10.917 *** (0.541) |
| Observations | 300 | 300 | 300 | 300 |
| Log Likelihood | −2805.317 | −2819.324 | −2825.308 | −2803.890 |
| theta | 3.328 *** (0.262) | 3.054 *** (0.239) | 2.955 *** (0.231) | 3.369 *** (0.266) |
| Akaike Inf. Crit. | 5652.633 | 5680.648 | 5692.615 | 5653.779 |
| Negative Binomial Regression Results (Polling of Data in the Five-Year Time Window) | ||||||||||
|---|---|---|---|---|---|---|---|---|---|---|
| Dependent Variable: Patent Citations | ||||||||||
| (1) | (2) | (3) | (4) | (5) | (6) | (7) | (8) | (9) | (10) | |
| Clustering coefficient | −2.045 *** (0.417) | −4.845 *** (0.536) | −4.593 *** (0.534) | |||||||
| Average degree | −0.032 (0.032) | −0.172 *** (0.049) | −0.075 * (0.045) | |||||||
| Strength of ties | 1.026 * (0.546) | 2.029 *** (0.588) | 3.175 *** (0.649) | 2.320 *** (0.613) | ||||||
| Weighted degree centralization | −11.494 *** (2.415) | −16.696 *** (2.331) | −15.330 *** (2.395) | −16.318 *** (2.322) | ||||||
| # component | 0.0002 (0.0002) | 0.001 *** (0.0002) | 0.001 *** (0.0002) | 0.001 *** (0.0002) | ||||||
| Component concentration | 0.284 (0.266) | −0.920 ** (0.414) | 1.919 *** (0.412) | −0.491 (0.443) | ||||||
| Industry (1) Construction | −0.412 (0.309) | −0.342 (0.300) | −0.442 (0.309) | −0.409 (0.307) | −0.486 (0.299) | −0.439 (0.308) | −0.369 (0.311) | −0.548 ** (0.257) | −0.401 (0.277) | −0.542 ** (0.255) |
| Industry (2) Manufacturing | −0.239 (0.184) | −0.217 (0.178) | −0.229 (0.184) | −0.300 (0.186) | −0.253 (0.178) | −0.278 (0.187) | −0.231 (0.184) | −0.602 *** (0.160) | −0.512 *** (0.176) | −0.576 *** (0.162) |
| Industry (3) Transportation etc. | 0.318 (0.199) | 0.411 ** (0.193) | 0.306 (0.199) | 0.296 (0.199) | 0.300 (0.192) | 0.261 (0.203) | 0.351 * (0.200) | 0.175 (0.170) | 0.214 (0.185) | 0.193 (0.170) |
| Industry (4) Wholesale trade | −0.261 (0.206) | −0.220 (0.199) | −0.241 (0.206) | −0.345 (0.210) | −0.188 (0.200) | −0.283 (0.207) | −0.265 (0.206) | −0.315 * (0.180) | −0.443 ** (0.195) | −0.303 * (0.180) |
| Industry (5) Financial etc. | −0.092 (0.301) | −0.082 (0.291) | −0.103 (0.300) | 0.048 (0.306) | −0.187 (0.291) | −0.092 (0.299) | −0.098 (0.300) | 0.130 (0.259) | 0.129 (0.279) | 0.138 (0.258) |
| Industry (6) Services | −0.203 (0.167) | −0.154 (0.162) | −0.167 (0.173) | −0.262 (0.171) | −0.224 (0.161) | −0.218 (0.168) | −0.230 (0.170) | −0.289 * (0.153) | −0.537 *** (0.167) | −0.273 * (0.157) |
| Period 1996–2000 | −0.008 (0.138) | −0.075 (0.134) | 0.012 (0.139) | −0.078 (0.139) | −0.037 (0.134) | 0.007 (0.137) | −0.032 (0.138) | −0.255 ** (0.117) | −0.267 ** (0.127) | −0.253 ** (0.117) |
| Period 2001–2005 | −0.789 *** (0.141) | −0.862 *** (0.138) | −0.761 *** (0.143) | −0.852 *** (0.143) | −0.822 *** (0.136) | −0.776 *** (0.140) | −0.812 *** (0.142) | −1.065 *** (0.120) | −0.993 *** (0.131) | −1.042 *** (0.121) |
| Period 2006–2010 | −2.993 *** (0.142) | −3.044 *** (0.138) | −2.965 *** (0.146) | −3.060 *** (0.144) | −2.997 *** (0.137) | −2.982 *** (0.142) | −3.013 *** (0.143) | −3.165 *** (0.119) | −3.139 *** (0.132) | −3.139 *** (0.122) |
| # inventor | 0.00001 (0.00005) | 0.0001 (0.00005) | 0.00001 (0.00005) | 0.0001 (0.0001) | −0.0001 (0.00005) | −0.00001 (0.00005) | 0.00000 (0.00005) | 0.0001 * (0.00005) | 0.0001 (0.0001) | 0.0001 ** (0.0001) |
| # patent | 0.0003 *** (0.00004) | 0.0002 *** (0.00004) | 0.0003 *** (0.00004) | 0.0002 *** (0.00004) | 0.0003 *** (0.00004) | 0.0002 *** (0.00004) | 0.0003 *** (0.00004) | 0.00004 (0.00004) | 0.0001 (0.00005) | 0.00003 (0.00004) |
| Constant | 9.794 *** (0.203) | 10.908 *** (0.314) | 9.905 *** (0.227) | 9.521 *** (0.247) | 10.224 *** (0.221) | 9.798 *** (0.203) | 9.728 *** (0.211) | 12.875 *** (0.430) | 9.757 *** (0.249) | 12.807 *** (0.433) |
| Observations | 200 | 200 | 200 | 200 | 200 | 200 | 200 | 200 | 200 | 200 |
| Log Likelihood | −2073.957 | −2066.307 | −2073.502 | −2072.441 | −2065.733 | −2072.974 | −2073.419 | −2028.421 | −2045.462 | −2027.365 |
| theta | 2.143 *** (0.201) | 2.292 *** (0.215) | 2.151 *** (0.201) | 2.171 *** (0.203) | 2.303 *** (0.217) | 2.161 *** (0.202) | 2.153 *** (0.202) | 3.211 *** (0.307) | 2.757 *** (0.262) | 3.241 *** (0.310) |
| Akaike Inf. Crit. | 4171.914 | 4158.614 | 4173.004 | 4170.883 | 4157.465 | 4171.948 | 4172.838 | 4090.841 | 4124.925 | 4090.729 |
| Negative Binomial Regression Results (Polling of Data in the Five-Year Time Window) | ||||
|---|---|---|---|---|
| Dependent Variable: Patent Citations | ||||
| (1) | (2) | (3) | (4) | |
| Clustering coefficient | −1.172 (0.826) | −3.902 *** (0.536) | −4.645 *** (0.918) | −1.208 (0.996) |
| Average degree | −0.110 ** (0.046) | −0.068 (0.046) | −0.075 (0.046) | −0.116 ** (0.047) |
| Strength of ties | 1.609 *** (0.591) | 1.097 (0.843) | 2.229 (1.623) | 1.723 (1.725) |
| Weighted degree centralization | 15.979 ** (6.732) | −27.121 *** (5.045) | −16.282 *** (2.337) | 21.030 ** (9.765) |
| # component | 0.0004 ** (0.0002) | 0.001 *** (0.0002) | 0.001 *** (0.0002) | 0.0004 * (0.0002) |
| Component concentration | 0.363 (0.471) | −0.241 (0.438) | −0.492 (0.443) | 0.379 (0.480) |
| CC:WDC | −56.009 *** (10.308) | −59.469 *** (11.377) | ||
| ST:WDC | 33.319 ** (13.482) | −8.618 (13.784) | ||
| CC:ST | 0.163 (2.389) | 0.327 (2.422) | ||
| Industry (1) Construction | −0.518 ** (0.243) | −0.522 ** (0.253) | −0.543 ** (0.256) | −0.520 ** (0.243) |
| Industry (2) Manufacturing | −0.507 *** (0.155) | −0.546 *** (0.161) | −0.573 *** (0.166) | −0.505 *** (0.161) |
| Industry (3) Transportation etc. | 0.254 (0.162) | 0.215 (0.169) | 0.193 (0.171) | 0.253 (0.164) |
| Industry (4) Wholesale trade | −0.298 * (0.172) | −0.309 * (0.178) | −0.303 * (0.183) | −0.299 * (0.174) |
| Industry (5) Financial etc. | 0.009 (0.245) | 0.045 (0.258) | 0.139 (0.258) | 0.028 (0.248) |
| Industry (6) Services | −0.279 * (0.149) | −0.284 * (0.155) | −0.271 * (0.160) | −0.276 * (0.153) |
| Period 1996–2000 | −0.209 * (0.111) | −0.215 * (0.116) | −0.252 ** (0.118) | −0.216 * (0.113) |
| Period 2001–2005 | −0.978 *** (0.115) | −1.005 *** (0.120) | −1.042 *** (0.121) | −0.983 *** (0.116) |
| Period 2006–2010 | −3.079 *** (0.116) | −3.108 *** (0.122) | −3.140 *** (0.122) | −3.084 *** (0.117) |
| # inventor | 0.0001 * (0.00005) | 0.0001 ** (0.00005) | 0.0001 * (0.0001) | 0.0001 * (0.0001) |
| # patent | 0.0001 * (0.00004) | 0.00004 (0.00004) | 0.00003 (0.0001) | 0.0001 (0.0001) |
| Constant | 10.959 *** (0.566) | 12.661 *** (0.436) | 12.834 *** (0.604) | 10.906 *** (0.673) |
| Observations | 200 | 200 | 200 | 200 |
| Log Likelihood | −2016.186 | −2024.935 | −2027.363 | −2016.032 |
| theta | 3.598 *** (0.346) | 3.314 *** (0.317) | 3.241 *** (0.310) | 3.602 *** (0.346) |
| Akaike Inf. Crit. | 4070.373 | 4087.869 | 4092.726 | 4074.063 |
References
- Kogut, B.; Zander, U. Knowledge of the Firm, Combinative Capabilities, and the Replication of Technology. Organ. Sci. 1992, 3, 383–397. [Google Scholar] [CrossRef]
- Henderson, R.; Cockburn, I. Measuring Competence? Exploring Firm Effects in Pharmaceutical Research. Strateg. Manag. J. 1994, 28, 128–129. [Google Scholar] [CrossRef]
- Fleming, L. Recombinant Uncertainty in Technological Search. Manag. Sci. 2001, 47, 117–132. [Google Scholar] [CrossRef]
- Becker, W.; Dietz, J. R&D Cooperation and Innovation Activities of Firms—Evidence for the German Manufacturing Industry. Res. Policy 2004, 33, 209–223. [Google Scholar]
- Rosenkopf, L.; Nerkar, A. Beyond Local Search: Boundary-Spanning, Exploration, and Impact in the Optical Disk Industry. Strateg. Manag. J. 2001, 22, 287–306. [Google Scholar] [CrossRef]
- Nerkar, A. Old Is Gold? The Value of Temporal Exploration in the Creation of New Knowledge. Manag. Sci. 2003, 49, 211–229. [Google Scholar] [CrossRef]
- Ahuja, G.; Morris Lampert, C. Entrepreneurship in the large corporation: A longitudinal study of how established firms create breakthrough inventions. Strateg. Manag. J. 2001, 22, 521–543. [Google Scholar] [CrossRef]
- Fershtman, C.; Gandal, N. Direct and Indirect Knowledge Spillovers: The “Social Network” of Open-Source Projects. RAND J. Econ. 2011, 42, 70–91. [Google Scholar] [CrossRef]
- Hottenrott, H.; Lopes-Bento, C. Quantity or quality? Knowledge alliances and their effects on patenting. Ind. Corp Change 2014, 24, 981–1011. [Google Scholar] [CrossRef]
- Roda, S. Structural Holes and Managerial Performance: Identifying the Underlying Mechanisms. Soc. Netw. 2010, 32, 168–179. [Google Scholar] [CrossRef]
- Lin, N. Social Capital: A Theory of Social Structure and Action; Cambridge University Press: New York, NY, USA, 2002. [Google Scholar]
- Adler, P.S.; Kwon, S.-W. Social Capital: The Good, the Bad, and the Ugly; Marshall Research Paper Series; Boston, MA, USA, 2000. [Google Scholar]
- Borgatti, S.P.; Foster, P.C. The Network Paradigm in Organizational Research: A Review and Typology. J. Manag. 2003, 29, 991–1013. [Google Scholar]
- Coleman, J.S. Social Capital in the Creation of Human Capital. Am. J. Sociol. 1988, 94, S95–S120. [Google Scholar] [CrossRef]
- Putnam, R.D. Bowling Alone: America’s Declining Social Capital. J. Democr. 1995, 6, 65–78. [Google Scholar] [CrossRef]
- Putnam, R.D. Bowling Alone: The Collapse and Revival of American Community; Simon & Schuster: New York, NY, USA, 2000. [Google Scholar]
- Barrutia, J.M.; Echebarria, C. Social Capital, Research and Development, and Innovation: An Empirical Analysis of Spanish and Italian Regions. Eur. Urban Reg. Stud. 2010, 17, 128–145. [Google Scholar] [CrossRef]
- Nahapiet, J.; Ghoshal, S. Social Capital, Intellectual Capital, and the Organizational Advantage. Acad. Manag. Rev. 1998, 23, 242–266. [Google Scholar]
- McFadyen, M.A.; Cannella, A.A., Jr. Social Capital and Knowledge Creation: Diminishing Returns of the Number and Strength of Exchange Relationships. Acad. Manag. J. 2004, 47, 735–746. [Google Scholar] [CrossRef]
- Maskell, P.; Malmberg, A. The Competitiveness of Firms and Regions: “Ubiquitification” and the Importance of Localized Learning. Eur. Urban Reg. Stud. 1999, 6, 9–25. [Google Scholar] [CrossRef]
- Beugelsdijk, S.; Van Schaik, T. Differences in social capital between 54 Western European regions. Reg. Stud. 2005, 39, 1053–1064. [Google Scholar] [CrossRef]
- Pérez, F.; Fernandez de Guevara, J.; Serrano, L.; Montesinos, V. Measurement of Social Capital and Growth: An Economic Methodology; University Library of Munich: Munich, Germany, 2012. [Google Scholar]
- Evans, M.; Syrett, S. Generating Social Capital?: The Social Economy and Local Economic Development. Eur. Urban Reg. Stud. 2007, 14, 55–74. [Google Scholar] [CrossRef]
- Granovetter, M.S. The Strength of Weak Ties. Am. J. Sociol. 1973, 78, 1360–1380. [Google Scholar] [CrossRef]
- Nerkar, A.; Paruchuri, S. Evolution of R&D Capabilities: The Role of Knowledge Networks within a Firm. Manag. Sci. 2005, 51, 771–785. [Google Scholar]
- Hargadon, A.; Sutton, R.I. Technology Brokering and Innovation in a Product Development Firm. Adm. Sci. Q. 1997, 42, 716–749. [Google Scholar] [CrossRef]
- Stuart, T.E.; Podolny, J.M. Local Search and the Evolution of Technological Capabilities. Strateg. Manag. J. 1996, 17, 21–38. [Google Scholar]
- Reagans, R.; McEvily, B. Network Structure and Knowledge Transfer: The Effects of Cohesion and Range. Adm. Sci. Q. 2003, 48, 240–267. [Google Scholar] [CrossRef]
- Uzzi, B. Social Structure and Competition in Interfirm Networks: The Paradox of Embeddedness. Adm. Sci. Q. 1997, 42, 35–67. [Google Scholar] [CrossRef]
- Coleman, J.S. Social Theory, Social Research, and a Theory of Action. Am. J. Sociol. 1986, 91, 1309–1335. [Google Scholar] [CrossRef]
- Uzzi, B. The Sources and Consequences of Embeddedness for the Economic Performance of Organizations: The Network Effect. Am. Sociol. Rev. 1996, 61, 674–698. [Google Scholar] [CrossRef]
- Uzzi, B. Embeddedness in the Making of Financial Capital: How Social Relations and Networks Benefit Firms Seeking Financing. Am. Sociol. Rev. 1999, 64, 481–505. [Google Scholar] [CrossRef]
- Hansen, M.T. The Search-Transfer Problem: The Role of Weak Ties in Sharing Knowledge across Organization Subunits. Adm. Sci. Q. 1999, 44, 82–111. [Google Scholar] [CrossRef]
- Szulanski, G. Exploring Internal Stickiness: Impediments to the Transfer of Best Practice Within the Firm. Strateg. Manag. J. 1996, 17, 27–43. [Google Scholar]
- Burt, R.S. Structural Holes: The Social Structure of Competition; Harvard University Press: Cambridge, MA, USA, 1992. [Google Scholar]
- Lin, N.; Ensel, W.M.; Vaughn, J.C. Social Resources and Strength of Ties: Structural Factors in Occupational Status Attainment. Am. Sociol. Rev. 1981, 46, 393–405. [Google Scholar] [CrossRef]
- Podolny, J.M. A Status-Based Model of Market Competition. Am. J. Sociol. 1993, 98, 829–872. [Google Scholar] [CrossRef]
- Brass, D.J.; Burkhardt, M.E. Potential Power and Power Use: An Investigation of Structure and Behavior. Acad. Manag. J. 1993, 36, 441–470. [Google Scholar] [CrossRef]
- Ahuja, G. The Duality of Collaboration: Inducements and Opportunities in the Formation of Interfirm Linkages. Strateg. Manag. J. 2000, 21, 317–343. [Google Scholar] [CrossRef]
- Ibarra, H. Network Centrality, Power, and Innovation Involvement: Determinants of Technical and Administrative Roles. Acad. Manag. J. 1993, 36, 471–501. [Google Scholar] [CrossRef]
- Ahuja, M.K.; Galletta, D.F.; Carley, K.M. Individual Centrality and Performance in Virtual R&D Groups: An Empirical Study. Manag. Sci. 2003, 49, 21–38. [Google Scholar]
- Mehra, A.; Kilduff, M.; Brass, D.J. The Social Networks of High and Low Self-Monitors: Implications for Workplace Performance. Adm. Sci. Q. 2001, 46, 121–146. [Google Scholar] [CrossRef]
- Sorenson, O.; Stuart, T.E. Syndication Networks and the Spatial Distribution of Venture Capital Investments. Am. J. Sociol. 2001, 106, 1546–1588. [Google Scholar] [CrossRef]
- Rosenberg, N. The Direction of Technological Change: Inducement Mechanisms and Focusing Devices. Econ. Dev. Cult. Change 1969, 18, 1–24. [Google Scholar] [CrossRef]
- Dosi, G. Technological Paradigms and Technological Trajectories: A Suggested Interpretation of the Determinants and Directions of Technical Change. Res. Policy 1982, 11, 102–103. [Google Scholar] [CrossRef]
- Nelson, R.R.; Winter, S.G. An Evolutionary Theory of Economic Change; Belknap Press of Havard University Press: Cambridge, MA, USA, 1982. [Google Scholar]
- Nelson, R. The Simple Economics of Basic Scientific Research. J. Polit. Econ. 1959, 67, 297–306. [Google Scholar] [CrossRef]
- Leonard-Barton, D. Interpersonal Communication Patterns among Swedish and Boston-area Entrepreneurs. Res. Policy 1984, 13, 101–114. [Google Scholar] [CrossRef]
- Granstrand, O. Towards a Theory of the Technology-Based Firm. Res. Policy 1998, 27, 465–489. [Google Scholar] [CrossRef]
- Suzuki, J.; Kodama, F. Technological diversity of persistent innovators in Japan: Two case studies of large Japanese firms. Res. Policy 2004, 33, 531–549. [Google Scholar] [CrossRef]
- Katila, R.; Ahuja, G. Something Old, Something New: A Longitudinal Study of Search Behavior and New Product Introduction. Acad. Manag. J. 2012, 45, 1183–1194. [Google Scholar] [CrossRef]
- Nicholls-Nixon, C.L.; Woo, C.Y. Technology Sourcing and Output of Established Firms in a Regime of Encompassing Technological Change. Strateg. Manag. J. 2003, 24, 651–666. [Google Scholar] [CrossRef]
- Nesta, L.; Saviotti, P.P. Coherence of the Knowledge Base and the Firm’s Innovative Performance: Evidence from the U.S. Pharmaceutical Industry. J. Ind. Econ. 2005, 53, 123–142. [Google Scholar] [CrossRef]
- Li, G.C.; Lai, R.; D’Amour, A.; Doolin, D.M.; Sun, Y.; Torvik, V.I.; Yu, A.Z.; Lee, F. Disambiguation and Co-Authorship Networks of the U.S. Patent Inventor Database (1975–2010). Res. Policy 2014, 43, 941–955. [Google Scholar] [CrossRef]
- Rappa, M.A.; Garud, R. Modeling Contribution Spans of Scientists in a Field: The Case of Cochlear Implants. R&D Manag. 1992, 22, 337–348. [Google Scholar]
- Albert, M.B.; Avery, D.; Narin, F.; McAllister, P. Direct Validation of Citation Counts as Indicators of Industrially Important Patents. Res. Policy 1991, 20, 251–259. [Google Scholar] [CrossRef]
- Podolny, J.M.; Stuart, T.E. A Role-Based Ecology of Technological Change. Am. J. Sociol. 1995, 100, 1224–1260. [Google Scholar] [CrossRef]
- De Nooy, W.; Mrvar, A.; Batagelk, V. Exploratory Social Network Analysis with Pajek, 2nd ed.; Cambridge University Press: New York, NY, USA, 2011. [Google Scholar]
- Watts, D.J.; Strogatz, S.H. Collective Dynamics of “Small-World” Networks. Nature 1998, 393, 440–442. [Google Scholar] [CrossRef] [PubMed]
| (a) Firm A (1999–2002) | (b) Firm B (2003–2006) | |
|---|---|---|
| Network structure | 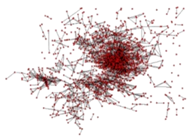 | 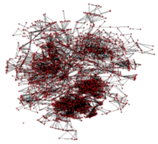 |
| Weighted degree centralization | 0.54245058 | 0.20736274 |
| Component concentration | 0.50937952 | 0.59501442 |
| # components | 182 | 119 |
| # inventors | 1443 | 1851 |
| (a) Firm A (1999–2002) | (b) Firm B (2003–2006) | |
|---|---|---|
| Network structure | 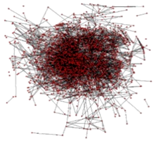 |  |
| Weighted Degree Centralization | 0.25821562 | 0.22665832 |
| Component concentration | 0.62155889 | 0.34233211 |
| # components | 129 | 225 |
| # inventors | 1867 | 1329 |
| Variable | Mean | St. Dev. | Min | Max | (1) | (2) | (3) | (4) | (5) | (6) | (7) | (8) | (9) | |
|---|---|---|---|---|---|---|---|---|---|---|---|---|---|---|
| (1) | Patent citations | 20,234.7 | 26,650.1 | 2 | 192,870 | 1 | −0.256 ** | −0.009 | 0.138 * | −0.122 | 0.391 ** | 0.116 | 0.491 ** | 0.483 ** |
| (2) | Clustering coefficient | 0 | 1 | −2.693 | 3.553 | −0.256 ** | 1 | −0.380 ** | −0.516 ** | −0.288 ** | −0.045 | −0.637 ** | −0.225 ** | −0.402 ** |
| (3) | Average degree | 4.58 | 1.68 | 1.143 | 10 | −0.009 | −0.380 ** | 1 | 0.437 ** | 0.340 ** | −0.225 ** | 0.766 ** | 0.191 ** | 0.145 * |
| (4) | Strength of ties | 0.276 | 0.09 | 0 | 0.75 | 0.138 * | −0.516 ** | 0.437 ** | 1 | 0.545 ** | −0.088 | 0.551 ** | 0.089 | 0.261 ** |
| (5) | Weighed degree centralization | 0.094 | 0.094 | 0.002 | 0.557 | −0.122 | −0.288 ** | 0.340 ** | 0.545 ** | 1 | −0.403 ** | 0.385 ** | −0.320 ** | −0.179 ** |
| (6) | # components | 501.652 | 466.634 | 2 | 2794 | 0.391− | −0.045 | −0.225 ** | −0.088 | −0.403 ** | 1 | −0.179 ** | 0.722 ** | 0.718 ** |
| (7) | Component concentration | 0.278 | 0.202 | 0.001 | 0.749 | 0.116 | −0.637 ** | 0.766 ** | 0.551 ** | 0.385 ** | −0.179 ** | 1 | 0.236 ** | 0.272 ** |
| (8) | # inventors | 2617.23 | 2452.117 | 5 | 14,824 | 0.491 ** | −0.225 ** | 0.191 ** | 0.089 | −0.320 ** | 0.722 ** | 0.236 ** | 1 | 0.921 ** |
| (9) | # patents | 2677.33 | 2648.071 | 4 | 16,338 | 0.483 ** | −0.402 ** | 0.145 * | 0.261 ** | −0.179 ** | 0.718 ** | 0.272 ** | 0.921 ** | 1 |
| Dependent Variable: | ||||||||||
|---|---|---|---|---|---|---|---|---|---|---|
| Patent Citations | ||||||||||
| (1) | (2) | (3) | (4) | (5) | (6) | (7) | (8) | (9) | (10) | |
| Clustering coefficient | −0.374 *** (0.050) | −0.814 *** (0.057) | −0.779 *** (0.057) | |||||||
| Average degree | −0.042 (0.028) | −0.240 *** (0.043) | −0.065 * (0.039) | |||||||
| Strength of ties | 1.394 ** (0.569) | 2.919 *** (0.608) | 4.430 *** (0.688) | 3.224 *** (0.612) | ||||||
| Weighed degree centralization | −0.782 (0.531) | −2.469 *** (0.539) | −1.453 ** (0.609) | −2.378 *** (0.540) | ||||||
| # components | 0.0003 * (0.0001) | 0.001 *** (0.0001) | 0.001 *** (0.0002) | 0.0005 *** (0.0002) | ||||||
| Component concentration | 0.254 (0.240) | −1.789 *** (0.333) | 1.865 *** (0.374) | −1.391 *** (0.381) | ||||||
| Period 1995–1998 | 0.050 (0.137) | 0.014 (0.129) | 0.067 (0.138) | 0.013 (0.136) | 0.050 (0.137) | 0.055 (0.137) | 0.034 (0.138) | 0.008 (0.113) | −0.064 (0.128) | 0.009 (0.114) |
| Period 1999–2002 | −0.248 * (0.140) | −0.303 ** (0.132) | −0.213 (0.141) | −0.304 ** (0.139) | −0.239 * (0.139) | −0.233 * (0.139) | −0.270 * (0.140) | −0.281 ** (0.116) | −0.318 ** (0.132) | −0.272 ** (0.117) |
| Period 2003–2006 | −1.296 *** (0.141) | −1.330 *** (0.133) | −1.253 *** (0.144) | −1.346 *** (0.140) | −1.297 *** (0.141) | −1.293 *** (0.140) | −1.320 *** (0.142) | −1.335 *** (0.118) | −1.363 *** (0.136) | −1.312 *** (0.121) |
| Period 2007–2010 | −3.558 *** (0.141) | −3.551 *** (0.133) | −3.519 *** (0.145) | −3.589 *** (0.140) | −3.561 *** (0.141) | −3.561 *** (0.141) | −3.577 *** (0.142) | −3.469 *** (0.117) | −3.536 *** (0.138) | −3.439 *** (0.123) |
| Industry (1) Construction | −0.394 (0.277) | −0.326 (0.261) | −0.432 (0.277) | −0.384 (0.275) | −0.407 (0.277) | −0.416 (0.276) | −0.350 (0.280) | −0.569 ** (0.232) | −0.300 (0.261) | −0.556 ** (0.231) |
| Industry (2) Manufacturing | −0.249 (0.165) | −0.293 * (0.155) | −0.236 (0.165) | −0.282 * (0.165) | −0.212 (0.166) | −0.286 * (0.167) | −0.246 (0.164) | −0.522 *** (0.143) | −0.334 ** (0.164) | −0.498 *** (0.145) |
| Industry (3) Transportation | 0.293 (0.179) | 0.401 ** (0.168) | 0.280 (0.178) | 0.295 * (0.177) | 0.305 * (0.178) | 0.246 (0.180) | 0.320 * (0.180) | 0.237 (0.150) | 0.311 * (0.170) | 0.256 * (0.151) |
| Industry (4) Wholesale trade | −0.261 (0.185) | −0.222 (0.174) | −0.237 (0.185) | −0.357 * (0.187) | −0.234 (0.187) | −0.281 (0.186) | −0.267 (0.185) | −0.338 ** (0.159) | −0.501 *** (0.179) | −0.337 ** (0.159) |
| Industry (5) Financial etc. | −0.116 (0.270) | −0.095 (0.254) | −0.131 (0.269) | 0.018 (0.273) | −0.153 (0.270) | −0.126 (0.269) | −0.124 (0.270) | 0.160 (0.229) | 0.075 (0.257) | 0.158 (0.228) |
| Industry (6) Services | −0.235 (0.151) | −0.214 (0.142) | −0.189 (0.155) | −0.286 * (0.151) | −0.202 (0.154) | −0.241 (0.152) | −0.264 * (0.154) | −0.137 (0.137) | −0.397 ** (0.156) | −0.132 (0.138) |
| # inventors | 0.00001 (0.00005) | 0.0002 *** (0.00005) | 0.00002 (0.00005) | 0.0001 (0.0001) | −0.00003 (0.0001) | −0.00001 (0.00005) | 0.00001 (0.00005) | 0.0003 *** (0.0001) | 0.0001 ** (0.0001) | 0.0003 *** (0.0001) |
| # patents | 0.0003 *** (0.00004) | 0.0002 *** (0.00005) | 0.0003 *** (0.00004) | 0.0003 *** (0.00005) | 0.0004 *** (0.00005) | 0.0003 *** (0.00004) | 0.0003 *** (0.00004) | −0.0001 (0.00005) | 0.0001 (0.0001) | −0.0001 * (0.0001) |
| Constant | 9.583 *** (0.188) | 9.682 *** (0.178) | 9.721 *** (0.205) | 9.278 *** (0.225) | 9.645 *** (0.191) | 9.581 *** (0.187) | 9.539 *** (0.192) | 9.773 *** (0.197) | 9.242 *** (0.222) | 9.831 *** (0.204) |
| Log Likelihood | −2518.477 | −2500.825 | −2517.558 | −2516.240 | −2517.329 | −2516.957 | −2517.954 | −2461.589 | −2494.580 | −2460.746 |
| theta | 2.128 *** (0.179) | 2.411 *** (0.204) | 2.142 *** (0.180) | 2.162 *** (0.182) | 2.145 *** (0.180) | 2.151 *** (0.181) | 2.136 *** (0.179) | 3.198 *** (0.275) | 2.520 *** (0.214) | 3.216 *** (0.276) |
| Akaike Inf. Crit. | 5062.953 | 5029.650 | 5063.115 | 5060.480 | 5062.657 | 5061.915 | 5063.908 | 4959.178 | 5025.159 | 4959.492 |
| Dependent Variable: | ||||
|---|---|---|---|---|
| Patent Citations | ||||
| (11) | (12) | (13) | (14) | |
| Clustering coefficient | −4.792 *** (0.552) | −4.787 *** (1.263) | −2.988 *** (0.534) | −0.745 (1.893) |
| Average degree | −0.475 *** (0.072) | −0.781 *** (0.059) | −0.567 *** (0.087) | −0.604 *** (0.149) |
| Strength of ties | −0.067 * (0.037) | −0.053 (0.041) | −0.061 (0.039) | 0.136 (0.149) |
| Weighed degree centralization | 3.729 *** (0.600) | 2.486 *** (0.807) | 3.540 *** (0.676) | 3.254 (2.037) |
| # components | 0.001 *** (0.0001) | 0.0005 *** (0.0002) | 0.001 *** (0.0002) | 0.002 *** (0.0004) |
| Component concentration | −0.733 * (0.379) | −1.312 *** (0.381) | −1.441 *** (0.380) | −2.024 (1.438) |
| WDC : Component concentration | −2.169 *** (0.266) | −4.554 *** (0.708) | ||
| WDC : Strength of ties | 6.333 ** (2.909) | −10.489 ** (4.263) | ||
| Component concentration: Strength of ties | −1.027 *** (0.241) | 2.058 *** (0.551) | ||
| Period 1995–1998 | −0.052 (0.105) | 0.001 (0.113) | −0.014 (0.112) | −0.121 (0.098) |
| Period 1999–2002 | −0.367 *** (0.108) | −0.296 ** (0.116) | −0.303 *** (0.115) | −0.476 *** (0.103) |
| Period 2003–2006 | −1.349 *** (0.111) | −1.315 *** (0.120) | −1.324 *** (0.118) | −1.467 *** (0.106) |
| Period 2007–2010 | −3.483 *** (0.113) | −3.457 *** (0.122) | −3.455 *** (0.120) | −3.606 *** (0.108) |
| Industry (1) Construction | −0.424 ** (0.213) | −0.526 ** (0.229) | −0.498 ** (0.227) | −0.490 ** (0.201) |
| Industry (2) Manufacturing | −0.446 *** (0.133) | −0.494 *** (0.144) | −0.491 *** (0.142) | −0.474 *** (0.135) |
| Industry (3) Transportation | 0.321 ** (0.139) | 0.272 * (0.150) | 0.258 * (0.147) | 0.263 * (0.136) |
| Industry (4) Wholesale trade | −0.396 *** (0.147) | −0.334 ** (0.158) | −0.348 ** (0.157) | −0.331 ** (0.148) |
| Industry (5) Financial etc. | −0.007 (0.210) | 0.087 (0.231) | 0.103 (0.223) | −0.014 (0.202) |
| Industry (6) Services | −0.220 * (0.128) | −0.146 (0.138) | −0.163 (0.136) | −0.290 ** (0.139) |
| # inventors | 0.0003 *** (0.00005) | 0.0003 *** (0.0001) | 0.0004 *** (0.0001) | 0.0002 *** (0.0001) |
| # patents | −0.0001 ** (0.00005) | −0.0001 ** (0.0001) | −0.0002 *** (0.0001) | 0.00003 (0.0001) |
| Constant | 9.726 *** (0.191) | 10.015 *** (0.233) | 9.776 *** (0.206) | 9.264 *** (0.534) |
| Log Likelihood | −2437.466 | −2458.617 | −2455.058 | −2412.744 |
| theta | 3.810 *** (0.329) | 3.266 *** (0.281) | 3.355 *** (0.289) | 4.558 *** (0.396) |
| Akaike Inf. Crit. | 4914.932 | 4957.235 | 4950.115 | 4893.487 |
© 2016 by the authors; licensee MDPI, Basel, Switzerland. This article is an open access article distributed under the terms and conditions of the Creative Commons by Attribution (CC-BY) license (http://creativecommons.org/licenses/by/4.0/).
Share and Cite
Hur, W.; Park, J. Network Patterns of Inventor Collaboration and Their Effects on Innovation Outputs. Sustainability 2016, 8, 295. https://doi.org/10.3390/su8040295
Hur W, Park J. Network Patterns of Inventor Collaboration and Their Effects on Innovation Outputs. Sustainability. 2016; 8(4):295. https://doi.org/10.3390/su8040295
Chicago/Turabian StyleHur, Wonchang, and Jaeho Park. 2016. "Network Patterns of Inventor Collaboration and Their Effects on Innovation Outputs" Sustainability 8, no. 4: 295. https://doi.org/10.3390/su8040295
APA StyleHur, W., & Park, J. (2016). Network Patterns of Inventor Collaboration and Their Effects on Innovation Outputs. Sustainability, 8(4), 295. https://doi.org/10.3390/su8040295