1. Introduction
The role of infrastructure projects is significant in socio-economic development due to their contributions to national competitiveness and social welfare in both developing and developed countries [
1,
2,
3,
4]. Traditionally, infrastructure projects are developed by governments using public budgets. However, the limitations of public capital and the shortage of management expertise in government departments have led to the development of an alternative procurement mechanism for developing and running infrastructure projects. This procurement mechanism is named public-private-partnership (PPP) approach. PPP mechanism serves for promoting the engagement of private sectors in the process of developing infrastructure projects, including project design, financing, construction, maintenance, and project operation. In recent years, the popularity of PPP-type infrastructure (PTI) projects has been rising particular in developing countries. Ke noted that the demand for PPP infrastructures is increasing in China whilst there are increasing number of PPP projects in the country [
2]. According to the PPP Demonstration Project List of Second Batch announced by Ministry of Finance of China, there are 206 projects with national financial support in 2015, which is seven times that of 2014 [
5]. In fact, most developing countries have been actively applying PPP policy as a contractual arrangement and condition on loans from International Organizations [
3,
6]. On one hand, PPP mechanism mitigates the burden of public fiscal shortage and ensures the timely provision of infrastructures in need [
2,
7]. On the other hand, the development of PPP-type projects presents private sectors with good business opportunities where they can apply innovative technological and the advanced management skills they have [
8,
9]. Considering the very important role and significance of PPP type infrastructures in the built environment sector, it can be seen that improving sustainability performance for PPP projects can contribute significantly to the mission of sustainable construction.
Research on examining the applications of PPP approach has been conducted extensively from many perspectives including technology innovation [
10], risk management [
11], critical success factors [
12], cooperate governance [
13], concessionaire determinants [
14,
15], and sustainability performance [
16,
17]. An increasing number of researchers have appealed for sustainability performance appraisal on PPP-type projects as an instrument for striking the trade-off among economic, social and environmental performance criteria in examining project feasibility [
16,
18,
19]. This has led to the development of several models for project sustainability performance appraisal. Ogwu
et al. proposed a sustainability appraisal in Infrastructure projects (SUSAIP) model for evaluating sustainability of infrastructure projects in Hong Kong, and shed light on various dimensions (e.g., knowledge, problem analysis, and application) of designing and constructing for better infrastructure sustainability [
16,
17]. Dasgupta and Tam synthesized sustainability indicators of civil infrastructure projects by using a multi-objectives decision approach to facilitate the choice of practical alternatives for better sustainability performance [
20]. Koo and Ariaratnam employed a sustainability assessment model to determine the option for implementing a water main replacement project towards better sustainability performance [
21]. The study by Shen
et al. suggested that a concession time period in operating infrastructure projects must incorporate the benefits, authorities and responsibilities among various project parties for the interests of better sustainability [
14]. Shen and Wu investigated a risk-based concession time period in developing build-operate-transfer-type infrastructure projects in ensuring the sustainability interests that benefit to various project parties [
15].
Whilst existing studies present various effective appraisal models for assessing the sustainability performance of various types of infrastructure projects, it appears that there is little existing research on examining the ways of improving the sustainability performance of PPP-type projects. The difficulty of sustainability appraisal for PPP-type projects is well appreciated [
14,
15]. Previous studies have addressed the selection of sustainability indicators for PPP-type projects [
16]. Nonetheless, many of the selected indicators are qualitative and how to quantify them has not been addressed. In particular, it is noted that the proportion of investment or contribution between public and private sectors has not been taken into account in the establishment of sustainability performance indicators. In fact, investment distribution from the two primary parties has major influence to project performance across various aspects including economic, social and environmental performance. These dimensional performances are the determinants to the sustainability performance of the concerned PPP projects. Furthermore, public and private sectors have different consideration for involving PPP projects. According to the study by Ling
et al. [
21], the typical factor considered by public clients include suitability to PPP, difficulties in evaluating PPP deals, political fallout, affordability and profitability, value creation and changing needs. The main factors considered by private sectors include PPP champion, speed of implementation, capability of private clients to use PPP procurement route, tendering cost and risk allocation. Koppenjan and Enserink identified governance practices that help or hinder the reconciliation of private sector participation in infrastructure projects with the objective to increase the sustainability of the urban environment. They further appreciated that private sector participation in urban infrastructure does not automatically contribute to sustainability as private sector is expected to focus on short-term financial return on investment whilst the sustainability performance of project can only be obtained from long-term perspective [
22].
Although the two primary sectors have different perceptions on the performance of a concerned PPP-type project, for example, private sector’s perception is usually based on short-term performance of project, as appreciated by Koppenjan and Enserink [
22], the main decision at inception stage for a PPP-type project is the investment distribution between public and private sectors. The investment distribution is the key variable that determines the interests of both public and private sectors from the development of a PPP-type project. It can be appreciated that the investment contributed from private sector is motivated by the expectation to earn certain level of profits. However, the investment level by private sector will affect the public interests which can only be realized from long-term perspective. For example, the public interests of environmentally friendly implementation of an infrastructure may not be considered as a major criterion if the public sector assumes a very small proportion of project investment, where the private sector’s profit level is one of the dominant factors for the consideration in project feasibility study. Robert
et al. identified four major factors which affect the levels of the public and private sectors, including benefits to local economic development, access to the public sector market, tax exemptions and reduction, and incentives to new market penetration [
3]. These factors are considered differently when the investment proportions changes between public and private sectors. The different attention given into the factors will in turn affect project sustainability performance. Therefore, a proper investment distribution in implementing a PPP scheme is the key to gaining better project sustainability performance which aims to balance social, economic and environmental interests. The aim of this study is thus to use the investment distribution between public and private sectors as the key variable in developing a sustainability performance-based evaluation model (SPbEM). The appraisal results from using the model SPbEM can help decision-makers know what distribution level of investment between public and private sectors will enable better sustainability performance of PPP-type projects.
3. Development of the Sustainability Performance Based Evaluation Model (SPbEM)
The involvement of private and public sectors in PPP-type projects is characterized with many dimensions such as contractual arrangements, structure of management organization, investment distribution, and others [
14]. Nevertheless, the investment distribution between the two sectors is the key variable to be considered in the process of contract negotiation. The level of the distribution between the two sectors will affect contractual arrangements and the organization structure of implementing the project under the principle of PPP. According to previous studies [
1,
4,
23,
24], there are sixteen contractual arrangements in line with the principle of PPP methods, as shown in
Table 1.
These approaches can be organized to a list in the order of ascending extent to which private sectors invest in developing infrastructure projects. Private businesses are by nature profit-orientated and are keen to invest public facilities provided they can make profits particularly in short-term. However, public sectors need to take into account public interests pertaining to non-economic aspects such as social and environmental interests. It is reasonable to assume that the economic performance of PPP-type projects will be one of the dominant factors considered in the decision making for considering project development if the project is fully invested by private investors. In contrast, the economic performance would not be a major consideration if a project is wholly invested within public budgets. Therefore, there exists a proper proportion of project investment between private and public sectors in order to gain better project sustainability performance which is a balanced integration among economic, social and environmental performance. In line with this analogy, the proposed model SPbEM should be enabled to assess the impact of the investment distribution between the two sectors on economic, social and environmental performance of the concerned projects.
3.1. The Primary SPbEM Model
The model SPbEM synthesizes the triple–bottom-line (TBL) indicators of project sustainability performance, namely, economical performance indicator
Ec, social performance indicator
S, and environmental performance indicator
En. The contribution of these TBL indicators to project sustainability can be expressed in Equation (1).
where
IfSV refers to the sustainability index value for a concerned PPP-type project;
Ec,
S and
En are the performance values for economic, social and environmental performance indicators respectively; and
Wi (
i = 1, 2, and 3) denotes the weighting values of the TBL indicators (economic, social and environmental performance respectively).
3.2. Investment Distribution Coefficients ()
As discussed above, the investment distribution between private and public sectors in developing PPP-type projects has major impact on project sustainability performance. The investment distribution between the two sectors can be described by two coefficients, namely,
, denoting for the proportion of public investment; and
, denoting the proportion of private investment. The two coefficients can be described in the following model in Equation (2):
where
Pu denotes the investment level (or volume) by public sector; and
Pr refers to the investment level (volume) by private sector.
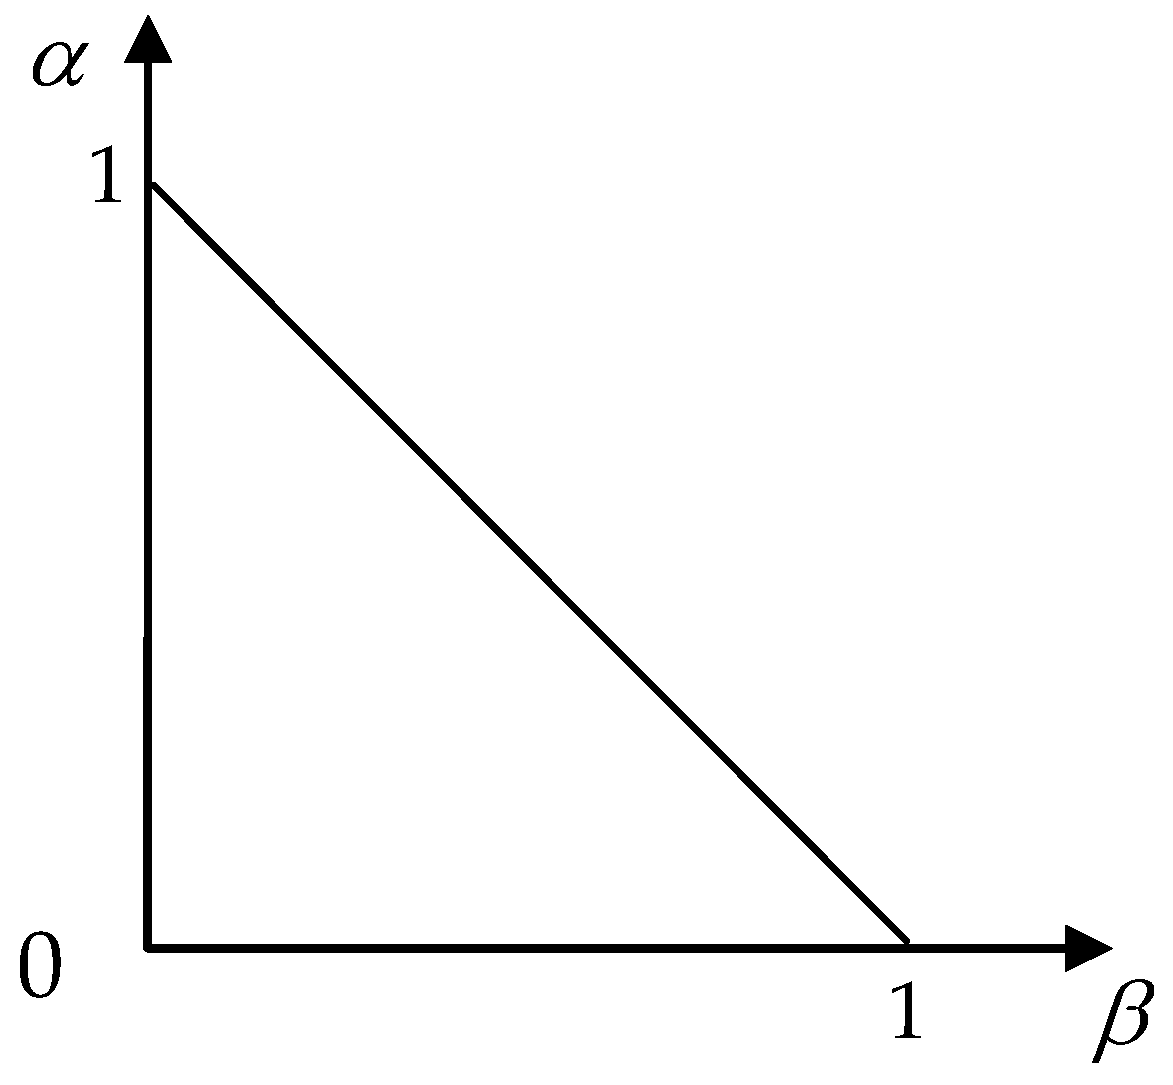
The relationships between
and
are exhibited graphically in
Figure 1. The two coefficients interacted reversely whilst both the coefficients can assume any value between 0 and 1.
There are infinite number of possible combinations of values between
and
. Among these combinations, there are three special scenarios:
- (1)
= 0 and = 1, indicating that no financial investment is contributed by public sector;
- (2)
= 0.5 and = 0.5, indicating that the project investment is equally contributed between public and private sectors; and
- (3)
= 1 and = 0, indicating that no financial investment is contributed by private sector.
These three special scenarios can be described in the following matrix model in Equation (3):
3.3. Weighting W1, W2, and W3
For a given PPP-type project, the values of the investment distribution coefficients
or
will be changed under different contractual terms or arrangements between private and public sectors. On the other hand, when different types of PPP-type projects are considered, the investment distribution between the two sectors will also be changed, namely, the values of
and
will also be changed. Therefore,
and
change with different types of contractual arrangements and different types of PPP-type projects. For example, in applying Building-Lease-Transfer (BLT) type contractual system, private sector will contribute 100% finance investment [
1]. In adopting Design-Building-Transfer (DBT) type project, public sector, namely, government will normally contribute to most part of the investment [
9].
The discussion in the previous section suggests that the investment distribution between the two investment sectors determines the project sustainability performance. In other words, the change of the investment distribution between the two sectors will also lead to the changes of project sustainability performance. In this context, when
and
change with different emphasis placed on economic, social and environmental aspects, the weighting values for the TBL indicators will change as well. Consequently, there are certain relationships among
,
and the weighting values
Wi. For example, if 0 ≤
≤ 0.5 or 0.5 ≤
≤ 1, suggesting that the private party dominates the project finance investment, economic indicator
Ec will be given a higher weighting value than that to
or
S indicators. Likewise, if 0.5 ≤
≤ 1 or 0 ≤
≤ 0.5, suggesting the dominance of public party over project investment,
and
S indicators should deserve more weights in this case. In line with these arguments, the relationships between
Wi and
(
) can be described in Equation (4).
- (1)
When 0 ≤
≤ 0.5 (or 0.5 ≤
≤ 1)
- (2)
When 0.5 ≤
≤ 1 (or 0 ≤
≤ 0.5)
3.4. Functional Relationships between () and Wi
The above discussions suggests that
and
determine the weighting values of
W1,
W2 and
W3. In other words, certain functional relationships exist between
(
) and
Wi. By considering the discussion in the previous sections, the following five assumptions are adopted to demonstrate the relationships between
(
) and
Wi.
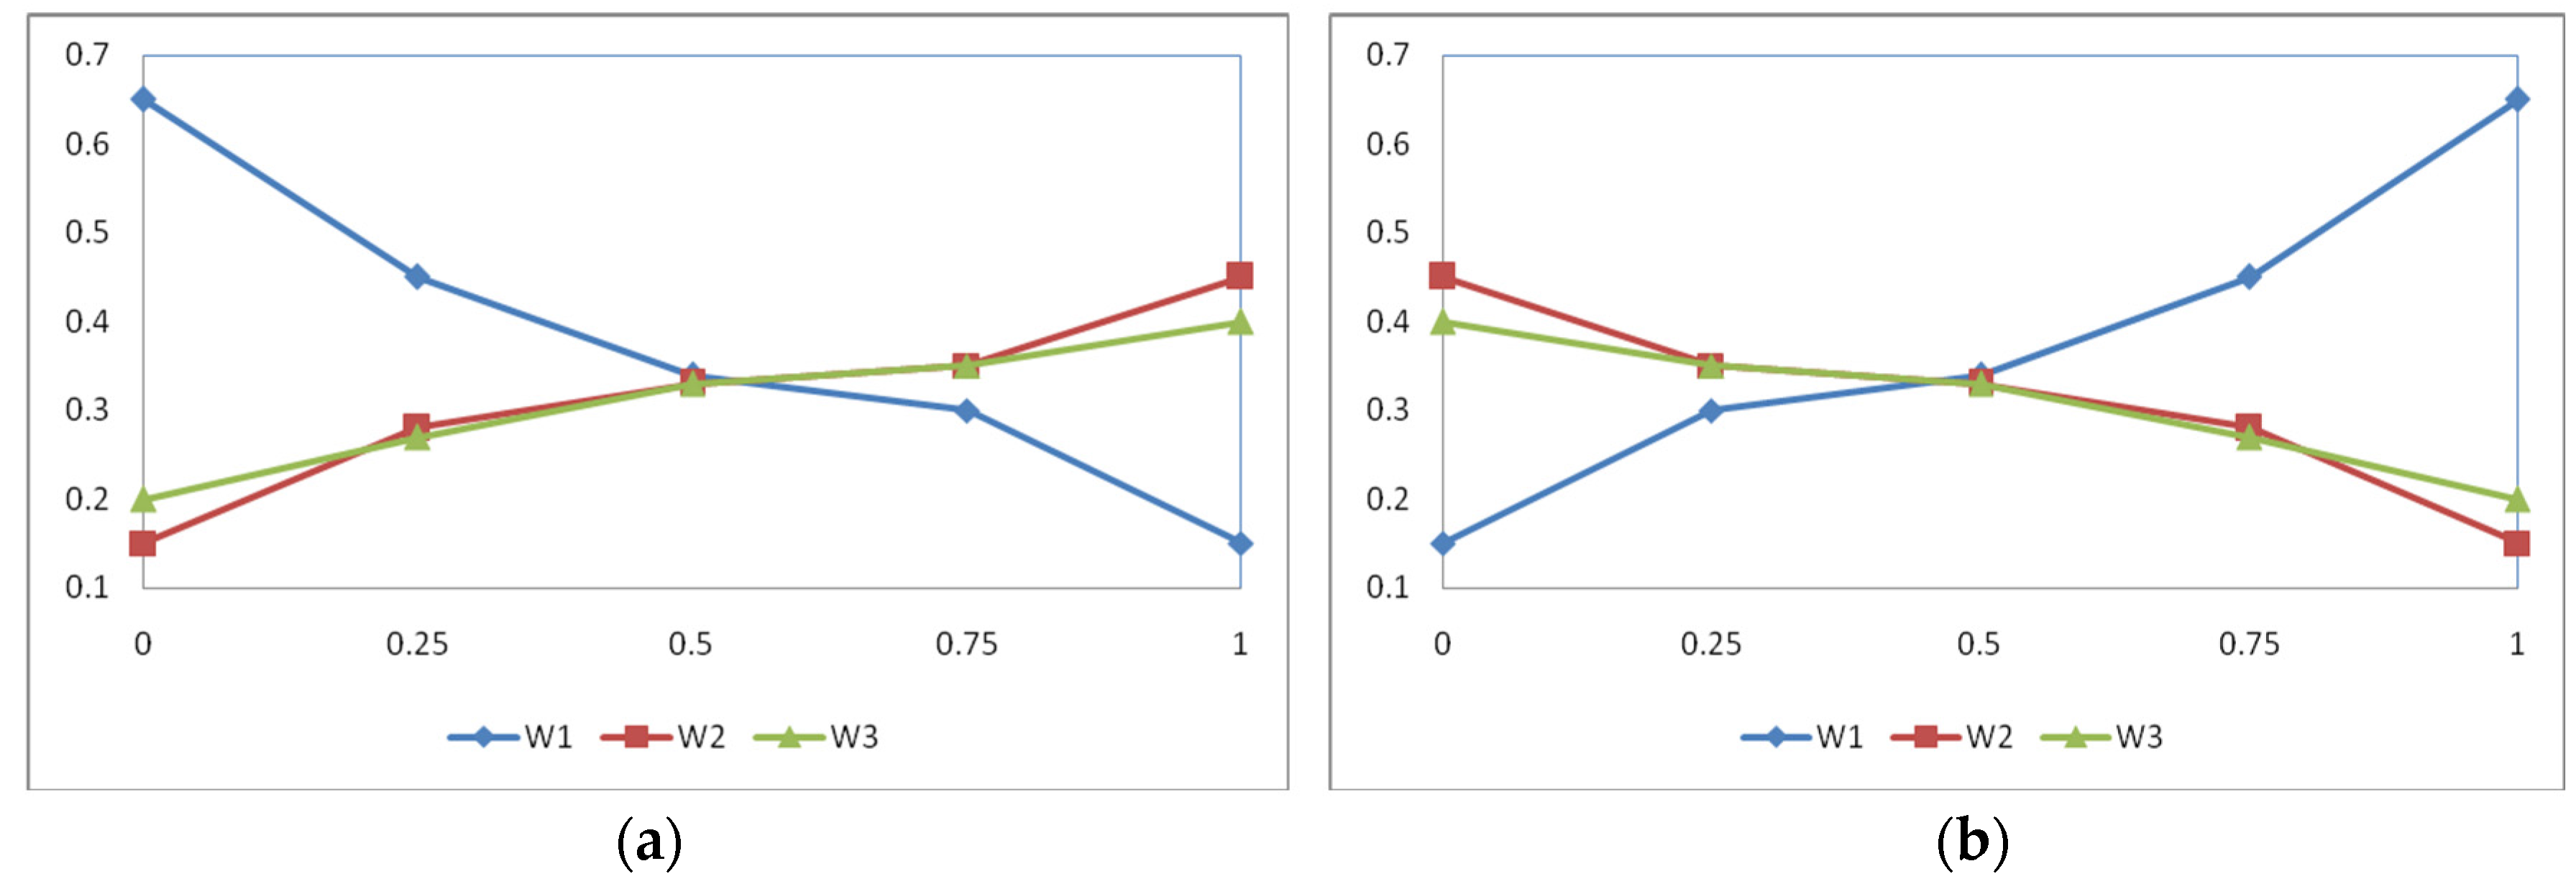
- (1)
When = 0 (or = 1), indicating no public investment involved, Ec indicator shall become the most important factor to be considered in making contractual arrangements, En has less importance while S has the least importance. In this circumstance, the reasonable assumptions on the weighting values can be considered as: W1 = 0.65, W2 = 0.15, and W3 = 0.20 respectively.
- (2)
When = 0.25 (or = 0.75), indicating less investment from public sector and more from private sector, thus economic aspect still assumes more important role that of environmental and social aspect. In line with this, reasonable weighting values are allocated as: W1 = 0.45, W2 = 0.28, and W3 = 0.27.
- (3)
When = 0.5 (or = 0.5), indicating an equal amount of investment from private and public sectors. In this circumstance, all TBL indicators are considered equally important, thus the assumption of W1 = 0.34, W2 = 0.33, and W3 = 0.33 is considered reasonable.
- (4)
When = 0.75 (or = 0.25), indicating that public sector contributes more than that by private sector, the environmental and social dimensions are considered more important than economic dimension. Nevertheless, as private sector in this case still makes significant part of investment, economic performance has to be given reasonable attention. Thus, the assumptions on the weighting values are W1 = 0.30, W2 = 0.35, and W3 = 0.35.
- (5)
When = 1 (or = 0), indicating no private finance investment involved in this. The private sector may provide technical service and management skill in the process of construction and operation of the concerned project. In this case, the indicators of S and En become significant for consideration in the process of contract negotiation, and Ec has less importance. Accordingly, the assumptions on the weighting values between three dimensional indicators are given as W1 = 0.15, W2 = 0.45, and W3 = 0.40.
The above five assumptions are summarized in
Table 2.
Furthermore, it is assumed that there is a linear relationship between
Wi and
(
):
or
These functions are determined by the values of constants
a and
b, which have been listed in
Table 3.
By applying the values in
Table 3, the following functional relationships are obtained accordingly:
or
or
or
Based on the above relationship functions, the relationships among
α(
β) and
Wi can be presented graphically in
Figure 2.
3.5. Measuring the TBL Indicators (Ec, S, and En)
The study by Ogwu
et al. showed the effectiveness of quantifying the variables of project sustainability by adopting several methods, including credit-based scoring system, scaled scoring, comparison with benchmark or other available options, credit system, and subjective judgments [
17]. Scoring method is employed in this study to measure the contribution of the TBL indicators (
Ec,
S, and
En) for reflecting sustainability performance of a particular PPP-type project. In scoring the three TBL indicators, experts are invited to judge the contribution of a concerned project to each dimensional sustainability indicator on a nine-level Likert scale (9—best, and 1—no contribution). For ensuring the effectiveness of engaging expert participation, it is suggested that at least 10 experts should be invited to participate in judging the sustainability performance of a given PPP project [
25].
There are many sub-indicators under each of the TBL indicators for measuring sustainability performance of PPP projects. The significance of individual indicators varies widely from project to project [
17,
20,
21,
26]. The framework proposed by Gan
et al. for appraising sustainability performance of PPP projects in China is adopted for illustration [
26]. The framework is composed of a set of sub-TBL indicators as shown in
Table 4.
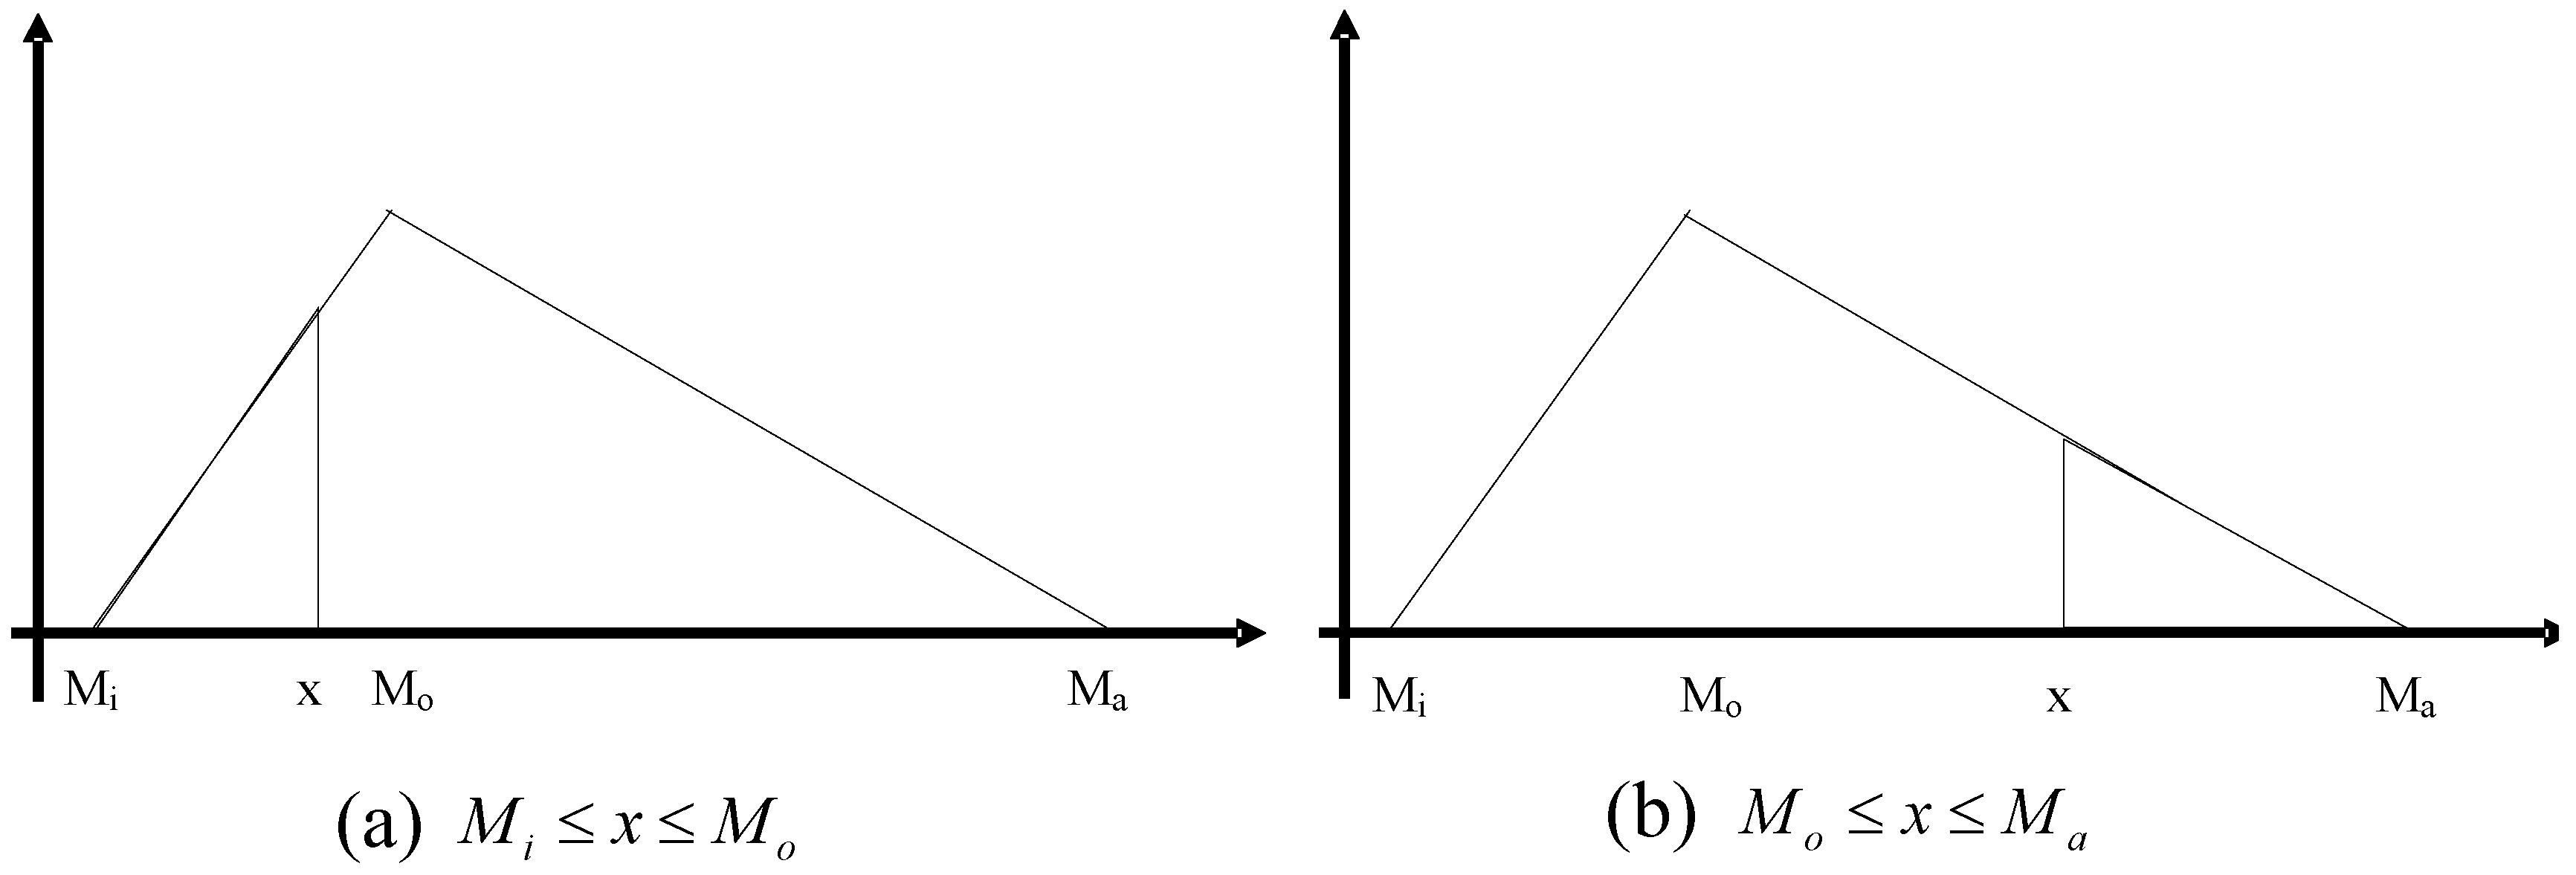
As the backgrounds and experience are different among the invited experts in study, the scores allocated by the experts are considered in probability distributions. The triangular probability distribution (TPD) is considered effective when small sample size is used in defining probability distribution [
15], which is adopted in this study. In using TPD, there are three parameters to be defined, namely, the minimum (
Mi), the maximum (
Ma) and the mode (
Mo). In line with this argument, the TPDs for defining the score performance for dimensional sustainability indicators
Ec,
S and
En are shown in
Figure 3,
Figure 4 and
Figure 5, respectively. In these distributions, parameters
Mi and
Ma determine the interval of triangle distribution, whilst the parameter
Mo determines whether a distribution is a left (negative) or right (positive) skewed.
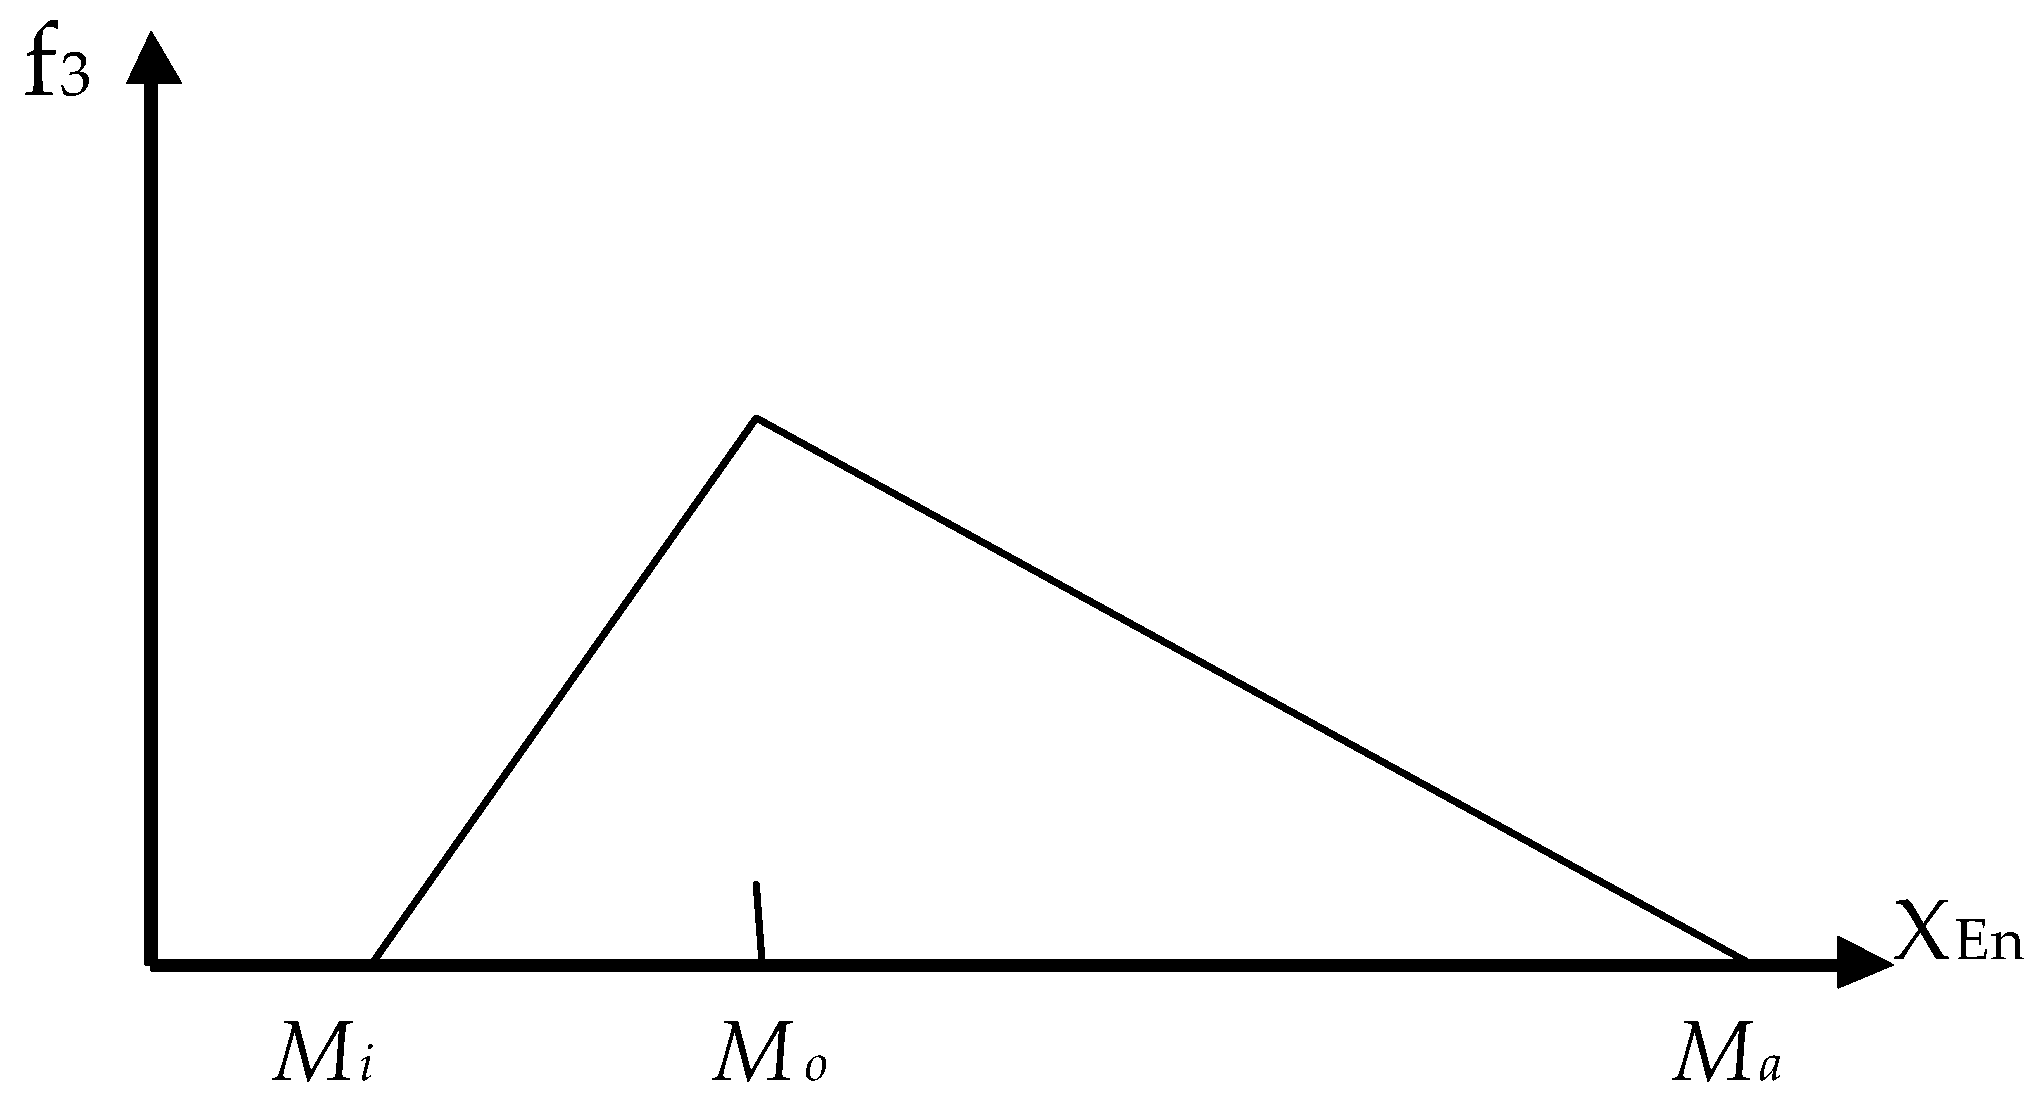
For further discussion, a general TPD is referred, as shown in
Figure 6. According to the principle of probability density function that the total probability value is 1, the probability density function in referring to the triangle distribution
Figure 6 can be derived by Equation (5).
The generic Equation (5) can be applied to describing the probability density functions for the triangle probability distributions as shown in
Figure 3,
Figure 4 and
Figure 5, which describe the distribution or experts’ perception on the sustainability performance score for economic, social and environmental dimensions. The sustainability performance values of
Ec,
S and
En can be calculated by Equation (6).
By further referring to the sustainability index value for a concerned PPP-type project,
IfSV can be rewritten as Equation (7):
The application of the SPbEM model (Equation (7)) will be illustrated through a case study in the next section.
4. Case Study
Researchers have identified many types of PPP-type infrastructure projects, including highways, railways, ports, tunnels, bridges, power plants, hydraulic structures, mass transit, and municipal facilities [
1,
26]. A specific PPP project is selected to demonstrate the applicability of the model SPbEM (in Equation (7)) is an expressway connecting Anxi County to Xiamen City in China’s Fujian Province. The expressway is 6.82 kilometers long with six large tunnels crossing many mountains with the total investment cost of RMB388.5 million (about US$52 million). This project was procured by adopting PPP mechanism with the concession period of ten years. There was an extensive discussions between the two parties on the contract terms and investment distributions between the public sector and private sector. The public sector of the project was the Anxi County Government. The private sponsor was Xiamen Hengxing Industrial Co. Ltd., which paid around 75% of the total project investment. The main contractor was Changsha Central-South Construction Engineering Group Corporation of Nuclear Industry. The project construction commenced in October 2004, finished in December 2009 and would be transferred to Anxi County Government without any charges upon the end of the concession period.
By using the data collection framework in
Table 4, responses were obtained from fifteen professionals who were invited to assess the significance of the TBL indicators in referring to this particular PPP project. The data obtained from the respondents are used to develop the triangular probability distribution for each TBL indicator.
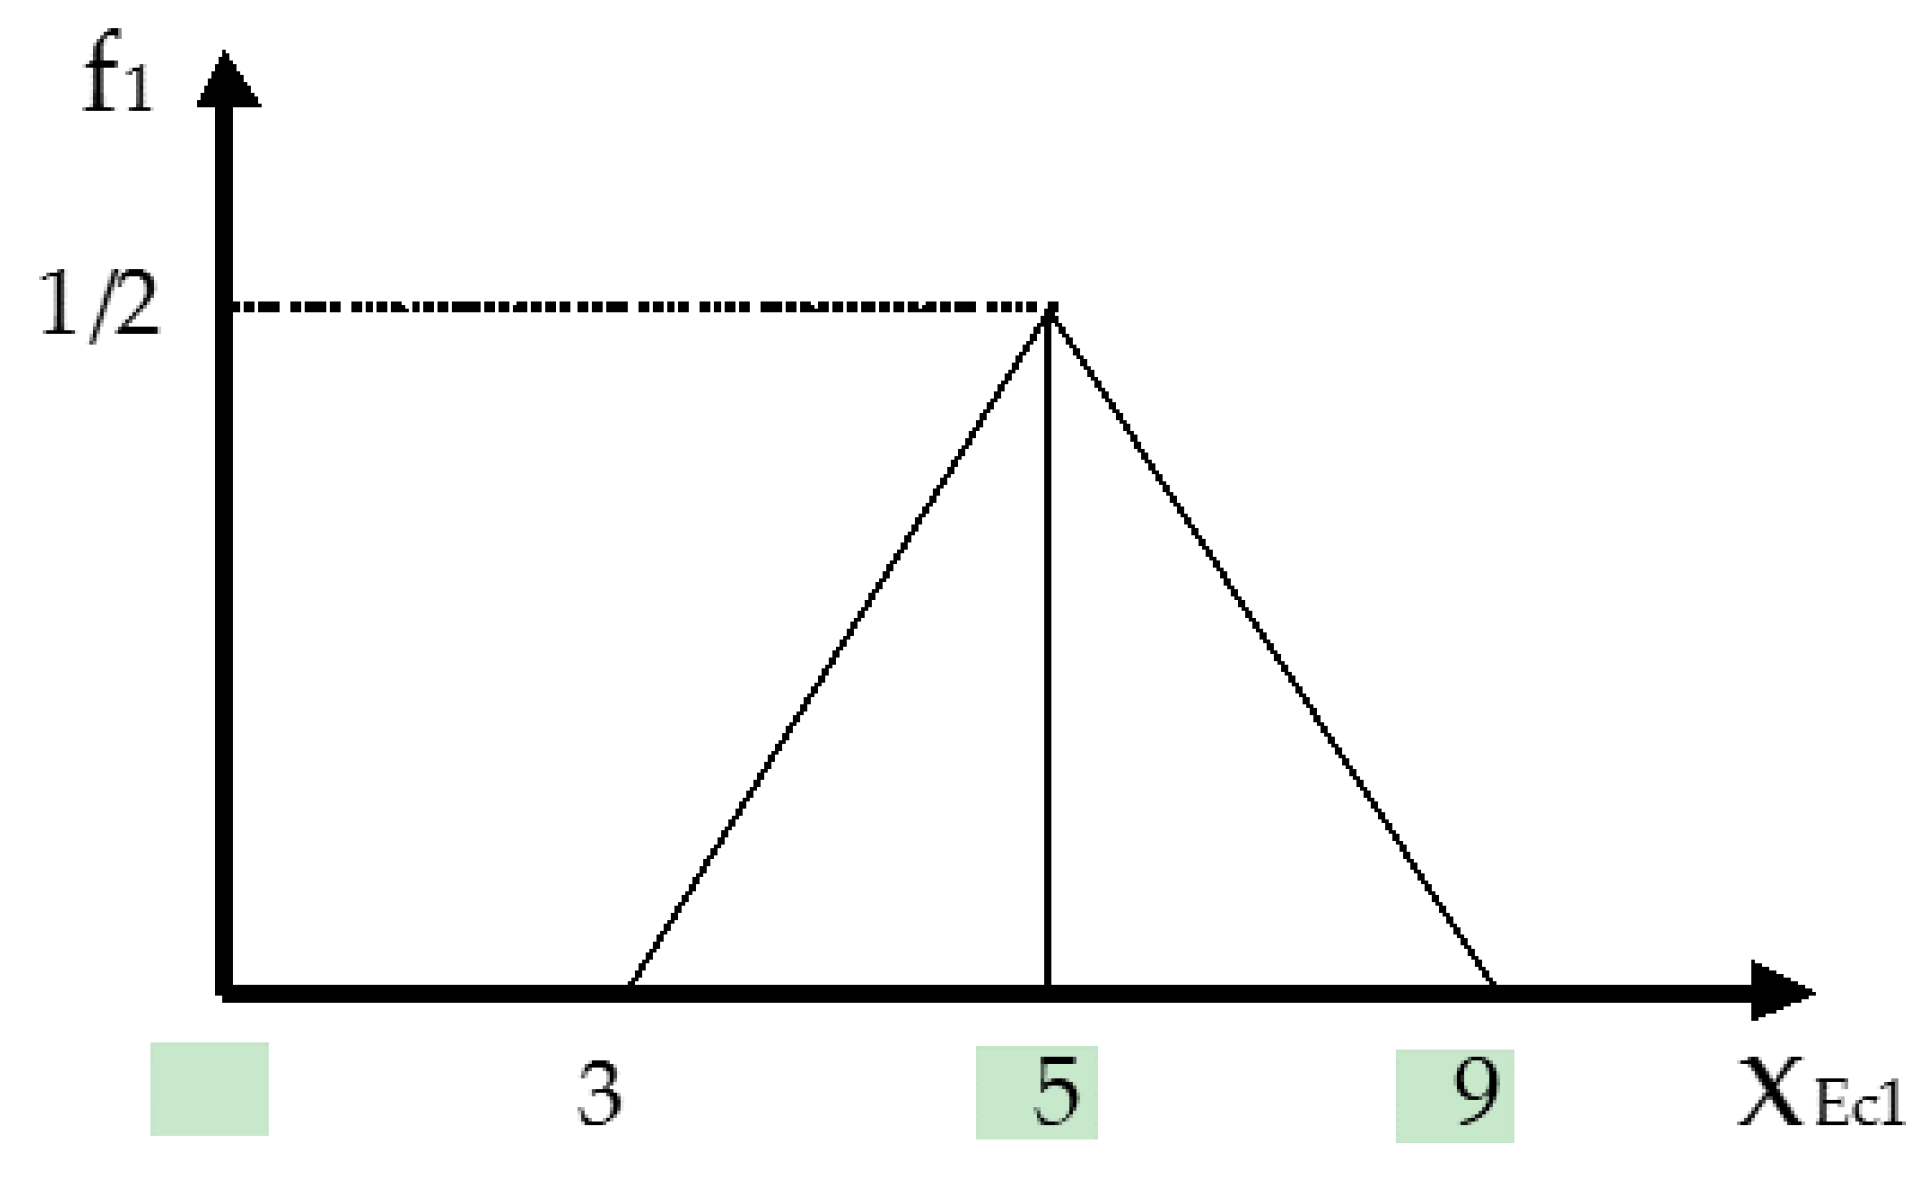
Take the indicator
Ec1 for example, the minimum score is 3 (
Mi = 3), the most likely score is 5 (
Mo = 5), and the maximum score is 9 (
Ma = 9). By applying these values to model (5), the probability density function of
Ec1 can be obtained by Equation (8):
This function can be expressed graphically in
Figure 7.
Thus, the overall performance grade of the indicator
Ec1 can be calculated by using Equation (9):
Similar to the analysis for the indicator E
c1, the functions for all other TBL indicators listed in
Table 4 can be derived, and the performance values of all the indicators are derived and presented in
Table 5.
By using the data in
Table 5, the performance values of the three dimensional parameters in this case study project, namely,
Ec,
S and
En, can be calculated by using Equation (10).
As regards weighting values between the three sustainability dimensions, the project information provided shows that the private investment in the case study project accounts for about 75% of the total project investment, namely,
α = 0.25 and
β = 0.75. According to this, the weighting values for the three dimensional parameters can be established by referring to the assumptions in
Table 2, namely,
By applying the data in Equations (10) and (11) to the Equation (1), the total contribution of TBL indicators to the sustainability performance of the case study project can be calculated as follows:
This value of 6.80 demonstrates a positive project sustainability performance of this project, indicating that the 75% contribution from private sector to this PPP project can provide positive contribution to the project sustainability performance.
5. Findings and Discussions
Results of the case study in the above section demonstrate that the level of sustainability performance for a PPP-type project is affected by the investment distributions between public and private sectors, and this performance can be assessed if the investment distributions are defined. This shows the possibility of achieving an expected level of project sustainability performance (
IfSV) by adjusting investment distributions, denoted by the coefficients
α and
β In other words, sensitivity analysis can be conducted to find out the optimal level of investment distribution between the two sectors in a PPP project towards better level of sustainability. For example, by referring to the case study discussed in the previous section, when the coefficient
α assumes the value 0, 0.25, 0.5, 0.75 and 1 respectively, the sensitivity analysis results on the value of
IfSV for this case study PPP project will be obtained, as shown in
Table 6.
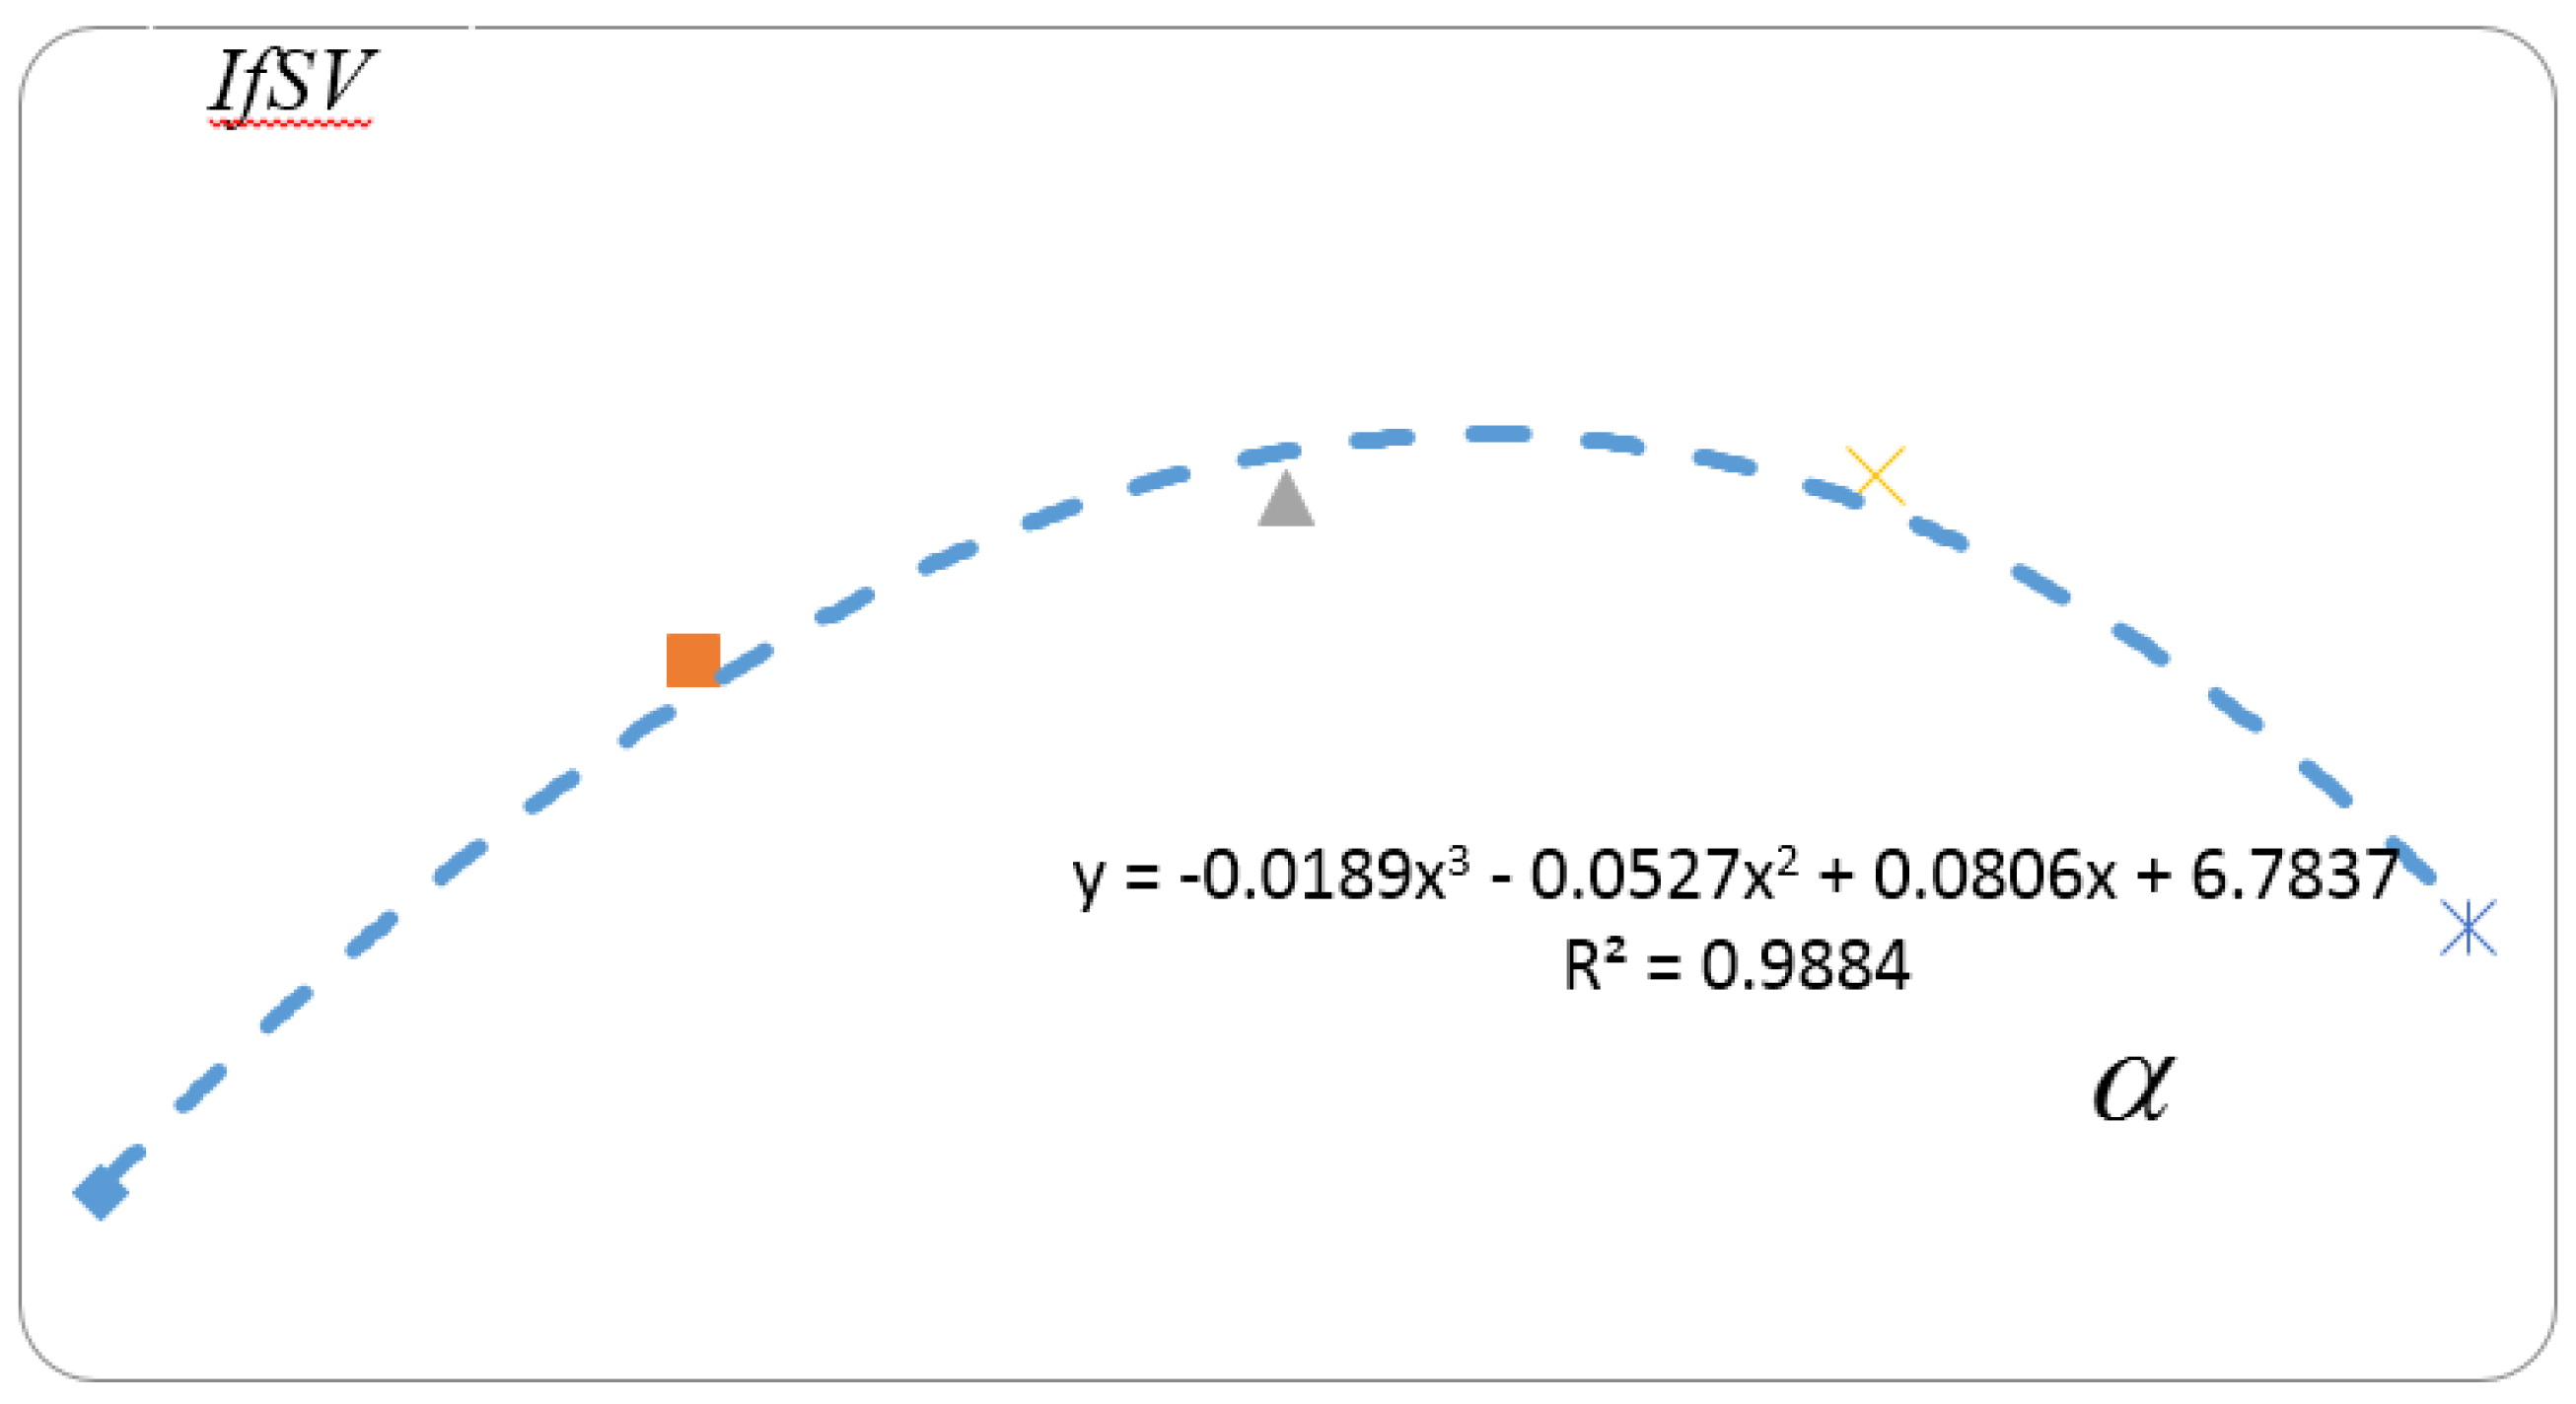
In further analysis, a curve line can be drawn based on the data in
Table 6, as shown in
Figure 8. The curve line indicates the relationship between
IfSV and the coefficient
. The curve shows that an investment wholly contributed either by private or public sector cannot lead to better project sustainability performance. There is a point where the investment distributions between public and private sectors can contribute to the best level of project sustainability performance. In other words, better sustainability performance can be obtained by arranging proper investment distributions between the two sectors in a PPP-type project. In the current practice, the determination of the investment distribution in a PPP-type scheme is a complicated decision process, affected by various factors including economic performance of the given project, private sector’s expected return on project investment, and the concession period [
23,
27]. The application of the proposed model SPbEM to the case study suggests that the effective investment distributions between the public and private sectors should be arranged in the way that public sector contributes around 25% investment (
= 0.25), and private sector shares around 75% investment (
= 0.75). This distribution arrangement can contribute to reasonable level of sustainability performance in implementing this project. Nevertheless, such investment arrangement does not contribute to the best level sustainability, as can be observed in
Figure 8.
The relationship between the investment distributions and project sustainability performance, exampled by the case study in
Figure 8, provides a valuable mechanism for determining investment distributions in a PPP-type project towards better project sustainability performance. Taking the concerned case as an example, the distribution involving about 60% public investment will lead to the best level of project sustainability performance.
6. Conclusions
The performance of PPP-type infrastructure projects should be appraised in line with the sustainable development principles considering the significant impacts of infrastructure projects to economic, social and environment aspects. In other words, the appraisal should consider project performance from the perspective of project sustainability, which is measured by economic, social and environmental indicators. The key in implementing a PPP-type project is the investment distribution between public and private sectors. This study showed that there is a major impact of the investment distribution on the project sustainability performance, and this impact can be assessed. A sustainability performance-based evaluation model (SPbEM) is therefore developed to facilitate this impact assessment. The model developed in this study can present the relationship between the investment distribution and the project sustainability performance, from which an optimal level of investment distribution between two PPP sectors can be identified for contributing best level of project sustainability. In addition, this has been demonstrated effectively from the case study in this paper.
The findings from this study not only promotes the application of PPP approach in the area of infrastructure development, but also provide an effective method for supporting decision making on the choice for a proper alpha (α), namely, a proper level of investment distribution between public and private sectors. The value α can be determined when a certain level of project sustainability performance is defined. The understanding on this mechanism can help public and private sectors find a better contractual arrangement to work towards better sustainability performance during the process of implementing PPP-type projects.
By seeking for collaboration with governmental and industry sectors, it is planned for future study in this research team to utilize the developed model SPbEM for different types of prospective infrastructure projects based on IfSV values.


