
Planning Support Systems (PSS)-Based Spatial Plan Alternatives and Environmental Assessment


Abstract
:1. Introduction
2. Research Method and Rationale
2.1. Method
2.2. Conceptual Scope: What if?
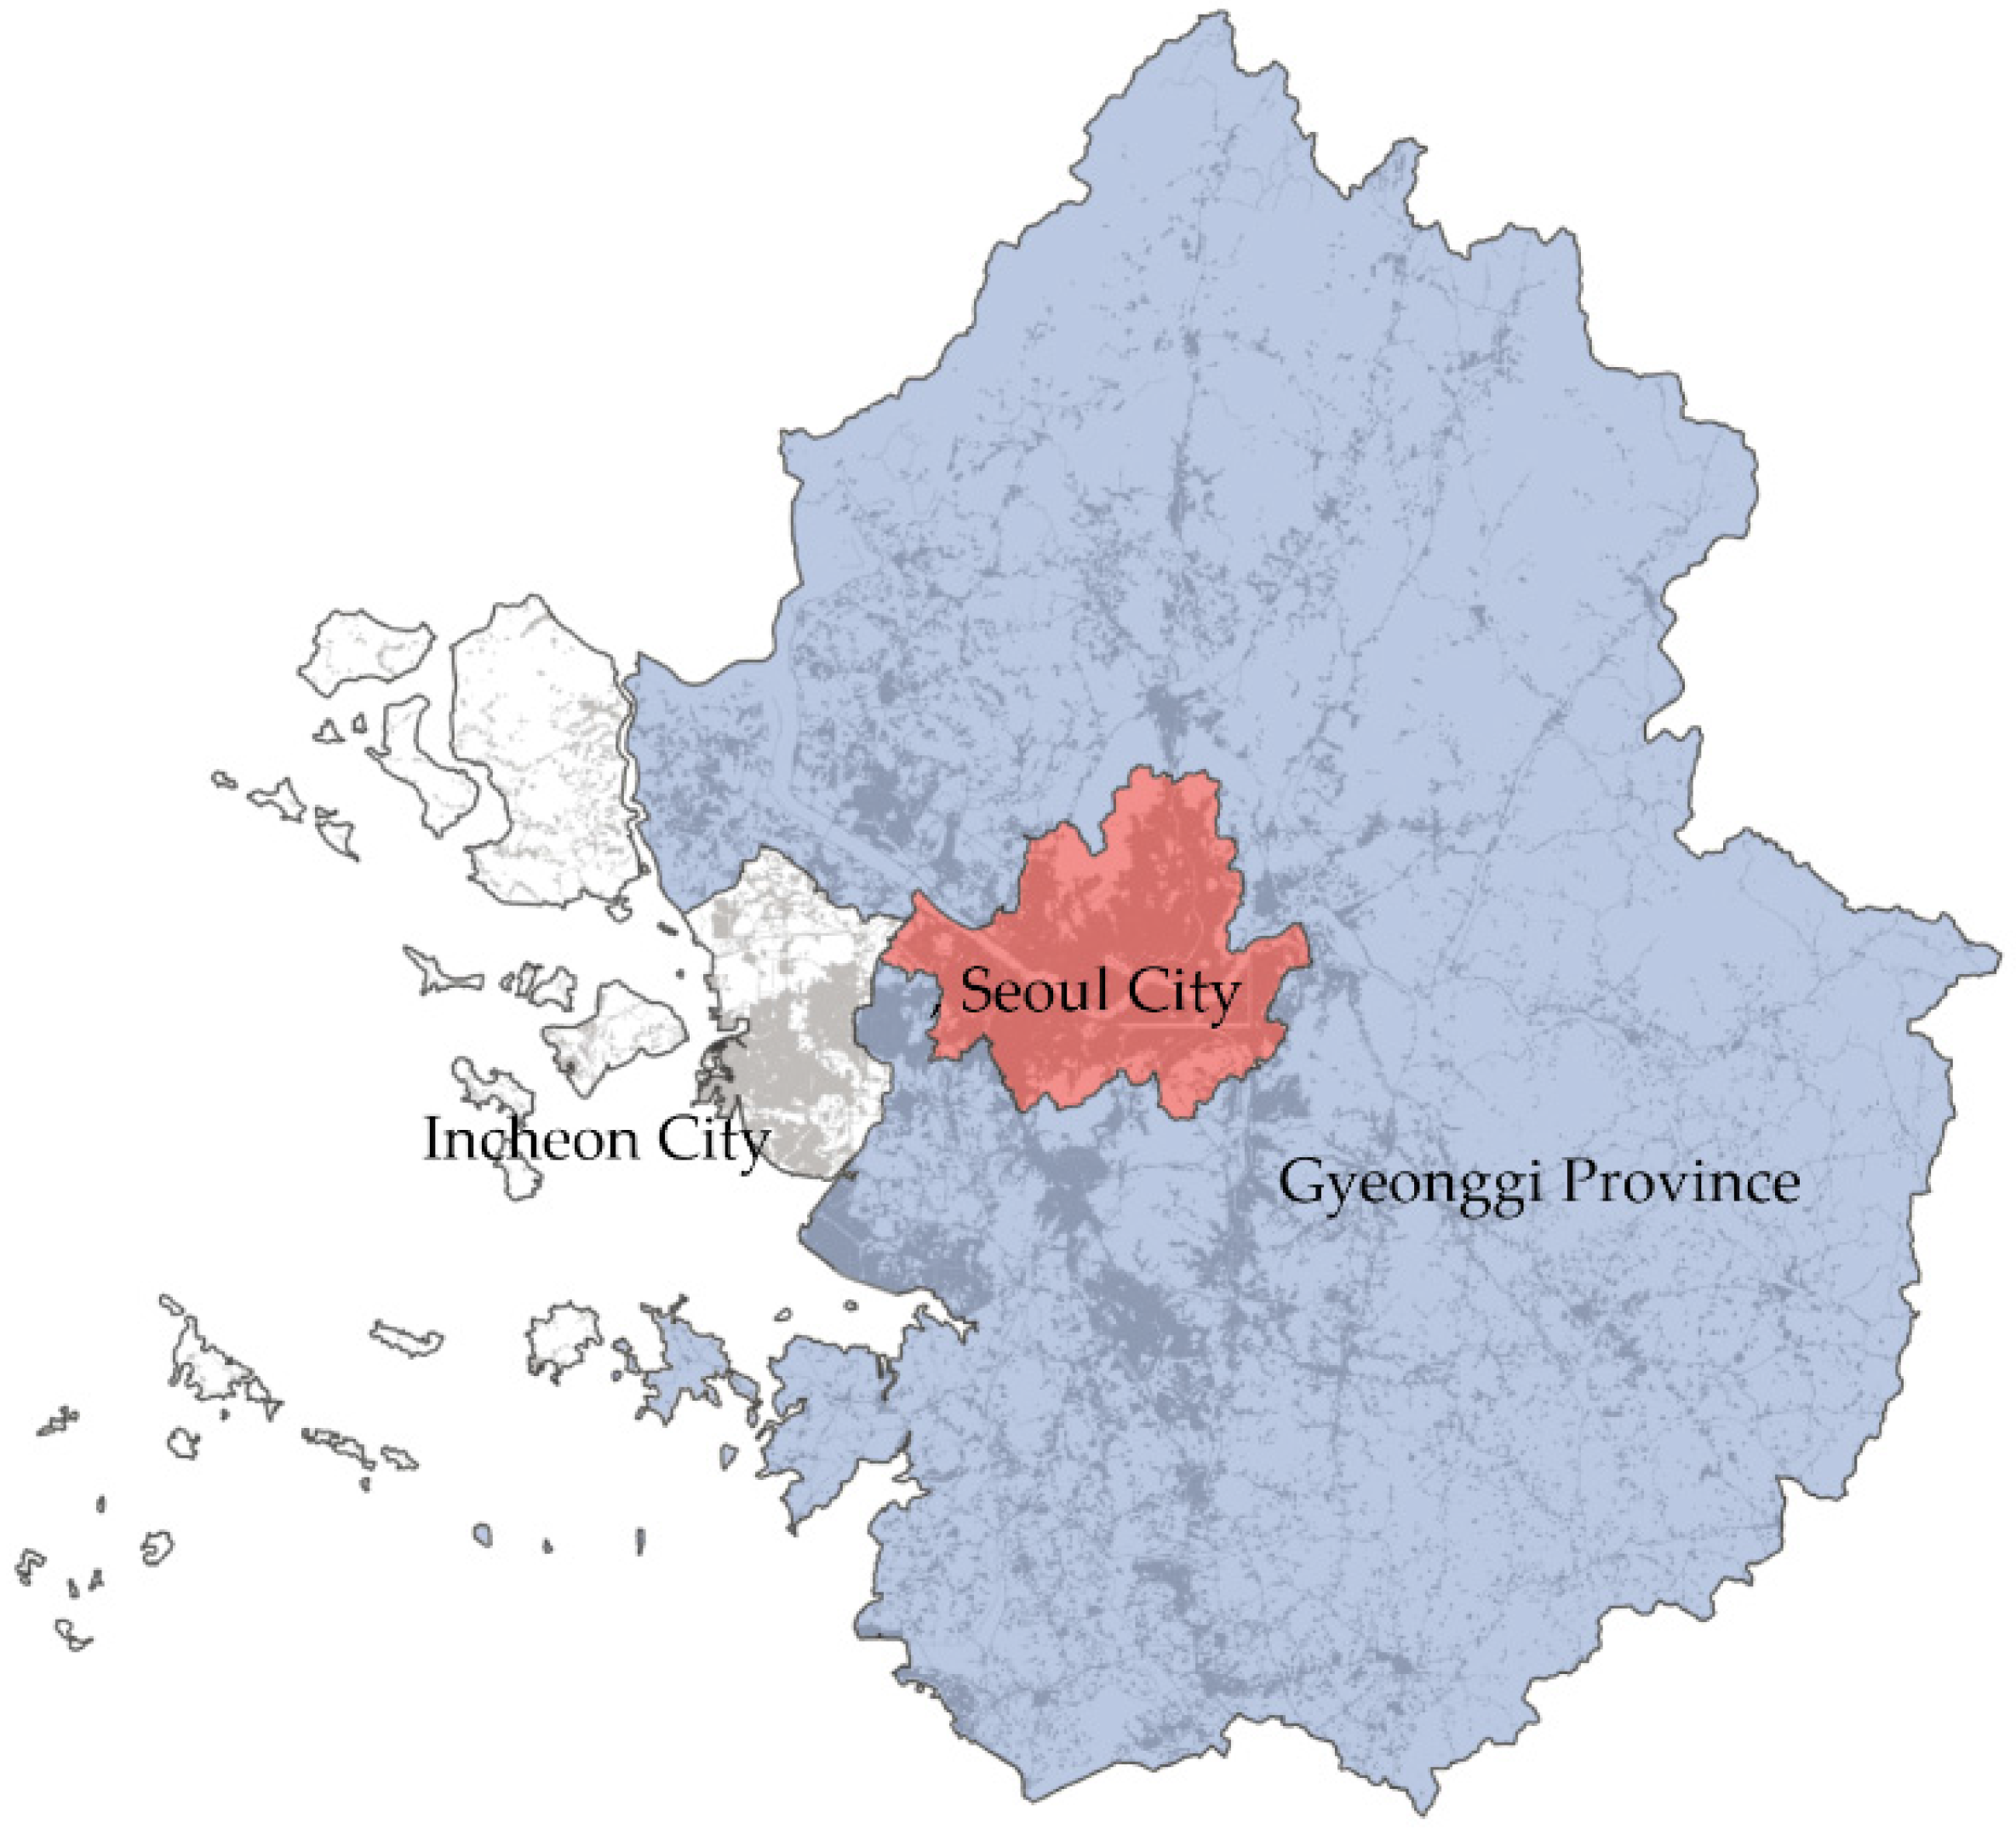
2.3. Spatial-Temporal Scope
3. Framework for Applying PSS
3.1. Determining the Environmental Indicators
3.2. Defining the Driving Force
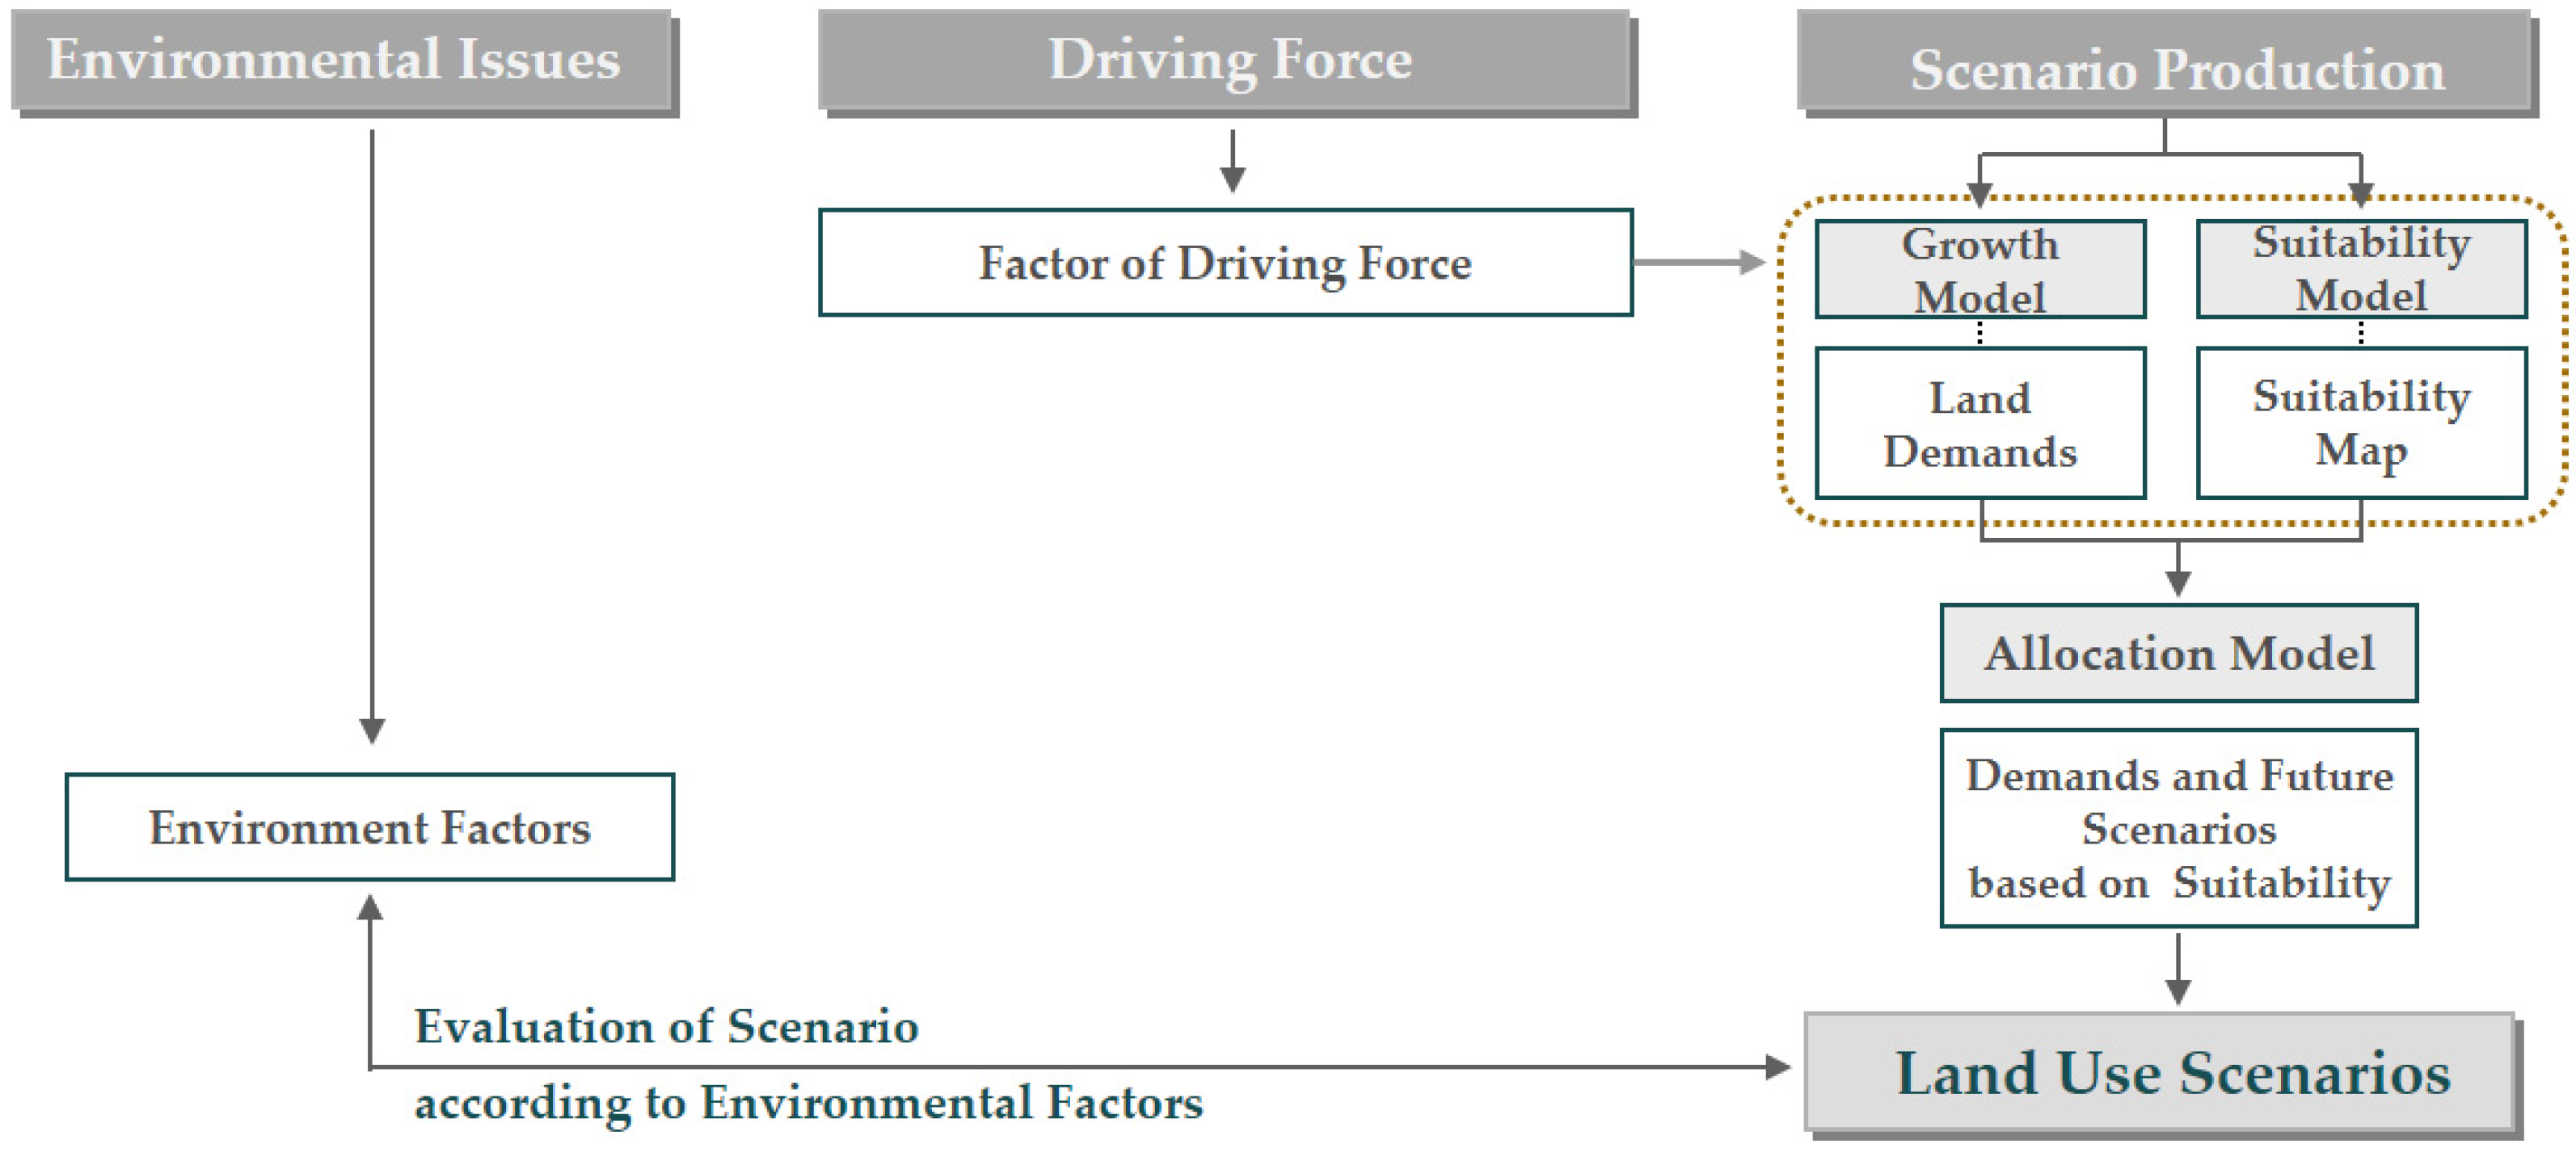
3.3. Developing Spatial Plan Alternatives Using “What If?”
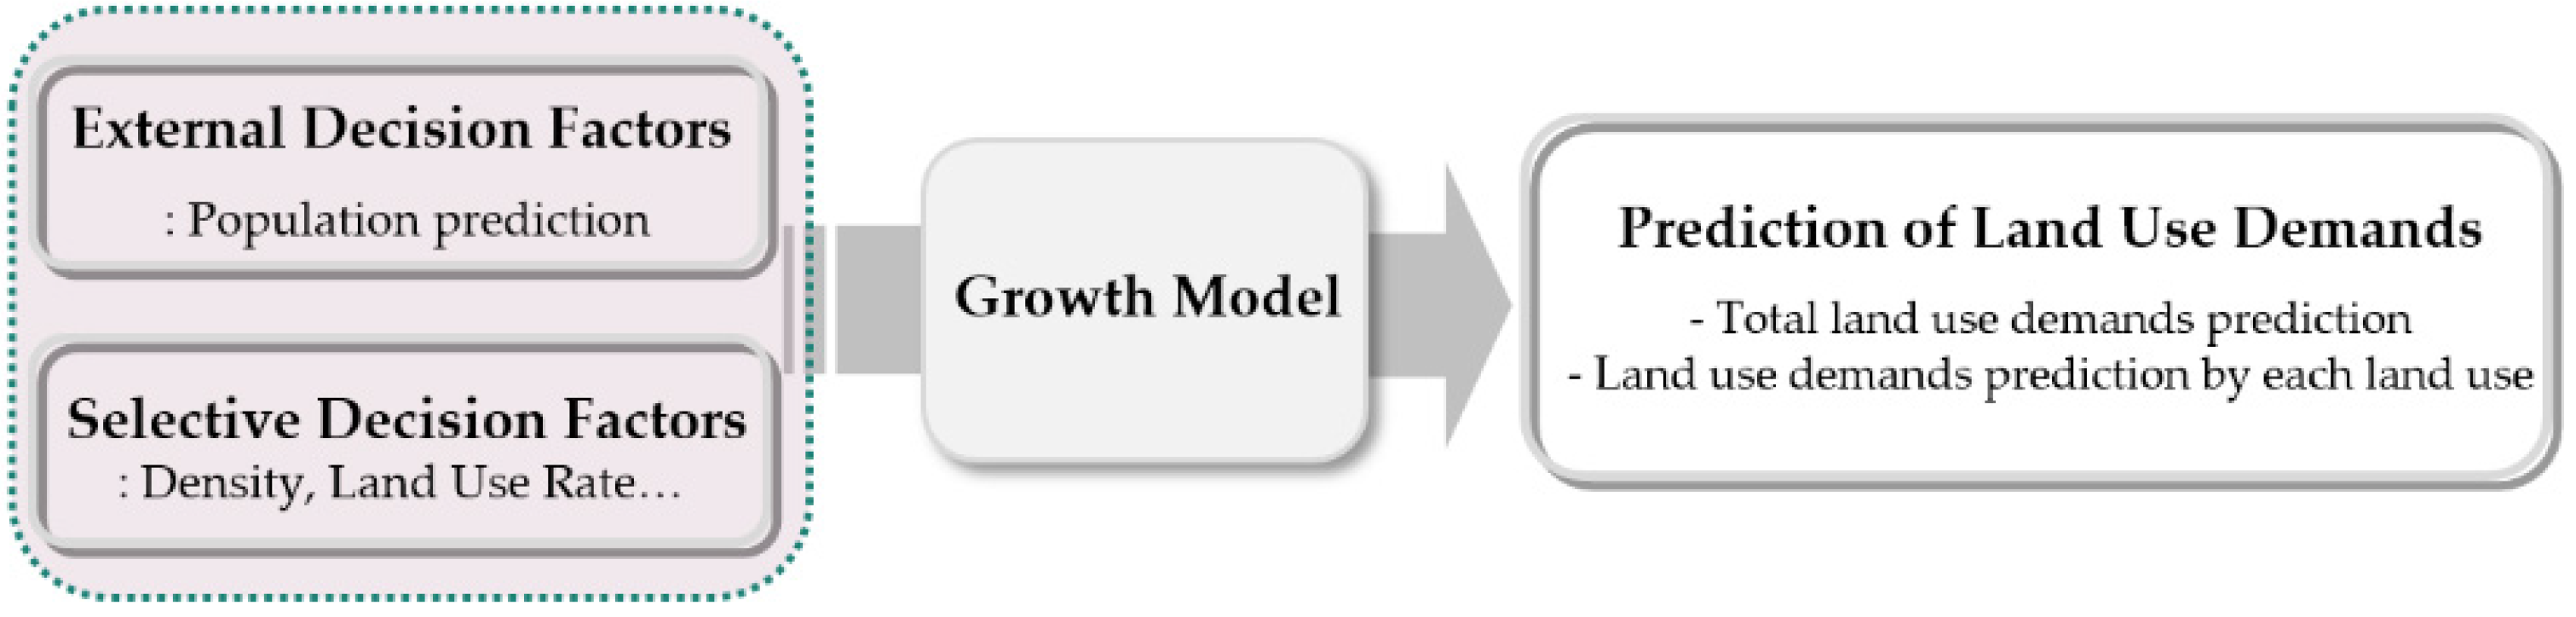
3.3.1. Land Use Demand Model (Growth Model)
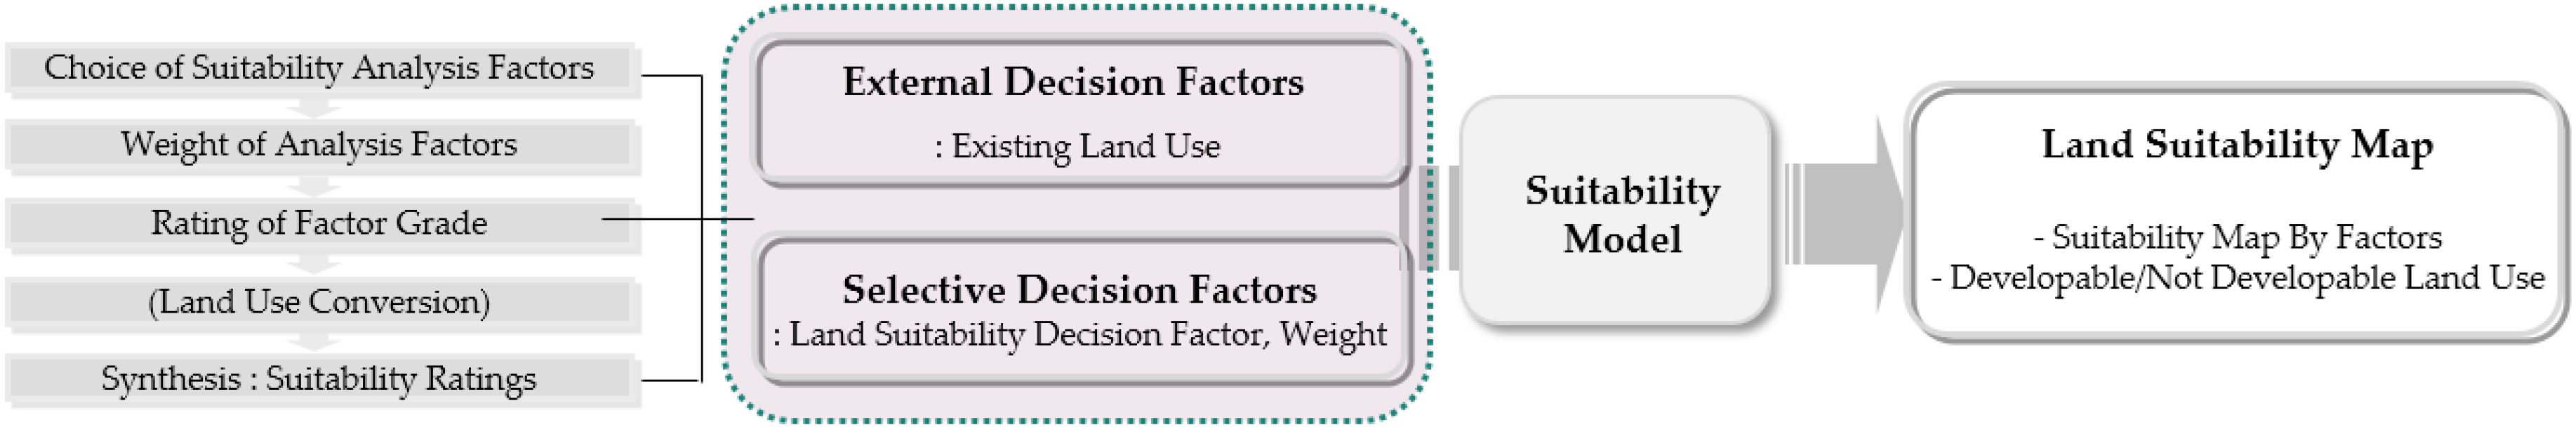
3.3.2. Land Supply Model (Suitability Model)
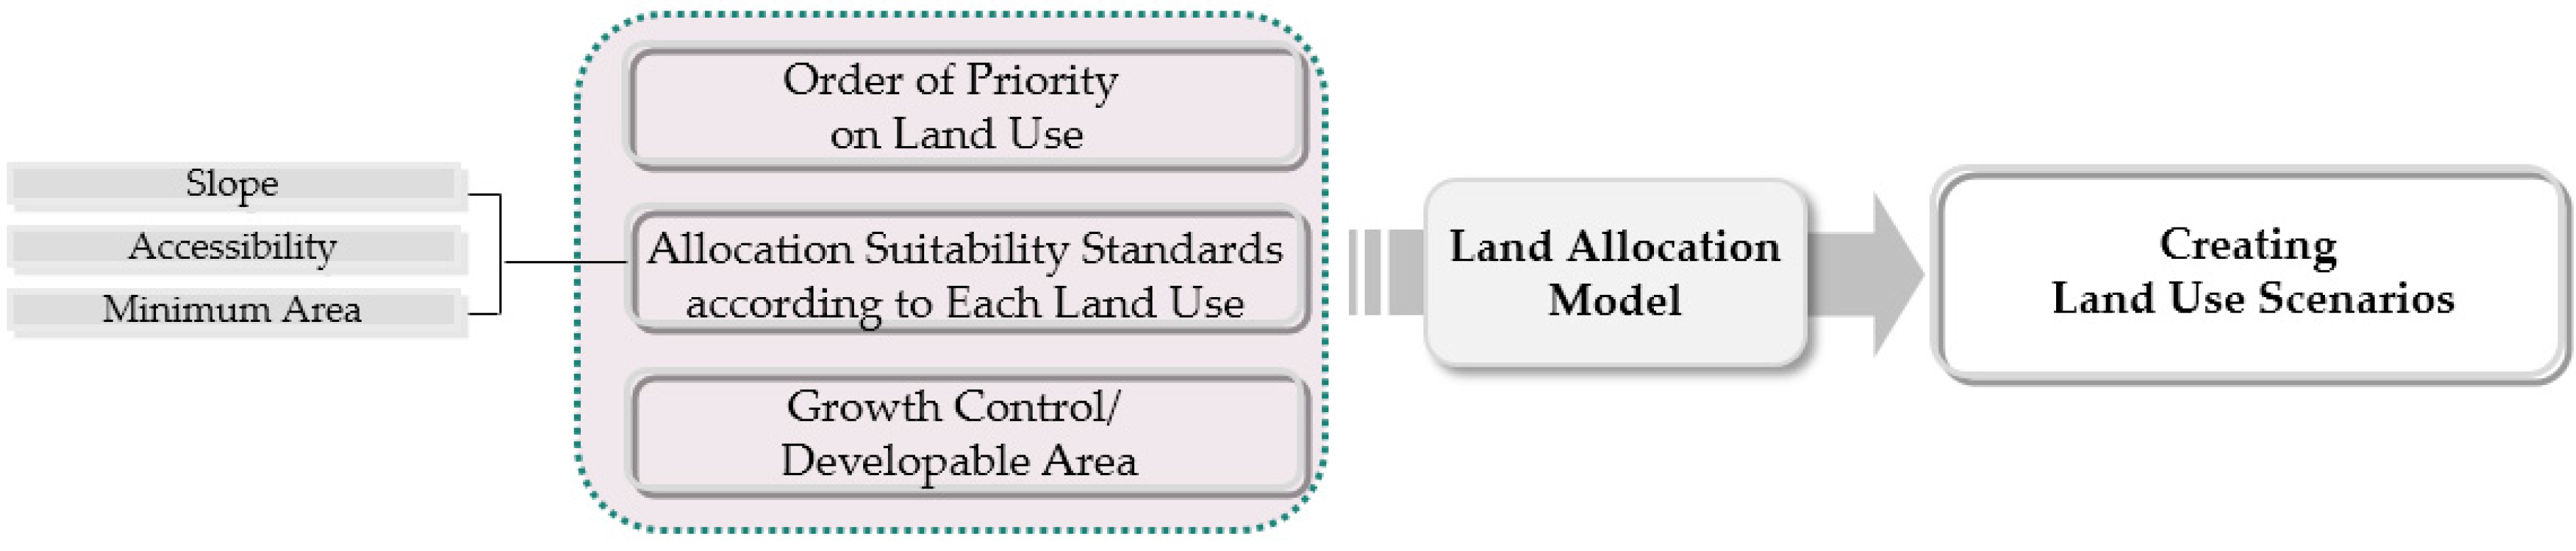
3.3.3. Land Allocation Model (Allocation Model)
3.4. Environmental Assessment of Spatial Plan Alternatives
4. Applying the PSS to a Case Study
4.1. Establishing the Environmental Indicators
4.2. Defining the Driving Force
4.3. Developing Alternative Land Use Scenarios Using “What If?”
4.3.1. Land Use Demand Model (Growth Model)
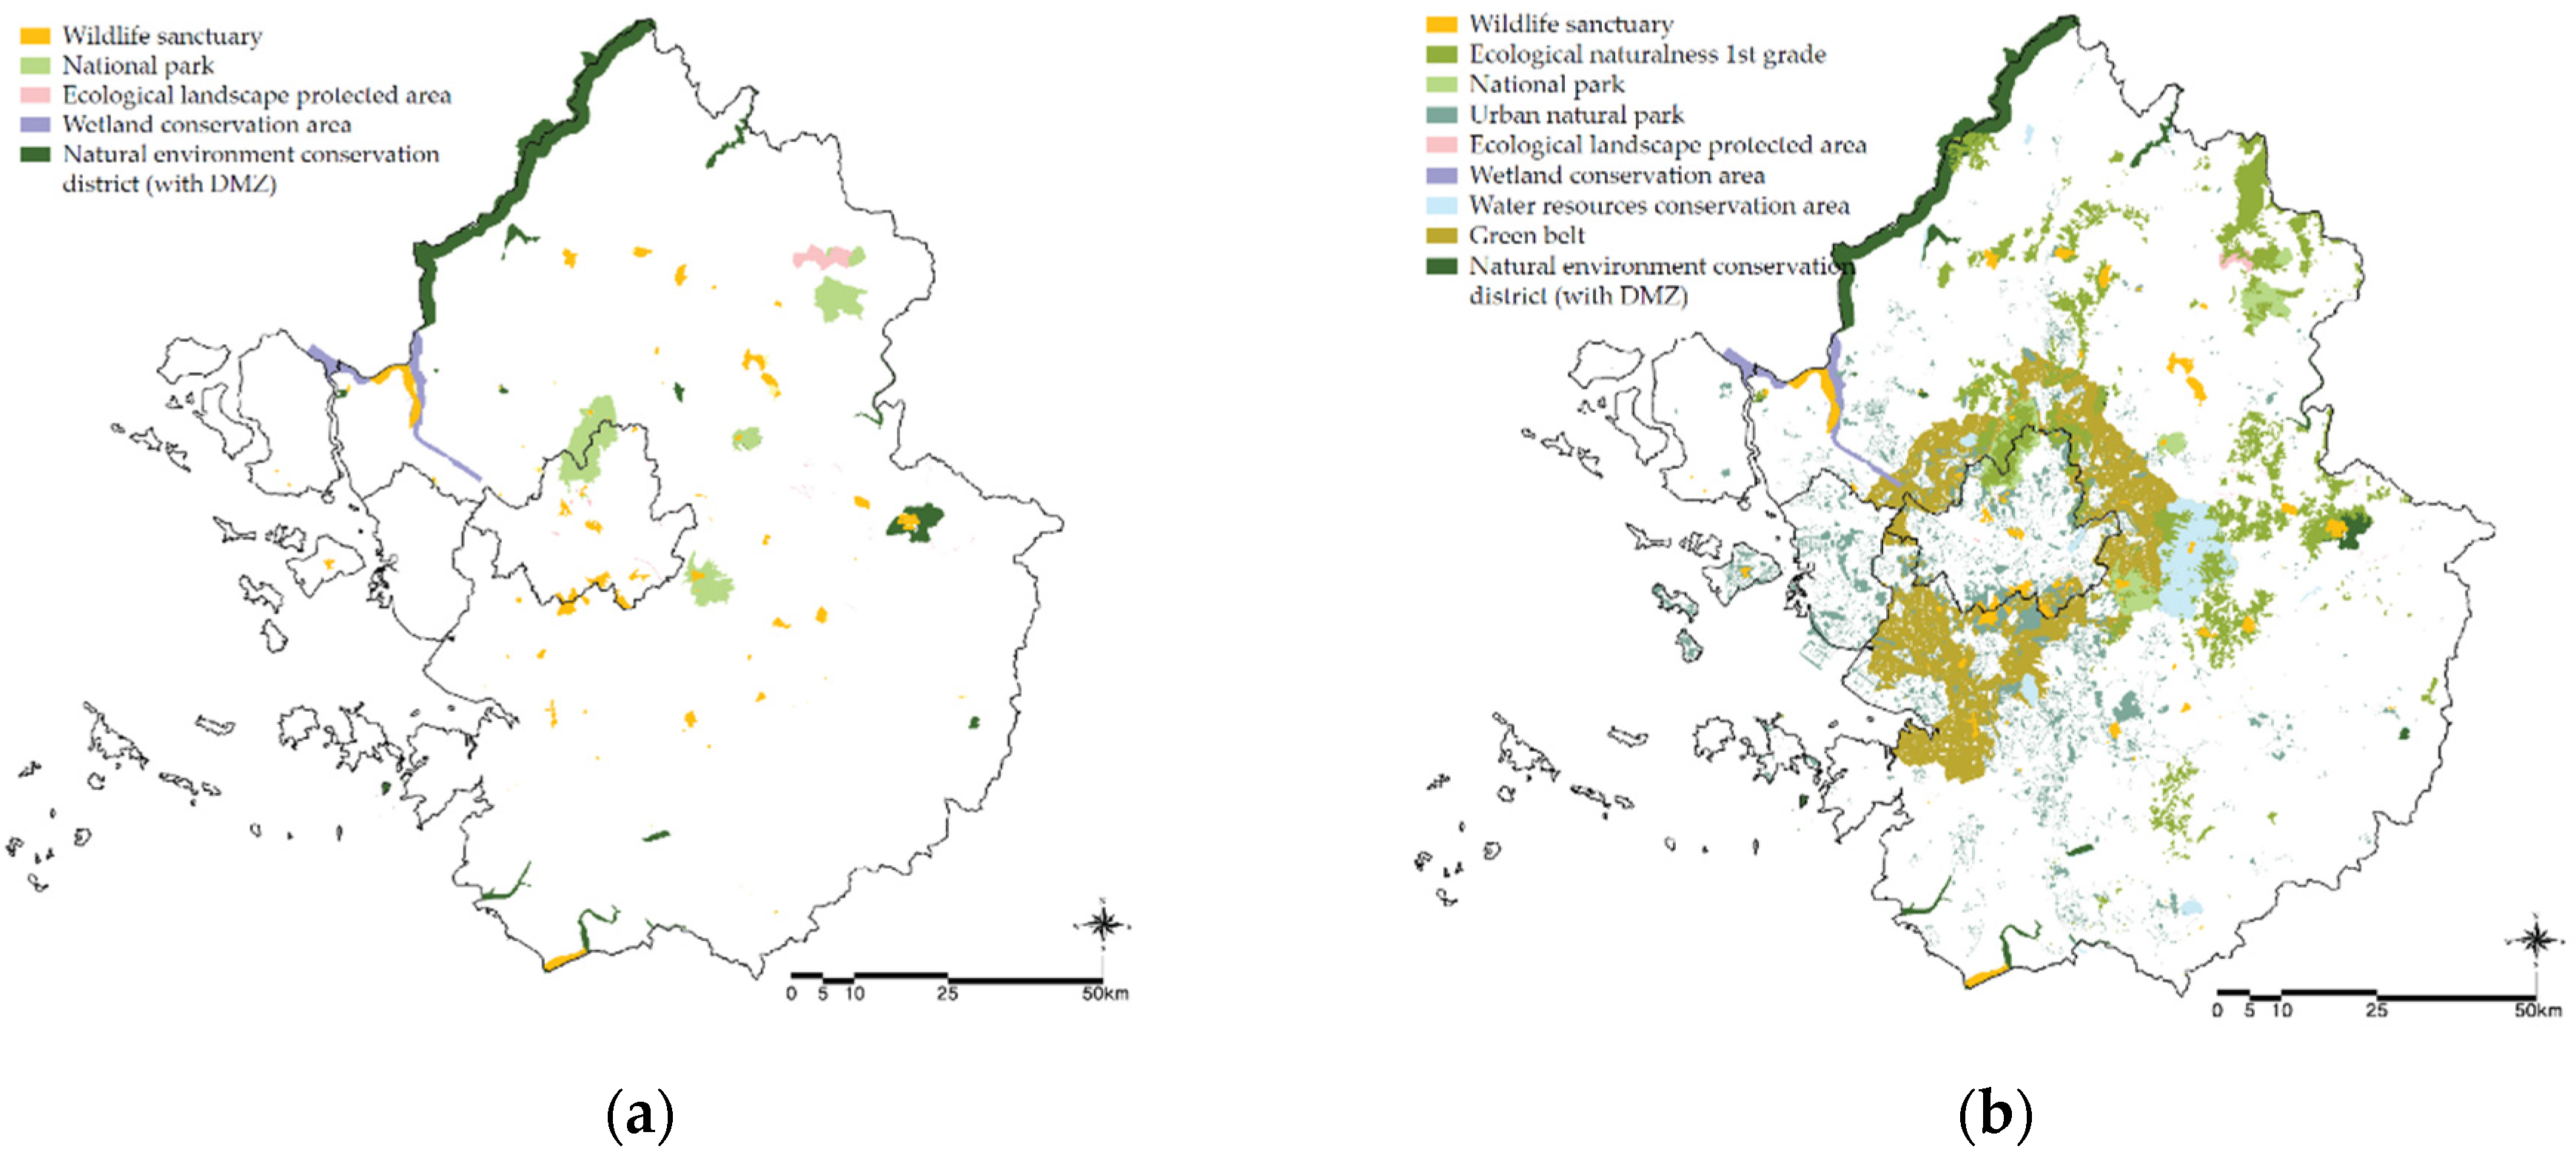
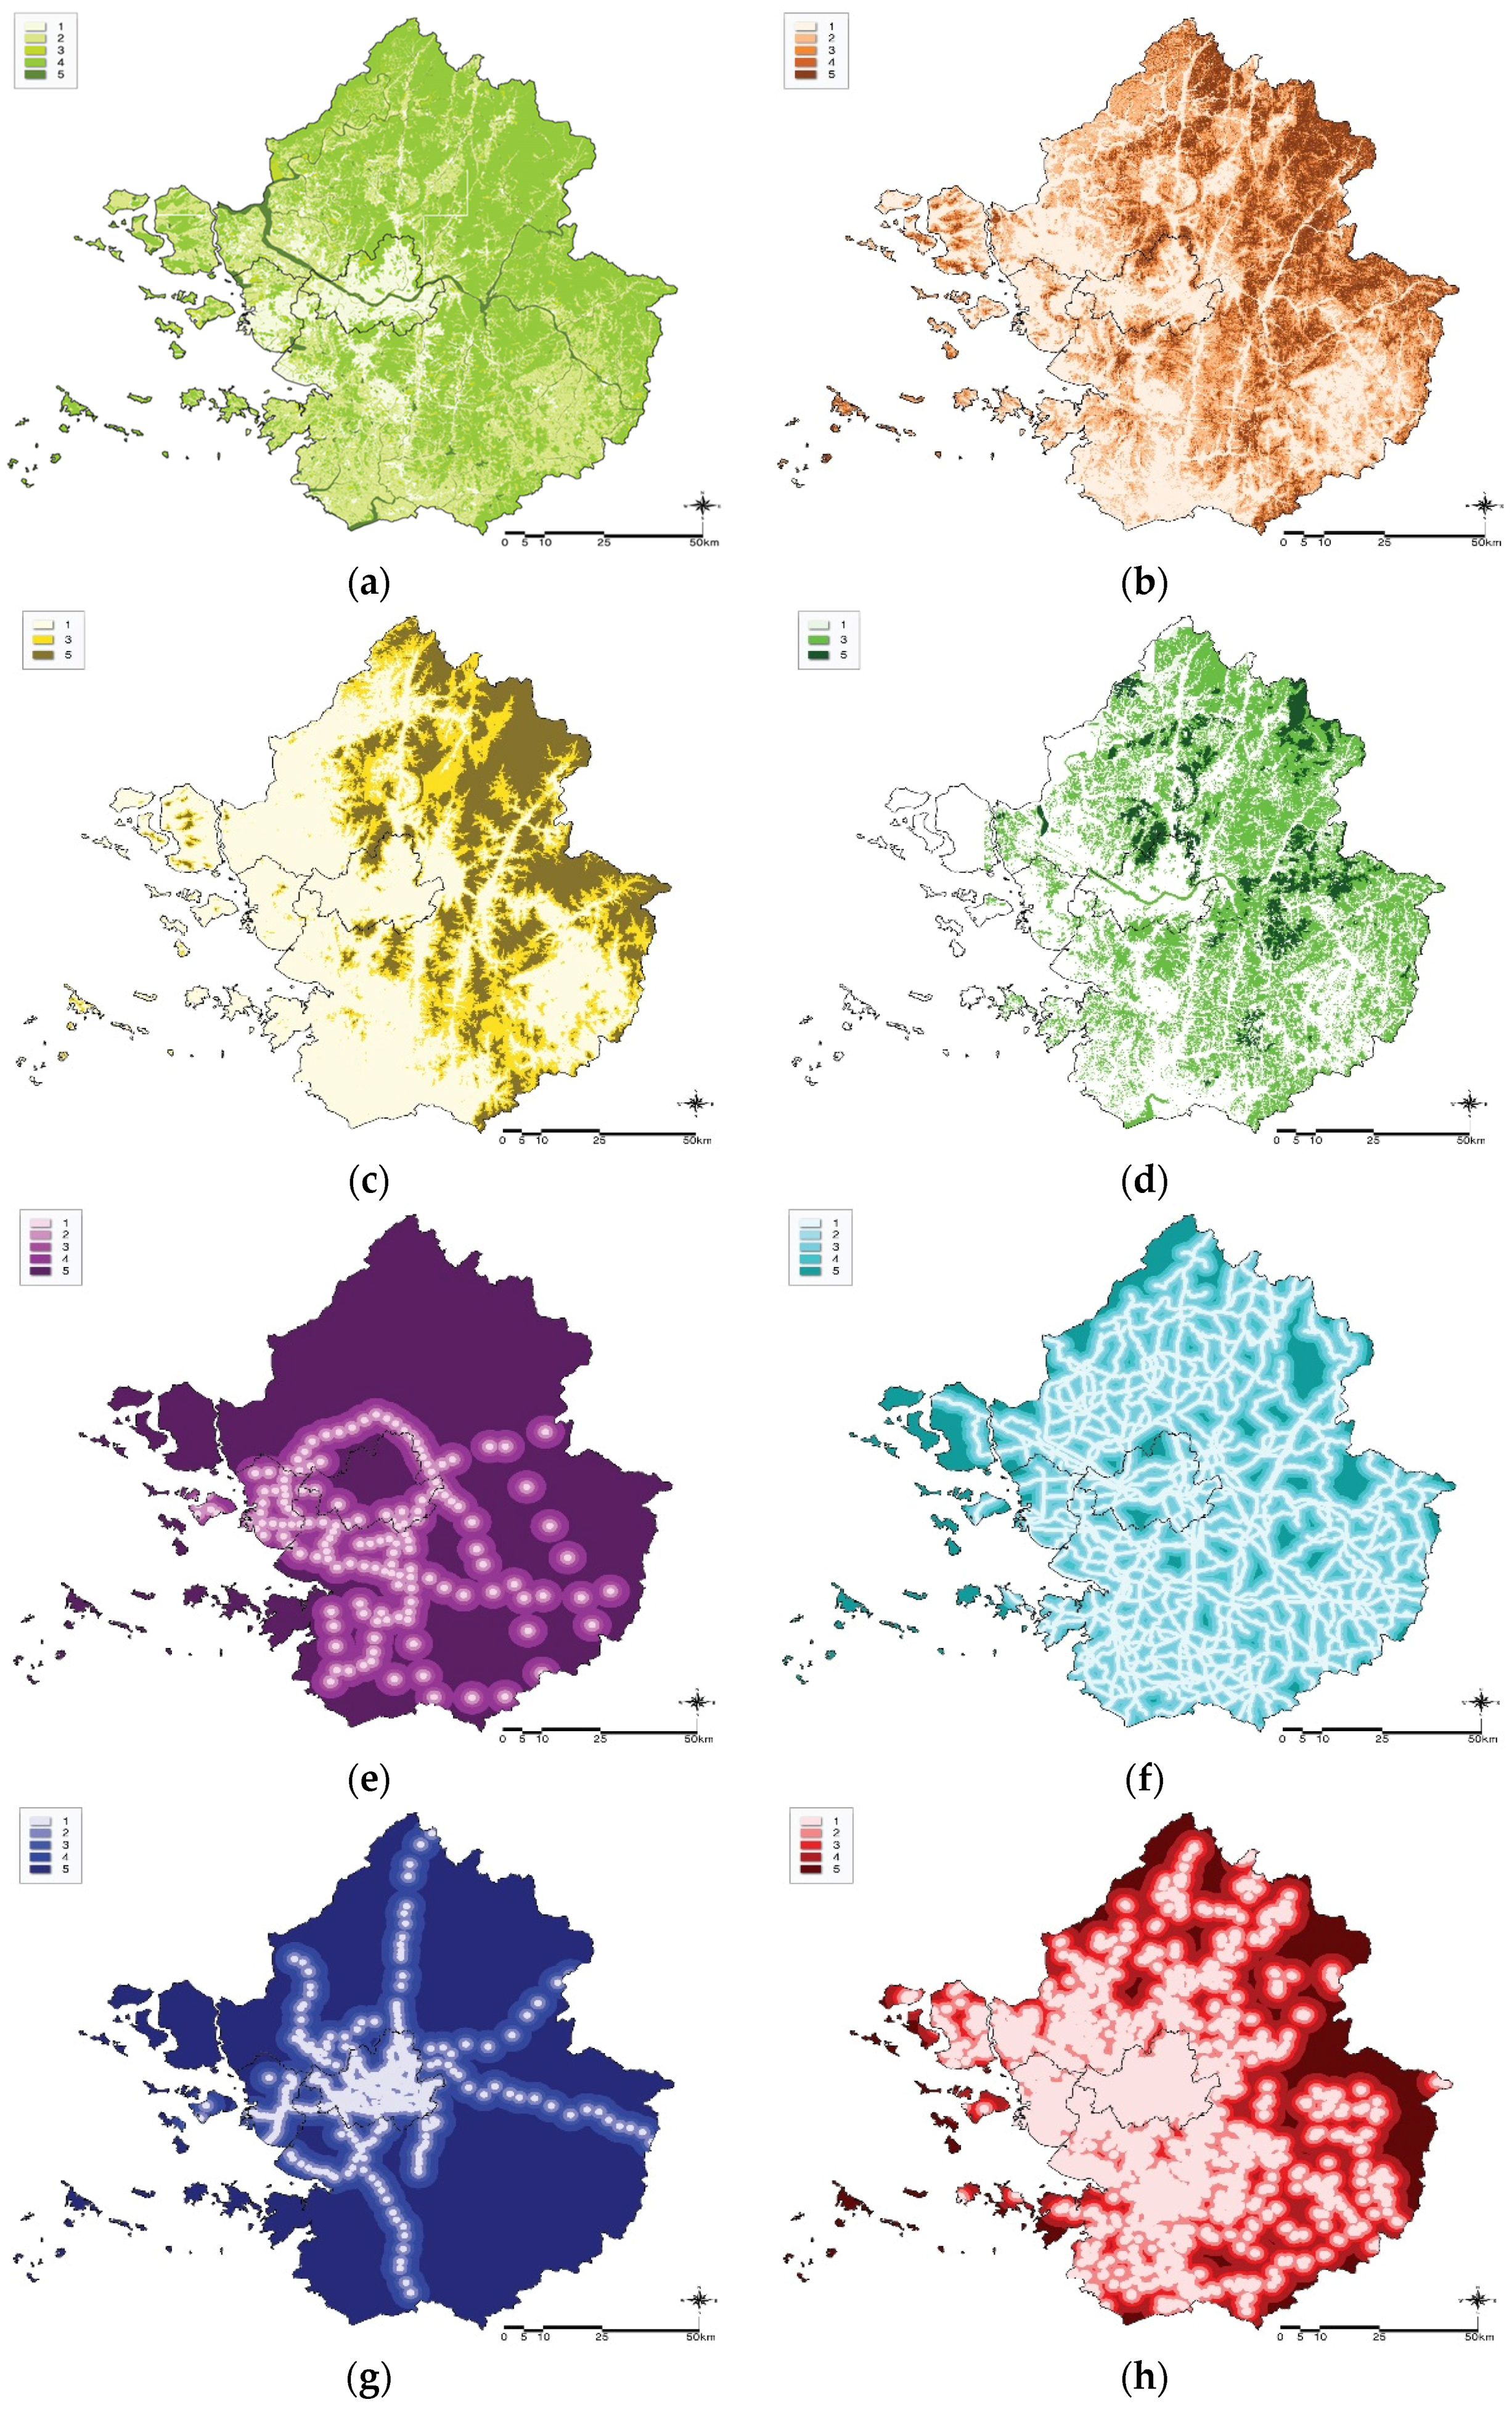
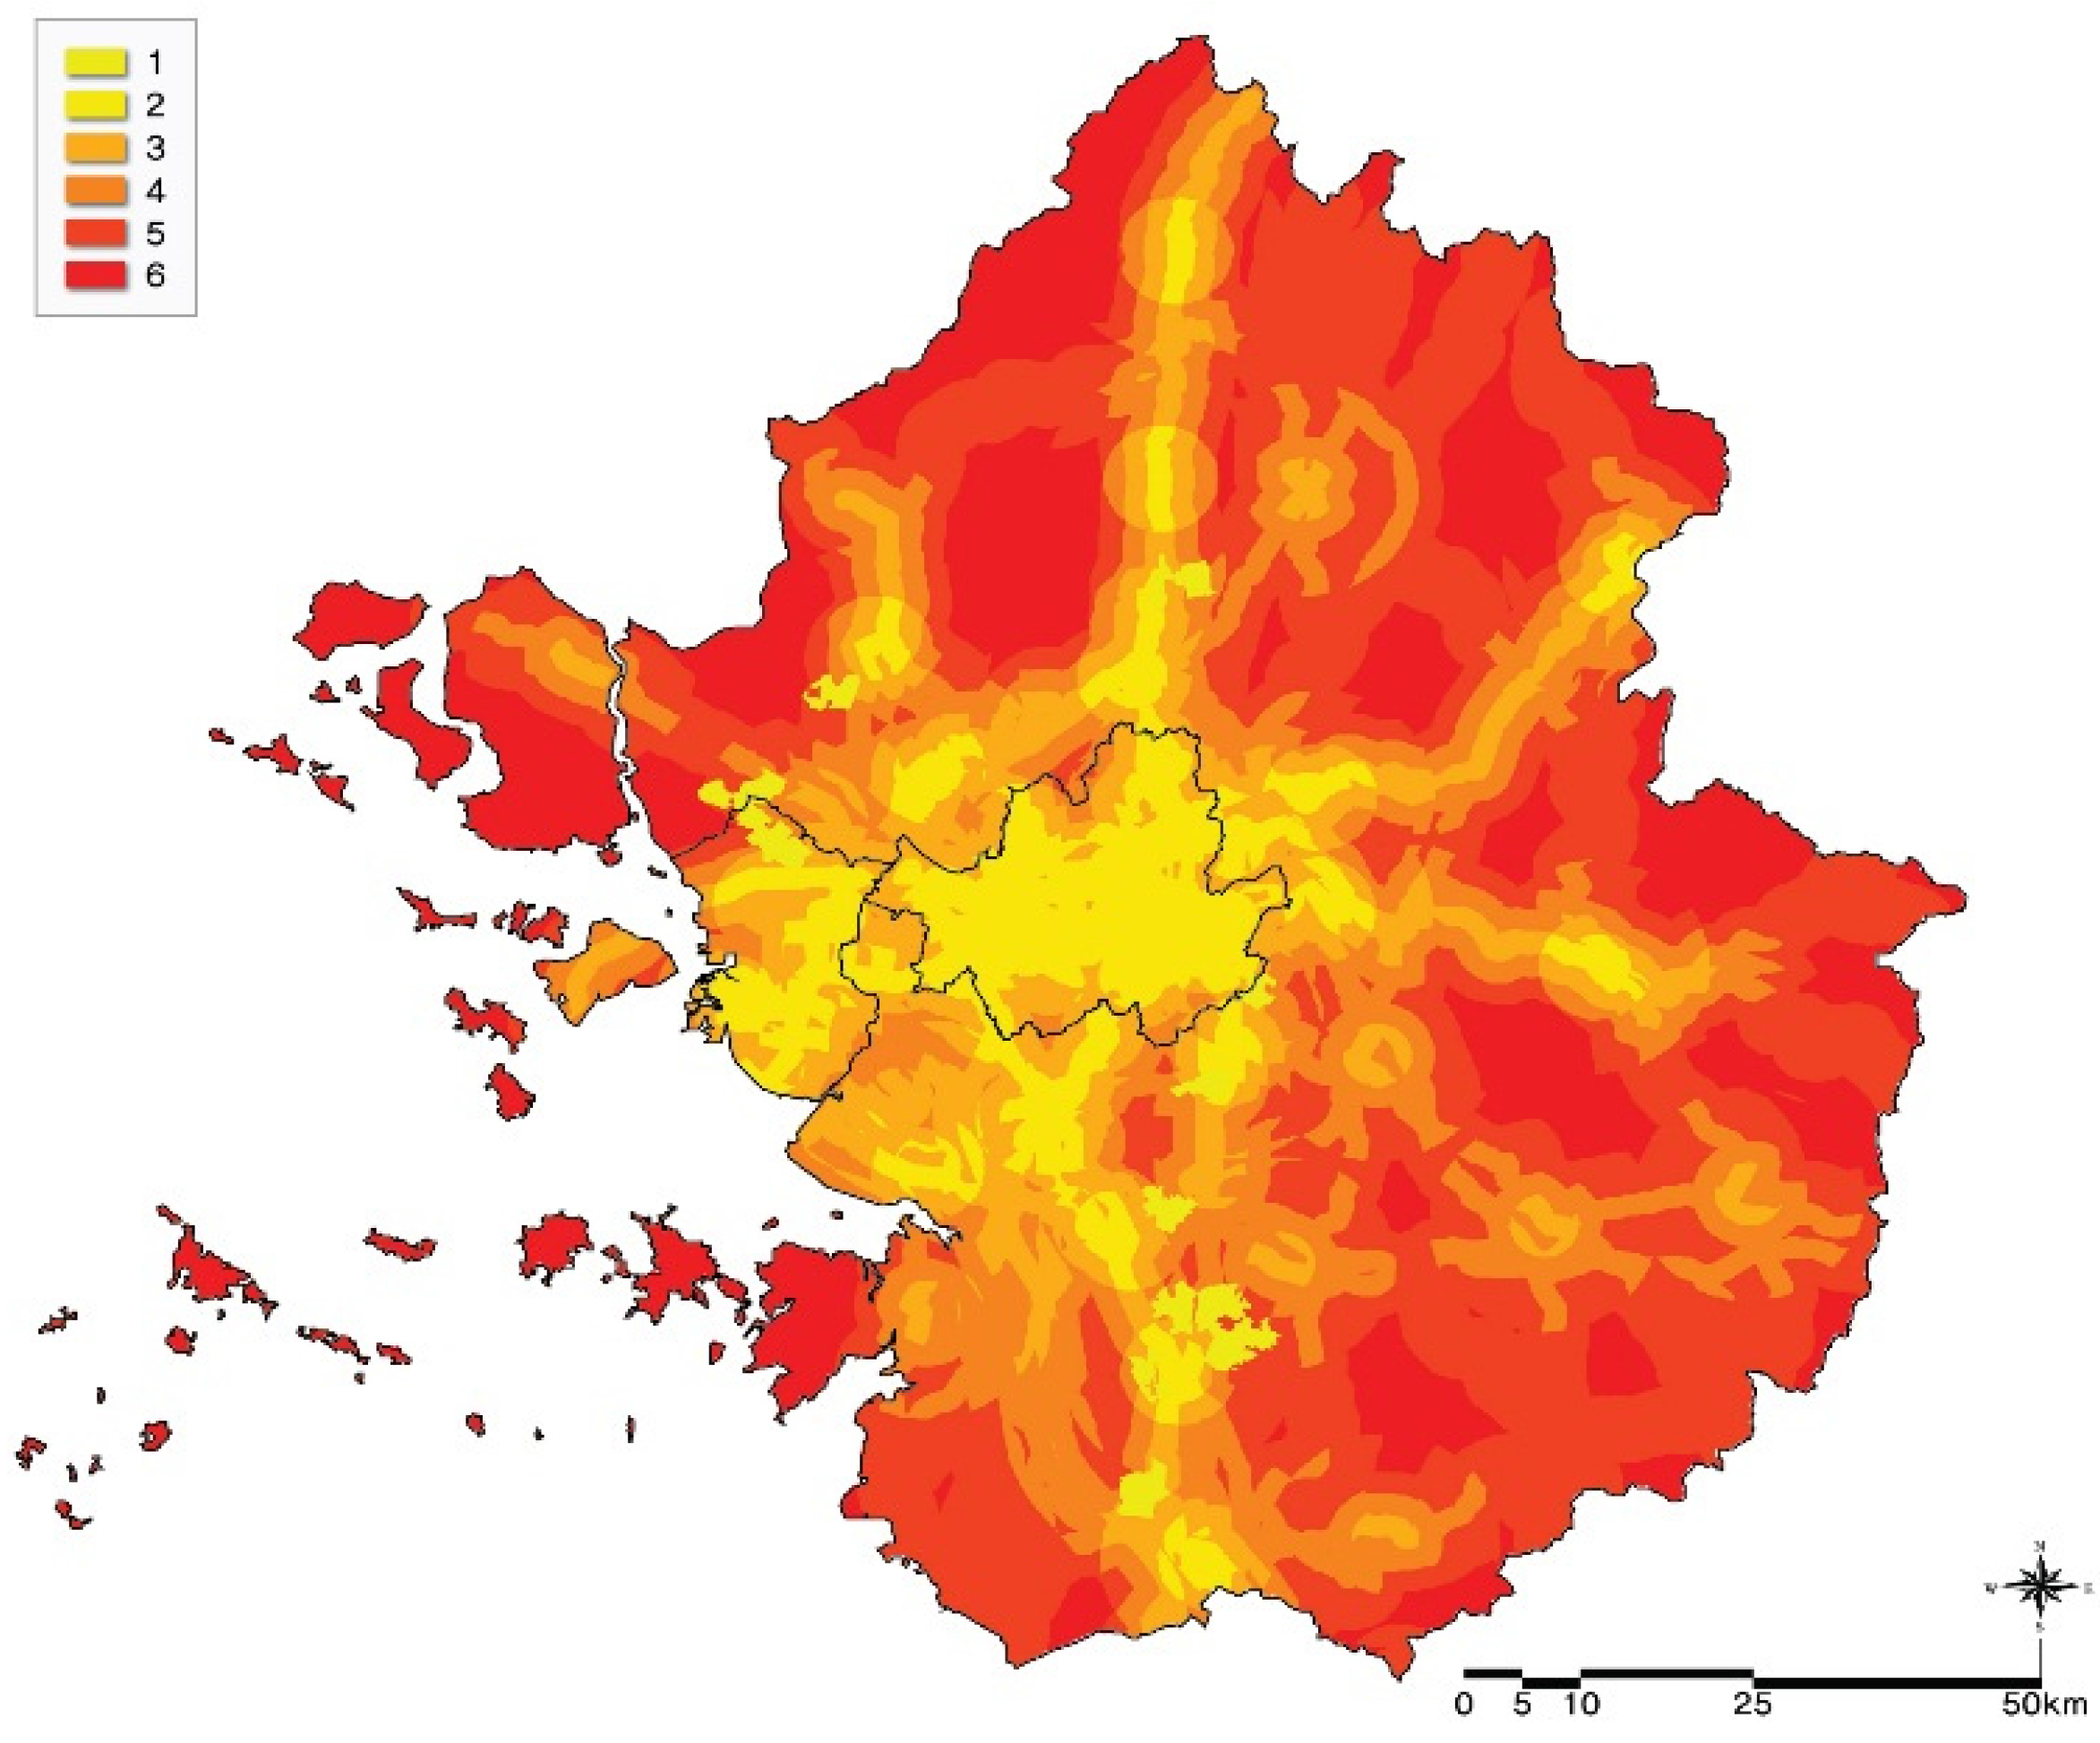
4.3.2. Land Supply Model (Suitability Model)
4.3.3. Land Allocation Model
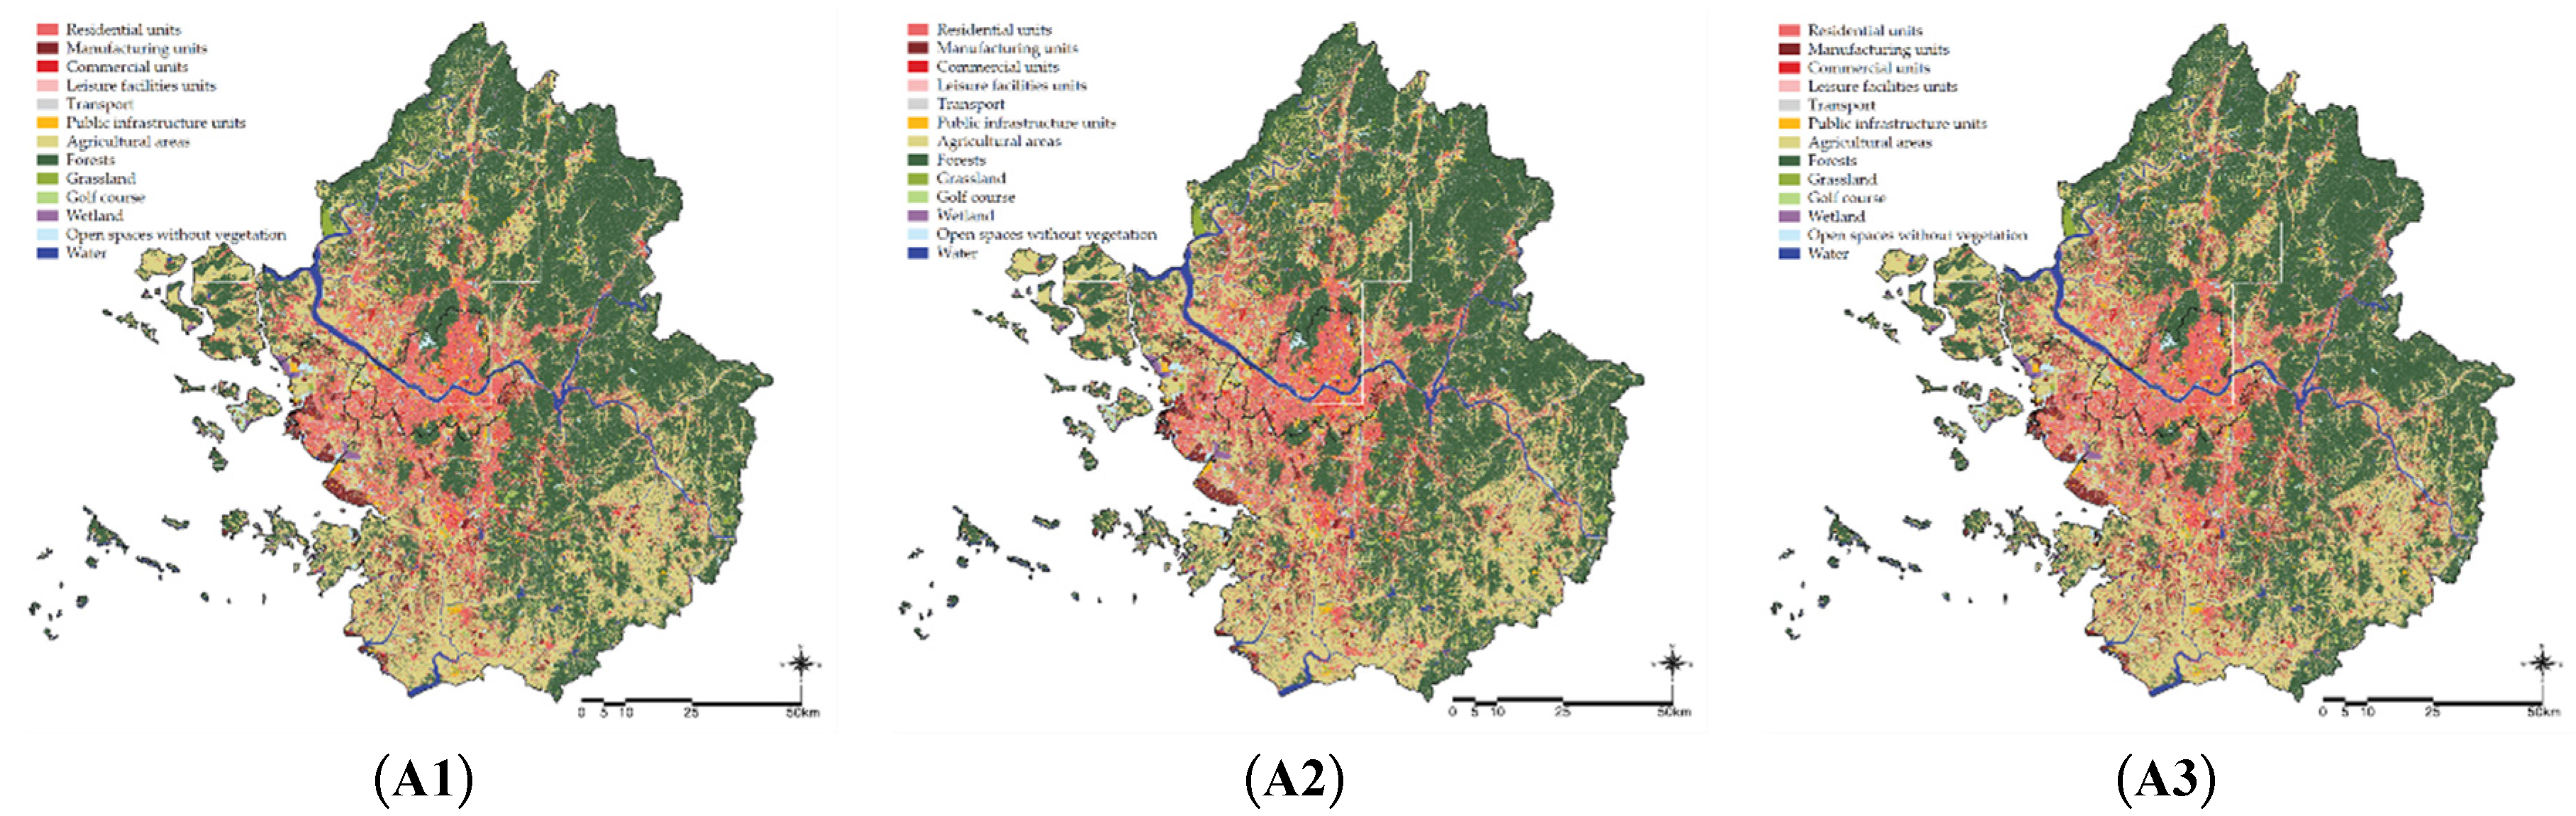
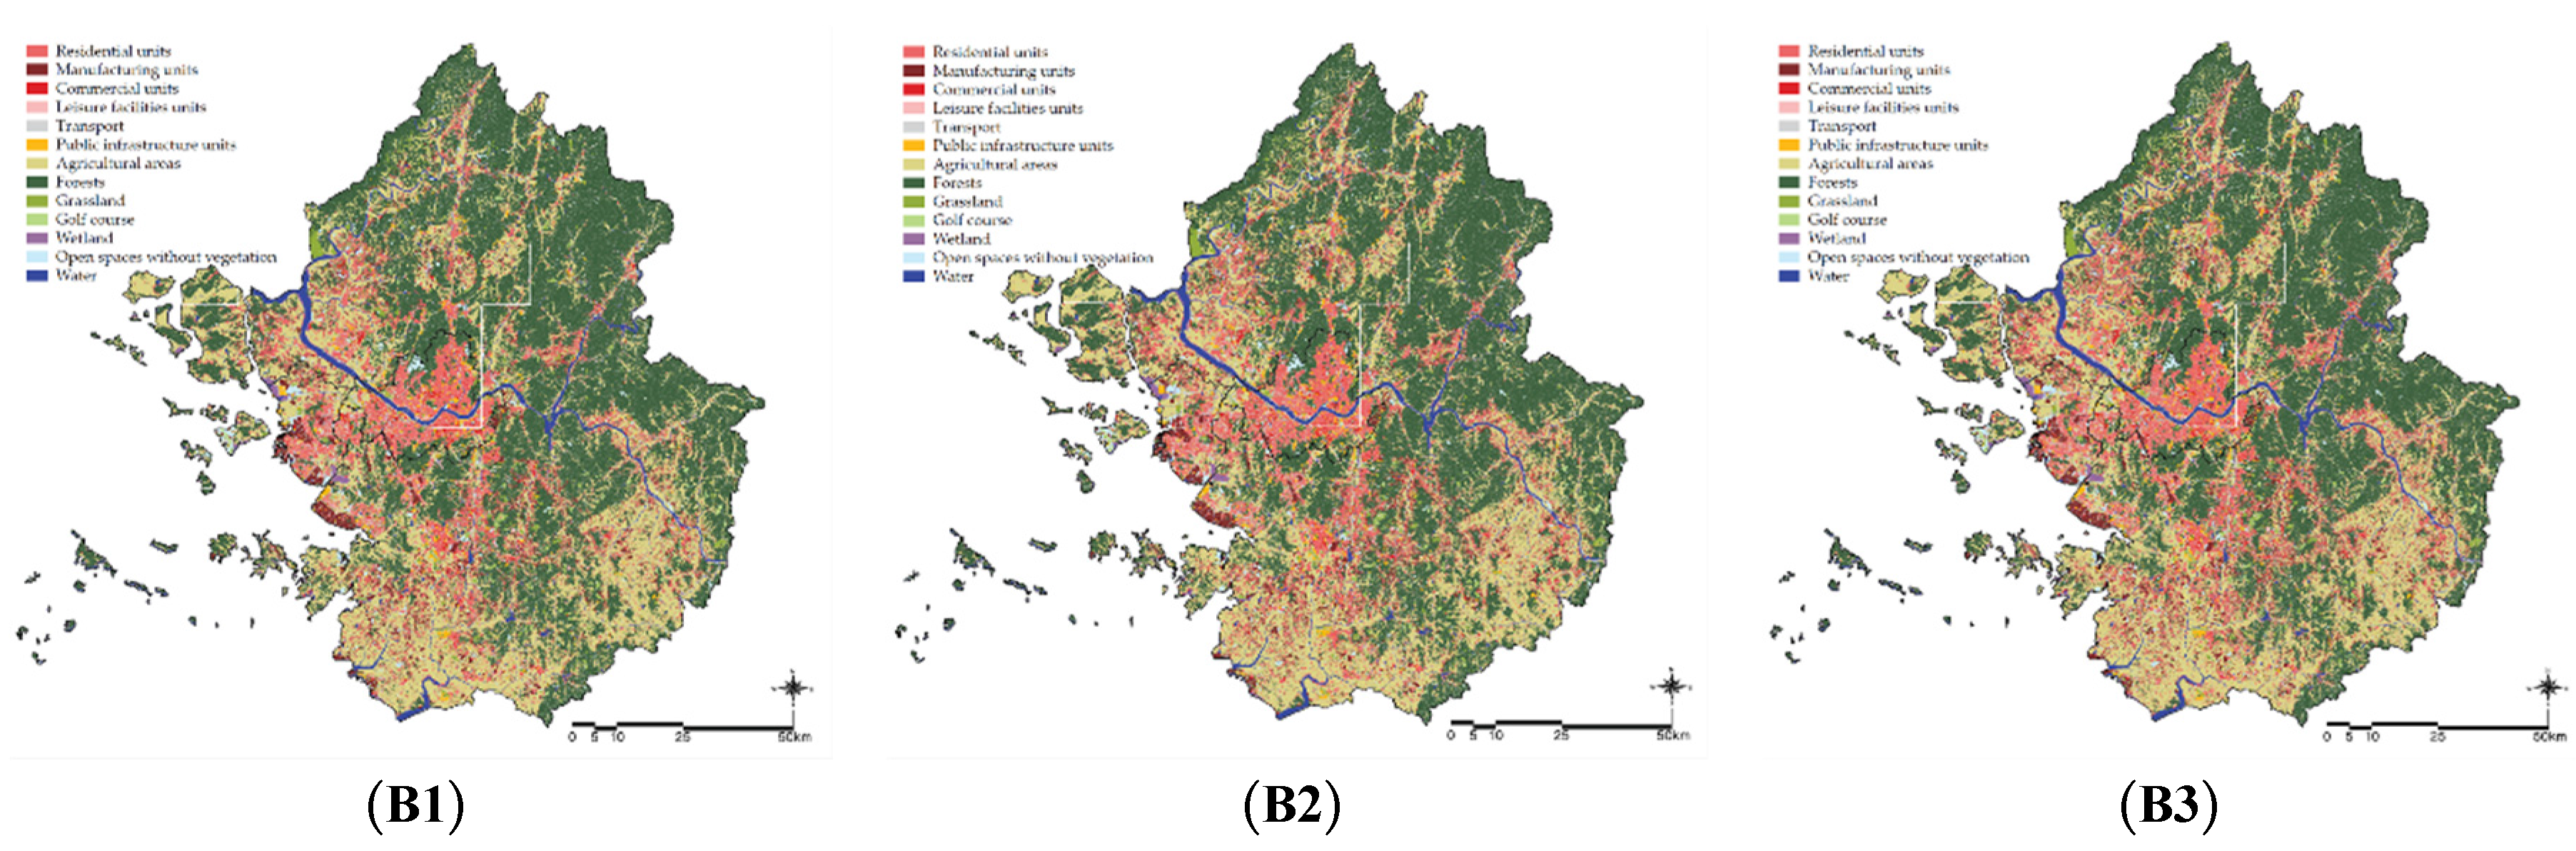
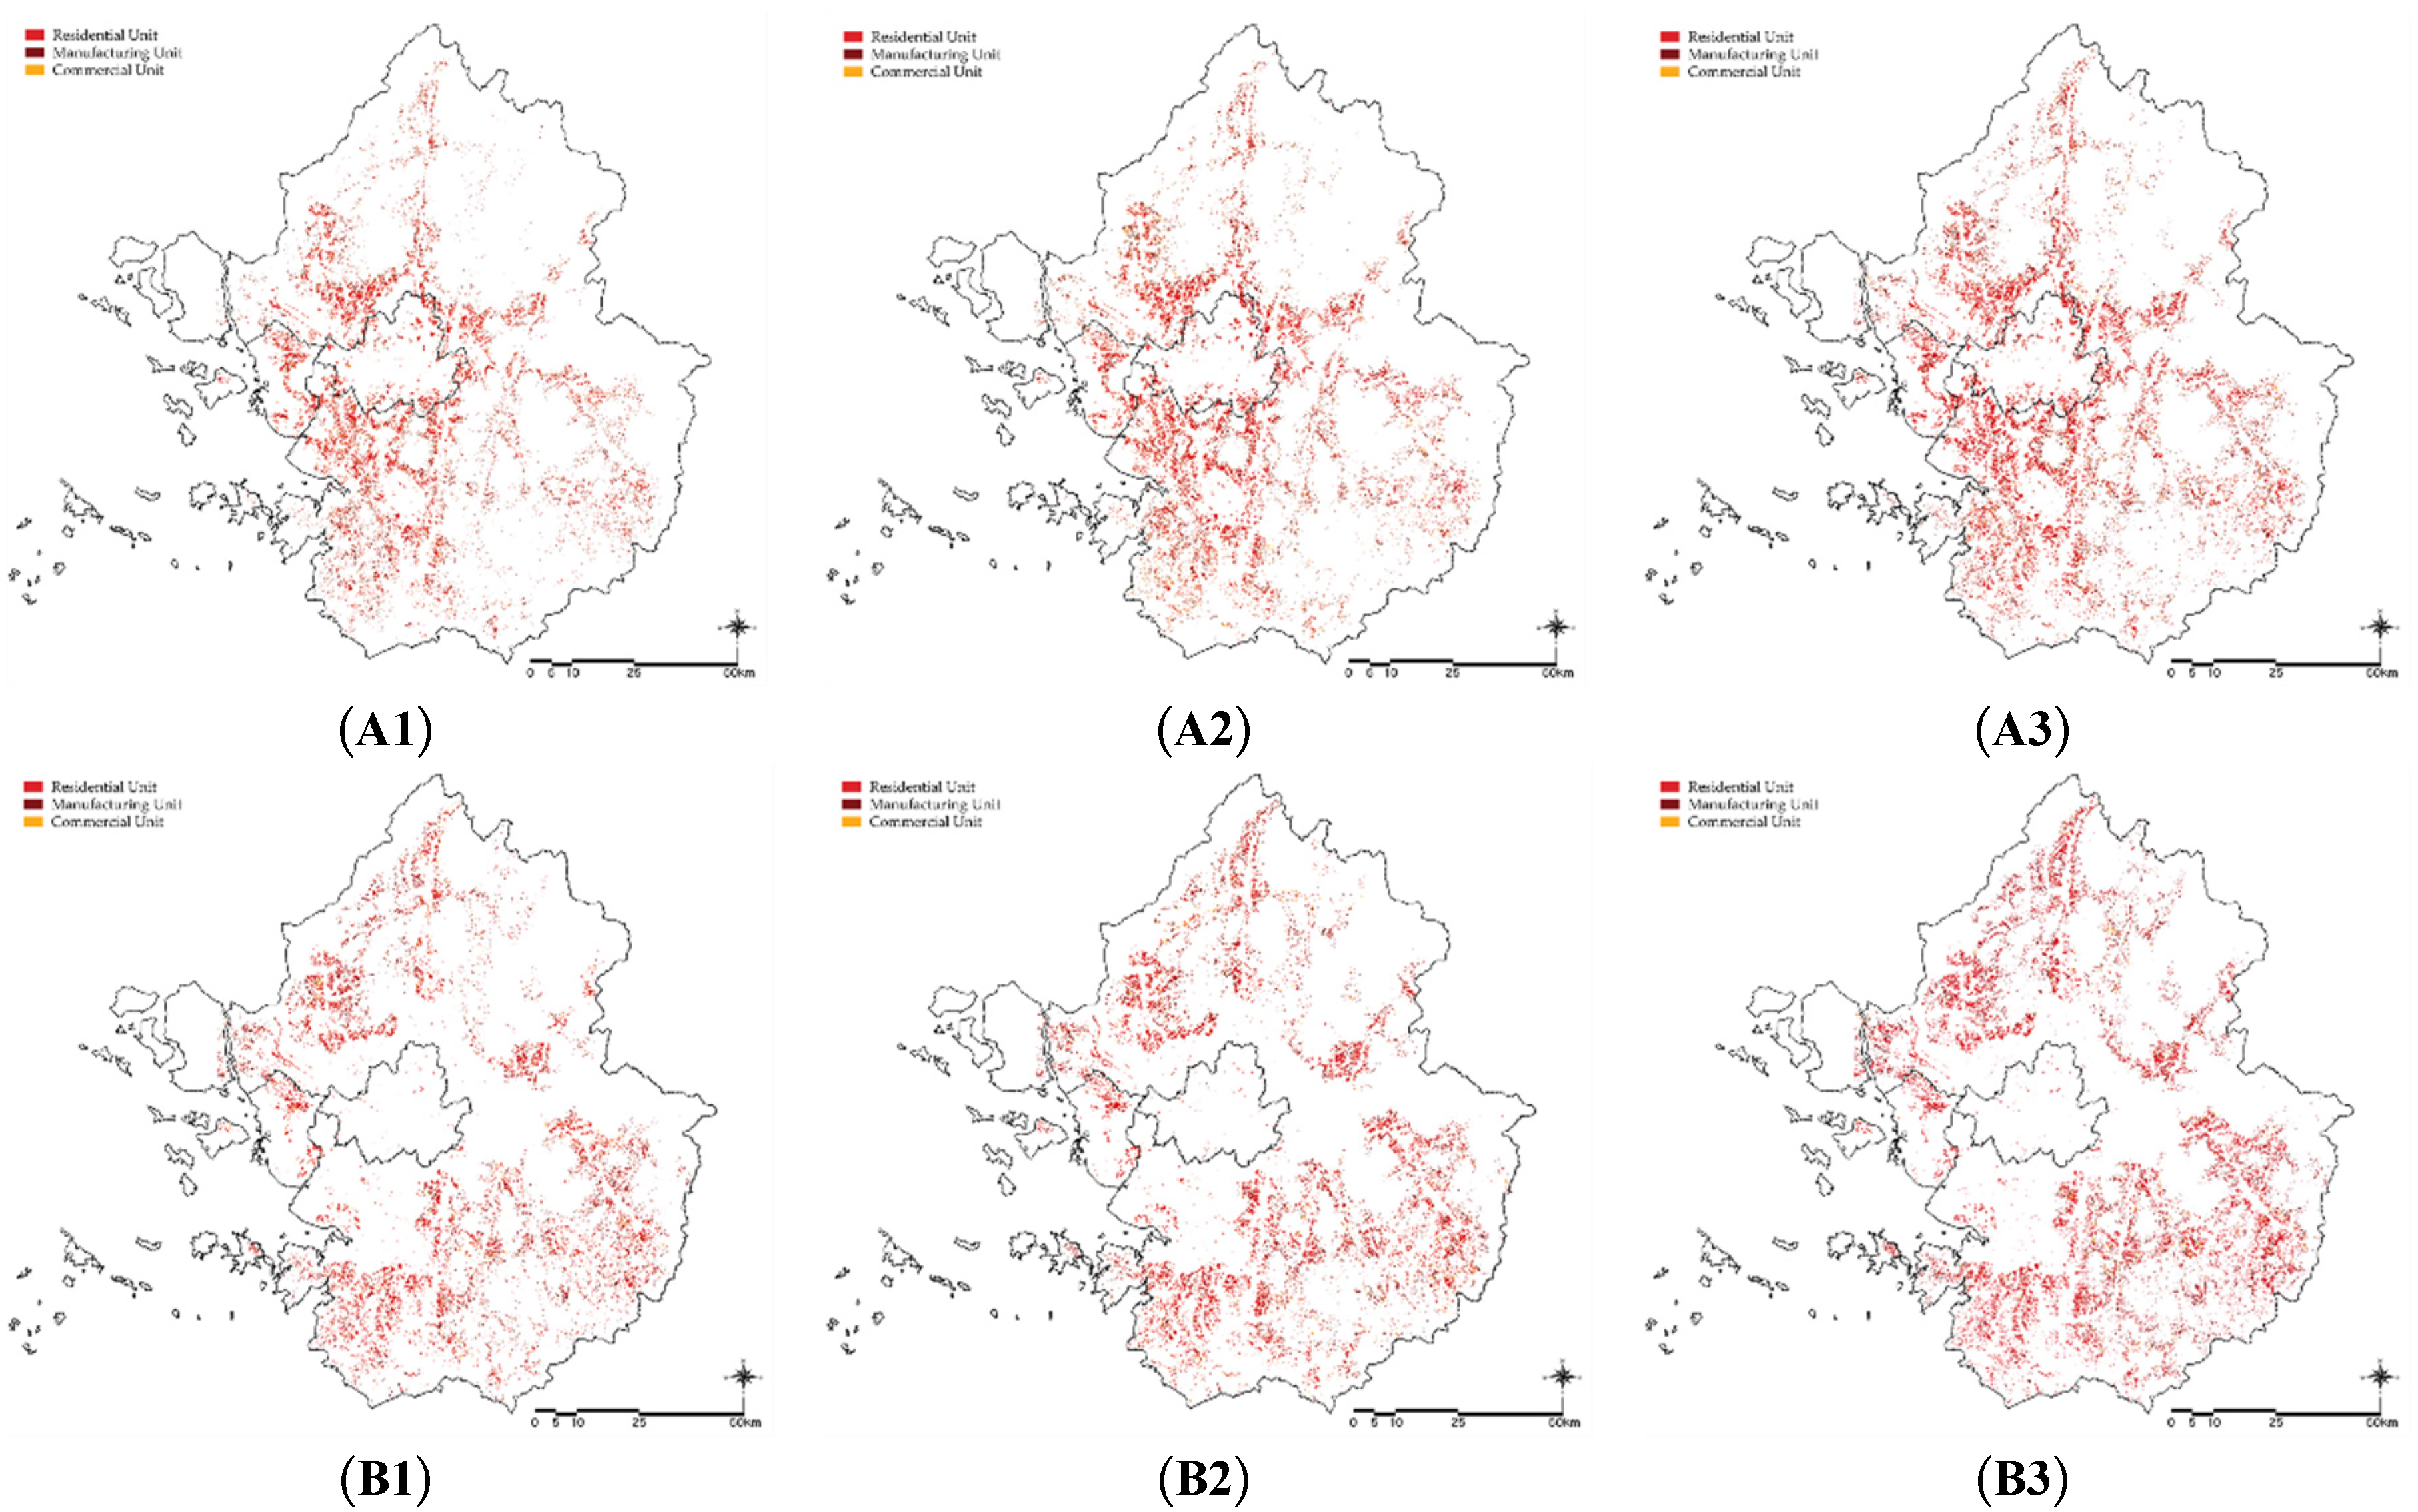
4.3.4. Producing the Spatial Plan Alternatives (Land Use Scenarios)
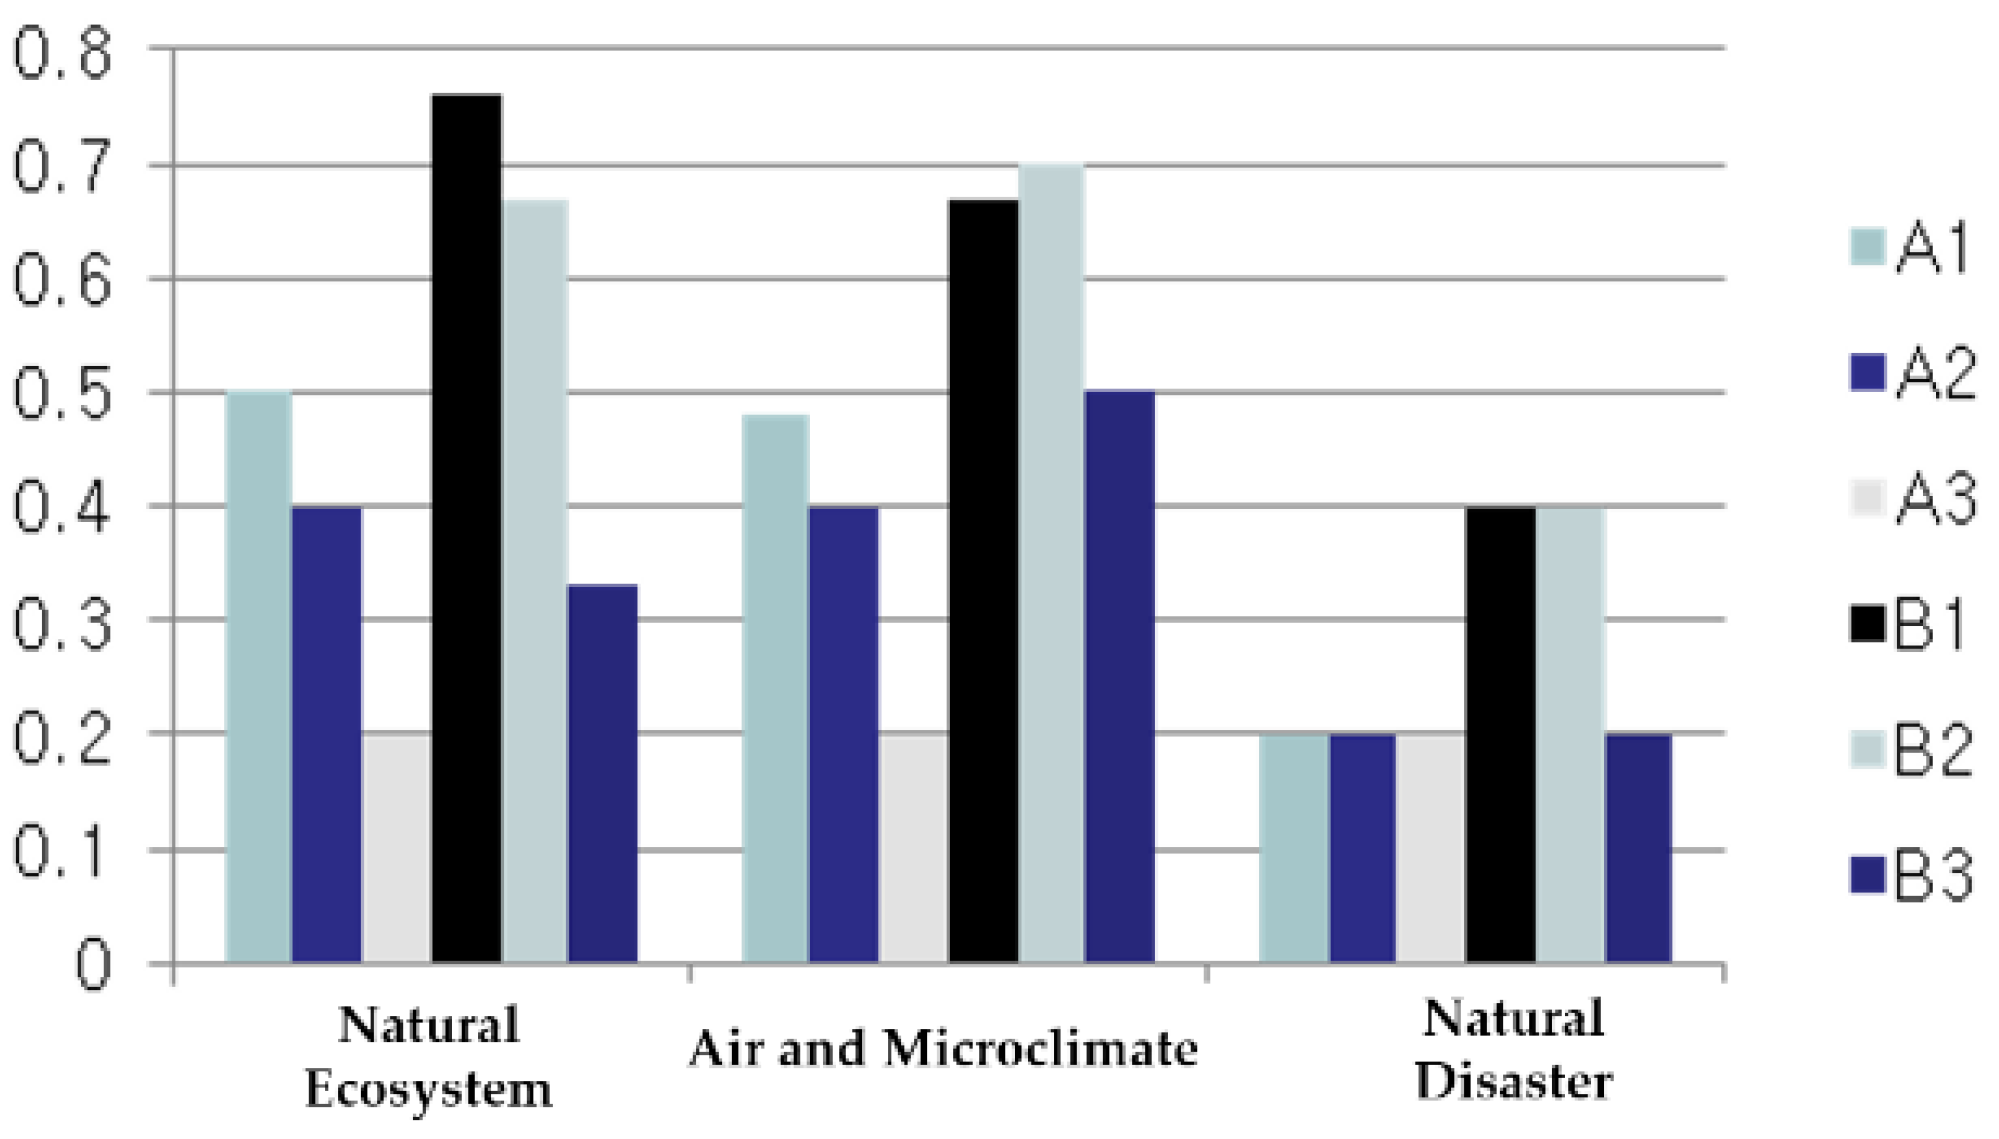
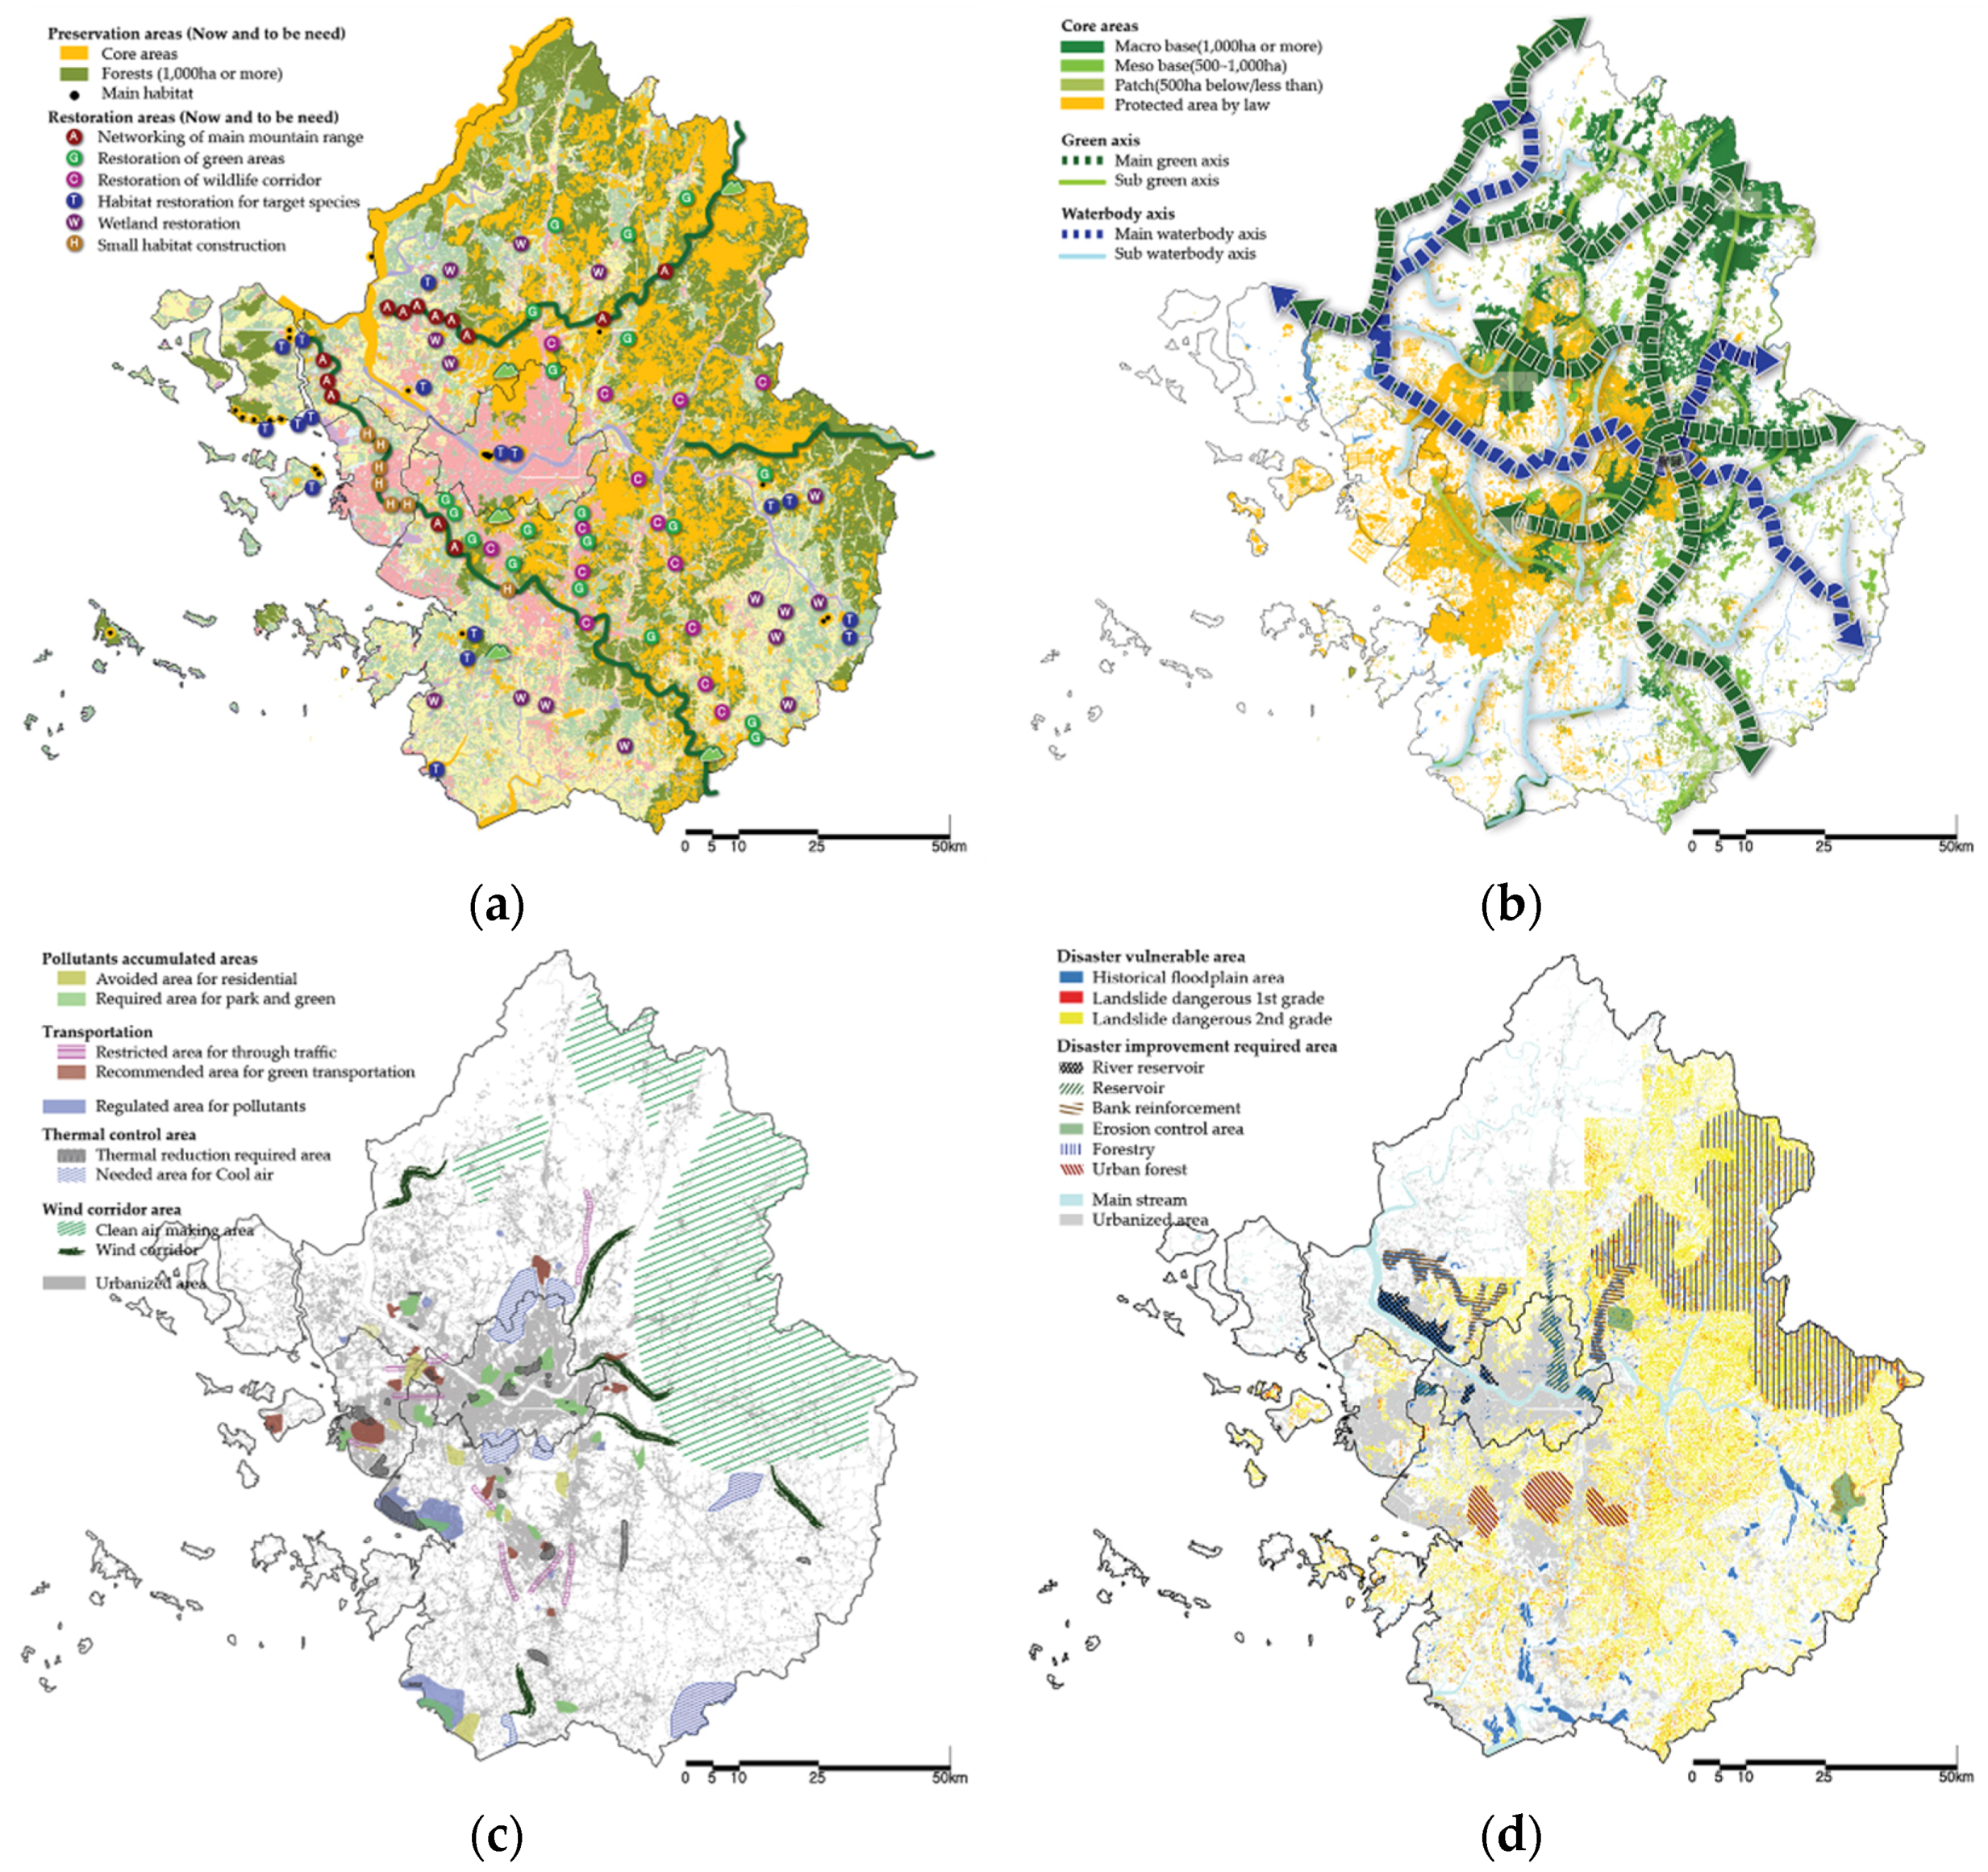
4.4. Environmental Assessment for the Spatial Plan Alternative
4.5. Summary of Alternatives and Environmental Assessment
5. Discussion and Conclusions
Acknowledgments
Author Contributions
Conflicts of Interest
References
- Choi, Y.K.; Lee, S.B.; Park, I.K.; Kim, H.S.; Byeon, B.S. A Study on the Linkage of Spatial Planning and Environmental Planning System toward Sustainable Development; KRIHS: Anyang City, Korea, 2002. [Google Scholar]
- He, J.; Bao, C.; Shu, T.; Yun, X.; Jiang, D.; Brwon, L. Framework for integration of urban planning, strategic environmental assessment and ecological planning for urban sustainability within the context of China. Environ. Impact Assess. Rev. 2010, 31, 549–560. Available online: http://www.sciencedirect.com/science/article/pii/S0195925510001162 (accessed on 7 January 2016). [Google Scholar] [CrossRef]
- Jessel, B.; Tobias, K. Oekologisch Orientierte Planung: Eine Einführung in Theorien Daten und Methoden Ulmer; UTB: Stuttgart, Germany, 2002; p. 22. (In German) [Google Scholar]
- Puget Sound Regional Council. Growth Management and Scenario Planning in the Central Puget Sound Region. Available online: https://www.google.com/url?sa=t&rct=j&q=&esrc=s&source=web&cd=1&ved=0ahUKEwjPlKXz2MbLAhWm_HIKHa_GCe8QFggcMAA&url=%68%74%74%70%3a%2f%2f%77%77%77%2e%63%6d%63%67%63%2e%63%6f%6d%2f%6d%65%64%69%61%2f%68%61%6e%64%6f%75%74%73%2f%32%36%30%31%32%36%2f%53%41%54%2d%50%44%46%2f%36%30%30%2d%42%61%6b%6b%65%6e%74%61%2e%50%44%46&usg=AFQjCNH8KC5-a_Irlh1CxBqYnxZWNgJ-Vg&sig2=k5eH4Nm8FDoVr_9VMK9l9A&bvm=bv.117218890,d.bGQ&cad=rja (accessed on 7 January 2016).
- Runhaar, H.; Driessen, P.P.J.; Soer, L. Sustainable urban development and the challenge of policy integration: An assessment of planning tool for integrating spatial and environmental planning in the Netherlands. Environ. Plan. B: Plan. Des. 2009, 36, 417–431. Available online: http://epb.sagepub.com/content/36/3/417.short (accessed on 7 January 2016). [Google Scholar] [CrossRef]
- Washington Department of Commerce. Urban Growth Area Guidebook. Available online: http://www.commerce.wa.gov/Services/localgovernment/GrowthManagement/Growth-Management-Planning-Topics/Pages/Urban-Growth-Areas.aspx (accessed on 7 January 2016).
- Ministry of Environment, Ministry of Land, Infrastructure and Transport. Land Development-Environment Planning Linkage System Strategy; Ministry of Environment: Sejeong City, Korea, 2013.
- Choi, H.S.; Yoo, H.S.; Jeon, S.W.; Choi, J.G.; Jang, R.Y.; Park, J.H. 2013 Land Environment Policy Forum; Ministry of Environment: Sejong City, Korea, 2013.
- Yoo, H.S.; Lee, Y.J.; Choi, H.S.; Joo, Y.J. 2014 Land Environment Policy Forum; Ministry of Environment: Sejong City, Korea, 2014.
- Choi, H.S.; Lee, Y.J.; Moon, N.K.; Sun, H.S.; Eum, J.H.; Park, J.H. Spatial Environmental Planning Guideline based on Environmental Information System; KEI: Seoul, Korea, 2010; pp. 207, 209, 238, 275. [Google Scholar]
- McLain, R.; Poe, M.; Biedenweg, K.; Cerveny, L.; Besser, D.; Blahna, D. Making sense of human ecology mapping: An overview of approaches to integrating socio-spatial data into environmental planning. Hum. Ecol. 2013, 41, 651–665. Available online: http://link.springer.com/article/10.1007/s10745-013-9573-0#page-1 (accessed on 7 January 2016). [Google Scholar] [CrossRef]
- Smith, A.; Dodge, M.; Doyle, S. Visual Communication in Urban Planning and Urban Design, Center for Advanced Spatial Analysis, UCA Working Group Series paper 2. 1998. Available online: http://www.bartlett.ucl.ac.uk/casa/pdf/paper2.pdf (accessed on 7 January 2016).
- Batty, M. Planning Support Systems: Progress, Predictions, and Speculations on the Shape of Things to Come, UCL working papers series. UCL CENTRE FOR ADVANCED SPATIAL ANALYSIS, 2007. Available online: http://discovery.ucl.ac.uk/15175/1/15175.pdf (accessed on 4 January 2016).
- Greetman, S.; Stillwell, J. Planning Support System. An Introduction. In Planning Support System in Practice, 1st ed.; Greetman, S., Stillwell, J., Eds.; Springer: New York, NY, USA, 2003; pp. 3–22. [Google Scholar]
- Harrison, C.; Haklay, M. The potential of public participation GIS in UK environmental planning: Appraisals by active publics. Int. J. Environ. Plan. Manag. 2002, 45, 841–864. Available online: http://dx.doi.org/10.1080/0964056022000024370 (accessed on 7 January 2016). [Google Scholar] [CrossRef]
- Klosterman, R.E. Planning Support Systems: A New Perspective on Computer aided planning. In Planning Support System: Integrating Geographic Information System, Models and Visualization Tools; Brail, R.K., Klosterman, R.E., Eds.; ESRI Press: Redlands, CA, USA, 2001; pp. 1–23. [Google Scholar]
- Nyerges, T.L.; Jankowski, P. Situating GIS-Based Decision Support. In Regional and urban GIS: A decision Support Approach; The Guilford Press: New York, NY, USA, 2010. [Google Scholar]
- Kweon, I.; Kim, J.W.; Choi, B.M. A simulation of the Growth of Seoul Metropolitan’s Build-up Area with a GIS-based PSS Model. J. Korea Plan. Assoc. 2004, 39, 69–84. [Google Scholar]
- Park, J.J.; Sung, H.J.; Park, C.H. A Study on the Linkage of Spatial Planning and Environmental Planning System toward Sustainable Development. Seoul City Res. 2015, 16, 1–16. [Google Scholar]
- Choi, B.N.; Lim, Y.S. Korea Planning Supporting System for Land Spatial Plan based on science KRIHS; POLICY PRIEF: Gyeonggi Province, Korea, 2009; p. 213. [Google Scholar]
- Lee, H.U.; Choi, H.S.; Eum, J.H.; Yoo, H.S.; Kim, H.M. Development of Methods for Strategy Environment Assessment by Evaluation Stage; Ministry of Environment: Gwachen City, Korea, 2010.
- Lee, Y.U.; Lee, W.S.; Ahn, H.G.; Park, J.H.; Sin, Y.J.; Lee, J.W. Action Plan for Introduction of Land Planning Evaluation System; KRIHS: Anyang City, Korea, 2011. [Google Scholar]
- Carver, S. The future of participatory approaches using geographic information: Developing a research agenda for the 21st century. Urban Inf. Syst. Association J. 2003, 15, 61–71. Available online: https://www.researchgate.net/profile/Steve_Carver/publication/238728124_The_Future_of_Participatory_Approaches_Using_Geographic_Information_developing_a_research_agenda_for_the_21_st_Century/links/0c9605290873aa6589000000.pdf (accessed on 7 January 2006). [Google Scholar]
- Vanderhaegen, M.; Muro, E. Contribution of a European spatial data infrastructure to the effectiveness of EIA. Environ. Impact Assess. Rev. 2005, 25, 123–142. [Google Scholar] [CrossRef]
- Del Campo, A. Incorporating Spatial Data and GIS to Improve SEA of Land Use Plans: Opportunities and Limitations: Case Studies in the Republic of Ireland. Available online: http://arrow.dit.ie/cgi/viewcontent.cgi?article=1002&context=builtdoc (accessed on 7 January 2016).
- EPA. GISEA Manual the Application of GIS as a Support Tool in SEA of Irish Land Use Plans: Current Practice and Potential. Available online: http://testweb.epa.ie/pubs/consultation/Updated%20Jan%202010%20Draft_GISEAManual.pdf (accessed on 7 January 2016).
- Klosterman, R.E. User’s Guide to What if? 2.0. Available online: http://www.whatifinc.biz/im/docs/UsersGuide2.0.pdf (accessed on 7 January 2016).
- Kweon, I. Land Use Simulation Use by What if? TM’ Model; KEI Seminar: Seoul, Korea, 2011. [Google Scholar]
- Klosterman, R.E. A new tool for a new planning: The What if?™ Planning Support System. In Planning Support Systems for Cities and Regions; Brail Richard, K., Ed.; Lincoln Institute of Land Policy: Cambridge, MA, USA, 2008; pp. 85–99. [Google Scholar]
- Kim, H.J.; Choi, H.J. A Study on Building up the Portal Service to Support Low-Carbon City Planning in Korea. J. Korea Acad.-Ind. Coop. Scociety 2013, 14, 2465–2473. [Google Scholar] [CrossRef]
- Kaiser, E.J.; Godschalk, D.R.; Chapin, F.S. Urban Land Use Planning; University of Illinois Press: Champaign, IL, USA, 1995. [Google Scholar]
- Kweon, I.; Kim, J.W. Urban Land Model. J. Am. Ist. Plan. 2002, 39, 163–187. [Google Scholar]
- Gyeonggi Research Institute. Gyeonggi Province Environment Conservation Plan; Gyeonggi Research Institute: Suwon City, Korea, 2009. [Google Scholar]
- Gyeonggi Research Institute. The 2020 Gyeonggi Province Comprehensive Plan (2011~2020); Gyeonggi Research Institute: Suwon City, Korea, 2011. [Google Scholar]
- Incheon Development Institute. The 2020 Incheon City General Plan; Incheon Development Institute: Incheon, Korea, 2005. [Google Scholar]
- The Seoul Institute. The 2020 Seoul City General Plan; The Seoul Institute: Seoul, Korea, 2009. [Google Scholar]
- Ministry of Land, Infrastructure and Transport. The 3rd 2020 Seoul Metropolitan Area Adjustment Plan (2006~2020); Ministry of Land, Infrastructure and Transport: Gwachen City, Korea, 2009.
- Statistics Korea. The Future Population Special Prediction of Cities and Counties; Statistics Korea: Daejeon city, Korea, 2007. [Google Scholar]
- Statistics Korea. Available online: http://kostat.go.kr/portal/eng/index.action (accessed on 7 January 2016).
- Geneletti, D. Environmental assessment of spatial plan policies through land use scenarios: A study in a fast-developing town in rural Mozambique. Environ. Impact Assess. Rev. 2011, 32, 1–10. Available online: http://www.sciencedirect.com/science/article/pii/S019592551100028X (accessed on 7 January 2016). [Google Scholar] [CrossRef]
- Pettit, C.J. Use of collaborative GIS-based planning-support system to assist in formulating a sustainable-development scenario for Hervey Bay. Aust. Environ. Plan B 2005, 32, 523–545. Available online: http://epb.sagepub.com/content/32/4/523.full.pdf+html (accessed on 15 January 2016). [Google Scholar] [CrossRef]
- Ministry of Land, Infrastructure and Transport. The Guideline for Land Use Suitability Assessment; Ministry of Land, Infrastructure and Transport: Gwacheon City, Korea, 2010.
- Petrov, L.O.; Lavalle, C.; Kasanko, M. Urban land use scenarios for a tourist region in Europe: Applying theMOLANDmodel to Algarve, Portugal. Landsc. Urban Plan 2009, 92, 10–23. [Google Scholar] [CrossRef]
- Markus, E.; Maria, R.P. Development of a framework to assist the integration of environmental, social and economic issues in spatial planning. Impact Assess. Proj. Apprais. 2000, 18, 201–207. Available online: http://www.tandfonline.com/doi/pdf/10.3152/147154600781767448 (accessed on 4 January 2016). [Google Scholar]
- Therivel, R. Strategic Environmental Assessment in Action; Earthscan, IncNet Library: London, UK, 2004. [Google Scholar]
- González, A.; Gilmer, A.; Foley, R.; Sweeney, J.; Fry, J. Applying geographic information system to support strategic environmental assessment: Opportunities and limitations in the context of Irish and land-use plans. Environ. Impact Assess. Rev. 2011, 31, 368–381. Available online: http://www.sciencedirect.com/science/article/pii/S0195925510001484 (accessed on 7 January 2016). [Google Scholar] [CrossRef]
- Cerrta, M.; De Toro, P. Strategic Environmental Assessment of Port Plans in Italy: Experiences, Approaches, Tools. Sustainability 2012, 4, 2888–2921. [Google Scholar] [CrossRef]


| Contents | Statistic Korea | Gyeonggi Province, Seoul and Incheon Cities’ Plan | Each Sub-City’s and County’s Plan | ||||
|---|---|---|---|---|---|---|---|
| 2009 | 2020 | 2009 | 2020 | 2009 | 2020 | ||
| Population | 24,524,765 | 25,786,376 | 24,524,765 | 27,179,000 | 24,524,765 | 29,428,800 | |
| Industry Population | Primary Industry | 14,074 | 275,239 | 14,074 | 290,104 | 14,074 | 314,118 |
| Secondary Industry | 2,035,430 | 3,249,575 | 2,035,430 | 3,425,073 | 2,035,430 | 3,708,591 | |
| Tertiary Industry | 6,947,357 | 9,151,233 | 6,947,357 | 9,645,456 | 6,947,357 | 10,443,880 | |
| Contents | Statistic Korea | Gyeonggi Province, Seoul and Incheon Cities’ Plan | Each Sub-City’s and County’s Plan | |
|---|---|---|---|---|
| Population (No.) | 2020 Predicted Population | 25,786,376 | 27,179,000 | 29,428,800 |
| Land Demands (km2) | Spatial Plan for Basic Preservation | 655.25 | 759.17 | 927.63 |
| Spatial Plan for Strict Preservation | 650.40 | 754.04 | 921.26 | |
| Analysis Factors | 1 | 2 | 3 | 4 | 5 | |
|---|---|---|---|---|---|---|
| Existing Land Use | Urbanized Area | Farm Land | Grassland, Bare Land | Forest | Water and Wetland | |
| Natural Suitability | Slope | Under 5° | 5°–15° | 15°–20° | 20°–25° | 25° or more |
| Altitude | Under 100 m | - | 100–200 m | - | 200 m or more | |
| Eco-Natural Map | 3 grade | - | 2 grade | - | 1 grade | |
| Distance | Distance from Expressway Gate | Under 1 km | 1–2 km | 2–3 km | 3–5 km | 5 km or more |
| Distance from Main Road | Under 500 m | 500–1000 m | 1000–2000 m | 2000–3000 m | 3000 m or more | |
| Distance from Train or Subway Station | Under 1 km | 1–2 km | 2–3 km | 3–5 km | 5 km or more | |
| Distance from Existing Urban Area | Under 1 km | 1–2 km | 2–3 km | 3–5 km | 5 km or more | |
| Contents | Applied Areas |
|---|---|
| Spatial plan for basic preservation | Ecological landscape protected area, DMZ, Wildlife sanctuary, National park, Wetland conservation area |
| Spatial plan for strict preservation | Ecological landscape protected area, DMZ, Wildlife sanctuary, National park, Wetland conservation area, Eco-natural map 1st Grade, Green belt, Urban natural park, Water resources conservation area |
| Grade | 2009 New City Plan | Main Transportation Infrastructure | Cities, Counties, Boroughs |
|---|---|---|---|
| 1 | Development Arranged Area | - | - |
| 2 | - | 1 km or less | 3 km or less |
| 3 | - | 1–3 km | 3–5 km |
| 4 | - | 3–5 km | 5–10 km |
| 5 | - | 5 km or more | 10 km or more |
| Evaluation Factors | Evaluation Indicator | Analysis Results by Scenarios (km2) | |||||
|---|---|---|---|---|---|---|---|
| A1 | A2 | A3 | B1 | B2 | B3 | ||
| Natural Ecosystem | Land Use Change | 655.25 | 759.17 | 927.63 | 650.40 | 754.04 | 921.26 |
| 2 | 4 | 6 | 1 | 3 | 5 | ||
| Forest to be Damaged | 545.04 | 631.30 | 789.33 | 526.07 | 624.11 | 777.76 | |
| 2 | 4 | 6 | 1 | 3 | 5 | ||
| Preservation Areas to be Damaged | 222.25 | 256.90 | 335.68 | 202.22 | 256.22 | 334.64 | |
| 2 | 4 | 6 | 1 | 3 | 5 | ||
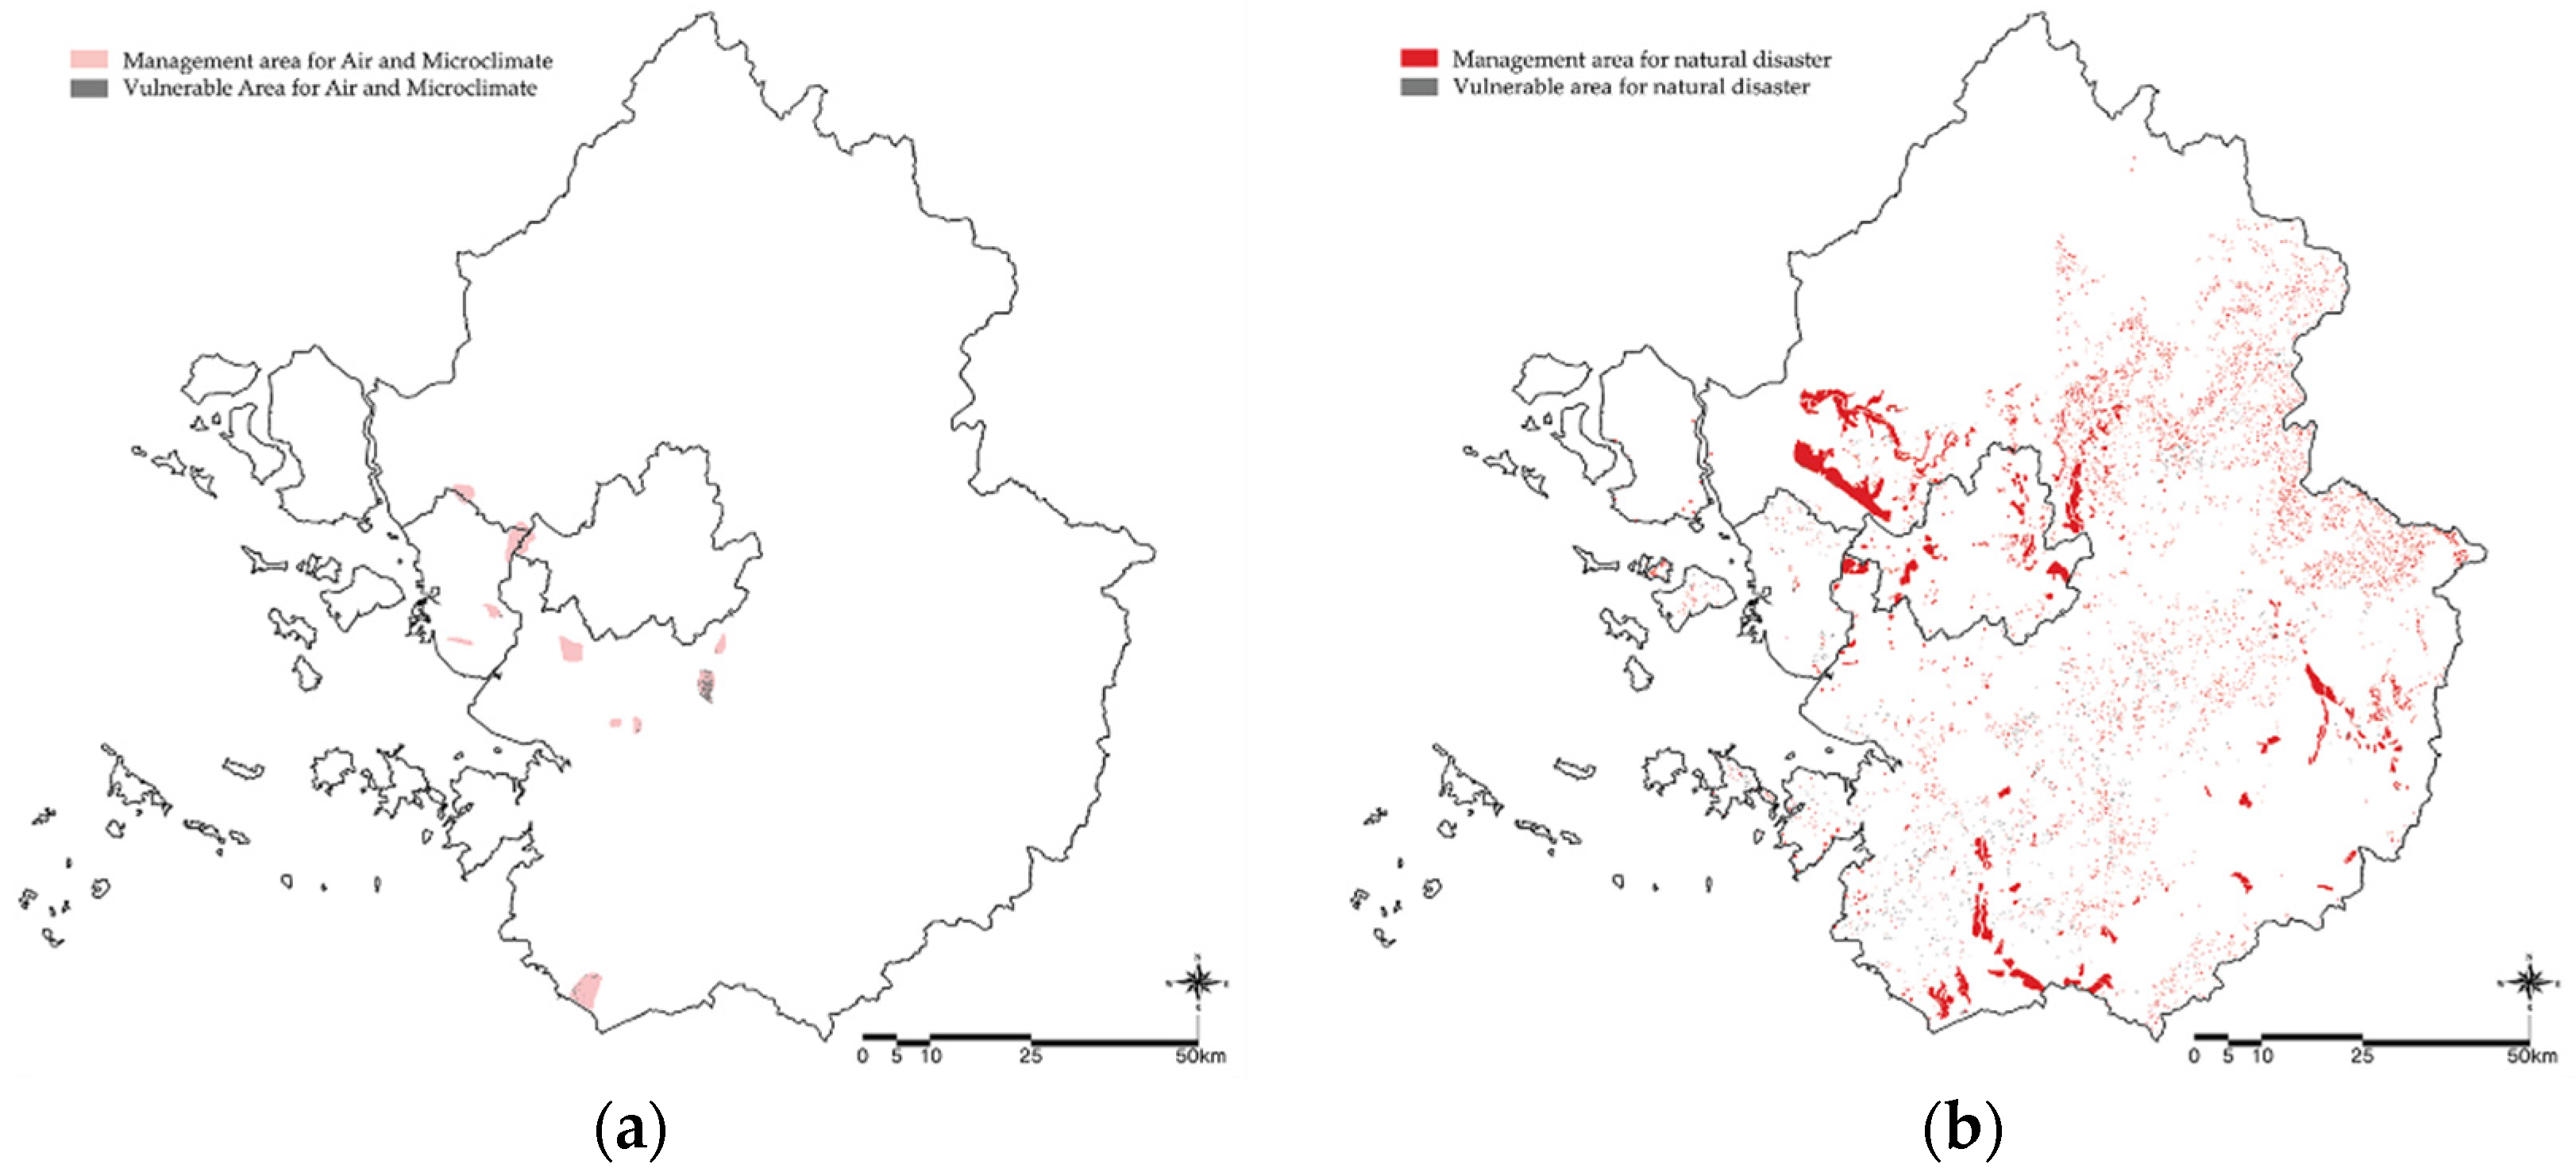
| Air and Micro-climate | Development Area Not Recommended for Residence | 11.73 | 12.52 | 13.59 | 4.86 | 5.77 | 6.26 |
| 4 | 5 | 6 | 1 | 2 | 3 | ||
| Natural Disaster | Development Area in Vulnerable Area for Disaster | 24.89 | 27.98 | 32.25 | 21.52 | 24.47 | 28.81 |
| 3 | 4 | 6 | 1 | 2 | 5 | ||
| Ranking | 1459.16 | 1687.87 | 2098.48 | 1405.07 | 1664.61 | 2068.73 | |
| 2 | 4 | 6 | 1 | 3 | 5 | ||
© 2016 by the authors; licensee MDPI, Basel, Switzerland. This article is an open access article distributed under the terms and conditions of the Creative Commons by Attribution (CC-BY) license (http://creativecommons.org/licenses/by/4.0/).
Share and Cite
Choi, H.-S.; Lee, G.-S. Planning Support Systems (PSS)-Based Spatial Plan Alternatives and Environmental Assessment. Sustainability 2016, 8, 286. https://doi.org/10.3390/su8030286
Choi H-S, Lee G-S. Planning Support Systems (PSS)-Based Spatial Plan Alternatives and Environmental Assessment. Sustainability. 2016; 8(3):286. https://doi.org/10.3390/su8030286
Chicago/Turabian StyleChoi, Hee-Sun, and Gil-Sang Lee. 2016. "Planning Support Systems (PSS)-Based Spatial Plan Alternatives and Environmental Assessment" Sustainability 8, no. 3: 286. https://doi.org/10.3390/su8030286
APA StyleChoi, H.-S., & Lee, G.-S. (2016). Planning Support Systems (PSS)-Based Spatial Plan Alternatives and Environmental Assessment. Sustainability, 8(3), 286. https://doi.org/10.3390/su8030286