1. Introduction
Due to the increased pressure of globalization upon the world market, business competitiveness is currently dependent upon the innovative abilities of companies, not only in the area of products but also in processes. One modern approach is based on corporate performance measurement by means of internal process performance measurements. Companies are, therefore, shifting more and more of their attention from the quality of products to the performance and quality of internal business processes.
The performance of business processes represents achieving the required results in a given process, and its size is expressed by the difference between the actual and the required results. The performance of the process is evaluated by comparing actually achieved and required value of the stated index of the process, which can be the duration of the process, costs for the process, the quality of the process, added value, the number of skills, and the number of innovations.
To make the required process performance sustainable their capability must be assured, i.e., the required process quality. Correct decisions play an important role in the quality assurance process and they shall be based on the situation analysis using appropriate tools and methods of operational management and quality improvement. The Six Sigma methodology (SSM) is used as the process quality assurance and improvement method, as its implementation has achieved significant cost reductions, mainly in the machine, automotive, and electric and technical industry.
Successful results in an automotive industry after implementation of the Six Sigma methodology (SSM) are presented in studies [
1,
2,
3]. Benefits of using SSM in achieving the required process capabilities improvement, hence improving the system stability, were presented by Al-Agha
et al. [
4]. The highly useful role of Six Sigma for small and medium enterprises was justified by Kaushik
et al. [
5]. The main idea of successful leadership to achieve sustainable competitive advantage to ensure the quality of service by using SSM was reviewed in the paper of Rabeea
et al. [
6].
Six Sigma has been applied not only in the industrial enterprises but also in the area of the services, health, and public administration, both in the private and public field, where there is a strong orientation on the customer, quality, time, and performance [
7].
Six Sigma originated in the 1980s as a corporate strategy containing a set of techniques for improvement of manufacturing processes and the elimination of defects in the Motorola company. The main goal of the strategy was to minimize the dispersion of the characteristics critical for quality of the manufactured products and performed processes and setting of the average values approaching the target values defined by the customers. The application of SSM brought about changes within a short time, leading to the reduction of defects in the products using the same labor, technology, and design, while consuming less cost. Thanks to the strategy, Motorola gained the leading position in the area of the quality and was awarded the Malcom National Quality Award. Many worldwide enterprises like Toyota, Ford, BMW, Hilti, Shell, General Electric, Honeywell International, Caterpillar, Raytheon, and Merril Lynch have successfully applied this methodology [
4]. General Electric was one of the first companies adopting the SSM from Motorola and in the three years since introduction they calculated that the method had saved them $750 million, net, after subtracting all costs, including the cost on the method.
Based on a case study done by Nilmani and Shidhar in a firm producing automotive components, the company was able to improve the process yield from 44% to 90% after applying SSM [
8]. The process capability sigma level improved from 2.91 to 4.43 sigma [
9]. According to Gibbons, by applying Six Sigma in a well-known manufacturing company in the United Kingdom, overall equipment effectiveness improved significantly from 40% to 85% [
10]. He also concluded that using the DMAIC (Define-Measure-Analyze-Improve-Control) approach provided a systematic improvement and problem-solving process. Moreover, this kind of process improvement approach resulted in a sustainable and stable process.
Experience of Slovak and Czech enterprises has proven that, for example, processes in manufacturing companies in the automobile industry with an already established quality assurance system are at an average level of around 3.5 to 4 sigma. In this case, an improvement in the firm’s processes by 0.2 sigma represents economic benefits in the amount of 1% of company income.
Six Sigma processes show a proven approach for businesses and organizations to improve their performance and that sustainability programs are in need of this operational approach and discipline. Six Sigma helps a business leader design a sustainable program for value creation [
11].
Research from several authors, as well as experience from companies, have shown that Six Sigma provides process performance on a high and sustainable level. The authors of the paper have chosen, out of all existing concepts, just this one to create a model of sustainable process performance.
The first aim of the work was to prove the positive effects of the Six Sigma concept on the corporate performance of the enterprises in the Slovak Republic and investigate the dependency of SSM implementation on the implementation of a quality management system as a set-forward condition. To meet the purpose, a primary quantitative survey using a questionnaire method was carried out. The aim resulted from several studies dealing with effects of SSM on corporate performance [
12,
13] and investigating the relationship between certified QMS and SSM [
14,
15,
16]. The results of the studies were the inspiration behind our research hypotheses.
The goal of the paper is to introduce the Six Sigma concept in the companies with a different level of quality management system and find out the effect of the process performance. The result of the work is a model, including the methodology and the appropriate combination of the methods and tools for assurance of the sustainable performance of the business processes.
2. Material and Methods
The purpose of this study has arisen by the idea how to ensure sustainable quality and improvement of production processes. The first step was the study of the theoretical and latest scientific knowledge. Based on the study, the goal and methodology of the primary research was stated. The research results led the authors to create the purpose and procedure of the application in the real conditions of enterprises.
2.1. Literature Review
The name of the “Six Sigma” methodology comes from statistics where σ means standard deviation. The term “Six Sigma” refers to the ability of highly-capable processes to produce output within specification. In particular, processes that operate with six sigma quality produce at defect levels below 3.4 defects per (one) million opportunities [
4]. According to [
2,
3,
4,
5,
6] a Six Sigma is a statistical measure of process capability, which is equivalent to 99.99966% of good parts.
According to Töpfer
et al. [
17], Six Sigma has two dimensions which are:
Six Sigma, as project management, with sound statistical foundations and effective quality management tools, which contain:
- -
systematic methodology—DMAIC and DMADV (Define-Measure-Analyze-Design-Verify),
- -
project and process management,
- -
a set of tools—process analysis for resolving problems, statistics,
- -
philosophy and quality culture at a zero defect level.
Six Sigma, as a statistical concept for measurement, is based on the principle that there are no more than 3.4 errors in the process per million chances, whilst taking into account the complexity of products and processes.
There exist several definitions of Six Sigma, as a concept, which were summarized in the paper by Simanova [
18]. Based on studies of the opinions of individual authors of Six Sigma methodology, we may state a concordance of opinions that Six Sigma is an approach or system which, by combining the use of statistical methods, understanding customer requirements, and decreasing the variability of processes, leads to an improvement in processes and increases their level of perfection which is expressed by a maximum number of 3.4 faults per million chances.
The literature review of a lean six sigma for the manufacturing industry was provided by Albliwi
et al. [
19]. It is based on a review of papers published in the top journals, which resulted in definitions of limitations and impending factors before starting an implementation process of SSM.
Limitations and impending factors before starting a SSM implementation process were also presented in [
20,
21]. According to Kuvvetli
et al. a project selection and its scope, quality culture, and defining and measuring metrics were determined as the top factors that affect success levels of six sigma projects [
20]. The study of Arumugam
et al. has shown that technical and social supports jointly affect the success of Six Sigma implementation [
21].
The relationship between certified quality management system and SSM was investigated in the studies [
14,
15,
16]. The results of literature review performed by Karthi
et al. point to little work carried out on integrating Six Sigma and ISO 9001 standards. The synergy of implementing ISO 9001 standards and Six Sigma has been eluding contemporary organizations [
14]. The work of Chiarini deals with differences between requirements of ISO 13053 aimed to standardizing SSM implementation and the actual practises of companies by implementing Six Sigma [
16].
If we compare the contribution of Six Sigma from various sources [
1,
2,
3,
4,
5,
6,
9,
22,
23,
24,
25], it is clear that deployment of this methodology in companies brings increased performance, increased productivity, increased competitiveness, and growth in market share, whilst retaining loyal customers and obtaining new, decreased production costs by decreasing the proportion of costs for repairs and disposal of non-conforming products, new product designs, and, growth in the qualifications and professional level of employees. The study by Aldowiasan, focusing on Six Sigma performance for non-normal processes, showed that less variation reduction was required to improve exponentially distributed processes [
26]. Chao-Ton and Chia-Jan classified the benefit of SSM into hard saving involving tangible outcomes in relation to cost and revenue, and soft savings, involving actual improvements in efficiency, quality, and cash flow [
27].
Six Sigma has two key methodologies: DMAIC and DMADV. DMAIC (Define-Measure-Analyze-Improve-Control) is used to improve an existing business process, and DMADV (Define-Measure-Analyze-Design-Verify) is used to create new product or process designs for predictable, defect-free performance [
28].
DMAIC procedure has been described in several studies concerning application of Six Sigma methodology [
1,
2,
3,
4,
5,
6,
7,
8,
9,
10,
11]. Steps of DMAIC procedure endeavor to adopt a smarter way of doing things so as to minimize the occurrence of errors. It emphasizes doing things right the first time, rather than spending effort on correcting errors [
29].
The tools used by this procedure focus on minimizing the general causes of errors, increasing the quality of process outputs, decreasing operational costs, increasing process performance, and eliminating faults caused by other factors. It also involves the use of statistical methods, quality improvement techniques, and the scientific method, as well [
30]. The study of Prashar deals with the use of non-statistical Shainin DOE (Design of Experiments) tools to simplify the quality improvement initiative and its incorporating within SSM [
31]. The suggestion to implement Poka–Yoke technique in DMAIC phases is the result of the work done by Vinod
et al. [
32].
The summary of the most often used methods and tools in the methodology Six Sigma with classification to individual phases of the improvement model DMAIC in accordance with the recommendation of the authors [
1,
2,
3,
4,
17,
27,
28,
29,
30,
31,
32,
33] was made. It can be found in
Table A1 in
Appendix of this paper.
2.2. Analysis of the Current Situation in Slovak Enterprises—Methodology of the Research
The current situation in the area of process performance management has been analyzed through primary quantitative research in Slovak enterprises using the questionnaire method. The main research objective was the analysis of using traditional and modern methods and tools for process performance management and measurement in Slovak enterprises from selected industrial branches.
In the first step a database of enterprises data has been created. The information sources came mostly from the Internet databases and Statistical Bureau. The database size comprised 2235 enterprises from branches of engineering, construction, automotive, and wood-processing industries. By means of Internet applications an online questionnaire has been created and distributed to 1500 enterprises.
Questionnaire questions were divided into three areas: common characteristics (branch, region, ownership, number of employees, activity orientation, type of production organization), financial results (turnover, indicator ROE), and area of internal processes, production, and quality. Questions concerning internal processes were as follows:
What qualitative level corresponds with implementation of processes in your company?
What level of elaborated process map does your company have?
What methods are used in process management in your company?
What indicators for production process performance measurement are used in your company?
What indicators for evaluation of employee performance in processes are used in your company?
What internal processes and their indicators are regularly measured and evaluated in your company?
What certification of quality management system has got your company?
Data collection was carried out in the first quarter of 2013 and an online database for data collection was created. Number of returned questionnaires was 164, which is a representative sample in the research. Selected results have been published by authors [
34,
35,
36].
One of the research objectives was the analysis of using the methods and tools for securing of process quality (capability) in Slovak enterprises from selected industrial branches.
The following hypotheses were set for the questionnaire survey:
H1: There is a positive dependence between the application of Six Sigma and the amount of return on equity (ROE).
H2: There is a positive dependence between the application of Six Sigma and the implementation of quality management systems (QMS) according to the standards of ISO 9001.
Investigation of a dependency between SSM and QMS according to the standards ISO 9001 was suggested after the assumption that QMS according to the standards ISO 9001 is focused on ensuring and improving the process quality and it creates the basic prerequisites and necessary conditions for implementation of Six Sigma. The next reason was finding if enterprises without certified QMS have implemented the Six Sigma concept.
Results of the survey were processed by the application of several scientific methods of analysis, synthesis, deduction, and comparison. Another group of applied methods include mathematical methods focusing on the calculation of absolute, relative, and cumulative frequencies of the answers. Cross-tabulations were used for the structural analysis of the relations and causalities.
The chi-square independence test (χ
2) was used for hypotheses verification. It is necessary to create alternative hypotheses alongside with the principal hypotheses for testing:
For independent phenomena it is applicable: A, B applies to P(A ∩ B) = P(A) P(B); therefore, it is inevitable to compare the empirically-determined frequencies nij with expected frequencies.
Estimated theoretic frequencies:
and estimated theoretic compound probability:
Therefore, the estimation of theoretic frequency is:
Equation (4) shall be interpreted as a rule used for the calculation of the expected values:
Test statistics were calculated according to the following formula:
under the assumption of the independence of symbols X and Y, for sufficiently high
n, the approximate Pearson χ
2 (ν) is a distribution with degrees of variance ν = (r − 1)(s − 1). (
nij are empirical frequencies,
n´ij are theoretical,
i.e., expected frequencies). We decline the hypothesis about the independence of the symbols X and Y if:
2.3. Application Proceeding of Six Sigma Conception in Enterprises
The choice of enterprises for application of the Six Sigma concept resulted from findings in the questionnaire survey. The focus was on industries where enterprises do not use the SSM and achieve a low performance (ROE). To verify the generality of the SSM, regardless of the level of quality management system, the enterprises with a different level of quality management were chosen.
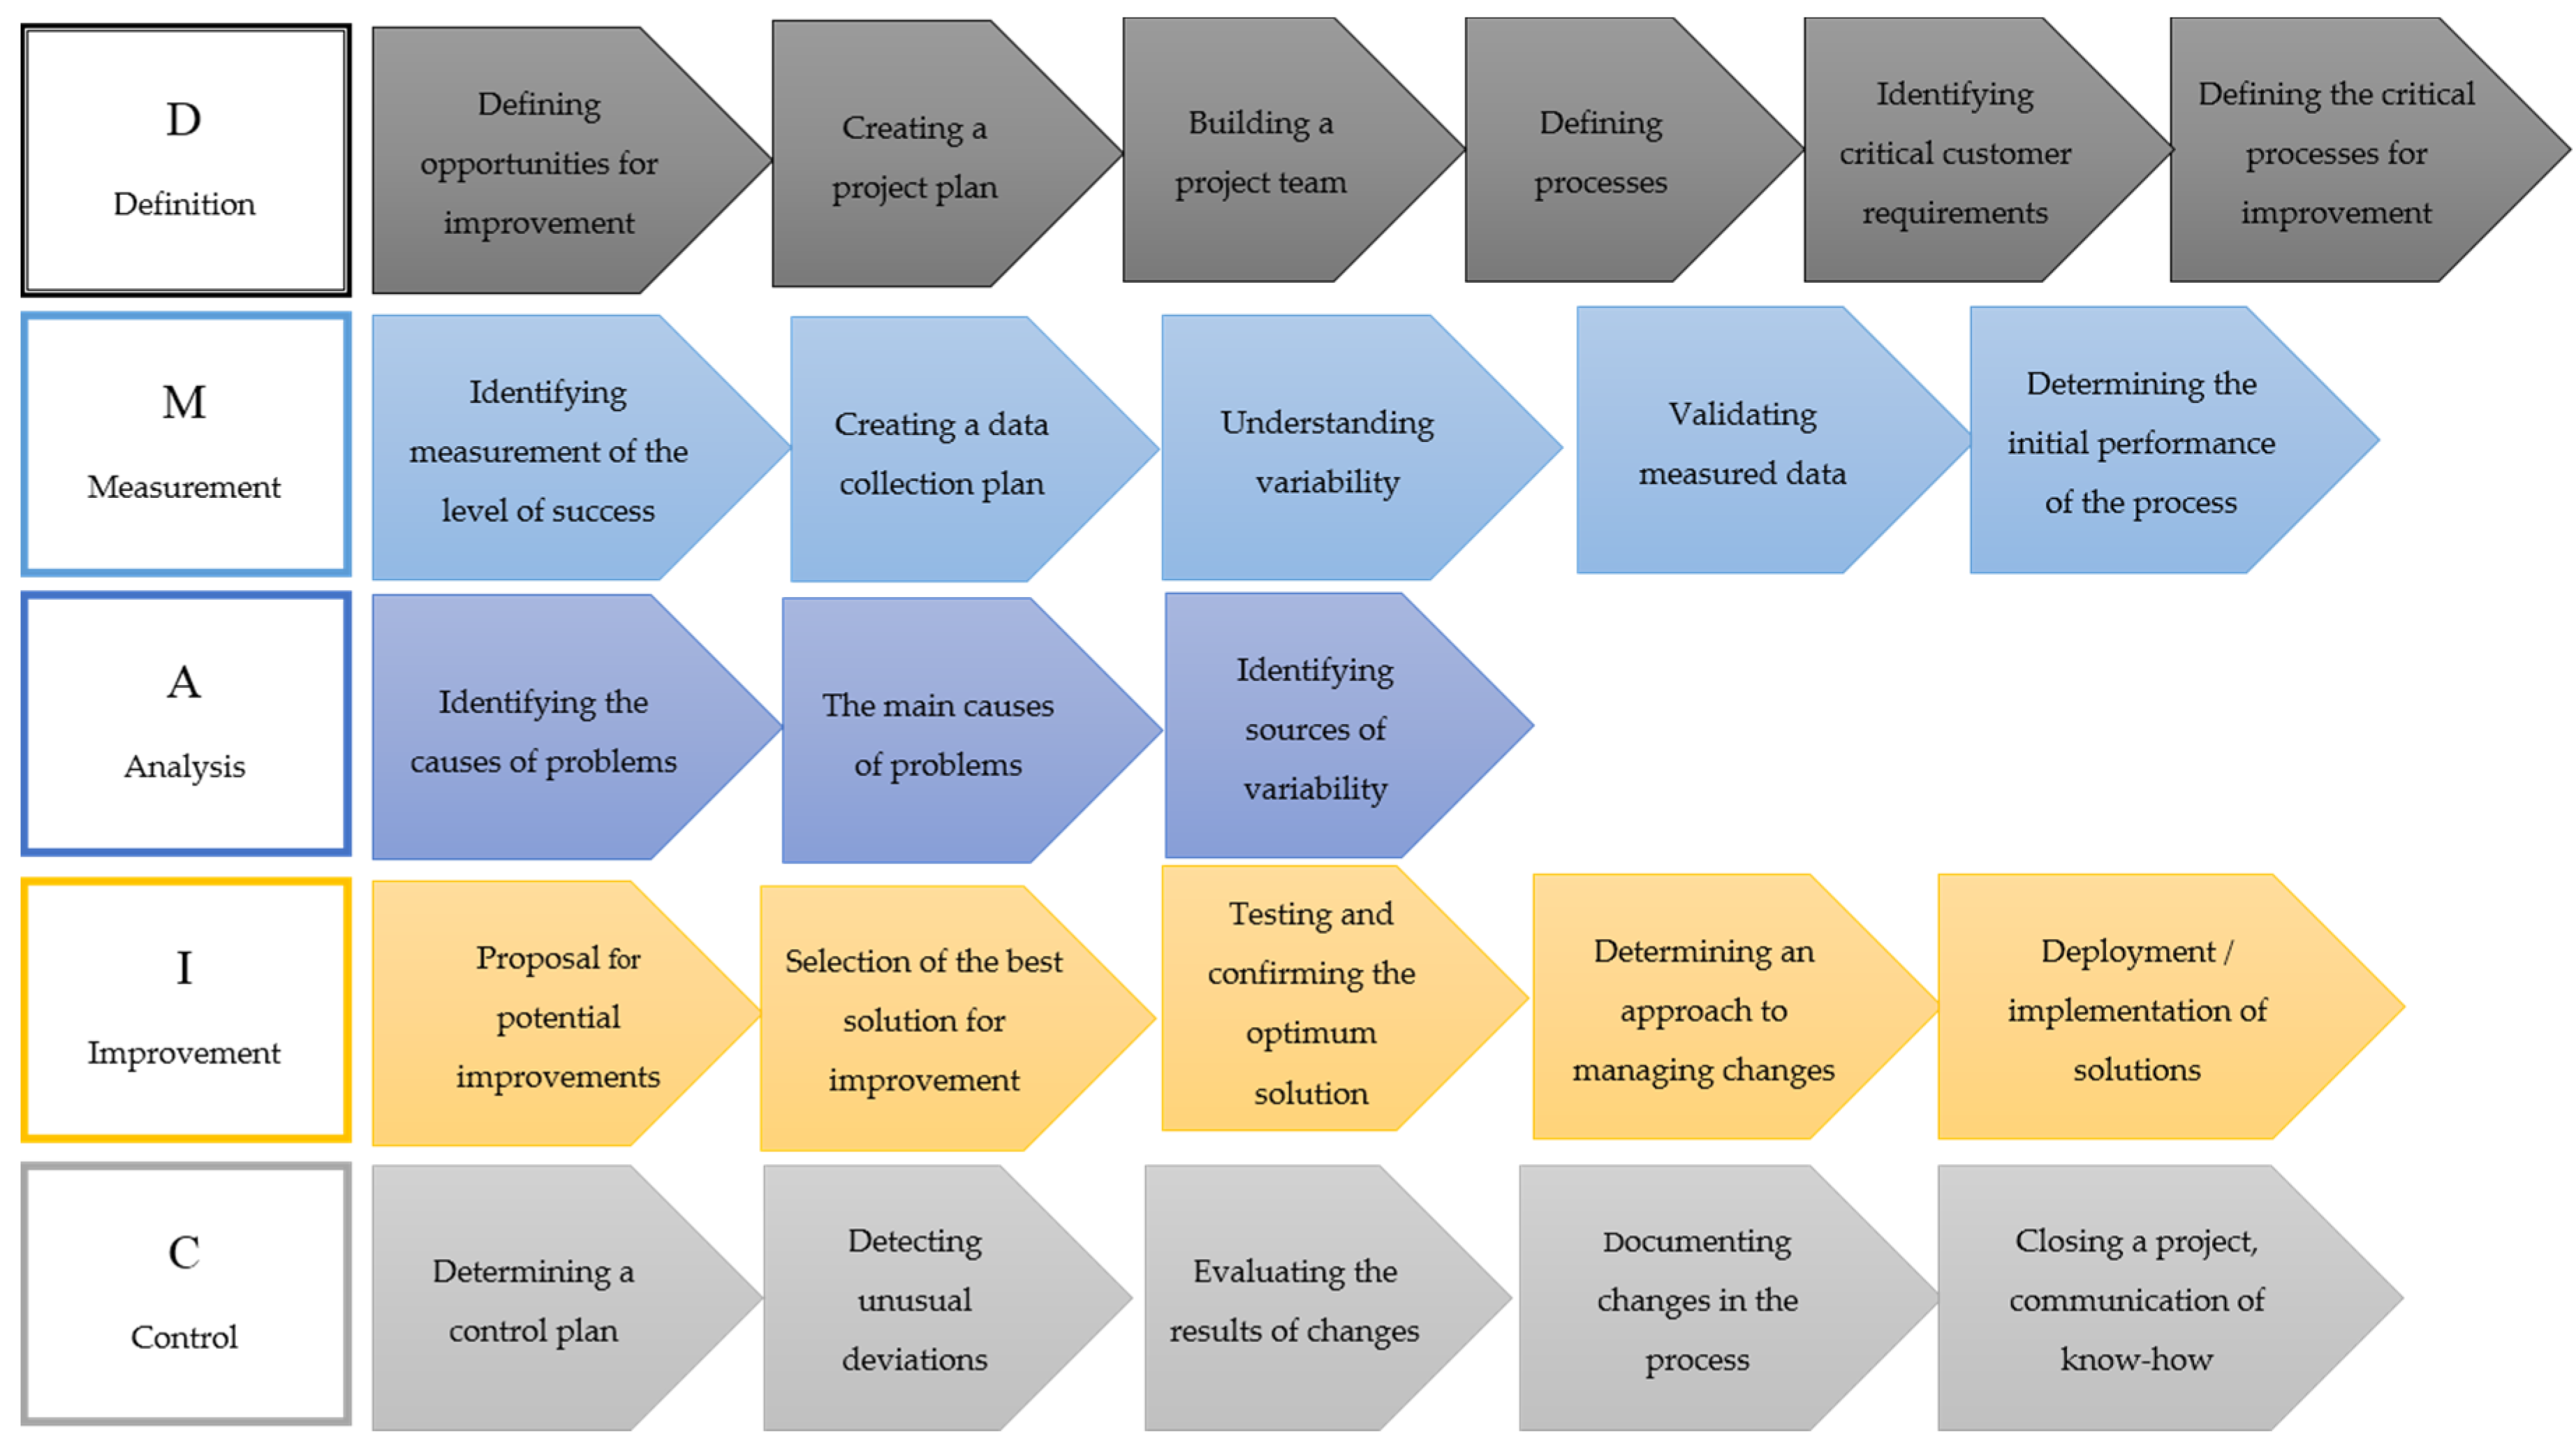
For the proposed elaboration on how to implement the Six Sigma methodology, the DMAIC phases were followed. In the respective phases of the DMAIC procedures, we carried out a selection of the methods and tools so that all members of the project team would be able to apply them and no special training or methods would be necessary for respective kind of production [
18]. The key components of the DMAIC cycle can be seen in
Figure 1.
In the Definition phase it is necessary to identify the problem, the connection of the process with the requirements of the customer, form a project team and define goal and target level of critical characteristics of the process quality.
A critical process and a specific problem in the process were identified by the defect analysis in the process. Defects were divided into material and technological. The DPMO value, the process efficiency as a total output revenue, and a level of Six Sigma were calculated.
DPMO (Defects Per Million Opportunities) denominates the number of defects that occur per one million opportunities at the development or manufacturing of a product and can be calculated according to the following formula:
PPM (Parts Per Million) denominates defects rate, i.e., the numerically-identified number of defects, and those that really occurred, after manufacturing. Defects rate (PPM) is expressed by complementary quantity, thus, by the proportion of units without defects to the value one.
OFD (Opportunities For Defects) is a probability of defects of one unit, which describes how many places defects can occur.
Measurements of the defect frequency, according to the DPMO, and Sigma criteria can distinguish the level of the process in regard of the defect frequency at the output and identify critical, bottleneck points in the processes.
Subsequently, a critical process map, SIPOC, was elaborated (Suppliers-Inputs-Process-Outputs-Customers). SIPOC is a process map that helps understand and identify process boundaries and key processes to ensure focus only on the customer [
9].
The target of the defined critical process and the final level of Six Sigma was determined in the project charter proposal. The project charter contains an outline for the problem definition, project team, time duration, and project target.
The objective of the phase
Measurement is to gain relevant data about critical processes by measurement of the key process attributes so that the problem area could be defined. In this phase, potential sources for non–conformity in the process are identified. In the first phase, the quality index of the critical process was determined and a number of measurements were done to find out the capability of the process. The following methods were used:
- -
The measurement plan by Pande
et al. [
22]: five-phase methodology for measurement plan.
- -
Capability indexes C
p and C
pk: critical process capability evaluation in terms of keeping specified or expected limits and an average value (see [
4,
18,
37]).
- -
Histograms as a visual synthesis of frequency distribution and process variability.
Modules of descriptive statistics, industrial statistics, and Sigma process analysis were used for the calculations.
In the phase
Analysis, the attention is given to the data analysis and dependence verification of type cause and effect, process comprehension with the objective to find out the key problem causes. The following methods were used at the application in enterprises:
- -
Brainstorming: looking for causes of critical process incapability.
- -
Diagram of causes and effects—Ishikawa diagram: graphical visualization of coherence between the problem and causes or possible solutions.
- -
Method FMEA (Failure Mode and Effect Analysis): analysis of the occurrence of failures, possible causes and effects for the customer.
In the phase
Improvement, solutions to eliminate problem causes are proposed, carried out and verified. The applied methods:
- -
An action plan and diagram: solutions to eliminate the identified cause of failures and an improvement of the critical process.
- -
Repetitive measurement of the critical process and the calculation of process capability indexes.
In the final phase
Control, the results from the previous phases are evaluated, processes are continually followed and the process control is carried out so that any variation from the target value would be corrected before the effect of failure (non-conformity) occurs. The appropriate implementation of the changes and improvements with the objective of the sustainable improved condition is controlled. The applied methods include:
- -
QFD method (Quality Function Deployment): customer requirements are deployed into the product characteristics and critical process outputs.
- -
Affinity diagram serves for identification of logical or causal connections between the problem elements [
13].
The applied procedure of the SSM in the companies was verified by the efficiency evaluation of Six Sigma in the companies with a different level of quality management. For that purpose, the hypothesis was tested: “Implementation of Six Sigma methodology would decrease the cost on claims and non-conformities by at least 10%”. Verification of the hypothesis was carried out through economic evaluation of the proposal based on the calculation of the cost of defects and through the calculation of DPMO, process efficiency, and Sigma level after the application of the model. We used the method of economic results comparison to compare the original and current situation of the critical processes.
3. Results and Discussion
3.1. Questionnaire Survey Results
This part presents the questionnaire survey results that show the rate of Six Sigma utilization in the enterprises in Slovakia structured according to the industrial branches, company sizes, and product types.
Cross-tabulation (
Table 1) depicts the absolute and relative frequency of the utilization of the Six Sigma method in individual groups divided according to the following factors: production type, the number of employees, implemented quality management system according to ISO 9001 standard, and the application of process management in the industrial branch.
The results show that only 10 enterprises out of 164, which is 6.1%, utilize Six Sigma methodology at the process management level since all those companies apply a process approach towards management. 40% of all companies utilizing the Six Sigma method belong to the automotive industry branch, whereby this industrial branch is one of the most productive within the Slovak market. The majority of the companies (60%) utilizing the Six Sigma method have a serial production. 90% of them employ more than 250 employees and have implemented ISO 9001 standards.
Table 2 and
Table 3 demonstrate the measured and expected frequencies in the respective groups to verify H1 hypothesis: there is a positive dependence between the application of Six Sigma and amount of the return on equity ROE.
The data were processed by Statistica 10 software (Prague, the Czech Republic), which created results of the Chi-square test presented in
Table 4. Based upon the data, we can state that the value
p is lower than the level α = 0.05; therefore, we decline the null hypothesis about the independence with 95% probability and accept the H1 hypothesis; thus:
“There is statistically relevant dependence between the application of Six Sigma and amount of the return on equity ROE”.Table 5 and
Table 6 present the measured and expected frequencies of the groups to verify H2 hypothesis: “There is a positive dependence between the application of Six Sigma and implemented quality management system according to the standards ISO 9001”.
For the calculation of the value p, Excel software was used, which uses formulas for the Pearson Chi-squared test. Test significance (value p) is on the level 0.002096317, which is lower than α = 0,05, and proves the statistic dependence of variables. The Chi-squared test can be applicable when all table cells are filled, at least 80% of the theoretical frequencies apply to and the remaining theoretical frequencies are . However, in this case, the conditions of good approximation were not kept and, at the same time, it is not possible to join the groups; therefore, it is necessary to complete the research with further data so that hypothesis H2 would be confirmed. It is not possible to confirm statistically relevant dependence among the searched variables. Nevertheless, the value p indicates a possibility to examine this dependence using a major sample of respondents. The cross-tabulations show that in 90% of the variables, Six Sigma is applied in those companies which have certified QMS according to the standards ISO; on the other hand, this shall not be a condition for Six Sigma utilization.
3.2. Results of Six Sigma Application in Real Conditions of Enterprises
Six Sigma methodology, according to the DMAIC phases, was applied in two enterprises dealing with furniture production with a different quality management system (QMS): a company with a certified QMS according to the ISO 9001:2008 standard (hereafter, the Company) and a firm without a certified QMS (hereafter, the Firm). The Company belongs among large companies with a series production and is a part of a multinational concern. The Firm belongs to smaller enterprises with the custom production of interior bespoke furniture.
The enterprises from the furniture industry were chosen from several reasons. According to the results of the primary research, no furniture company uses SSM, enterprises reach the lowest performance among analysed industrial branches, and most furniture companies are micro- and small-sized without certified quality management systems.
The specific features of furniture production process had to be considered by proposal of SSM implementation procedure. From the technologic-organizational view the process of furniture production is divided into two phases bounded by a buffer store. The buffer store has a control and organizational function. The first phase includes a production of particular furniture parts. Inputs of this phase representing primary inputs for the whole production process are wood-based panels, sawnwood, and decoration materials. Materials are divided to dimension timber, which are synchronized with forms of parts. The next step is a form and construction treatment involving pressing, sanding, and milling. The last step of the first phase is a surface preparation. The second phase of production process is represented by joint of two groups of operations: surface finishing and furniture assembly. The basic model of production can have more variants in dependency on type of production input materials, technology, and product.
Having analyzed the input conditions in the enterprise and the options of usage of individual methods, the results of the applications were as follows:
3.2.1. Phase D—DEFINE
The critical process was identified by the defect analysis in the production process. The calculations of DPMO, process efficiency, and a sigma level were applied. The defects which appeared in the processes were divided into material and technology defects.
The worst values in the Company occurred in the process of pressing which was identified as critical. The efficiency of the pressing process range from 81.0165519% to 92.7540334% and the sigma level moves from 2.38 to 2.96 which means the process is not stable. The average values are given in
Table 7. The defects in the pressing process were caused mostly during glue application representing 70.84% from the total defect number.
The worst values in the Company’s parameters occurred in the process of sanding. According to DPMO 197,629.13 defects per million opportunities resulted, with the output value of the sanding process expressed as the average value of efficiency was 80.23% and achieved the average sigma value of 2.36. The average values are given in
Table 8. The most numerous group of defects at sanding were material faults, which occurred before the procedure of primer varnish coating and represented 71.5% out of the total number of defects.
Next SIPOC diagrams of the critical process were created for the process of pressing in the Company, and for the process of sanding in the Firm. Lastly, the proposal of the project charter was formulated. The selection of the project was based on the requirements of the enterprises to stabilize and improve the process which is the most defective and where the enterprise can save at least 10% of costs on defective products. The primary aim of the projects in both enterprises was to state the decrease on the defective products. The basic information from the project charter for the Company for the critical process of pressing, and for the Firm for the critical process of sanding, are stated in
Table 9.
3.2.2. Phase M—MEASURE
In the phase of measuring, the quality measure was defined in the due critical process and series of measurements (12 series by 10 measurements) was carried out. Variability of critical processes via capability index calculations was found out by measuring the defined quality measure.
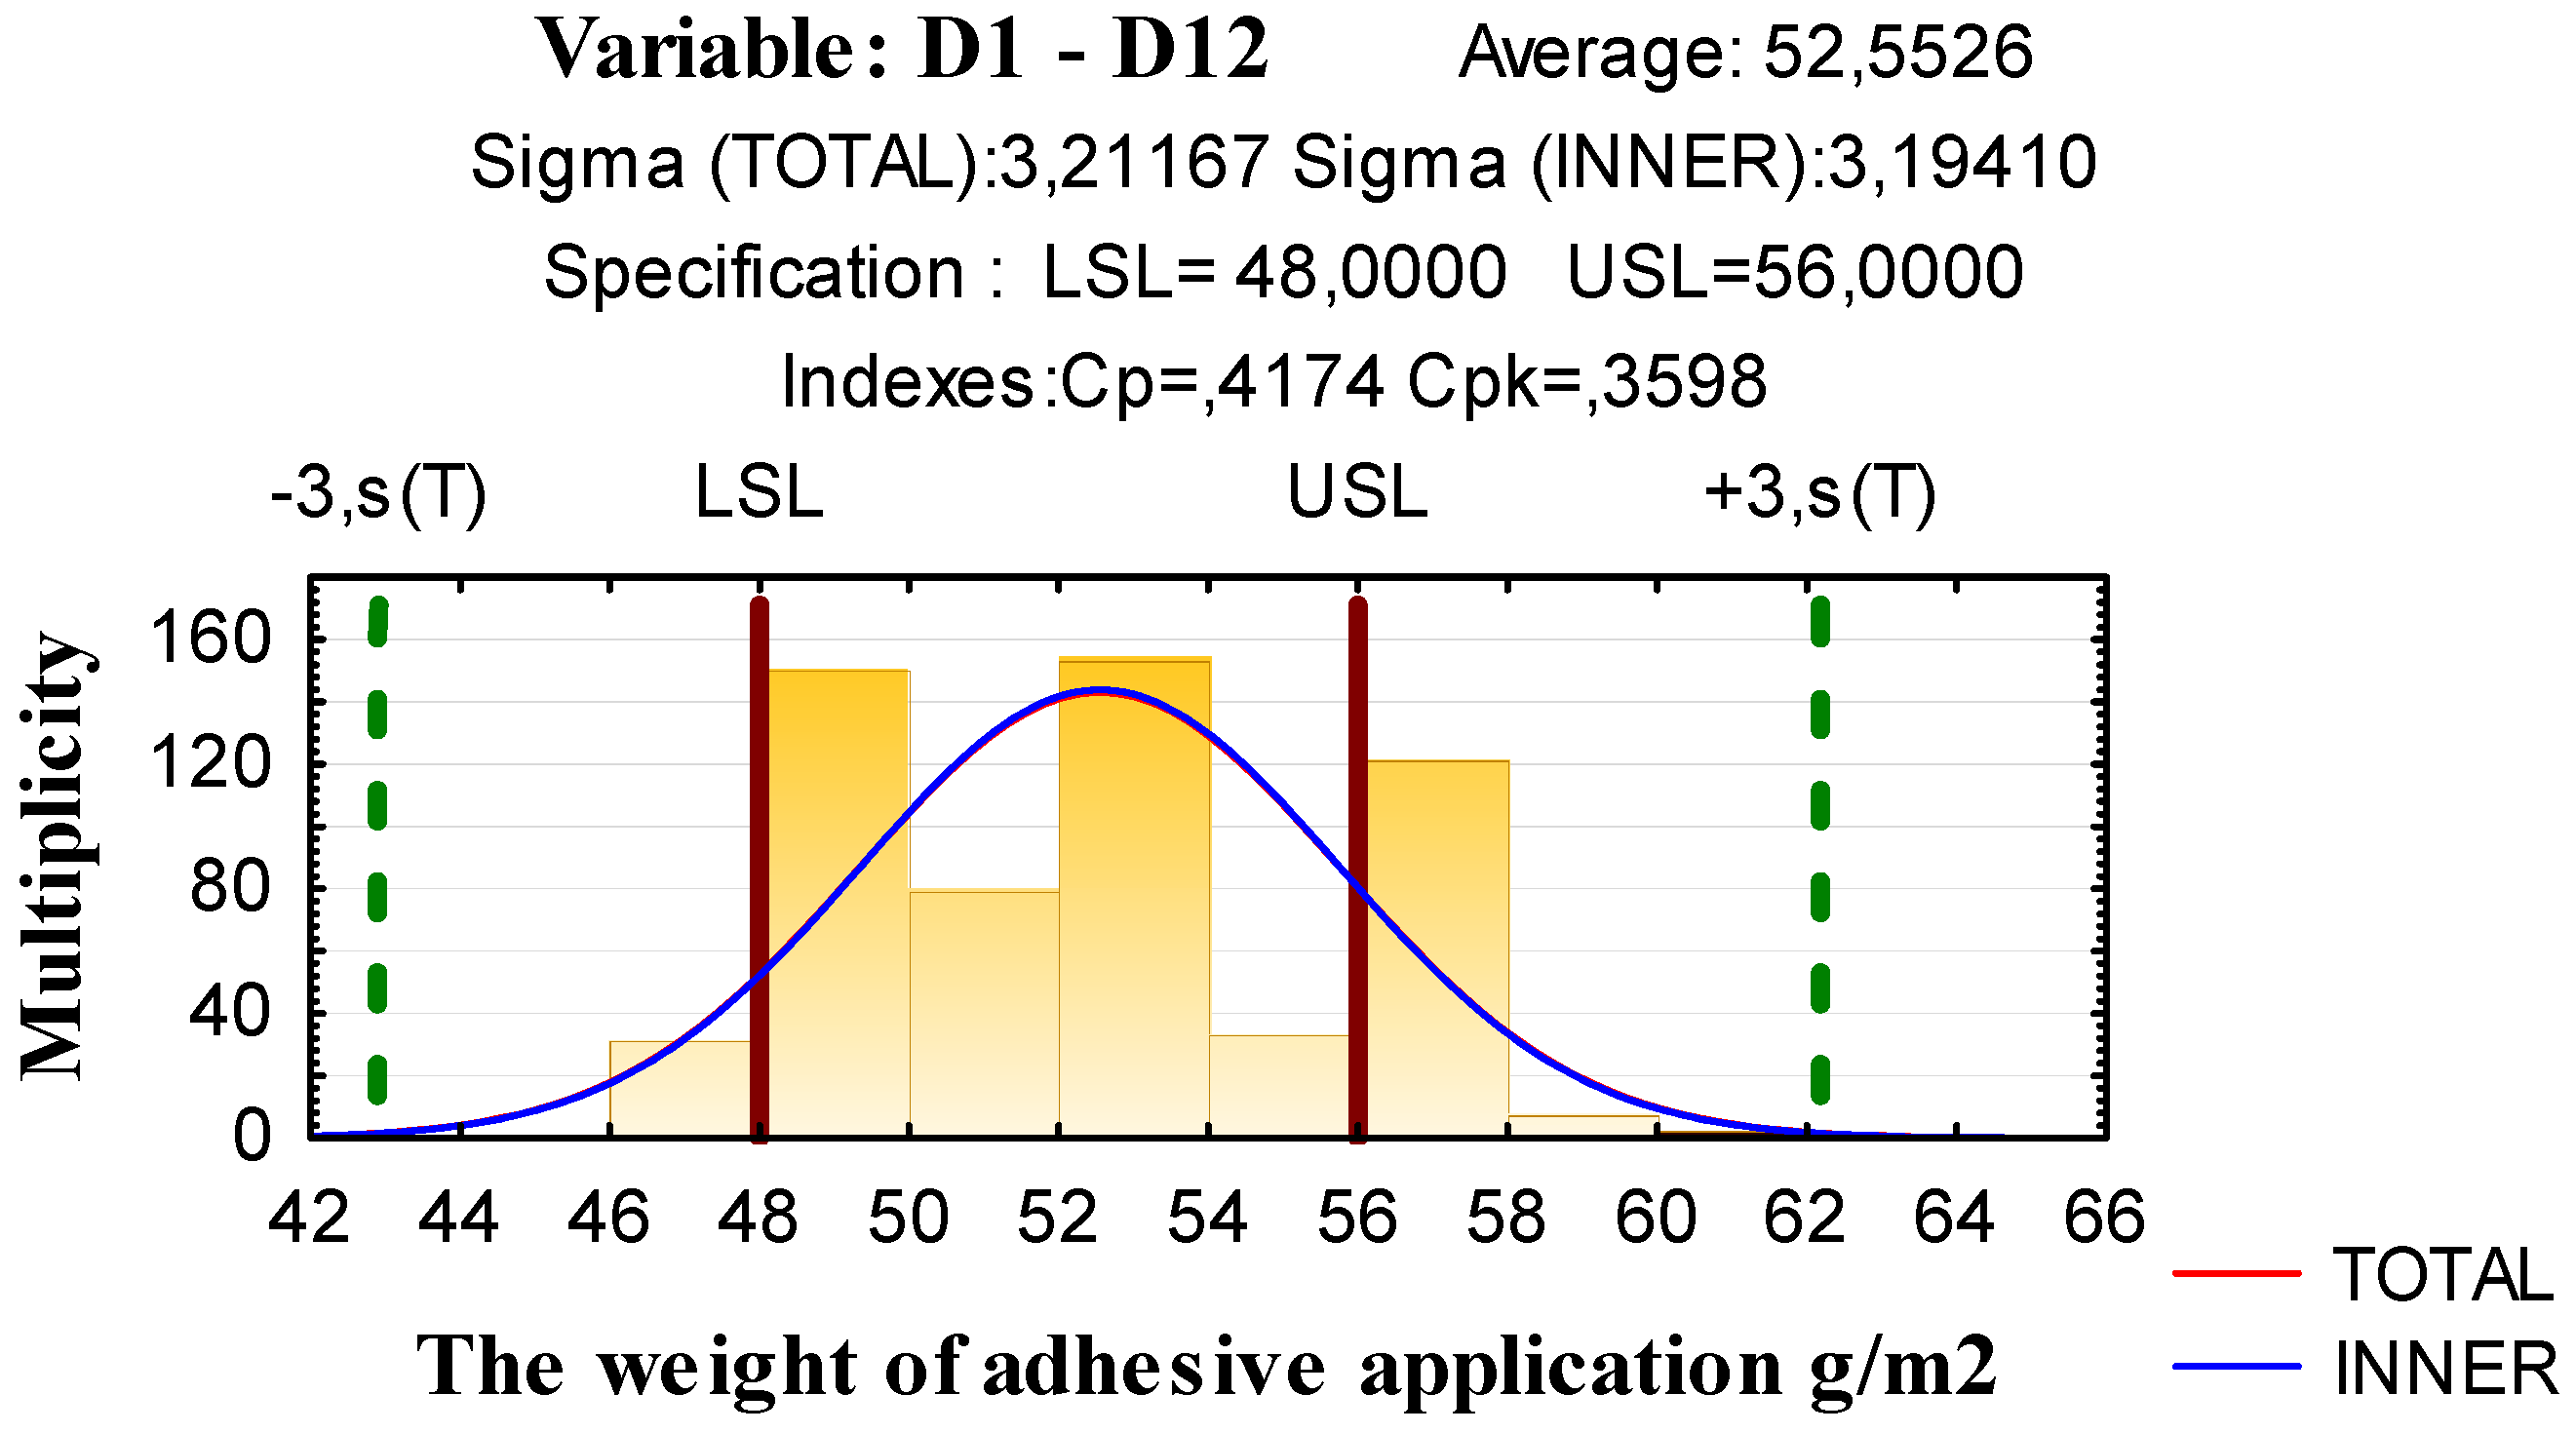
In the Company, in the operation of gluing within the critical process of pressing, the weight of a glue layer on one side of a part in grams was, consequently, calculated to g/m
2 was defined as the quality measure. Measured values of weights of glue coating were used to state the process variability by calculation of capability index C
p and capability index C
pk, where the upper standard level (USL) of the weight of the glue coating was defined as 56 g/m
2 and the lower standard level (LSL) of the weight of the glue coating as 48 g/m
2.
Figure 2 shows the distribution of interval frequency of weights of glue coatings in the sets of measurements D1 to D12 which shows heterogeneity signs. The values of weights exceeded the upper standard level of 56 g/ m
2 in 120 cases in the interval of 56–58 g/m
2. The excess of the lower standard level occurred in 28 cases.
The comb distribution points out that process variability is high and is not caused by a natural fluctuation of variability in the process. The values of the capability indexes are also low; the overall coefficient Cp = 0.4174 and the overall coefficient Cpk = 0.3598. Both coefficients are less than 1. Therefore, and also based on total results, we can state that this production process is not capable.
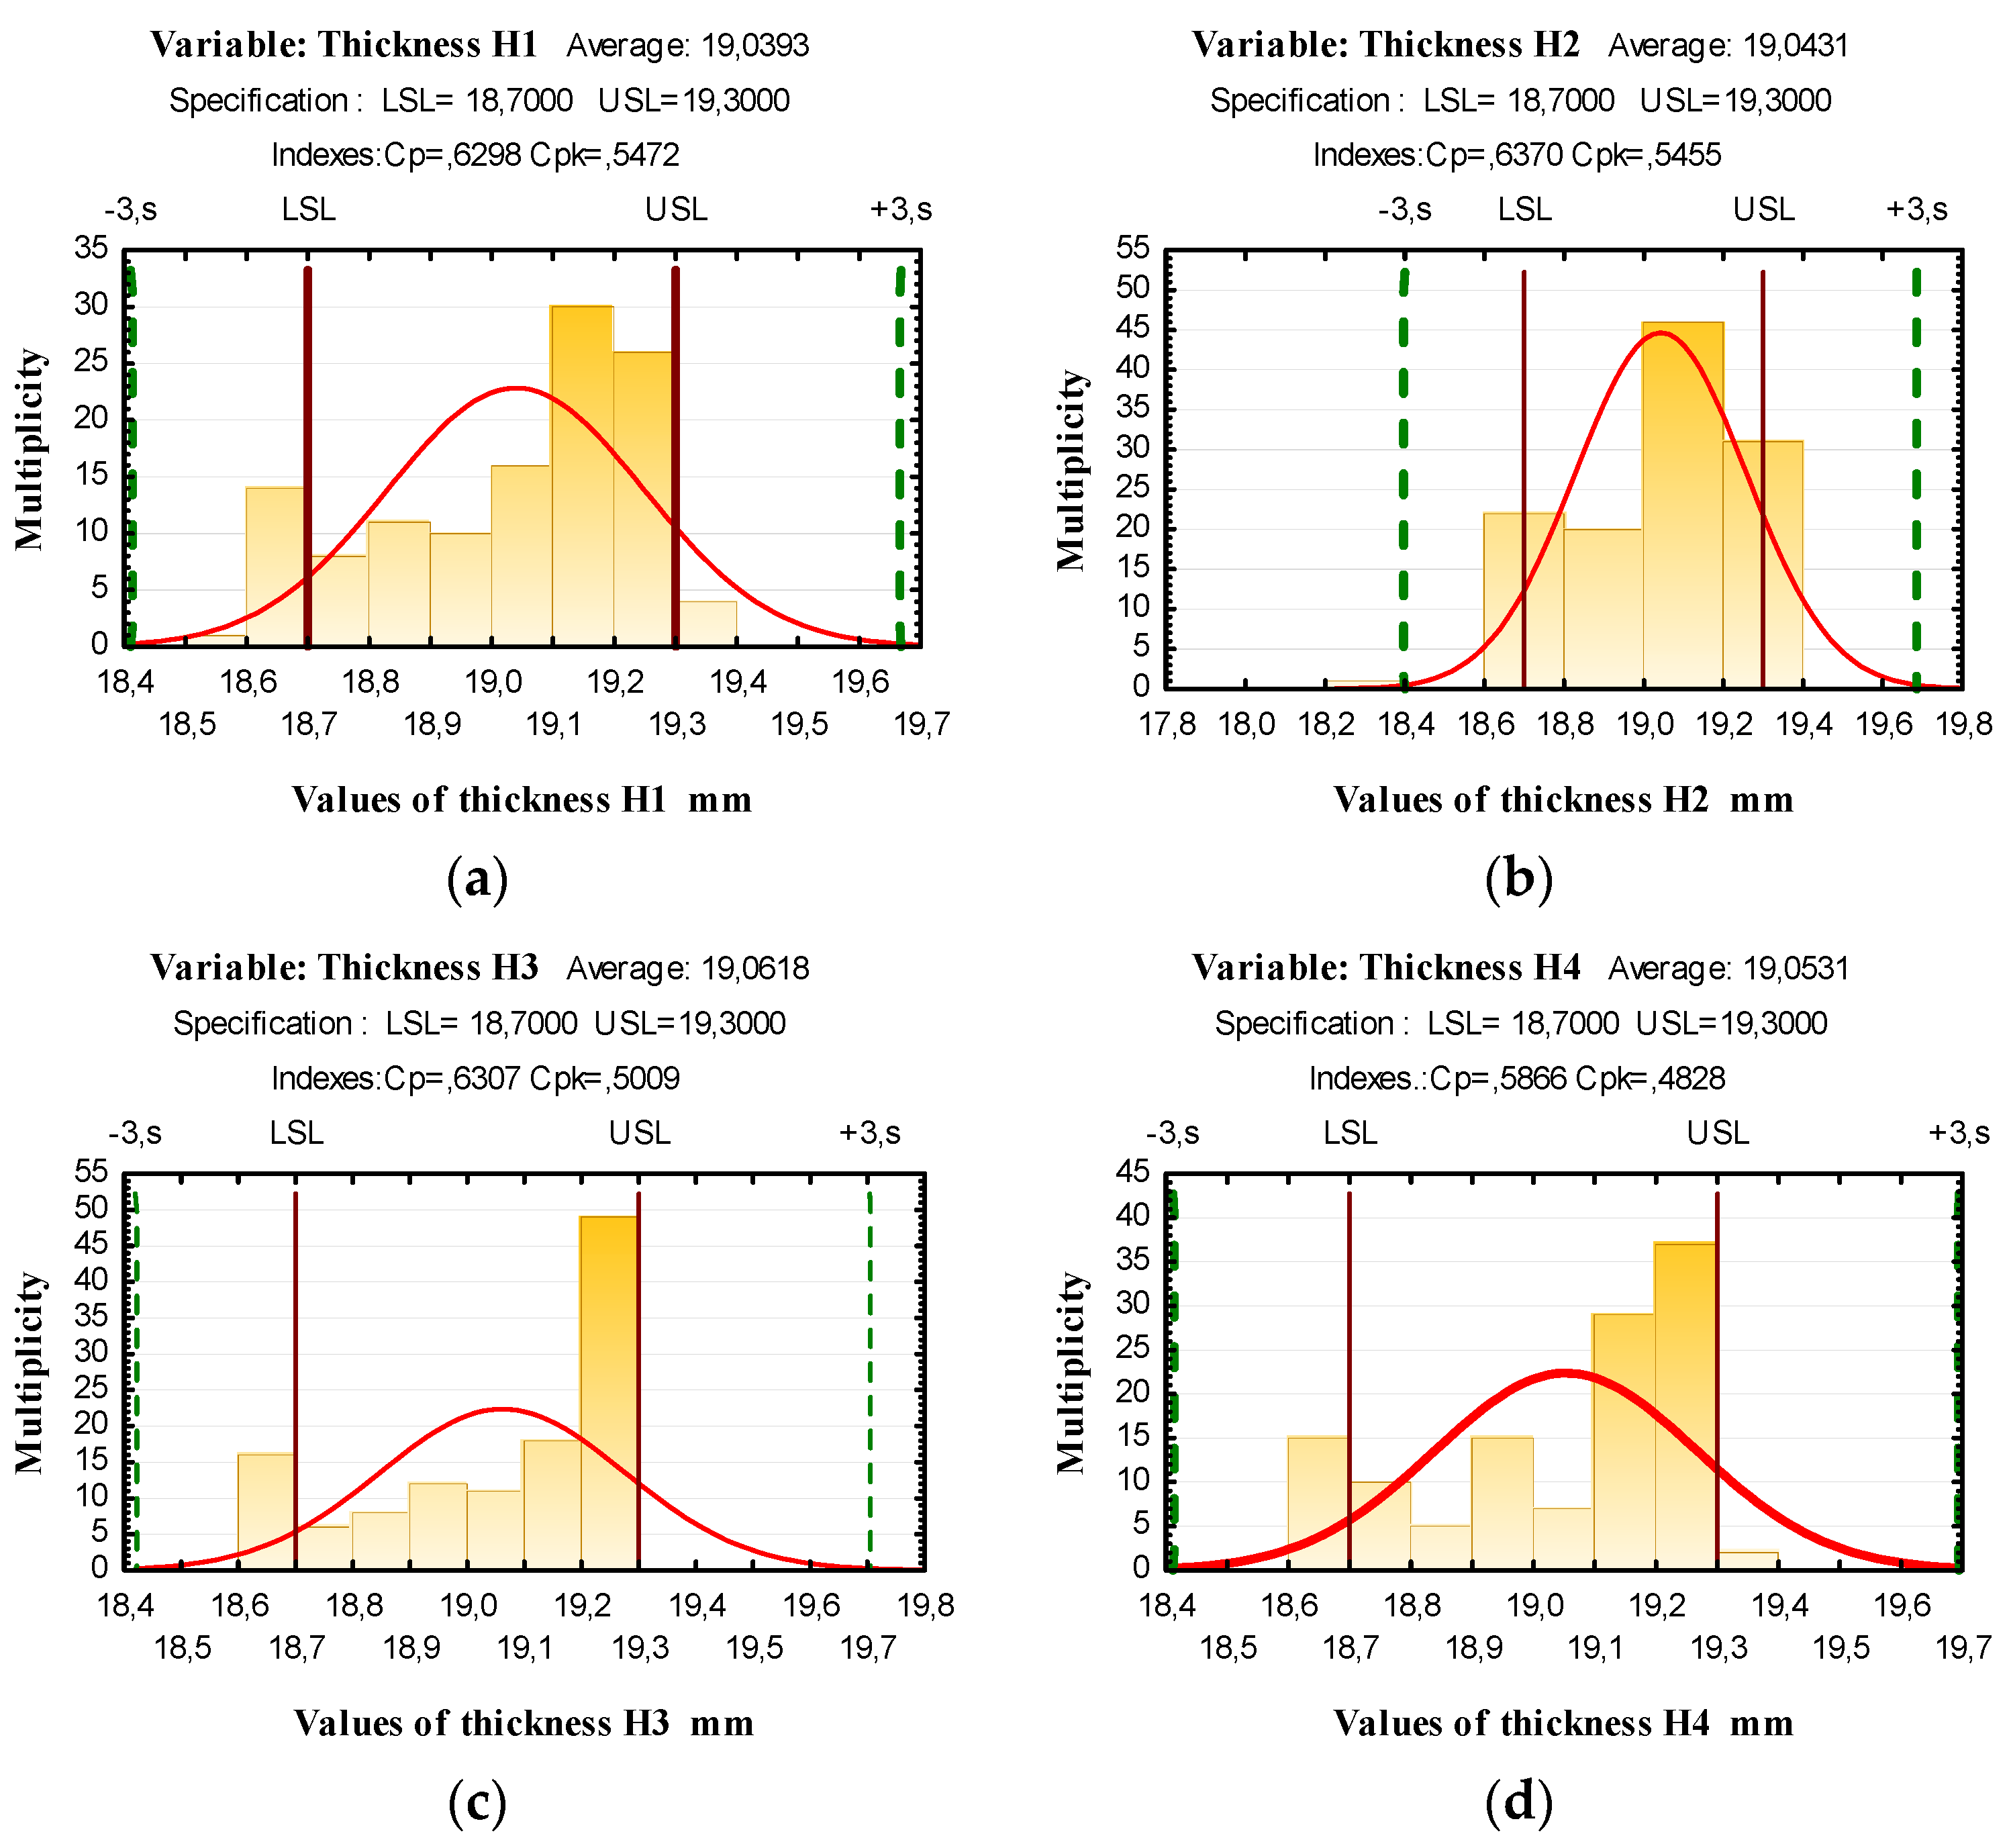
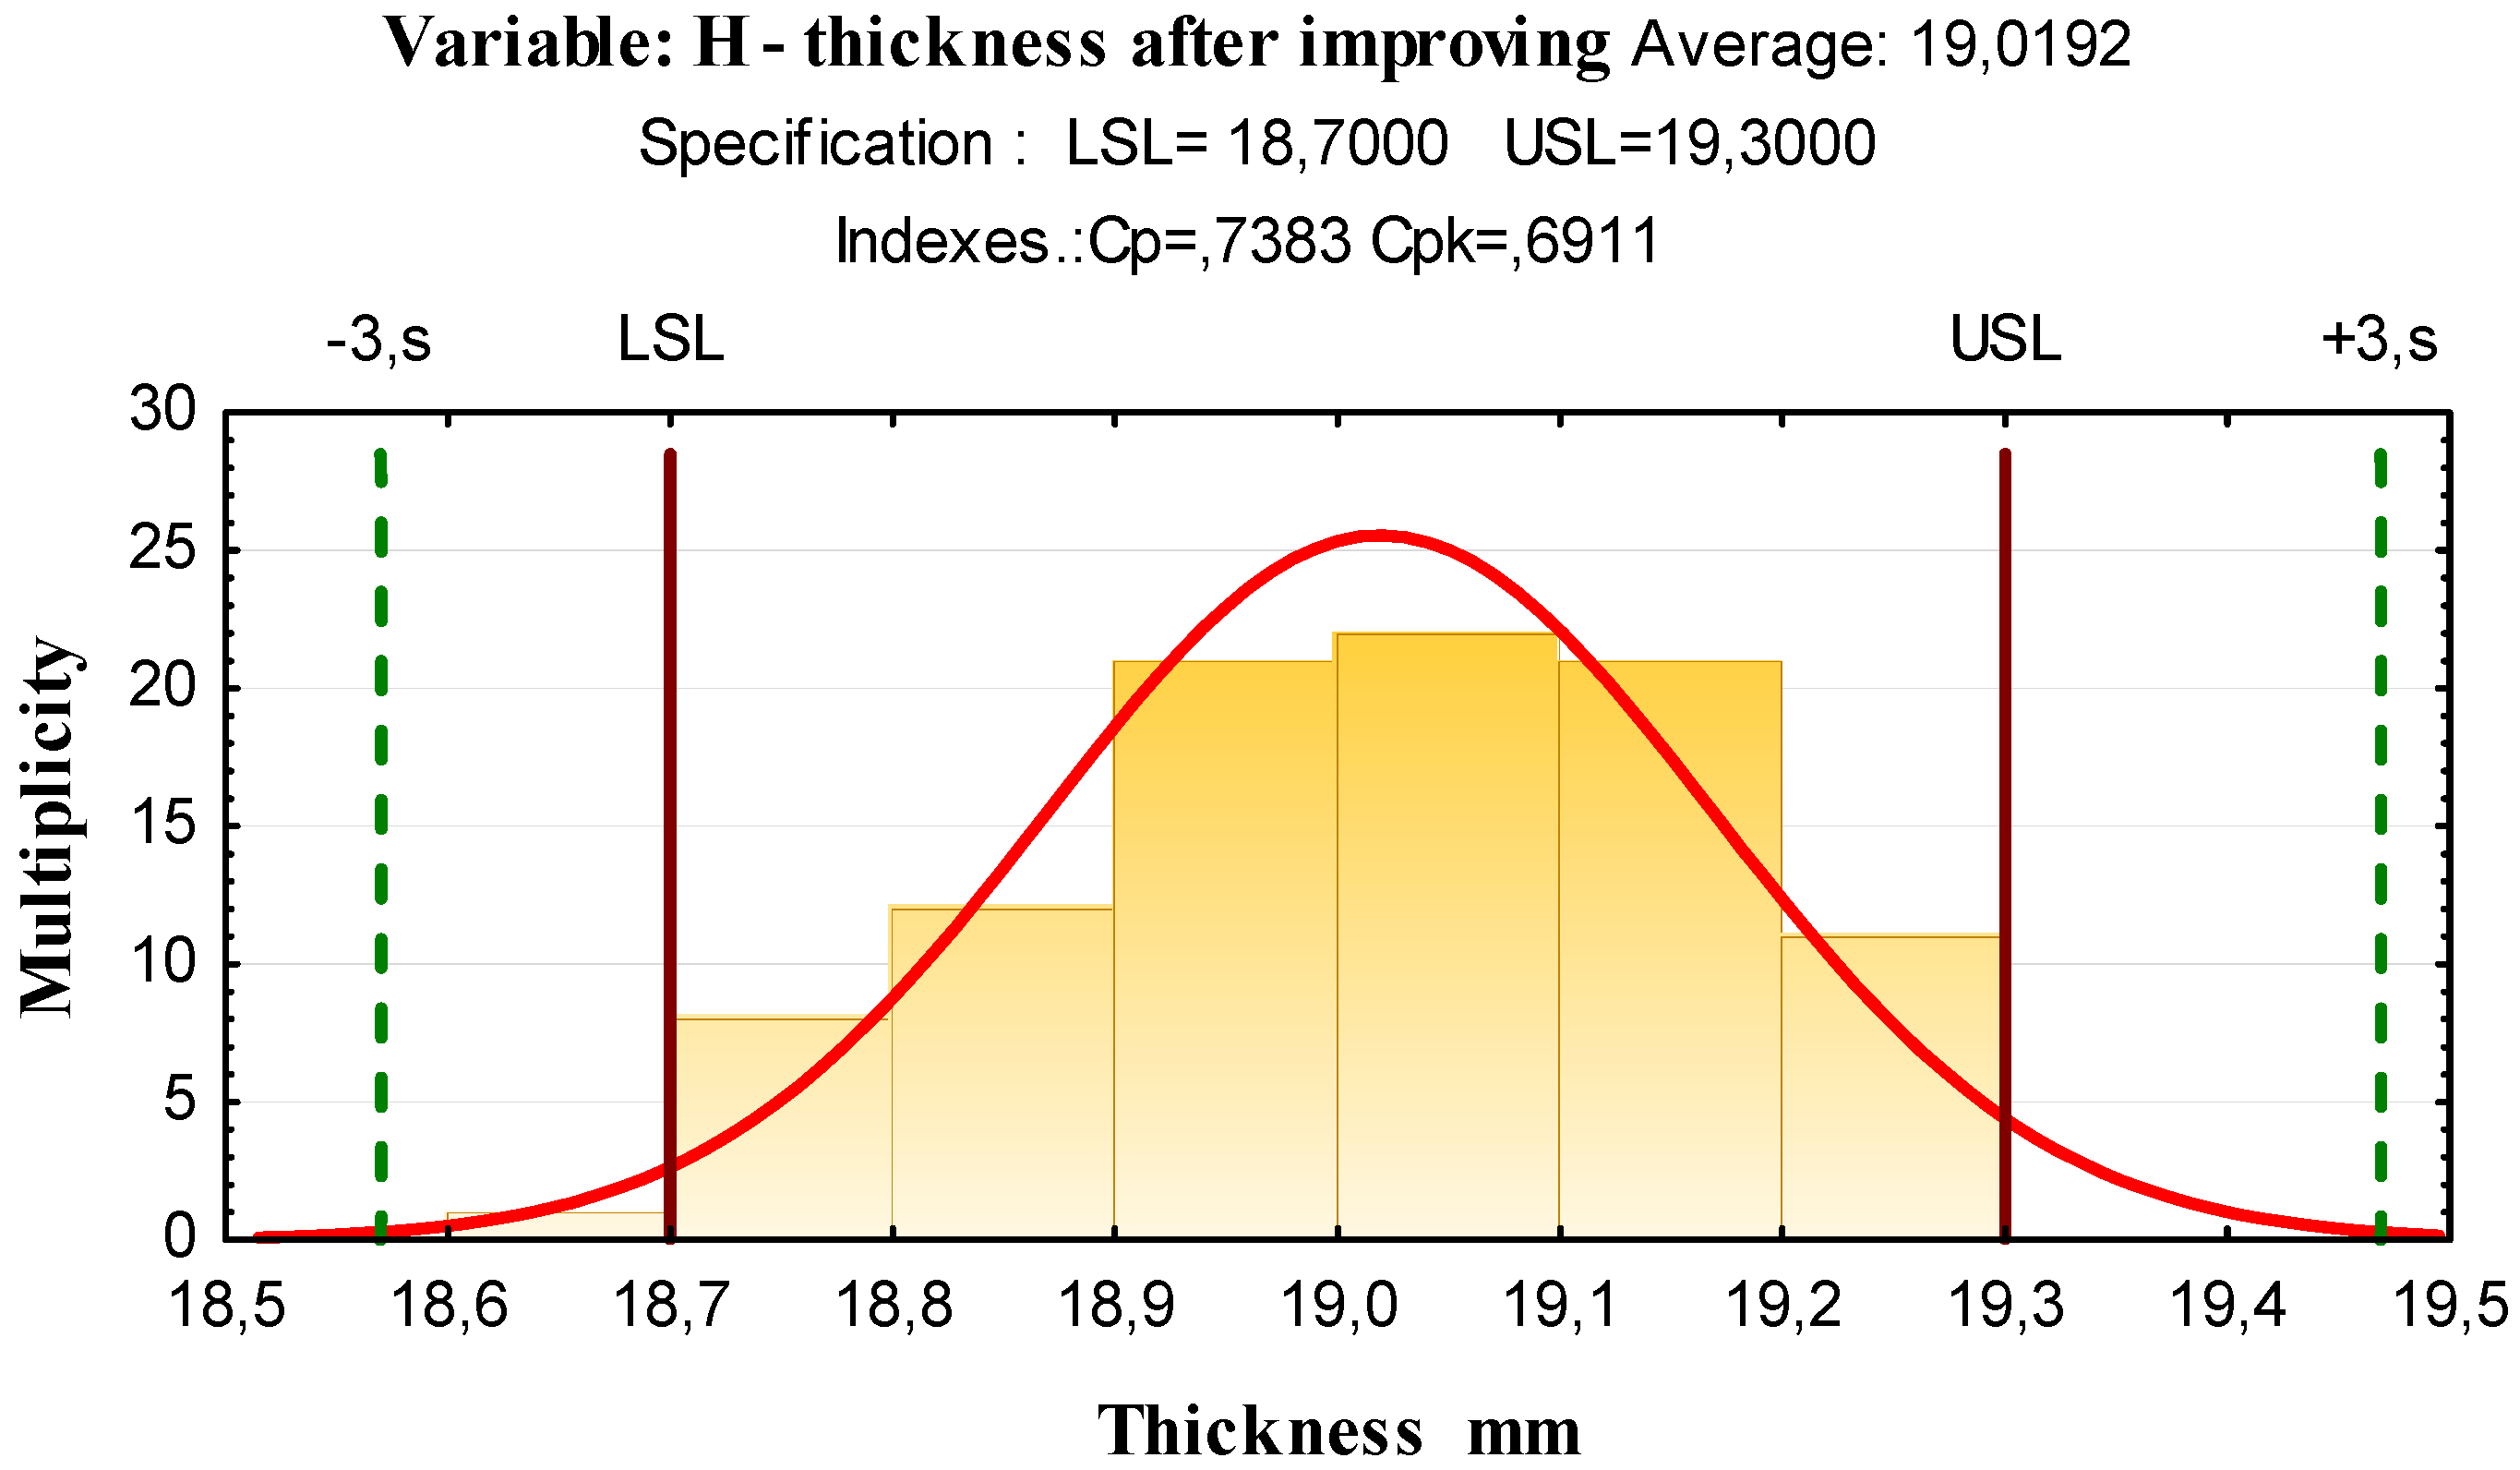
In the Firm, in the critical process of sanding, a thickness of a part was stated as a quality measure. Measured values of furniture parts thicknesses were used for calculations of capability index C
p and capability index C
pk, where the upper standard level was defined as 19.3 mm and the lower standard level was as 18.7 mm. As it can be seen in
Figure 3, distribution of the interval frequency of part thicknesses are rather variable.
As it can be seen in
Figure 3, the shapes are asymmetrical, with comb ones which suggest that variability in the process is quite high. Another factor supporting the concept of high variability are the values of capability coefficients C
p, which ranged from 0.5866 to 0.6370. The values of capability coefficient Cpk ranged from 0.4828 to 0.5472. Both coefficients in individual measurements accounted for values less than 1. Therefore, we can state that the production process is not capable.
3.2.3. Phase A—ANALYZE
Based on the data gained by measurements, we focused on identification of the main problem, sorting the possible causes, and identification of non-conformity causes which imposed the variability of the critical process. This was used for brainstorming a method and, consequently, creating an Ishikawa diagram. The first stage of possible cause occurrence was divided into five categories in both enterprises: input materials, work conditions, operation equipment, employees, and technological conditions.
In the Company, in the process of pressing—gluing, these causes of high process variability were identified:
- -
Non-working control of technical parameters of the glue, such as temperature and viscosity, which have the primary effect on the weight of glue coating on the parts of chipboard.
- -
Failures in compliance with technological discipline by the operator of the gluing machine, mainly during the adjustment of glue thickness.
In the Firm, in the process of sanding, the following causes of incapability of the process were recognized:
- -
Insufficient input control of technical parameters of input materials of chipboard during the delivery.
- -
Incorrect choice of sandpaper grit.
- -
Insufficient clean-up of the production facility.
- -
Lack of attention during taking over the information from order schedules.
3.2.4. Phase I—IMPROVE and Phase C—CONTROL
To eliminate the causes of a non-conformity occurrence, a so-called “reaction plan”, which was also depicted as a regulation diagram, was designed.
In the Company for the process of pressing—gluing, the reaction plan contains a graphic illustration of the placement of values of glue coat weights in the individual phases of the regulation diagram and adjustment, measurement, control, and the relegation of information for an operational procedure.
In the Firm, the reaction plan focused on improvement of the sanding process. It contains the span of setting and technological interval 19 ± 2 mm, a graphic illustration of the placement of measured data, simple description of duties for the personnel at the control and service of the production facility.
Based on the instructions stated in the reaction plan, the repeated measurements were carried out to verify the measures designed to decrease non-conformity.
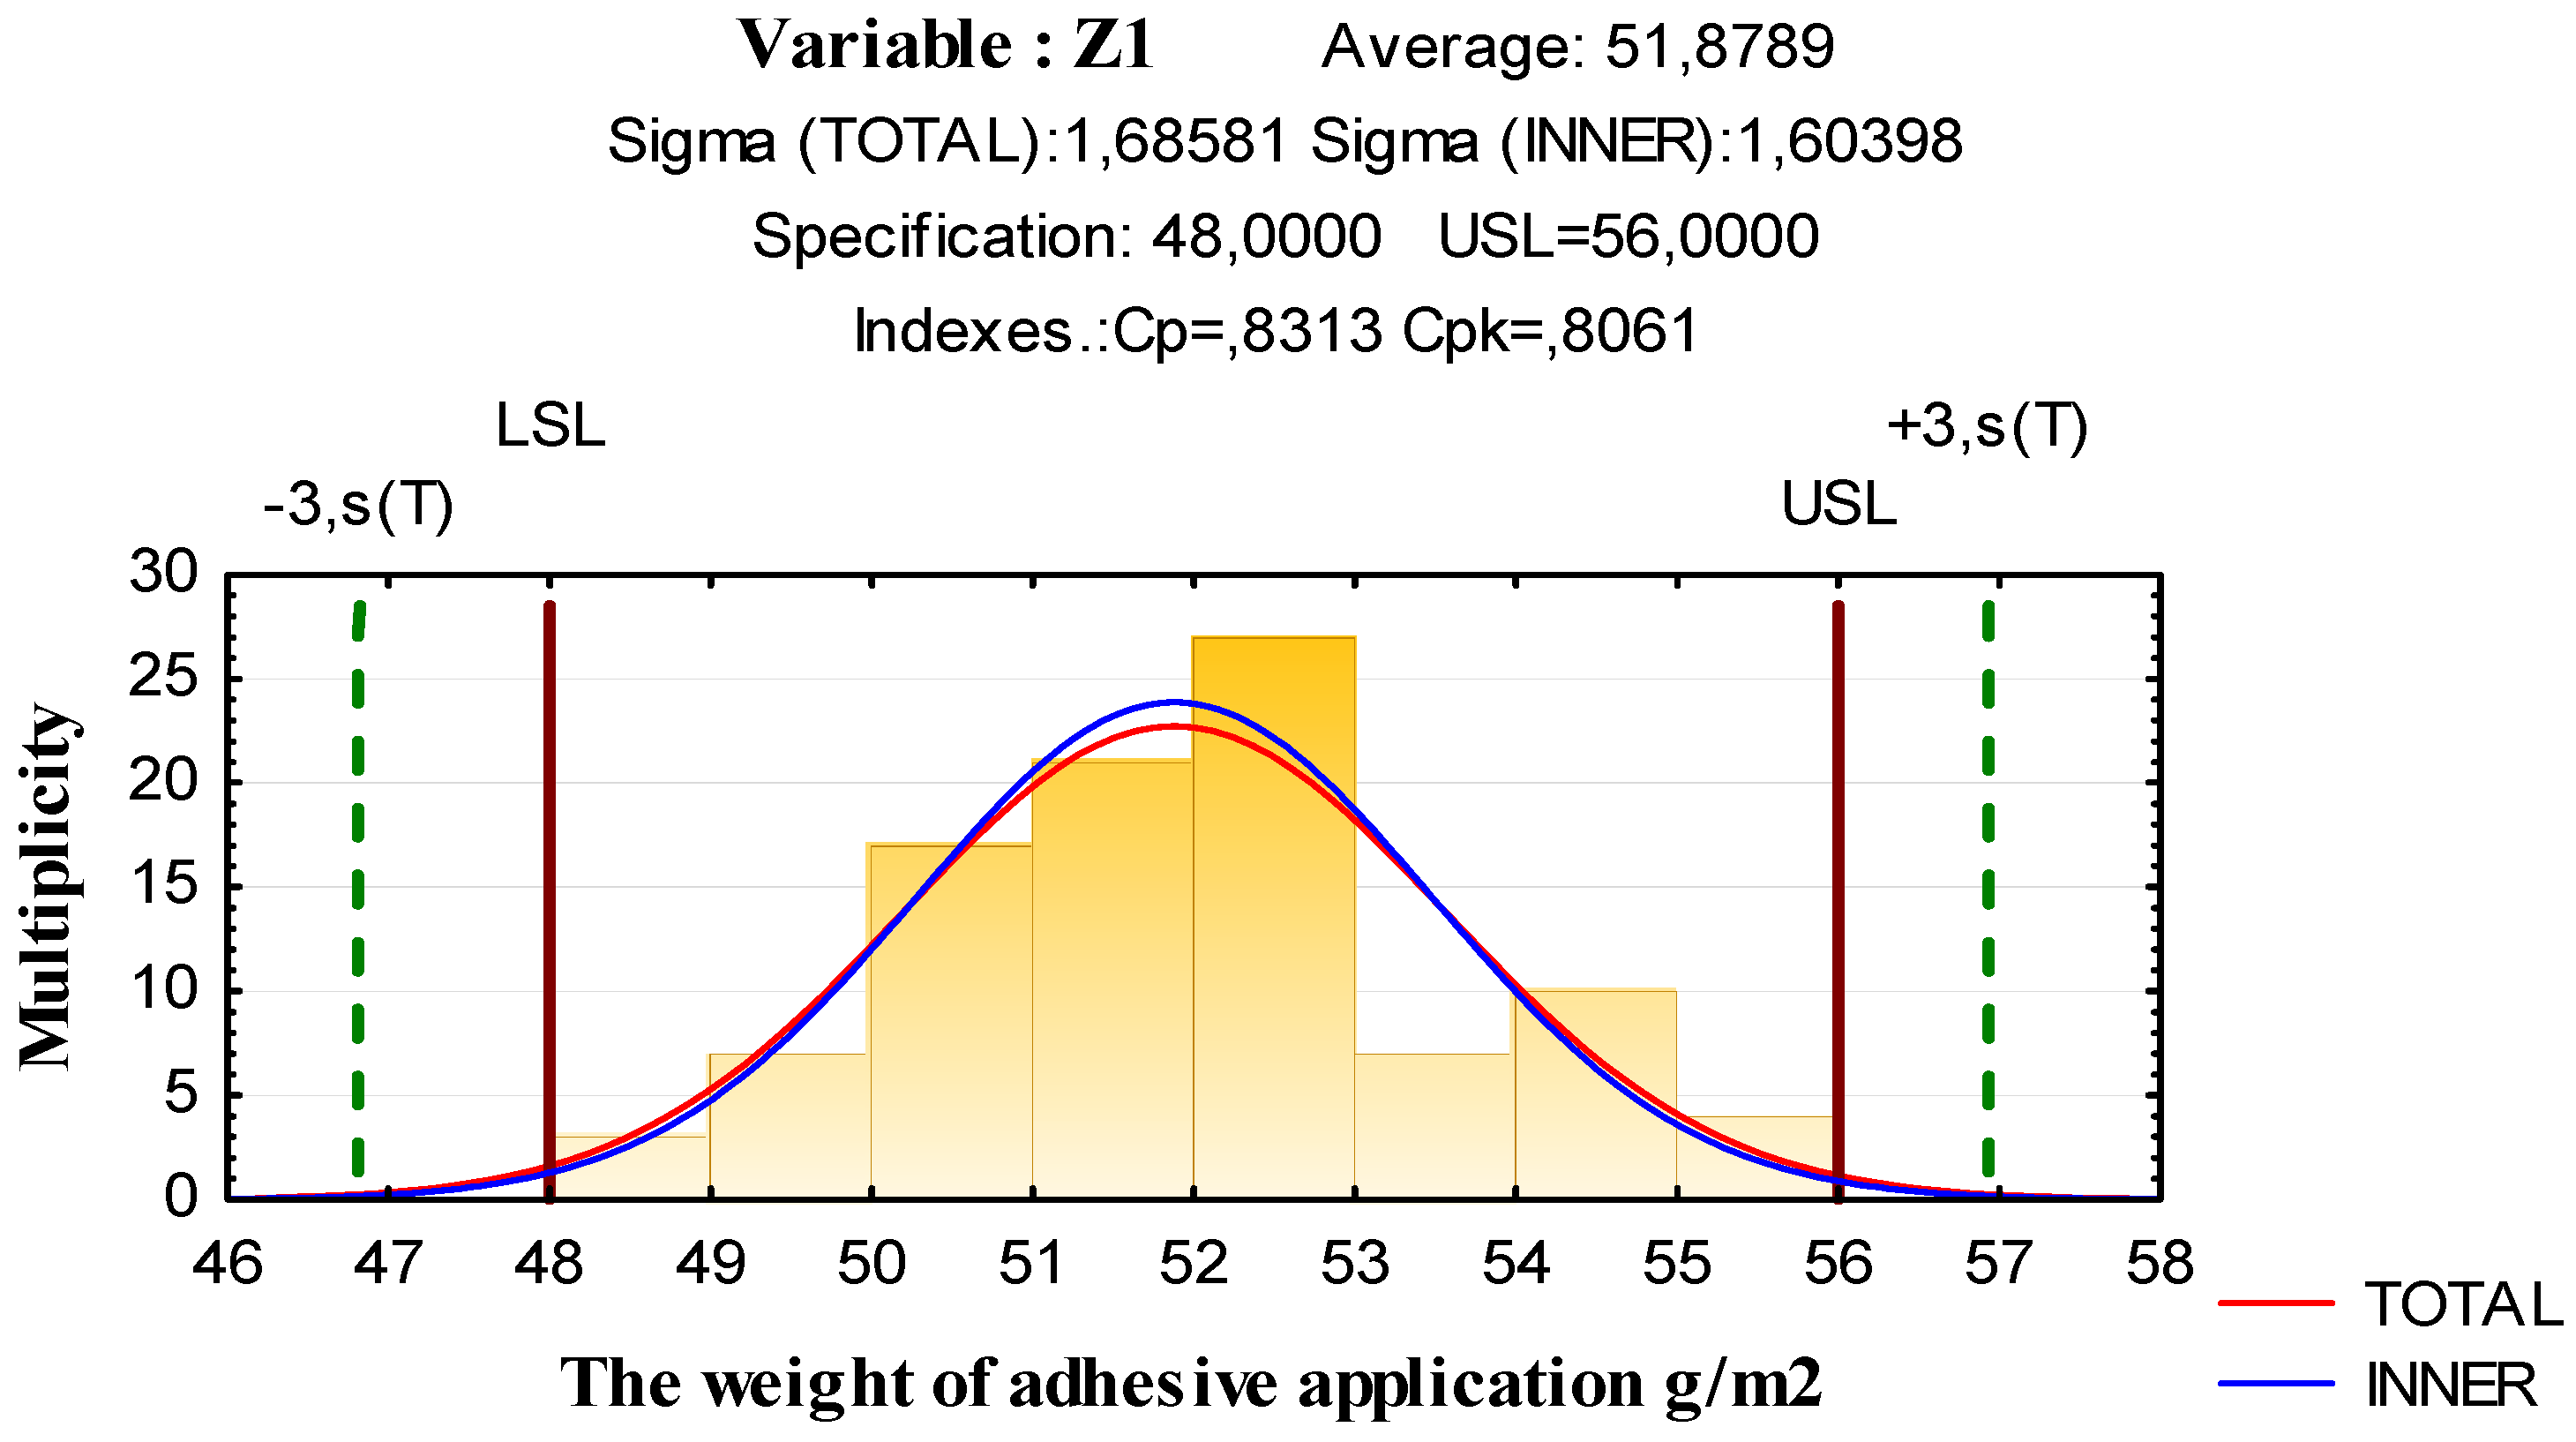
In the Company, the measurement focused on the weight of glue coating as the main cause of the high variability of the process of pressing. The asymmetric histogram in
Figure 4 shows that variability of the process compared to the original measurements decreased after corrective measures had been carried out. The values of capability coefficients increased, which is well-proven by the increase of the variability coefficient Cp from 0.4174 to 0.8313, and the value of coefficient Cpk increased from 0.3598 to 0.8061. After the reaction plan had been introduced, no excesses of upper and lower standard levels occurred.
In the Firm, verification of the solution design was carried out by the measurement of 24 parts of veneered chipboard in the 96 valid measurements in the process of sanding. The results of the measurements are shown in
Figure 5. The truncated shape of the histogram in
Figure 5 proves that variability of the process of sanding, compared to original measurements, decreased after the corrective measures were carried out. The values of capability coefficients increased, represented by the increase of C
p from the lowest value of 0.5866 to 0.7383 and the value of C
pk increasing from 0.48288 to 0.6911. Evident improvement of the process occurred in compliance with standard levels after the introduction of the reaction plan into the process of sanding. In check measurements, the upper and lower standard levels were not exceeded.
In the Control phase, the particular corrective measures to improve variability in the identified critical processes were recommended based on the achieved results. The QFD method was suggested and implemented in the Company. The matrix diagram was created by transforming customer´s requirements in the specification of the product—a cupboard/cabinet. In the Firm, the proposal of measures to sustain the permanent quality of processes was presented via an affinity diagram.
3.3. Impacts of Implementation of Six Sigma Methodology in Enterprises
Verification of the hypothesis which assumes decreasing the costs on claims and non-conforming products by 10% via implementation of Six Sigma was performed by comparison of the original and the current state of the process, which were assessed as critical and by economic assessment of decreasing costs of non-conformity.
Basic data to perform an economic assessment of the design were the numbers of non-conforming products divided according to the kind of defects and the price of a part in € in the critical process before and after implementation of Six Sigma.
In the Company, as is obvious from
Table 10, we can see that total value of non-conforming products in the process decreased. It can be stated that after implementation of suggestions to improve quality by the Six Sigma methodology there was a decrease in the costs by 12.97%, which met the aim outlined by the project charter.
An improvement can be also seen in the DPMO categories, which also decreased and the value of effectiveness increased. The sigma value increased from 2.75 to 2.95. The sigma level was set to increase from 2.75 to 2.85 in the aims of the project charter. The overview of the original and current DPMO, efficiency, and sigma levels is presented in
Table 11. On the basis of the mentioned analysis, we can declare that the charter aim for the critical process of pressing was fully met. Based on the above-mentioned results of the analyses in the process of pressing in the Company with a certified system of quality management, the hypothesis can be confirmed.
In the Firm, the number of non-conforming products was counted before and after the implementation of improvement proposals by the price of a part in € after sanding, before the primer coat. As we can see in
Table 12, there was a decrease in the total value of non-conforming products, representing 8.25% of the total value of non-conforming products in the process of sanding caused by faults in sanding before the primer coat. The aim set in the project charter was not achieved.
Table 13 gives the overview of the original and current DPMO values, the value of effectiveness, and sigma levels in the process of sanding in the Firm. The improvement appeared in the values of DPMO categories, effectiveness, and the sigma level, which increased from 2.36 to 2.60. The aims of the project charter proposed an increase of the sigma level from 2.36 to 2.7. Referring to the analysis, we can declare that the aim of the project charter was not achieved at 100%. Referring to the results of the analysis in the process of sanding in the Firm, which does not have a certified quality management system, the hypothesis was not confirmed.
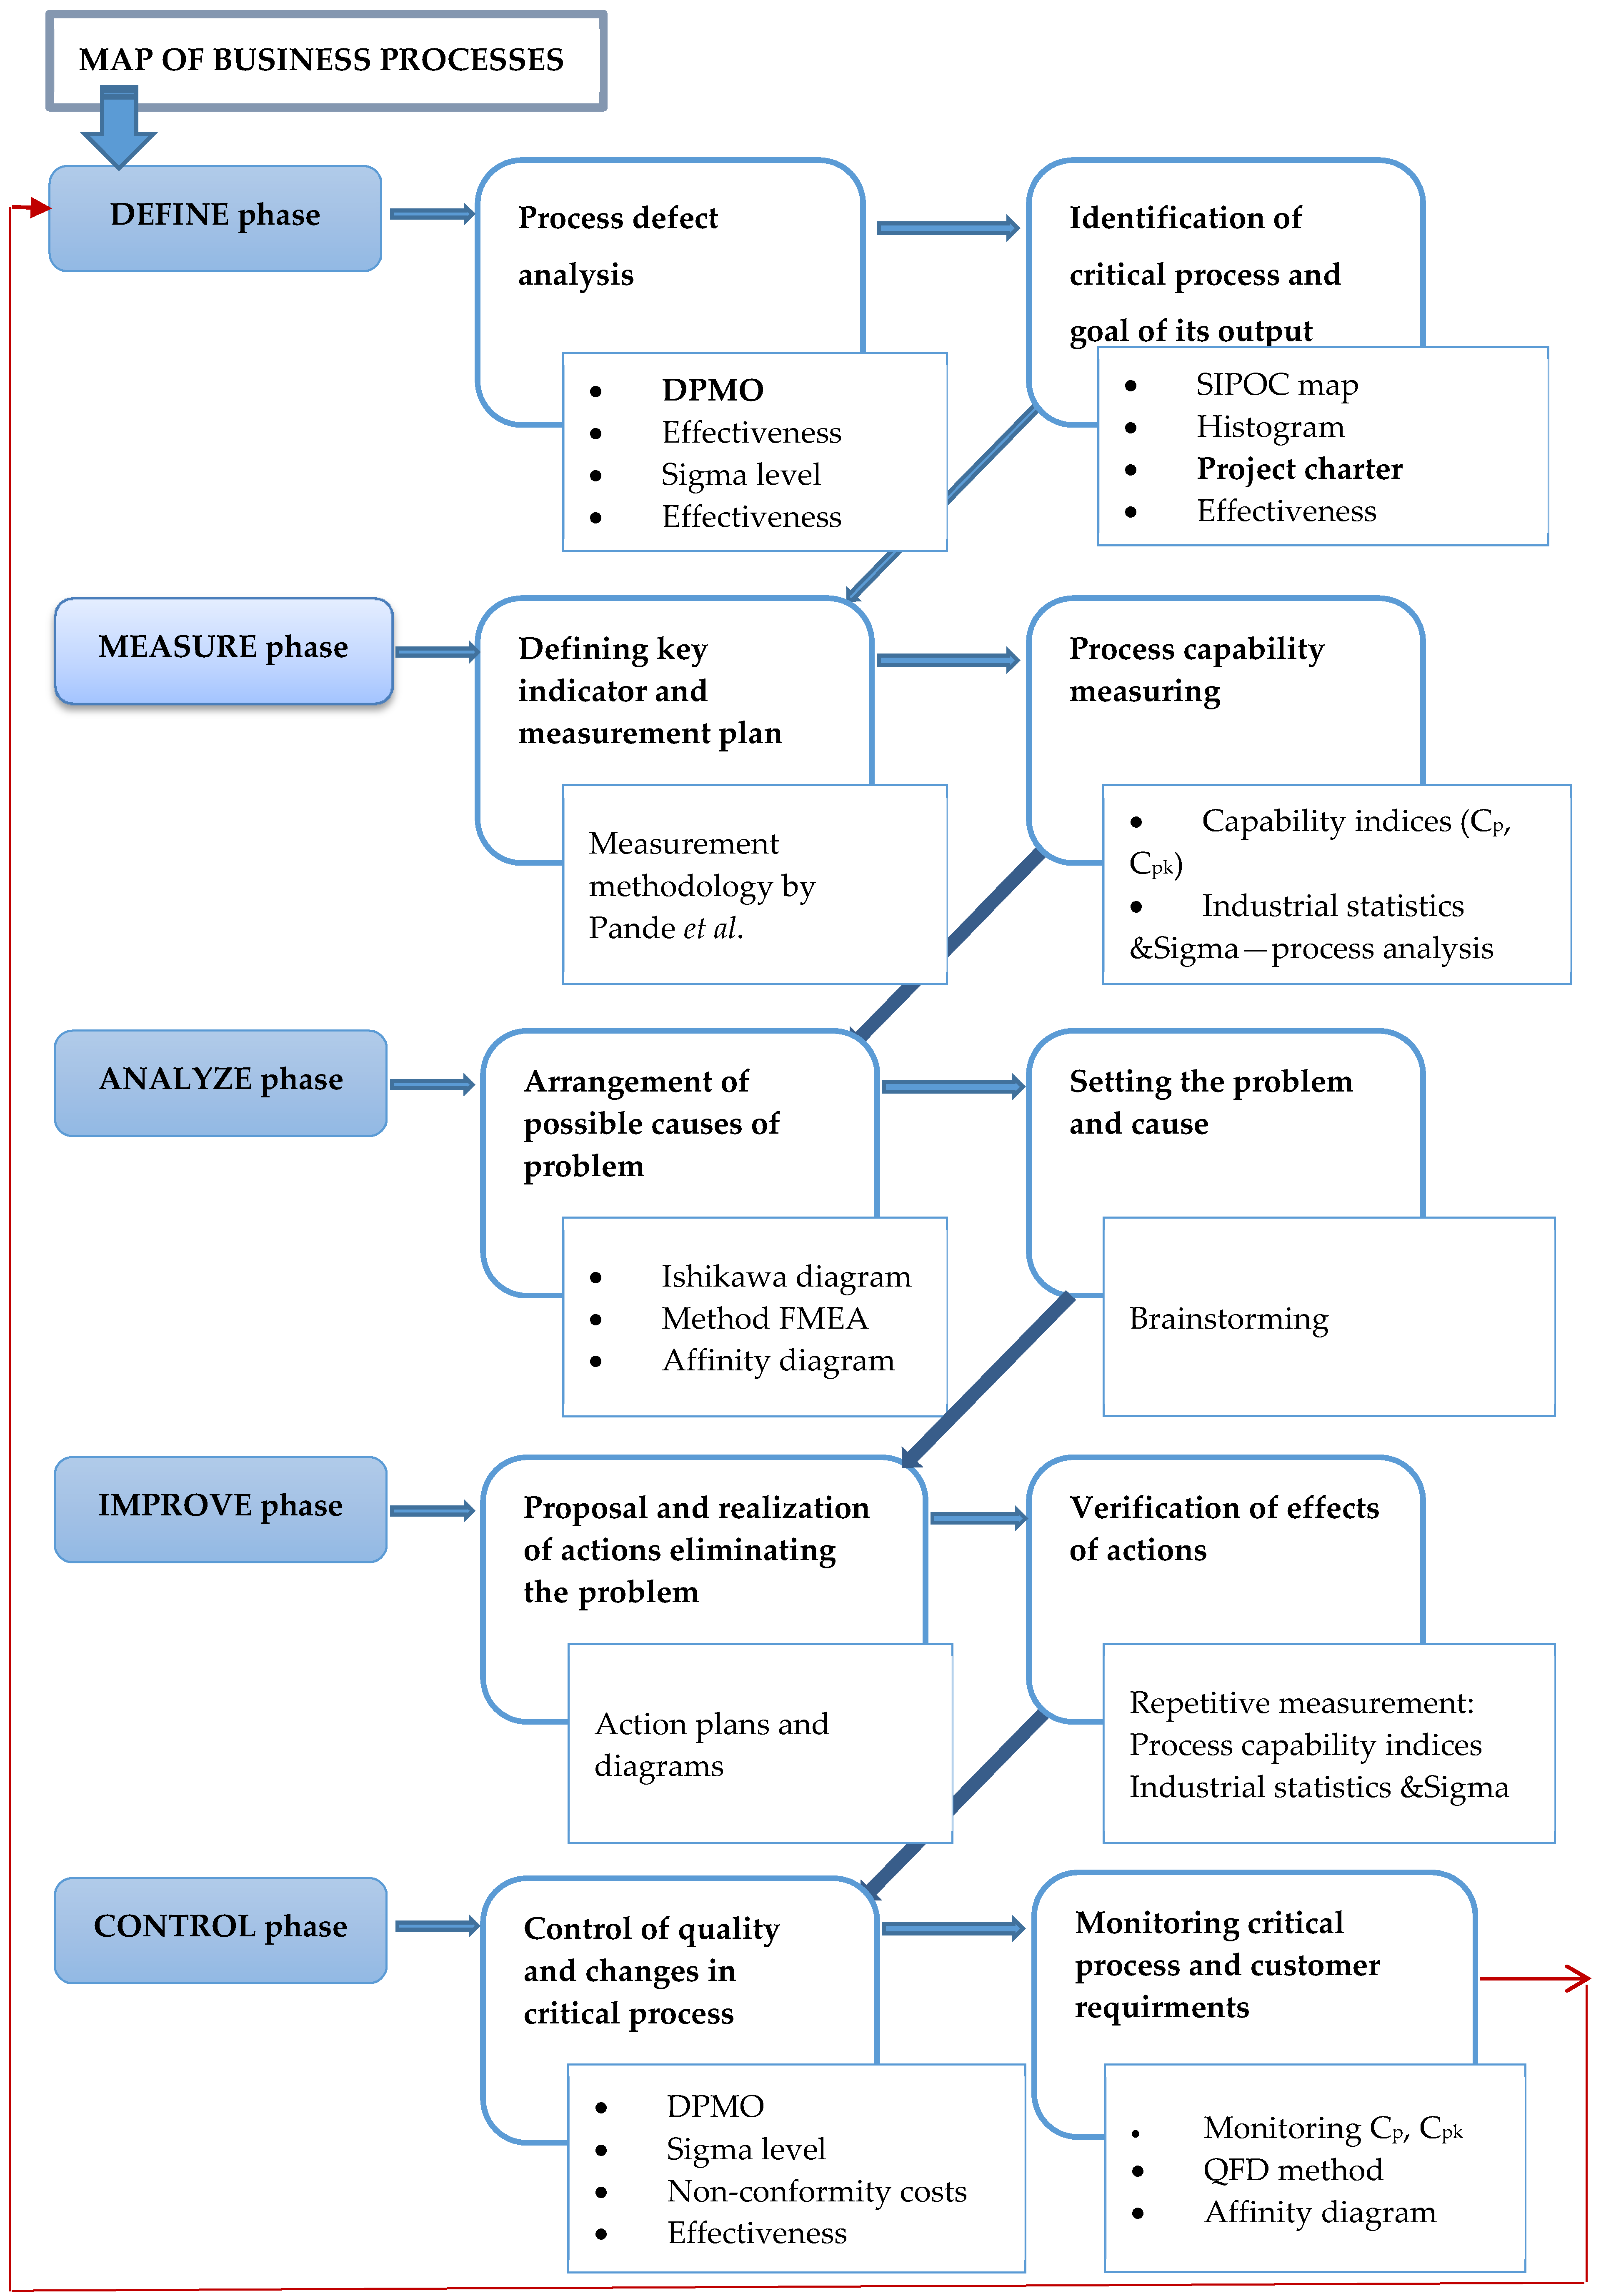
3.4. The Model of Ensuring Sustainable Processes Performance via the Six Sigma Concep
The model describes essential activities according to DMAIC, methods, and tools of how to ensure activities to improve quality of processes from the viewpoint of decreasing non-conformity and DPMO, increasing effectiveness and sigma level, decreasing process variability, their stabilization, the search, and analysis of causes of non-conformity occurrence, proposals to eliminate the causes of non-conformity occurrence, process control, a procedure of the measurements and verification of corrective measures, process management, the usage of methods and tools of descriptive statistics, the usage of modules of industrial statistics, and Six Sigma modules.
The model introduces one cycle of improvement of process performance via the improvement of an identified critical process, which can be constantly repeated and, so, constantly increased process performance. It is illustrated in
Figure 6.
4. Conclusions
The results of the survey of the Slovak enterprises confirmed positive effects of the Six Sigma methodology presented in the studies of several foreign authors. Slovak enterprises which use the methodology achieve not only higher performance of business processes, but also higher corporate performance. Moreover, the dependency of achieved corporate performance on the use of Six Sigma was statistically confirmed. The application of Six Sigma methodology in practical conditions of Slovak enterprises producing furniture confirmed achievement of better results in the field of ensuring and improving the quality of production processes, an increase of savings on costs of claims and nonconforming products, and a possibility to implement measures to eliminate causes of non-conformity occurring in a process.
The limitations of the research study consist in the insufficient statistical confirmation of dependency on SSM on a certified quality management system because of a small number of investigated enterprises with an implemented Six Sigma concept. The next part of the work was focused on two specific cases: two furniture manufacturing enterprises from 500 existing furniture companies in Slovakia. Therefore, a generalization will require further careful investigation.
Despite the above-mentioned limitations, the research study proved a possibility to implement the Six Sigma methodology and to use the same methods in enterprises, aside from a quality management system, such as quality management under certification according to ISO 9001 standards or only utilizing the basic tools of quality management.
The results of the study further showed that better results were achieved in the enterprise which has introduced a quality management system. Therefore, we may claim that quality management systems form better grounds to implement Six Sigma and the achievement of higher benefits.
The results of this work develops contemporary knowledge in assumptions and limitations by the application of Six Sigma methodology and its tools in connection with quality management systems and they indicate a direct dependence with a level of corporate performance. The contribution of the research study can be considered in the first application of SSM in enterprises within specific conditions of furniture production processes.
The practical implications of the research can be seen in the suggested model, including procedures, suitable methods, and tools for implementation and permanent utilization of SSM in manufacturing enterprises. The suggested model of sustainably ensuring the required performance of processes enables monitoring and unveils the critical moments of processes, constantly, and eliminate them, subsequently. The model presents a never-ending cycle, which ensures sustainable process performance. The SSM and a suitable selection of tools are the means of a constant assurance and increase of business processes performance. Six Sigma provides a permanent improvement of processes by the effective use of methods, tools, techniques, and procedures, particularly by decreasing variability and variance of processes, by an increase of capability of processes.
Further research will be focused on the utility of other modern methods and tools by ensuring a sustainable process performance and its continual improvement with higher effects than SSM, especially in enterprises without a certified quality management system. The research work will also deal with other aspects of process improvement, such as process economic efficiency and lean processes leading to the suggestion of a methodology for complex improvement of the process.


