Article

Analysis on Impact Factors of Water Utilization Structure in Tianjin, China

1
Institute of Policy and Management, Chinese Academy of Science, Beijing 100190, China
2
Beijing Engineering Corporation Limited, Power China, Beijing 100024, China
3
National Research Institute for Rural Electrification, Hangzhou 310012, China
*
Author to whom correspondence should be addressed.
Sustainability 2016, 8(3), 241; https://doi.org/10.3390/su8030241
Submission received: 1 January 2016 / Revised: 27 February 2016 / Accepted: 1 March 2016 / Published: 7 March 2016

Abstract

:
Water is an essential foundation for socio-economic development and environmental protection. As such, it is very critical for a city’s sustainable development. This study analyzed the changes in water utilization structure and its impact factors using water consumption data for agricultural, industrial, domestic and ecological areas in the city of Tianjin, China from 2004 to 2013. On this base, the evolution law and impact factors of water utilization structure were depicted by information entropy and grey correlation respectively. These analyses lead to three main results. First, the total amount of water consumption in Tianjin increased slightly from 2004 to 2013. Second, the information entropy and equilibrium degree peaked in 2010. From 2004 to 2010, the water utilization structure tended to be more disordered and balanced. Third, the economic and social factors seemed to influence the water utilization structure, while the main impact factors were industrial structure, per capita green area, cultivated area, effective irrigation area, rural electricity consumption, animal husbandry output, resident population, per capita domestic water etc.

1. Introduction

As a kind of strategic resources, water resources are not only an important condition of economic and social sustainable development, but also a precondition of improving ecological environment. Water utilization structure is one of the most important elements in water resources and effective water resources management.
Analysis of water utilization structure was prevalent in some scientific literatures. Liu et al. [1] qualitatively analyzed the change of water utilization structure of Beijing from 1980 to 2000. Jenerette [2] asserted that the water utilization form depended on population, livestock, climate change, and ecological water supply condition etc. This author judged that there would be continuous water supply crisis in most cities, so attention must be paid to sustainable water resources management. Su et al. [3], Ma et al. [4] and Zheng et al. [5] discussed the water utilization structure of Guanzhong area using information entropy. Lv et al. [6] used grey correlation degree to analyze the driving forces of water utilization structure change in Zhengzhou. Chen [7] used information entropy and grey correlation degree to analyze the change of water utilization structure and its impact factors respectively in Xiamen. Furthermore, the impact factors of water utilization structure were chosen by principal component analysis to satisfy the requirement of water resources management. On this basis, Yun et al. [8] built a compositional data linear regression model based on partial least-squares regression, and demonstrated the connection coherence between water utilization and industrial structure. Hereafter, Liu et al. [9] used a variable stability test, the co-integration and Granger causality test to study the relationship between water utilization structure and industrial sustainable development. Zhai et al. [10] not only considered industrial, agricultural and domestic water consumption, but also explored the influence of ecological water consumption on water utilization structure. Indeed, ecological water consumption is very important for sustainable ecological development. Paola et al. [11,12] presented a multi-objective approach for the automatic partitioning of a water distribution network into District Metering Areas (DMAs). On this base, Paola et al. [13] presented a model for valve setting in water distribution networks (WDNs), with the aim of reducing the level of leakage. Focusing on an African case, Paola et al. [14] analyzed the problem of the sustainable design and development of urban storm-water systems in response to the climate change and anthropic modification. Finally, Nunez et al. [15] presented a system of two-stage processing for the detection of acoustic emissions and the localization of the sources, which is also instructive.
Water consumption and its impact factors were discussed in some literatures. In general, water consumption can be divided into four categories: industrial, agricultural, domestic and ecological. Marios [16] supposed that the impact factors of water consumption included population growth, sustainable economic development, technical progress, land use pattern, urbanization progress etc. Through logarithmic mean Divisia index Method (LMDI), Liu et al. [17] analyzed the industrial water consumption of Anhui province by considering economic scale, industrial structure and water quota. On this basis, Zhang et al. [18] added water intensity and industrial water saving effect to those impact factors, and explained the change of industrial water in Anhui Province. Arbues et al. [19] calculated the weight of domestic water consumption. Cui et al. [20] proposed that the impact factors of domestic water consumption mainly included resident income and water price. Adding drinking water and family population, Xu [21] built a regression model to research the impact factors of domestic water consumption in Beijing.
Above results were meaningful, but the impact factors of water utilization structure should be further perfected. The impact factors from different literatures were complementary. Based on these impact factors and the data we could get (mainly from Tianjin Statistical Yearbook 20052014 [22]), the impact factors were filtered. Besides, in Tianjin Statistical Yearbook 20052014 [22], some indexes did not appear in above literatures, but they had influence on the water consumption of Tianjin. These kinds of indexes also could be used as impact factors. This study took the water consumption of Tianjin from 2004 to 2013 as sample [22]. Tianjin is located in the northeast of North China Plain and in the center of Bohai economic circle. As the largest port city of North China, Tianjin is an important communication hub, directly connecting Beijing to Northeast China, East China and the Pacific Ocean. In this study, the change of water utilization structure in Tianjin was analyzed, and its main impact factors were identified afterwards. These impact factors of water utilization structure are essential for us to conduct effective water resources management and sustainable development in Tianjin.
The study period was from 2004 to 2013. Due to the limitation of water quantity monitoring and resources management abilities, agricultural, industrial, domestic and ecological water consumption data of Tianjin before 2004 was unavailable.

2. Material and Methods
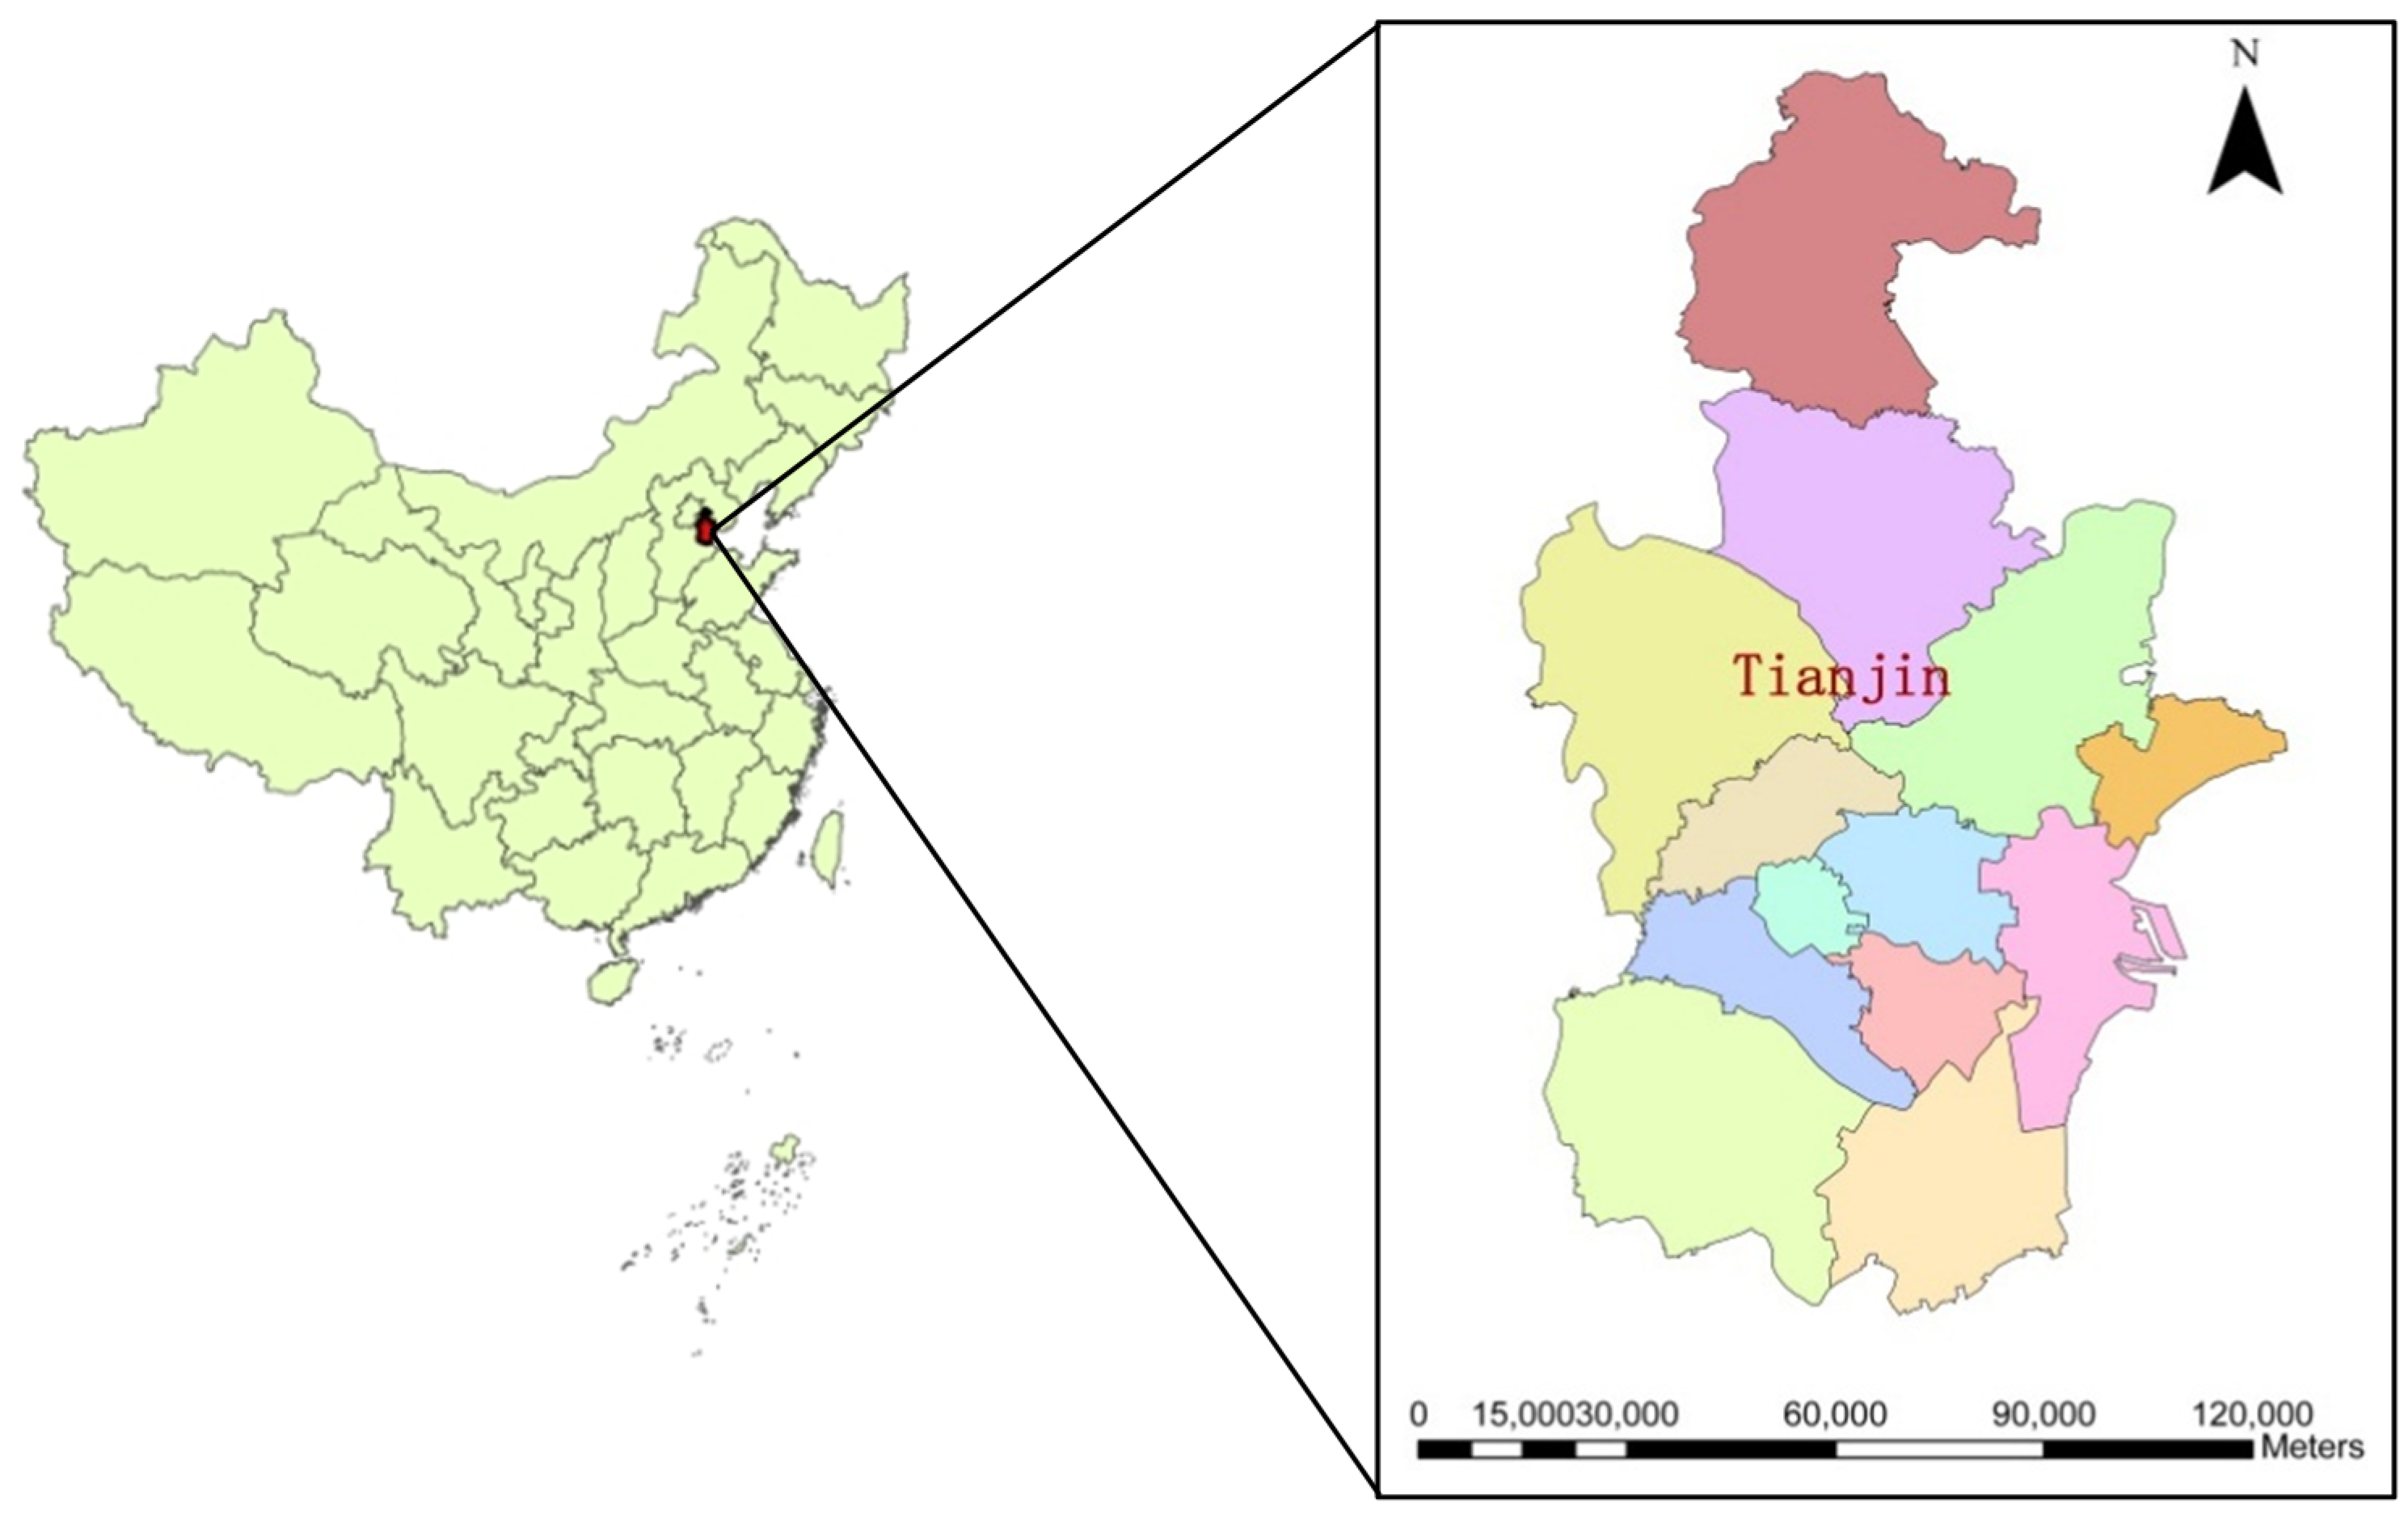
2.1. Research Area

The annual precipitation of Tianjin is 560 mm–720 mm on average, with the precipitation from June to August comprising 75% of total annual precipitation. With the rapid development of economy and society, the water shortage of Tianjin became more and more serious. In fact, water resources had become a key restrictive factor of the sustainable development in Tianjin. After the construction of Luanhe-Tianjin water diversion project, Luanhe River became an important water source for Tianjin. In the past decade, the annual water resources quantity of Tianjin was 1.177 billion m3, and it was larger in the northern area than in the southern area. From 2000, four times the water supply from Yellow River to Tianjin were transported to ease the water shortage of Tianjin. After the completion of the first-phase of the middle-line of the South-to-North Water Transfer Project, although the water supply quantity is increased, the water shortage of Tianjin was also severe(Figure 1). Water resources remained a critical issue in Tianjin.

2.2. Data Source

Water consumption is affected by many factors. Through literature review, the impact factors of water consumption were summarized as the follows (Table 1).
Data on water consumption and impact factors were derived from the 2005–2014 Tianjin Statistical Yearbook [22]. The specific impact factors for agricultural, industrial, domestic, and ecological water consumption are presented in Table 1.The impact factors of agricultural water consumption included cultivated area, effective irrigation area, effective water saving irrigation area, agriculture forestry, animal husbandry, and fishery output value, and rural electricity consumption. The impact factors of industrial water consumption included industrial output value, water consumption of 10,000 Chinese Yuan (CNY) industrial added value, water consumption of 10,000 CNY industrial output value, output value of light industry, heavy industry and high-tech industry. The impact factors of domestic water consumption included resident population, urban per capita income, per capita domestic water consumption. The impact factors of ecological water consumption included per capita green area, garden green area and park area.

3. Analysis Methods

3.1. Information Entropy Anasysis

Entropy is a concept of thermodynamics. Shannon introduced it into information theory, and defined it as information entropy to describe the confusion or disorder degree of system or material [37]. The evolution of water utilization structure has some stages, and they are irreversible. So information entropy could be used to analyze the water utilization structure. This index is useful in water resources sustainable management.
Set the total water consumption equals to Q , and the water consumption is X i ( i = 1 , 2 , 3 , n ) . The proportion of each water consumption type is p i , and i = 1 n p i = 1 ( p i 0 ) . According to Shannon formula, H = i = 1 n p i ln p i , where H is information entropy. The concept of equilibrium degree is J , and J = H H max , where H max is the maximum of information entropy, H max = ln ( n ) . With the increase of H , the disorder degree of the system increases, and the structure of the system tends to be more balanced. With the increase of J , the equilibrium degree and stability of the system increase.

3.2. Grey Correlation Analysis Method

A grey system is a system containing both known and unknown information [38,39]. The grey correlation analysis model belongs to one multi-element statistical analysis methods. Based on the sample data, this model descripts the relevance size and order of factors through grey correlation. Since the relationship between water utilization structure and its impact factors is grey, this study used the grey correlation analysis method to analyze these impact factors.
X i ( t ) and X j ( t ) are the coordinates of the gravity centers of element i and j , respectively. So Δ i , j ( t ) = | X i ( t ) X j ( t ) | represents the absolute value of the difference between these two coordinates. Set Δ ( max ) and Δ ( min ) are the maximum and minimum values of these differences, then 0 Δ ( min ) Δ ( max ) Δ i j ( t ) Δ ( max ) 1 . Obviously, with the increase of Δ i j ( t ) Δ ( max ) , the consistency of change between ( X i ) and ( X j ) becomes weaker. In order to limit the standardized data between 0 and 1, the value could be taken as Δ ( min ) / Δ ( max ) Δ i j ( t ) / Δ ( max ) .
For convenience, the grey correlation degree was classified into three groups: 0–0.60 implies weak correlation degree, 0.60–0.80 implies moderate correlation degree, 0.80–1.0 implies strong correlation degree [40].

4. The Water Consumption and Its Impact Factors

The total water consumption of Tianjin increased from 2.206 billion m3 in 2004 to 2.337 billion m3 in 2007. Its annual growth rate was 1.94% on average. The total water consumption of Tianjin in 2008 and 2009 fluctuated slightly. From 2010 to 2013, the annual growth rate was 1.85% on average (Figure 2).

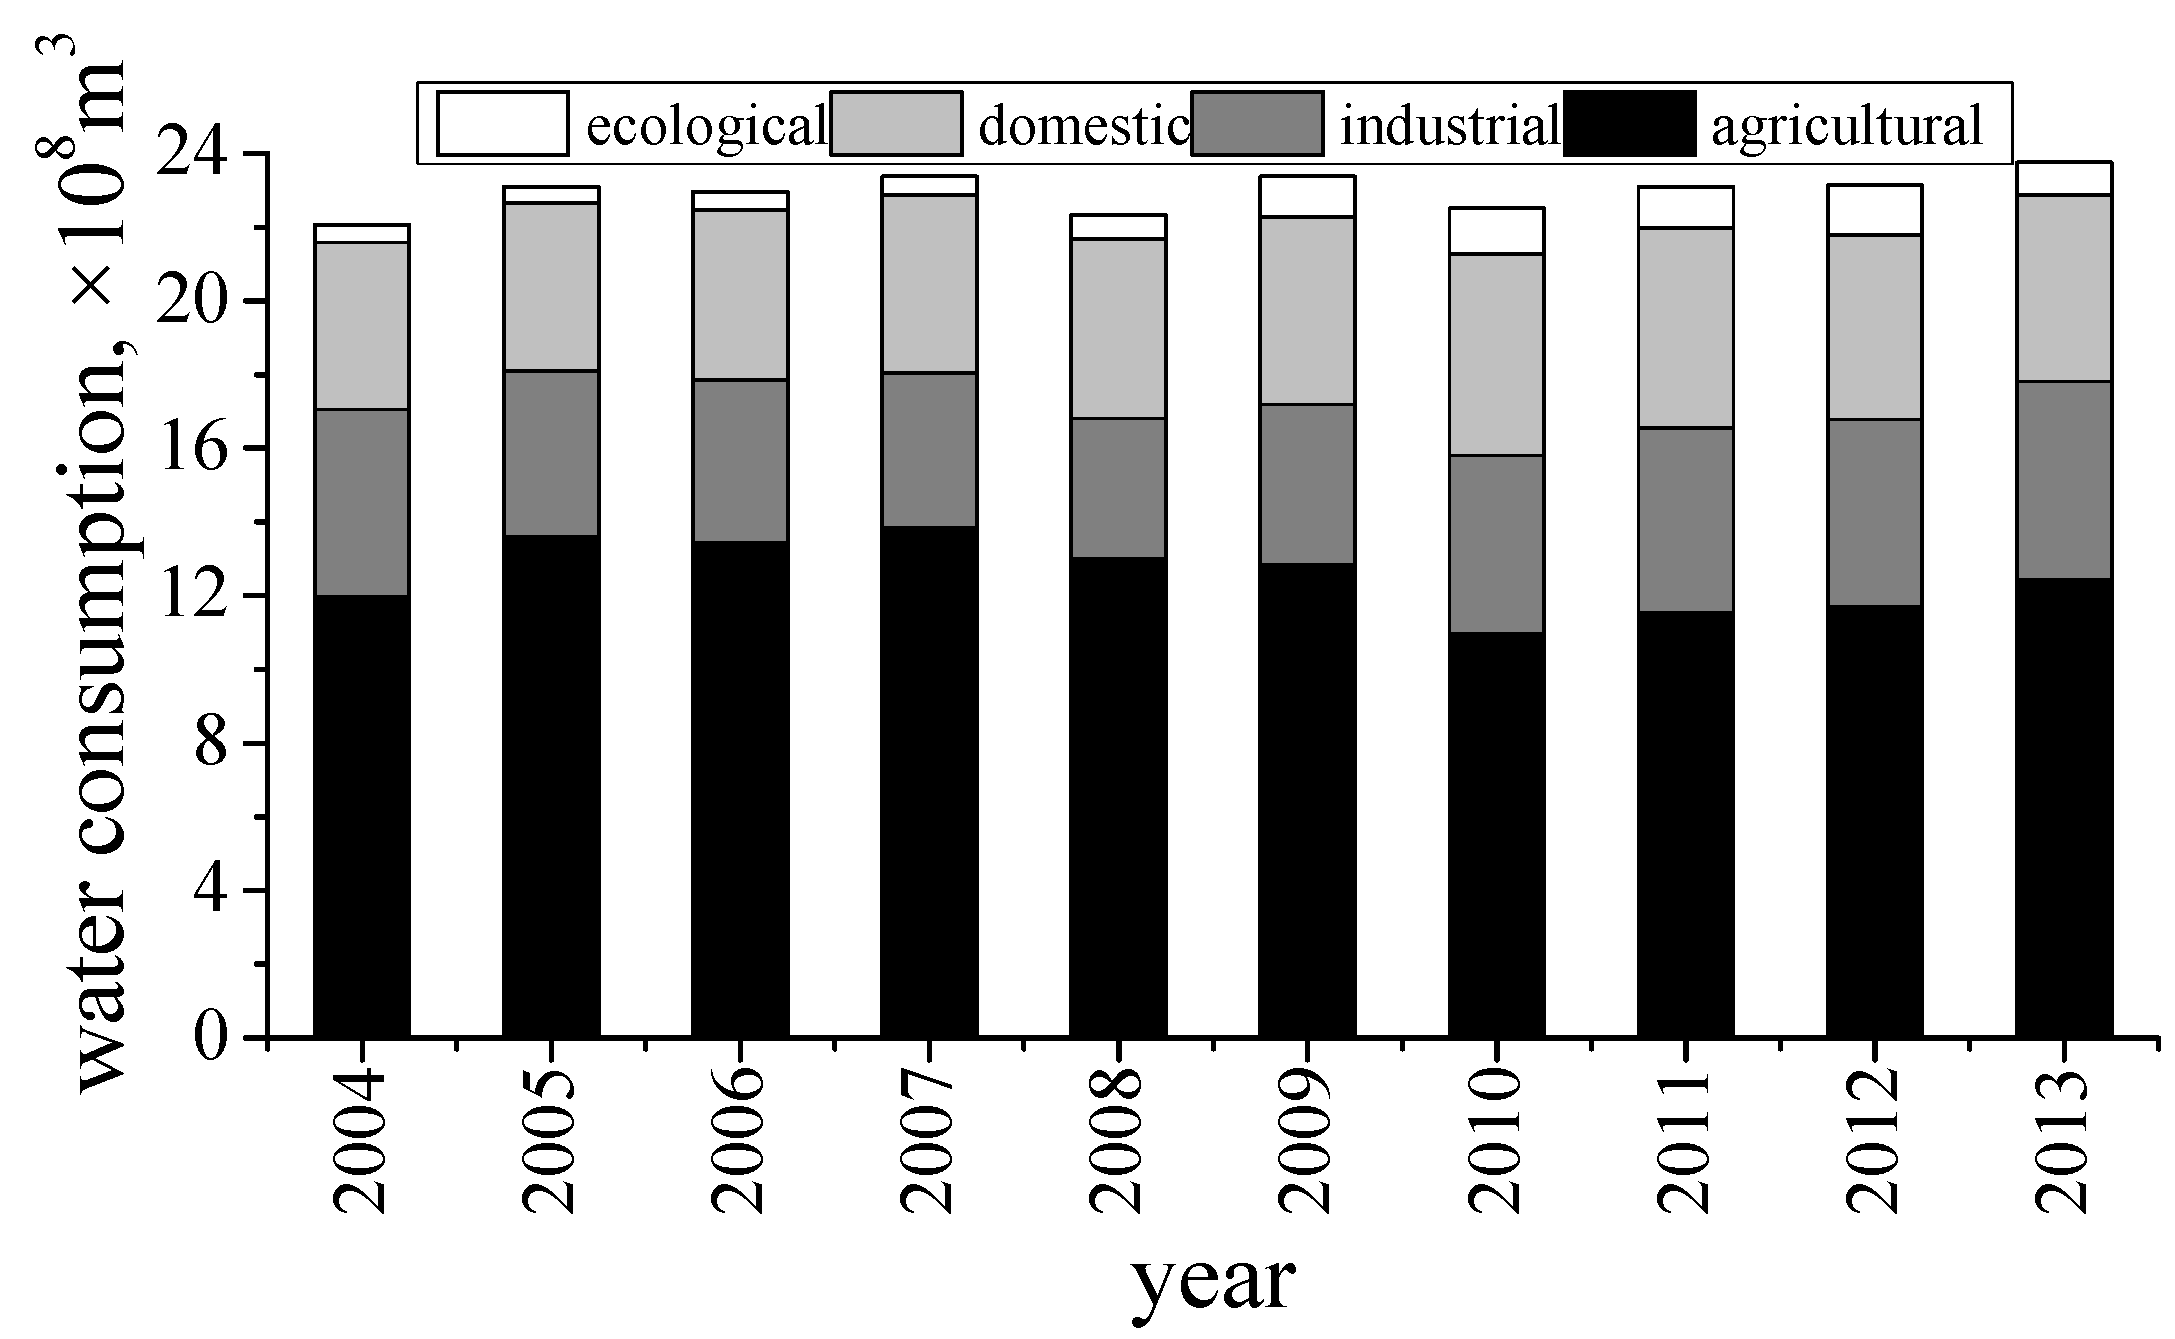
4.1. Agricultural Water Consumption

From 2004 to 2013, the agricultural water consumption of Tianjin accounted for 48%–59% of the total water consumption, and it was the largest water user in Tianjin. The change of agricultural water consumption could be divided into three stages. From 2004 to 2007, it increased from 1.198 billion m3 to 1.384 billion m3, and the annual growth rate was 4.93% on average; after 2007, it decreased to 1.097 billion m3, and the annual growth rate was 7.45% on average; hereafter, it increased slightly.
The agricultural water consumption changed because the decrease of cultivated area and effective irrigation area and the increase of efficient water saving irrigation area. Indeed, the cultivated area of Tianjin decreased from 0.42 million hm2 in 2004 to 0.39 million hm2 in 2013, and its annual change rate was −0.63% on average; the effective irrigation area decreased from 0.35 million hm2 in 2004 to 0.31 million hm2 in 2013, and its annual change rate was −1.5% on average; efficient water saving irrigation area increased from 0.19 million hm2 in 2004 to 0.29 million hm2 in 2013, and its annual growth rate was 5.16% on average. In addition, the agricultural electricity consumption increased from 4.84 billion kWh in 2004 to 6.92 billion kWh in 2013, and its annual growth rate was 4.05% on average; the output value of primary industry increased from 22.14 billion CNY in 2004 to 40.20 billion CNY in 2013, and its annual growth rate was 6.86% on average.
Fishery output value had weak correlation with agricultural water consumption. Other impact factors had moderate correlation with agricultural water consumption (Table 2). It appeared that the adjustment of agricultural structure and the improvement of water saving irrigation technology influenced the agricultural water consumption. In these years, Tianjin City conducted the strategic layout of taking planting as a foundation and taking breeding industry as a sustainable development emphases. With the promotion of water saving irrigation technology, unreasonable irrigation methods were eliminated. On this basis, supposing that, the agricultural water of Tianjin developed in a sustainable direction.

4.2. Industrial Water Consumption

From 2004 to 2013, the industrial water consumption of Tianjin accounted for 17%–23% of total water consumption. Its change could be divided into two stages: from 2004 to 2008, it reduced from 0.507 billion m3 to 3.81 billion m3, and its annual change rate was 6.89% on average; from 2008 to 2013, it increased from 0.381 billion m3 to 0.537 billion m3, and its annual growth rate was 7.11% on average.
The change of industrial water consumption was significantly influenced by the policy and regulation. In order to achieve sustainable water resources management, Tianjin City proposed “regulations on water saving of Tianjin” in 2002, which was the first local regulation on water saving in China. From 2004 to 2013, the industrial output value of Tianjin increased from 168.59 billion CNY to 727.55 billion CNY, while the water consumption of 10,000 CNY industrial output value decreased from 30.07 m3 to 7.38 m3. The water saving technology was improved and the industrial structure was adjusted. Consequently, from 2004 to 2008, the industrial water consumption decreased. However, in 2009, the administrative division of the New Coastal Region of Tianjin was reformed. The rapid development of the New Coastal Region of Tianjin accelerated the industrial economic development of Tianjin. At this time, the industrial output value of Tianjin was 398.78 billion CNY, and the New Coastal Region of Tianjin accounted for only 9.2% of Tianjin; in 2013, the industrial output value of Tianjin was 727.55 billion CNY, and the New Coastal Region of Tianjin accounted for 70.6% of Tianjin. The supernormal development of the New Coastal Region of Tianjin was an important explanation for the increase of the industrial water consumption of Tianjin after 2008. As a large industrial city, controlling total water consumption while ensuring the economic development was a challenge for Tianjin.
All of the impact factors had moderate correlation with the industrial water consumption of Tianjin (Table 3). Thus, the industrial economic quality had a significant influence on total water consumption in Tianjin. This finding suggested that improving industrial economic quality would promote the improvement of water resources management.

4.3. Domestic Water Consumption

From 2004 to 2013, the domestic water consumption of Tianjin accounted for 20%–25% of the total water consumption. The change of the domestic water consumption could be divided into two stages: In the first stage, the domestic water consumption increased steadily, while in the second stage, it reduced with fluctuation. Specifically, from 2004 to 2010, it increased from 0.453 billion m3 in 2004 to 0.548 billion m3 in 2010, and its annual growth rate was 3.22% on average; and from 2010 to 2013, it decreased from 0.548 billion m3 to 0.515 billion m3, and its annual change rate was 2.69% on average.
The basic explanation for the change of the domestic water consumption of Tianjin was population growth. The resident population increased from 10.24 million in 2004 to 14.72 million in 2013, and the annual growth rate was 4.12% on average. With the simultaneous improvement in living standard, per capita domestic water consumption increased from 123.6 m3 in 2005 to 142.34m3 in 2013.
All of the impact factors had moderate correlation with the domestic water consumption of Tianjin (Table 4). With the adjustment of fertility policy and the improvement of income level, the domestic water consumption of Tianjin would be increased in the future. Green lifestyle could be very important in forming sustainable water resources management.

4.4. Ecological Water Consumption

Given the importance of ecological environment protection and sustainability, the ecological water consumption of Tianjin was also studied. It increased from 48 million m3 in 2004 to 136 million m3 in 2012, and its annual growth rate was 13.9% on average; in 2013, it reduced by 33.8%. Certain factors may explain this change in ecological water consumption. For example, the per capita green area of Tianjin increased from 13.87 m2 in 2004 to 15.76 m2 in 2013, and its growth rate was 13.6% on average; the garden green area increased from 14238.1 hm2 in 2004 to 23916 hm2 in 2013, and its annual growth rate was 5.93% on average; the park area increased from 2424 hm2 in 2004 to 7279 hm2 in 2013, and its annual growth rate was 13% on average.
Garden green area had a moderate correlation degree with the ecological water consumption. Park area had a weak correlation degree with the ecological water consumption (Table 5). Ecological environment is essential for sustainable development.

5. The Evolution of Water Utilization Structure and Its Impact Factors

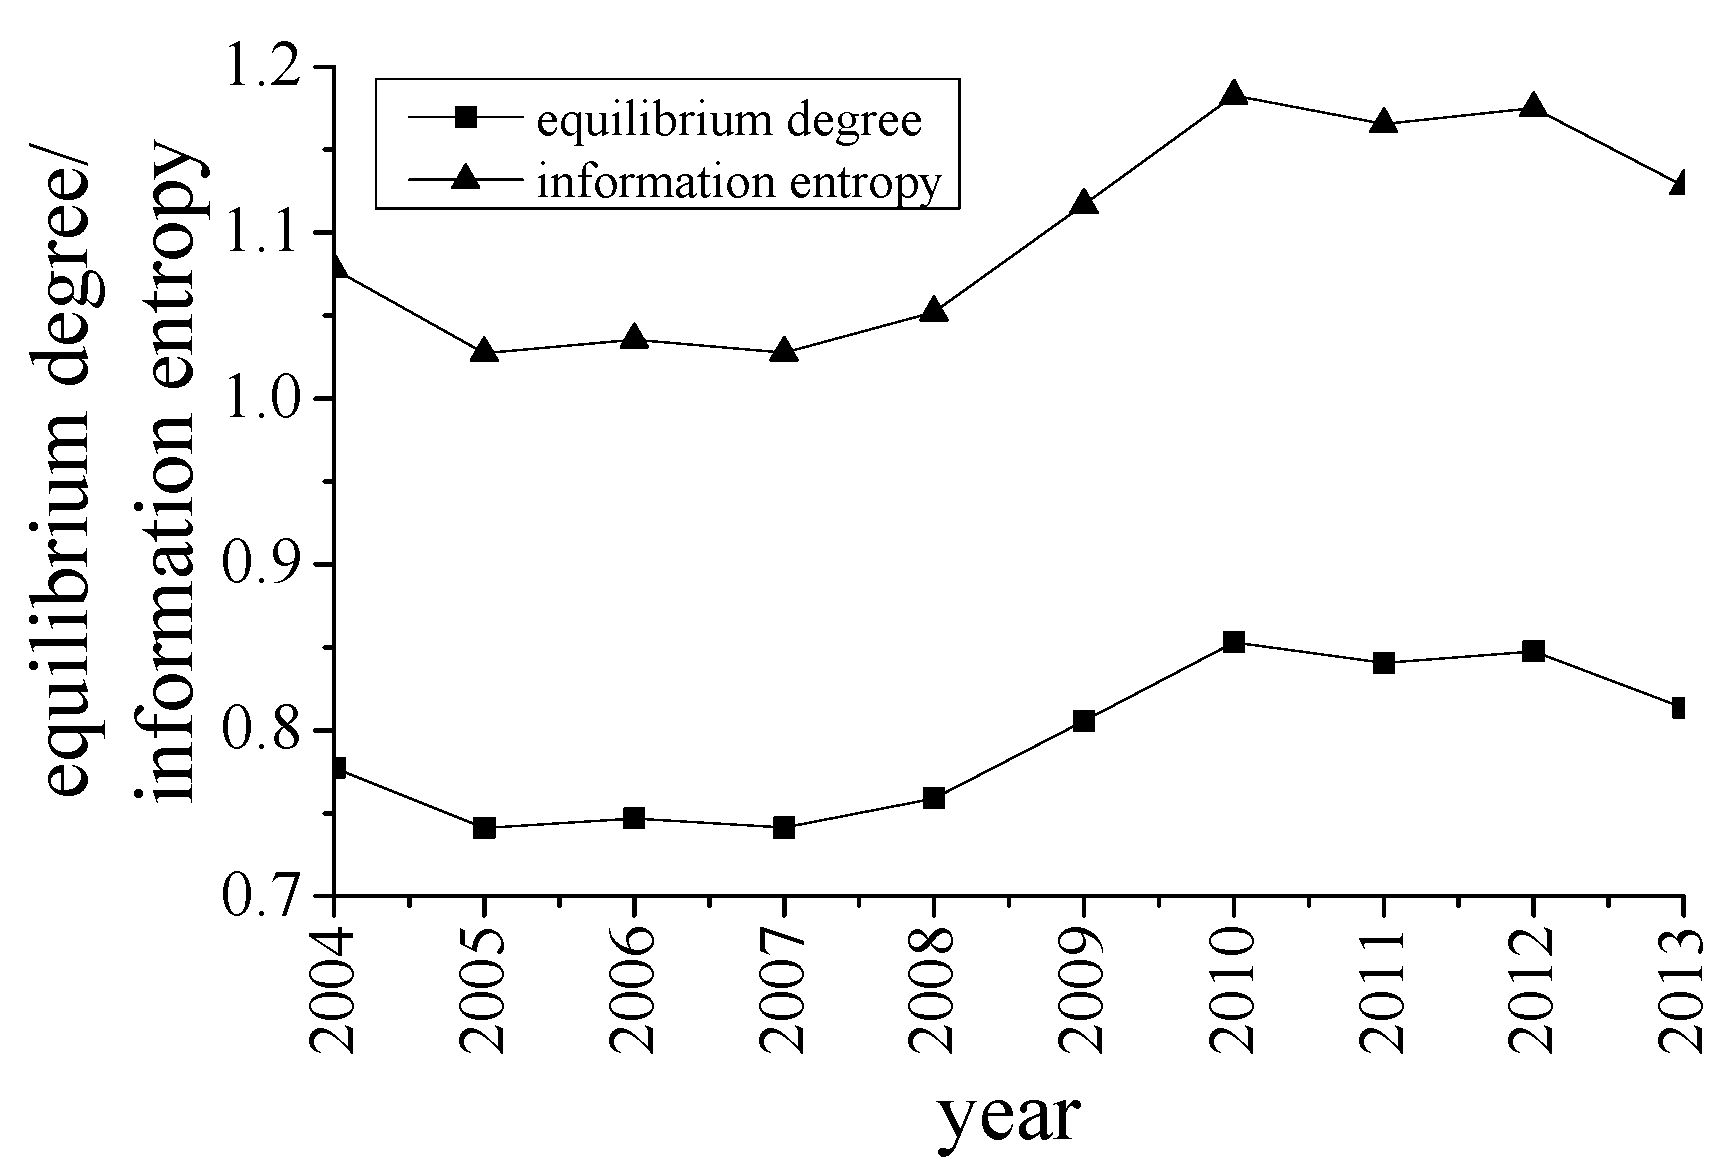
5.1. Water Utilization Structure Analysis

The change of water utilization structure of Tianjin could be divided into two stages. In the first stage, the information entropy increased from 1.078 in 2004 to 1.183 in 2010, and its annual average rate was 1.56%. Through relative literatures, if the annual average rate was larger than 2%, the change of information entropy was considered to be obvious or rapid; otherwise, it was considered to be inconspicuous or slow [3,5,7,41]. Therefore, when the information entropy increased from 1.078 to 1.183, it increased slowly. The water utilization structure of Tianjin tended to be more disordered and balanced. This result implied that that the dominance of a single water consumption type decreased generally. The water utilization structure of Tianjin developed in a sustainable direction. It also demonstrated that the water resources management tended to be more sustainable. In the second stage, the information entropy fluctuated between 1.128 and 1.165. The relatively high information entropy meant that the water utilization structure of Tianjin was relatively mature, and influence of single factor reduced continuously (Figure 3). Similar results could be obtained by considering the equilibrium degree.

5.2. The Impact Factors Analysis of Water Utilization Structure

Rejecting the impact factors whose correlation degree was less than 0.6, other impact factors were used to do correlation analysis with the information entropy of water utilization structure. Besides, considering industrial structure had obvious influence on water utilization structure (Table 1), relative indexes were added. The information entropy of the water utilization structure was taken as reference sequence X 0 , the originally selected impact factors included: the proportion of primary industry X 1 , the proportion of secondary industry X 2 , the proportion of tertiary industry X 3 , cultivated area X 4 , effective irrigation area X 5 , effective water saving irrigation area X 6 , agricultural output value X 7 , forestry output value X 8 , animal husbandry output value X 9 , rural electricity consumption X 10 , water consumption of 10,000 CNY industrial added value X 11 , water consumption of 10,000 CNY industrial output value X 12 , light industry output value X 13 , heavy industry output value X 14 , high technology industry output value X 15 , resident population X 16 , urban per capita income X 17 , per capita domestic water consumption X 18 , garden green area X 19 , park area X 20 .
After calculation, the correlation degrees of the impact factors were: X 10 > X 4 > X 19 > X 7 > X 12 > X 13 > X 11 > X 16 > X 14 > X 9 >0.7> X 20 > X 15 > X 1 > X 17 > X 18 > X 5 > X 6 > X 8 > X 2 > X 3 >0.6. They all had moderate correlation with the water utilization structure of Tianjin (Table 6).

6. Conclusions

Tianjin has an important position in China and an undeniably good foundation of water quantity monitoring in China, making it an ideal study site. Through information entropy analysis and grey correlation analysis method, the changing process of water consumption was studied, thereafter the evolution law and the impact factors of the water utilization structure were discussed. Compared with previous studies, the impact factors of the water utilization structure in this study were more comprehensive. The results of this study were meaningful for adjusting water consumption and optimizing water utilization. The water utilization structure reflected the level of water resources management sustainable development to some extent.
From 2004 to 2010, the water utilization structure of Tianjin tended to be disordered and balanced. It meant that the dominance of a single water consumption type decreased and the equilibrium degree increased generally. In general, the water utilization structure of Tianjin developed in a sustainable direction. It also demonstrated that the water resources management tended to be more sustainable. From 2011 to 2013, the relatively high information entropy implied that the water utilization structure of Tianjin was relatively mature, and influence of single factors reduced continuously.
From 2004 to 2013, rural electricity consumption, cultivated area, garden green area, agricultural output value, water consumption of 10,000 CNY industrial output value, light industry output value, per capita green area, per capita green area, water consumption of 10,000 CNY industrial added value, resident population, heavy industry value and animal husbandry output value had strong correlation with the water utilization structure of Tianjin. These results could be used to adjust water consumption and further optimize water utilization structure.
In the future, if the water consumption data is plentiful and the related technologies are mature, the water utilization structure could be predicted accurately, and its impact factors will be identified effectively.

Acknowledgments

This research is supported by the National Natural Science Foundation of China (No. 91325302 and No. 71503245).

Author Contributions

As the first author, Conglin Zhang made substantial contributions to the acquisition, analysis and interpretation of the data as well as the drafting and revising of article; Yu Liu and Leihua Dong provided some ideas for the article, and gave important advices for the final version; Haijuan Qiao helped to revise the manuscript.

Conflicts of Interest

The authors declare no conflict of interest.

References

  1. Liu, B.Q.; Yao, Z.J.; Gao, Y.C. Trend and driving forces of water consumed structure changes in Beijing. Resour. Sci. 2003, 25, 38–43. (In Chinese) [Google Scholar]
  2. Jenerette, G.D. A global perspective on changing sustainable urban water supplies. Glob. Planet. Chang. 2006, 50, 202–211. [Google Scholar] [CrossRef]
  3. Su, X.L.; Zhao, C.; Ma, L.H. Water consumed structure evolvement and its driving forces for Guanzhong Region in the past 20 years. J. Irrig. Drain. 2008, 27, 71–73. (In Chinese) [Google Scholar]
  4. Ma, L.H.; Kang, S.Z.; Su, X.L. Study on evolution and its driving forces of water utilization structure of Shiyang River Basin in northwest arid areas. Agric. Res. Arid Areas 2008, 26, 125–130. (In Chinese) [Google Scholar]
  5. Zheng, A.Q.; Wang, W.K.; Duan, L. Water consumption structure evolvement and its driving forces for Guanzhong Basin. J. Arid Land Resour. Environ. 2011, 25, 75–79. (In Chinese) [Google Scholar]
  6. Lv, C.M.; Wu, Z.N.; Hu, C.H. Grey relational degree analysis on the major driving forces of water use structure. Water Sav. Irrig. 2008, 2, 39–41. (In Chinese) [Google Scholar]
  7. Chen, X.F. Analysis of grey relation degree based on water utilization evolution and driving force of information entropy in Xiamen. J. Water Resour. Water Eng. 2013, 24, 188–191. (In Chinese) [Google Scholar]
  8. Yun, Y.; Zou, Z.H.; Wang, H.W. A regression model based on the compositional data of Beijing’s water consumed structure and industrial structure. Syst. Eng. 2008, 26, 67–71. (In Chinese) [Google Scholar]
  9. Liu, X.X.; Xie, J.C. The interactive relationship between water consumption structure and industrial structure of Shanxi Province. Syst. Eng. 2011, 29, 45–51. (In Chinese) [Google Scholar]
  10. Zhai, Y.Z.; Wang, J.S.; Zheng, J.Q.; Huan, H. Evolution and driving forces of water consumed structure in Beijng during the past 30 years. J. Nat. Resour. 2011, 26, 635–643. (In Chinese) [Google Scholar]
  11. Paola, F.D.; Fontana, N.; Galdiero, E.; Giugni, M.; Savic, D.; Uberti, G.S. Automatic multi-objective sectorization of a water distribution network. Procedia Eng. 2014, 89, 1200–1207. [Google Scholar] [CrossRef]
  12. Paola, F.D.; Fontana, N.; Galdiero, E.; Giugni, M.; Uberti, G.S.; Vitaletti, M. Optimal design of district metered areas in water distribution networks. Procedia Eng. 2014, 70, 449–457. [Google Scholar] [CrossRef]
  13. Paola, F.D.; Galdiero, E.; Giugni, M. A jazz-based approach for optimal setting of pressure reducing valves in water distribution networks. Eng. Optim. 2015. [Google Scholar] [CrossRef]
  14. Paola, F.D.; Galdiero, E.; Giugni, M.; Pugliese, F. Sustainable development of storm-water systems in African cities considering climate change. Procedia Eng. 2015, 119, 1181–1191. [Google Scholar] [CrossRef]
  15. Nunez, B.; Roman, J.E.P.; Souto, J.A.G. Decision support system for the optimal design of district metered areas. J. Hydroinf. 2015. [Google Scholar] [CrossRef]
  16. Marios, S. Global and regional water availability and demand prospects for the future. Nat. Resour. Res. 2004, 13, 61–75. [Google Scholar]
  17. Liu, C.; Bai, M.G. Change in industrial water use in Anhui Province based on LMDI. Resour. Sci. 2012, 34, 2299–2305. (In Chinese) [Google Scholar]
  18. Zhang, L.B.; Xu, Y.J.; Jin, J.L.; Wu, C.G. Analysis of influence factors of regional industry water use in Anhui Province. J. Hydraulic Eng. 2014, 45, 837–843. (In Chinese) [Google Scholar]
  19. Arbues, F.; Barberan, R.; Villanua, I. Price impact on urban residential water demand: A dynamic panel data approach. Water Resour. Res. 2004, 40, 1–9. [Google Scholar] [CrossRef]
  20. Cui, H.S.; Deng, Y.Q. Factors influencing residential water consumption. Water Resour. Prot. 2009, 25, 83–85. (In Chinese) [Google Scholar]
  21. Xu, H. Investigation on Influencing Factors of Domestic Water Use in Beijing; Capital Normal University: Beijing, China, 2012. (In Chinese) [Google Scholar]
  22. Tianjin Municipal Bureau of Statistics. Tianjin Statistical Yearbook 2005–2014; China Statistic Press: Beijing, China, 2005–2014. (In Chinese) [Google Scholar]
  23. Zhao, L.R.; Wu, J.W.; Yang, X.; Huang, Z.Q.; Li, H.Q. Analysis of influence factors of irrigation water quantity of Hetao Irrigation District based on analysis of variance. Water Sav. Irrig. 2009, 7, 1–3. (In Chinese) [Google Scholar]
  24. Liu, Z.X. Analysis on Water Demand Structure Change and Water Consumption Forecasting in Baotou; Northwest A & F University: Xi’an, China, 2013. (In Chinese) [Google Scholar]
  25. Xie, H.T. The Research of Water Resources Utilization and Its Influencing Factor Analysis in Hunan Province; Hunan University: Hunan, China, 2011. (In Chinese) [Google Scholar]
  26. Qin, H.Y. Performance Evaluation and Influence Factor Analysis of Agricultural Water of Ganzhou District: A Perspective of Farmer Water User Associations; Lanzhou University: Lanzhou, China, 2014. (In Chinese) [Google Scholar]
  27. Harun, R.; Muresan, I.C.; Arion, F.H. Analysis of factors that influence the willingness to pay for irrigation water in the Kurdistan Regional Government, Iraq. Sustainability 2015, 7, 9574–9586. [Google Scholar] [CrossRef]
  28. Mai, Z.Y.; He, Z.J.; Wang, X.H. Urban hourly water demand prediction based on principal factors analysis. J. Zhejiang Univ. (Eng. Sci.) 2012, 46, 1968–1974. (In Chinese) [Google Scholar]
  29. Liu, Y.F.; Kong, W. Analysis of industry water utilization change in Beijing based on factor decomposition model. Water Resour. Power 2013, 31, 26–29. (In Chinese) [Google Scholar]
  30. Wu, F.; Zhan, J.Y.; Zhang, Q. Evaluating impacts of industrial transformation on water consumption in the Heihe River Basin of Northwest China. Sustainability 2014, 6, 8283–8296. [Google Scholar] [CrossRef]
  31. Shi, Q.L.; Chen, S.Y.; Shi, C.C. The impact of industrial transformation on water use efficiency in Northwest Region of China. Sustainability 2015, 7, 56–74. [Google Scholar] [CrossRef]
  32. Sun, Y.; Xu, Z.X. Impact factors classification urban water consumption forecast and priority weight analysis for forecasting target. Energy Environ. Prot. (S1) 2008, 34, 114–117. (In Chinese) [Google Scholar]
  33. Tian, S.Y.; Li, X.C.; Yang, B.Z.; Qiu, Y.Q.; Wang, C.Y.; Du, J.K. Xi’an urban residents living water demand factors analysis. China Rural Water Hydropower 2014, 2, 35–37. (In Chinese) [Google Scholar]
  34. Cheng, Z.L.; Zuo, J.L.; Li, H.; Xu, Y.T.; Wang, L.; Wang, Z.P. Analysis of affecting factors for water consumption of new rural residents. Water Sav. Irrig. 2011, 10, 51–59. (In Chinese) [Google Scholar]
  35. Ma, D.C.; Xian, C.F.; Zhang, J. The evaluation of water footprints and sustainable water utilization in Beijing. Sustainability 2015, 7, 13206–13221. [Google Scholar] [CrossRef]
  36. Yan, J.J.; Sha, J.H.; Chu, X. Dynamic evaluation of water quality improvement based on effective utilization of stockbreeding biomass resource. Sustainability 2014, 6, 8218–8236. [Google Scholar] [CrossRef]
  37. Shannon, C.E. A mathematical theory of communication. Mob. Comput. Commun. Rev. 1948, 5, 3–55. [Google Scholar] [CrossRef]
  38. Zhang, S.L.; Zhang, G.L. Comparison of grey correlation calculation methods and its problem. Syst. Eng. 1996, 14, 45–49. (In Chinese) [Google Scholar]
  39. Deng, J.L. Foundation of Grey System; Huazhong University of Science and Technology: Wuhan, China, 2002; pp. 122–209. (In Chinese) [Google Scholar]
  40. Fan, J.G. The grey analysis on grain output and its main input elements in Shaanxi Province from 1983 to 2004. Agric. Res. Arid Areas 2007, 25, 209–212. (In Chinese) [Google Scholar]
  41. Lei, H.; Zhang, X. Anslysis on water use structure change and its driving forces during last 10 years in Shaanxi Province. J. Water Reour. Water Eng. 2012, 23, 125–128. (In Chinese) [Google Scholar]
Figure 1. The map of the research area.
Sustainability 08 00241 g001
Figure 2. The water consumption of Tianjin from 2004 to 2013.
Sustainability 08 00241 g002
Figure 3. The change of equilibrium degree and information entropy of water utilization structure in Tianjin from 2004 to 2013.
Sustainability 08 00241 g003
Table 1. The impact factors of water consumption in literatures.
Water consumptionImpact factor
Agricultural water consumptioncanal lining [23], canal facilities [23], water management [23], planting structure adjustment [23], rainfall [23], cultivated area [4,24], climate factors [4] , grain yield [25], water-saving effect [26], water price [26], irrigation area [26,27]
Industrial water consumptionindustrial water saving [18], economic scale [17,18], industrial structure [17,18], water intensity [17,18], quota effect [17], population effect [24,28], technology effect [29], water reuse efficiency in industry [24,28], gross industrial output value [24,30], GDP [24], fixed assets investment [24,31]
Domestic water consumptionpopulation [32], water saving model [22], price [32], economy development [32], regional difference [32], municipal infrastructure [32], the lowest temperature [28], the maximum and minimum humidity [32], green coverage of built-up area [24], living space per capita [33], consciousness of water saving [34], family income [21], water price [4,35]
Ecological water consumptionper capita green area [8,36]
Table 2. Grey correlation degree between the agricultural water and its impact factors in Tianjin.
Correlation Degree Correlation Degree
Cultivated area0.7357Forestry output value0.6921
Effective water saving irrigation area0.6571Animal husbandry output value0.7087
Effective irrigation area0.6699Fishery output value0.4901
Agricultural output value0.6642Rural electricity consumption0.7071
Table 3. Grey correlation degree between the industrial water and its impact factors in Tianjin.
Industrial output valueWater consumption of ten thousand CNY industrial output valueWater consumption of ten thousand CNY industrial added valueLight industry output valueHeavy industry output valueHigh technology industry output value
Correlation degree0.67680.71440.75200.70560.66450.6786
Table 4. Grey correlation degree between the domestic water and its impact factors in Tianjin.
Resident populationUrban per capita incomePer capita domestic water consumption
Correlation degree0.73750.68980.6806
Table 5. Grey correlation degree between the ecological water and its impact factors in Tianjin.
Per capita green areaGarden green areaPark area
Correlation degree0.49460.70520.6414
Table 6. Grey correlation degree between the water utilization structure and its impact factors in Tianjin.
X 1 X 2 X 3 X 4 X 5 X 6 X 7 X 8 X 9 X 10
Correlation degree0.67870.63260.62950.74780.66360.64200.74340.64170.70240.7726
X 11 X 12 X 13 X 14 X 15 X 16 X 17 X 18 X 19 X 20
Correlation degree0.72010.73830.73010.71260.68040.71510.66900.66530.74460.6934

