1. Introduction
To solve the problem of traffic congestion during peak commuting hours caused by the time-spatial shortage of transport resources is the current focus of multidisciplinary research. Rewarding attempts and progress have been made to address the jobs-housing spatial mismatch and easing the commuting traffic load since early days. For example, the concept of “garden cities” developed by Howard, “organic decentralization” brought forth by Saarinen in the 1940s and, in later generations, the planning and development of satellite cities and new cities, etc.
In the 1960s, spatial mismatch hypothesis was put forth by Kain (1968) [
1] and Mooney (1969) [
2] to establish the spatial relationship between jobs and housing in cities. Empirical studies on housing and employment spatial opportunities of the disadvantaged have mushroomed since by Wilson (1987) [
3], Taylor
et al. (1995) [
4], Holzer and Ihlanfeldt (1994) [
5], and Thompson (1997) [
6]. Jobs-housing balance or spatial match can be gauged from two perspectives: balance of quantity and match of quality [
7,
8]. The latter is also known as the degree of self-containedness and is largely reflected by an “Independence Index” [
9], namely the ratio of the population among residents of a specific area who also work locally to those seeking employment outside it. Several derivative indicators have been established, including the jobs-housing Gini-coefficient [
10], number of jobs within a radius of 30-min traveling distance (or a certain distance) of a specific area [
11],
etc. Levingston (1989) [
12], Deakin
et al. (1989) [
13], discussed the geographical scope for the gauge of the jobs-housing match; Peng (1997) [
14] suggested that it would be more relevant to focus on an area or a floating measurement unit covering a radius of a reasonable commuting distance of a residential area or an employment center. Cervero (1989 [
8], 1996 [
9]) analyzed the housing and employment situation of Chicago and San Francisco suburbs, pointing out that jobs-housing spatial mismatch was not the main contributor to the traffic congestion in cities. Nowlan
et al. (1991) [
15] conducted research into Toronto CBD, Canada; Ewing (1995) [
16] made regression analysis on statistics of the State of Florida, U.S; Weitz
et al. (1997) [
17] compared data of two cities in Oregon, U.S and Lobyaem(2006) [
18] took Bangkok as an example, all presenting evidence that a higher degree of jobs-housing spatial match helped ease the commuting traffic load. Becky P.Y. Loo (2011) [
19] analyzed related data of Hongkong between 1992 and 2002, stating that the government could address issues regarding the commuting traffic and lowering their impact on the environment by implementing the strategy of decentralized employment centers in a synchronous manner. This kind of research works revealed two facts: one is that the issues of jobs-housing imbalance and spatial mismatch are commonly faced by megacities; the other is that the degree of jobs-housing mismatch is positively correlated with the commuting traffic intensity.
At the stage of fast development, large cities and megacities in China witnessed a prevailing suburbanization trend and the phenomenon of jobs-housing separation induced by urban spatial restructuring. Commuting problems that emerged against this background have increasingly riveted the attention of urban and transport studies. In recent years, as urban spatial restructuring spurred on, jobs-housing spatial separation and the increase of commuting distance and time resulted from land and housing reforms as well as the suburban building boom have come under the spotlight of areas such as urban geography, planning science, and sociology, among others. Studies have been conducted around commuting space, distance and time. Analyses were made mainly based on micro-statistics regarding big cities such as Beijing by Li (2007) [
20], Wang and Chai (2009) [
21], Liu
et al. (2009) [
22], Zhou
et al. (2014) [
23], Guangzhou by Zhou and Yan (2006) [
24], Shanghai by Sun
et al. (2010) [
25],and Xi’an by Zhou
et al. (2014) [
26]. In particular, the advantage and positive impact of
Danwei on jobs-housing balance and urban commuting was mostly discussed by Wang and Chai (2009) [
21], Zhang and Chai (2009) [
27], and Zhou
et al. (2014) [
26]. They indicted that given the totally different historical development contributed by
Danwei, recent large-scale urban expansion and free-market approach led to jobs-housing redistribution and resulting commuting distance is becoming longer and longer.
The British newspaper
The Daily Telegraph published a list of world megacities on 25 January 2011 [
28]. On the list were 25 megacities including Shanghai, each with a population of over 10 million. On 21 November 2014, the Chinese government issued the
Notice on Adjusting the Standards for Categorizing City Sizes, adding the category of “megacities” [
29]. According to the notice, the new standards, with permanent residents as the statistical caliber, categorize cities with a population of over 10 million as megacities. By the end of 2014, 6 cities had fallen into this category: Beijing, Shanghai, Tianjin, Chongqing, Guangzhou and Shenzhen. In particular, even the population in Shanghai’s central districts had already topped 11 million with a density of 17,000/km
2. In downtown Shanghai (area within the Inner Ring), job densities of several areas where employment concentrates are more than 50,000/km
2 [
30]. Shanghai has been pursuing polycentric urban spatial form, but the past decade saw a large-scale expansion of key development areas of Shanghai, a massive “suburbanization” drive that broke though the boundaries of central districts (the Outer Ring) and the commercialization of urban housing. Shanghai has made attempts to disperse the population in central districts and lower population density via policies such as “Double Increase and Double Decrease” (to increase green and open spaces and to decrease building height and site density) so as to improve residential conditions. In the process, the spatial distribution of jobs and housing as well as corresponding commuting characteristics have undergone drastic changes.
The degree of intense and concentrated development of the region comprising Shanghai central districts and peripheral areas has overtaken that of some metropolises such as London, New York, Tokyo, etc.; and a complex jobs-housing relationship has already taken shape, giving rise to a more noticeable jobs-housing spatial mismatch. That being the case, on the basis of foregoing researches, the present paper will discuss, in part II, indicators of the influence of jobs-housing balance on the commuting traffic and review literature relevant to the purpose of this research; the next part will be presenting the research philosophy of this paper, explaining the rationale of taking the intensely and concentrated developing region comprising Shanghai central districts and peripheral areas as the research subject and source of data for mobile signaling and transport networks. This part will also discuss typical employment centers with distinct spatial heterogeneity, take the dominant motorized transport mode “rail transport” as the basis for the analysis of transport networks and explain the selection of corresponding commuting distances and accessibility indicators. Then statistics will be studied to show hidden laws and lead to in-depth discussion over possible trends and solutions, including the influence of improved function mix, transport facility supply, population dispersion, and housing policies on jobs-housing spatial distribution and how to make improvements.
4. Results and Analysis
4.1. Commuting Distance
Origin-Destination (OD) analysis was conducted on the spatial information of the user’s place of residence and work yielded by mobile signaling data analysis to calculate the minimum length of path in a transport system, and this length was defined as the “commuting distance”. One disadvantage of the mobile signaling data, compared with data from traditional studies on residents’ travelling, is that only the data concerning users of the metro system could be identified, but not those of other means of transport. Suppose that Z is a collection of all the TAZs, then the average commuting distance for residents or jobs in area I, which includes several TAZs, could be calculated using the following formula:
where
represents the commuting distance (km),
represents the number of people living in TAZ i but working in TAZ j, and
represents the minimum length of path in the transport network linking TAZ i and j.
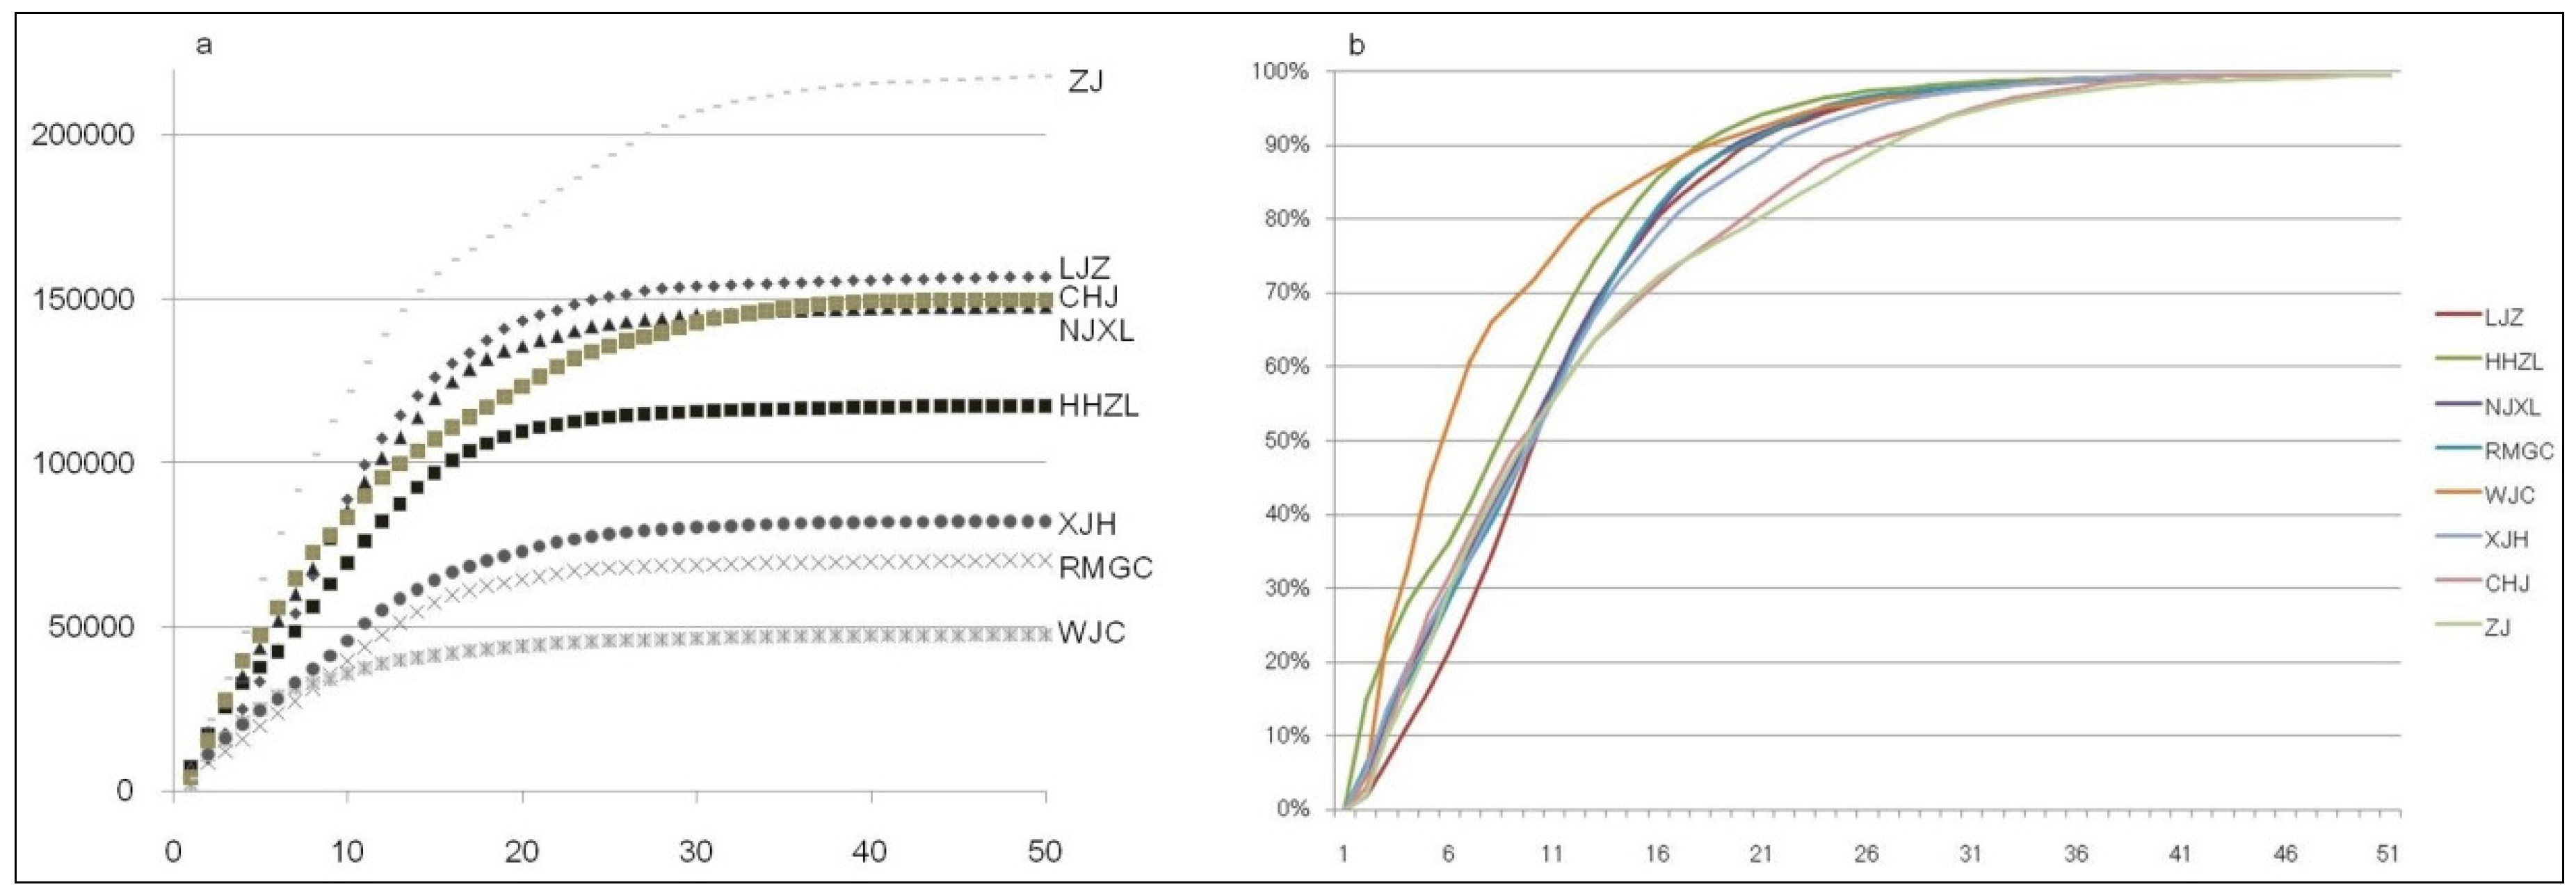
With this method, researchers drew the average commuting distance of each employment center and the cumulative statistics of jobs with different commuting distances, see
Table 3,
Figure 5.
Table 3.
The average commuting distance of employment centers and cumulative percentage of commuters by public transport.
Table 3.
The average commuting distance of employment centers and cumulative percentage of commuters by public transport.
| Commuting Distance (km) | Municipal Centers | Municipal Sub-Centers | Hi-Tech Parks |
|---|
| LJZ | HHZL | NJXL | RMGC | WJC | XJH | CHJ | ZJ |
|---|
| 3 | 11% | 28% | 19% | 17% | 33% | 20% | 19% | 16% |
| 4 | 16% | 32% | 24% | 22% | 44% | 25% | 26% | 22% |
| 5 | 21% | 36% | 30% | 28% | 53% | 30% | 32% | 30% |
| 8 | 42% | 54% | 46% | 44% | 69% | 45% | 48% | 47% |
| 10 | 57% | 65% | 58% | 56% | 75% | 56% | 56% | 56% |
| 14 | 77% | 82% | 77% | 78% | 85% | 75% | 69% | 70% |
| 15 | 80% | 86% | 81% | 82% | 87% | 78% | 72% | 72% |
| 16 | 83% | 88% | 84% | 85% | 88% | 81% | 74% | 74% |
| 17 | 85% | 90% | 87% | 87% | 90% | 83% | 76% | 76% |
| 18 | 88% | 92% | 89% | 89% | 91% | 85% | 78% | 77% |
| 22 | 93% | 96% | 94% | 94% | 94% | 92% | 86% | 84% |
| 23 | 94% | 96% | 95% | 95% | 95% | 93% | 88% | 85% |
| 25 | 96% | 97% | 96% | 97% | 96% | 95% | 90% | 89% |
| 40 | 99% | 100% | 99% | 99% | 99% | 100% | 99% | 99% |
| 41 | 99% | 100% | 100% | 99% | 99% | 100% | 99% | 99% |
| 43 | 100% | 100% | 100% | 100% | 100% | 100% | 100% | 99% |
| 49 | 100% | 100% | 100% | 100% | 100% | 100% | 100% | 100% |
| Average Commuting Dist. (km) | 10.4 | 9.4 | 9.8 | 9.9 | 7.4 | 10.2 | 11.3 | 11.7 |
The average commuting distances for ZH and CHJ were the longest, registering 11.7 and 11.4 km respectively. However, WJC, which is also located in the peripheral area of central districts, had the shortest average commuting distance. Sub-center XJH was found to be similar with the four municipal centers in this regard, and RMGC, NJXL, and HHZL, as the very center of Shanghai with the best developed transport systems, had relatively short average commuting distances.
Higher cumulative percentage of short commuting distance (e.g., less than 3 km) indicates higher degree of jobs-housing spatial match between employment centers and peripheral areas. Among the eight employment centers, five were found to have 30% of their commuters living within a 5 km radius. They are NJXL, RMGC, XJH, CHJ, and ZJ. HHZL had 30% of its commuters living within a 3–4 km radius. WJC and LJZ saw a relatively different distribution of the cumulative percentage of commuters indicated by public transport. For the former, 30% of its commuters lived within a less-than-3 km radius; while for the latter, 6–7 km radius. Generally, the commuting distance of 85% of commuters increased by tiers. For the first tier which included HHZL, RMGC, and NJXL, the commuting distance was 15–16 km; for the second tier which included LJZ and XJH, 17–18 km; and for the third tier which included CHJ and ZJ, 22–23 km. The case with the sub-center WJC remained different. Although its location was similar to that of CHJ and ZJ, the average commuting distance for 85% of its commuters was only 14 km. This might be attributed to two reasons: one is that it had a relatively good jobs-housing spatial match within the accessibility of its public transport system. Namely, the types of job were consistent with the structure of the employable population. The other reason is that its commuting transport system was not developed enough to reach a big area.
Figure 5.
(a) distribution of cumulative commuters; (b) distribution of cumulative ratio of commuters for employment centers in accordance with commuting distances.
Figure 5.
(a) distribution of cumulative commuters; (b) distribution of cumulative ratio of commuters for employment centers in accordance with commuting distances.
4.2. Accessibility
The present study used the cumulative opportunity model to calculate the number of employees that could reach an employment center in a specific time, and this number represented the accessibility of the center.
where t refers to the threshold time (min);
represents the opportunity of TAZ j. j refers to the TAZ with a commuting time to TAZ i that is less than t.
The threshold value t is normally determined in accordance with the size of the city or the experience value. The present study, taking into account the result of transport surveys, drew statistics of several time slots with a 15-min interval. Six time slots including minute 0–15, 15–30, 30–45, 45–60, 60–75, and 75–90 saw cumulative percentage of commuters of more than 95%. Another key parameter was people’s travel time utilizing the public transport system. The data included both onboard and off-board time. The former was drawn out of a public transport passenger distribution model, including the pull-in time and running time of the vehicle. The speed of different metro and bus lines were set according to reality. The off-board time included the time for passengers to get on and off the vehicle and time they spent walking and waiting during transfers. The walking speed was set to be 4 km/h.
Table 4,
Table 5,
Table 6,
Table 7,
Table 8,
Table 9,
Table 10 and
Table 11 shows particular indicators of employment center accessibility.
Table 4.
Indicators of LJZ employment center accessibility calculated by public transport.
Table 4.
Indicators of LJZ employment center accessibility calculated by public transport.
| Time Interval (min) | Area (km2) | Employment Population | Density of Employment Population (per km2) | Commuting Population | Cumulative Percentage (%) | Percentage of Commuters in Employment Population (%) |
|---|
| 15 | 6.8 | 75,336 | 11,085 | 12,032 | 8 | 16 |
| 30 | 50.7 | 778,113 | 15,362 | 29724 | 27 | 4 |
| 45 | 151.4 | 2,269,195 | 14,984 | 53,707 | 61 | 2 |
| 60 | 263.7 | 2,200,395 | 8343 | 34,672 | 83 | 2 |
| 75 | 346.7 | 1,839,197 | 5305 | 17,043 | 94 | 1 |
| 90 | 484.9 | 1,197,642 | 2470 | 5776 | 97 | 0 |
| Total | 1304.2 | 8,359,879 | - | 157,033 | - | - |
Table 5.
Indicators of HHZL employment center accessibility calculated by public transport.
Table 5.
Indicators of HHZL employment center accessibility calculated by public transport.
| Time Interval (min) | Area (km2) | Employment Population | Density of Employment Population (per km2) | Commuting Population | Cumulative Percentage (%) | Percentage of Commuters in Employment Population (%) |
|---|
| 15 | 14.2 | 252,248 | 17,813 | 22,156 | 19 | 9 |
| 30 | 74.4 | 1,291,626 | 17,355 | 28,589 | 43 | 2 |
| 45 | 188.6 | 2,451,507 | 12,996 | 33,744 | 72 | 1 |
| 60 | 271.0 | 2,138,823 | 7893 | 20,957 | 90 | 1 |
| 75 | 401.8 | 1,407,286 | 3502 | 7234 | 96 | 1 |
| 90 | 621.7 | 1,296,975 | 2086 | 3077 | 98 | 0 |
| Total | 1571.8 | 8,838,464 | - | 117,707 | - | - |
Table 6.
Indicators of NJXL employment center accessibility calculated by public transport.
Table 6.
Indicators of NJXL employment center accessibility calculated by public transport.
| Time Interval (min) | Area (km2) | Employment Population | Density of Employment Population (per km2) | Commuting Population | Cumulative Percentage (%) | Percentage of Commuters in Employment Population (%) |
|---|
| 15 | 14.0 | 244,471 | 17,492 | 24,040 | 16 | 10 |
| 30 | 76.0 | 1,405,245 | 18,487 | 38,865 | 42 | 3 |
| 45 | 177.0 | 2,070,720 | 11,696 | 36,963 | 67 | 2 |
| 60 | 272.4 | 223,2071 | 8193 | 29,372 | 87 | 1 |
| 75 | 397.6 | 1,550,188 | 3899 | 11,702 | 95 | 1 |
| 90 | 625.0 | 1,465,813 | 2345 | 4492 | 98 | 0 |
| Total | 1562.1 | 8,968,509 | - | 148,122 | - | - |
Table 7.
Indicators of RMGC employment center accessibility calculated by public transport.
Table 7.
Indicators of RMGC employment center accessibility calculated by public transport.
| Time Interval (min) | Area (km2) | Employment Population | Density of Employment Population (per km2) | Commuting Population | Cumulative Percentage (%) | Percentage of Commuters in Employment Population (%) |
|---|
| 15 | 13.6 | 236,154 | 17,338 | 11,096 | 16 | 5 |
| 30 | 82.0 | 1,488,967 | 18,157 | 18,403 | 42 | 1 |
| 45 | 188.2 | 2,392,359 | 12,711 | 20,869 | 71 | 1 |
| 60 | 294.4 | 2,188,022 | 7432 | 12,991 | 90 | 1 |
| 75 | 412.6 | 1,436,236 | 3481 | 4260 | 96 | 0 |
| 90 | 731.3 | 1320,866 | 1806 | 1688 | 98 | 0 |
| Total | 1722.1 | 9,062,604 | - | 70,452 | - | - |
Table 8.
Indicators of WJC employment sub-center accessibility calculated by public transport.
Table 8.
Indicators of WJC employment sub-center accessibility calculated by public transport.
| Time Interval (min) | Area (km2) | Employment Population | Density of Employment Population (per km2) | Commuting Population | Cumulative Percentage (%) | Percentage of Commuters in Employment Population (%) |
|---|
| 15 | 10.7 | 128,047 | 12,012 | 12,431 | 26 | 10 |
| 30 | 43.1 | 727,434 | 16,862 | 15,069 | 58 | 2 |
| 45 | 90.1 | 1,132,731 | 12,578 | 7749 | 74 | 1 |
| 60 | 162.5 | 1,983,802 | 12,205 | 5954 | 86 | 0 |
| 75 | 253.8 | 1,816,580 | 7158 | 3466 | 93 | 0 |
| 90 | 341.0 | 1,586,868 | 4654 | 1913 | 97 | 0 |
| Total | 901.2 | 7,375,462 | - | 47,813 | - | - |
Table 9.
Indicators of XJH employment sub-center accessibility calculated by public transport.
Table 9.
Indicators of XJH employment sub-center accessibility calculated by public transport.
| Time Interval (min) | Area (km2) | Employment Population | Density of Employment Population (per km2) | Commuting Population | Cumulative Percentage (%) | Percentage of Commuters in Employment Population (%) |
|---|
| 15 | 11.7 | 198,455 | 16,986 | 13,414 | 16 | 7 |
| 30 | 66.2 | 1,062,090 | 16,047 | 18,298 | 38 | 2 |
| 45 | 180.1 | 2,172,768 | 12,061 | 23,483 | 67 | 1 |
| 60 | 268.8 | 2,337,475 | 8697 | 15,765 | 86 | 1 |
| 75 | 417.3 | 1,708,874 | 4095 | 7165 | 95 | 0 |
| 90 | 552.6 | 1,293,784 | 2341 | 2618 | 98 | 0 |
| Total | 1496.7 | 8,773,447 | - | 82,488 | - | - |
Table 10.
Indicators of CHJ Hi-tech park accessibility calculated by public transport.
Table 10.
Indicators of CHJ Hi-tech park accessibility calculated by public transport.
| Time Interval (min) | Area (km2) | Employment Population | Density of Employment Population (per km2) | Commuting Population | Cumulative Percentage (%) | Percentage of Commuters in Employment Population (%) |
|---|
| 15 | 22.5 | 253,221 | 11,261 | 35,105 | 23 | 14 |
| 30 | 68.4 | 812,203 | 11,871 | 30,673 | 44 | 4 |
| 45 | 134.5 | 1,403,952 | 10,439 | 27,527 | 62 | 2 |
| 60 | 278.1 | 2,145,147 | 7713 | 24,869 | 79 | 1 |
| 75 | 379.9 | 2,211,002 | 5820 | 17,521 | 90 | 1 |
| 90 | 567.7 | 1,777,940 | 3132 | 9116 | 96 | 1 |
| Total | 1451.2 | 8,603,466 | - | 150,374 | - | - |
Table 11.
Indicators of ZJ Hi-tech park accessibility calculated by public transport.
Table 11.
Indicators of ZJ Hi-tech park accessibility calculated by public transport.
| Time Interval (min) | Area (km2) | Employment Population | Density of Employment Population (per km2) | Commuting Population | Cumulative Percentage (%) | Percentage of Commuters in Employment Population (%) |
|---|
| 15 | 35.5 | 173,716 | 4898 | 64,096 | 29 | 37 |
| 30 | 81.9 | 503,157 | 6143 | 45,998 | 50 | 9 |
| 45 | 158.3 | 1,403,160 | 8864 | 35,289 | 66 | 3 |
| 60 | 254.3 | 2,093,845 | 8233 | 28,927 | 80 | 1 |
| 75 | 360.3 | 1,942,320 | 5391 | 20,295 | 89 | 1 |
| 90 | 422.0 | 1,695,829 | 4019 | 14,485 | 95 | 1 |
| Total | 1312.2 | 7,812,025 | - | 218,955 | - | - |
According to the indicator of covered area (spatial area covered by public transport within a specific time period with the employment center as the starting point) in tables above, three municipal centers including HHZL, NJXL, and RMGC and the municipal sub-center of XJH were close to each other in terms of the level of accessibility; LJZ showed a lower accessibility indicated by the people who commute by public transport, especially within 30 min; CHJ and ZJ Hi-tech park were found to have slightly lower accessibility than most municipal centers; and the WJC sub-center had the lowest level of accessibility. This indicator illustrated the accessibility of the public transport system and the pedestrian network and their influence on surrounding areas.
According to the indicators of employment population and its density (which is dividing employment population by the covered area), a strong positive correlation was found between the employment population and the area, while the density of employment population decreased as the radius of the covered area increased. For most employment centers, the density of areas that required a commuting time of more than 45 min would drop to less than 10,000/km2 area is consistent with the current spatial distribution features of Shanghai’s permanent residents. ZJ hi-tech park, located in the peripheral area of the Pudong New District, showed a considerably lower employment population density in its non-central areas.
Combining the indicators of employed population and area covered and analyzing the data within 15 min, it would be possible to evaluate the development stage of areas where employment centers are located from the perspectives of low-carbon urban development and jobs-housing balance, thus identifying the degree of jobs-housing match. In another word, only under the conditions that there is a relatively good jobs-housing match between the employment center and its peripheral areas can the situation of excess commuting be improved and distribution features of the commuting traffic be adjusted by altering external circumstances.
According to the indicators of cumulative commuter percentage and the proportion of commuters in the employment population, higher cumulative percentage of short commuting time (gauged against the current average commuting time of Shanghai—42.7 min. e.g., less than 45 min) indicates a better self-adjusting ability of the employment center to achieve self-contained jobs-housing balance with nearby areas and a better quality of such a balance. Over 80% of commuters live in the area which required a 60-min travel time or less to the employment center (the percentage of CHJ was a slightly lower 79%), that percentage even reached 90% as for HHZL and RMGC. According to the indicators under the 15-min interval, the cumulative percentage and the percentage of commuters in the employment population of LJZ were both quite low, which corresponded to the feature of land use of LJZ and its peripheral areas: high overall development with a major focus on business use; HHZL, RMGC, NJZL, and XJH were similar to each other in this regard. They all showed a relatively low percentage of short-distance commuting with a cumulative percentage of 16%–19% and a percentage of commuters in the employment population of less than 10%. Besides, the cumulative percentages of these four centers under the 30-min interval were also close to each other; CHJ, WJC, and ZJ were found to have similar cumulative percentages, all over 20%. In particular, ZJ showed a cumulative percentage of nearly 30% and a percentage of commuters in the employment population of 37%. If the cumulative percentage is low, decisions need to be made as to whether to reorganize the residential land in the area accessible within a specific time period or to enhance the connection between the employment center and public transport in the residential communities. Further relating the cumulative percentage of commuters to the employed population covered and its density would facilitate the decision-making process.
5. Discussions
5.1. Overall Evaluation of Employment Centers
Based on the basic information and statistics of commuting distance and accessibilities of the eight employment centers and taking into account the initial analysis, the study evaluated the centers in different aspects including the development level, function mix, transport support, local environment, service capability,
etc. Through horizontal comparison, the study categorized employment centers, identified their advantages and disadvantages and tried to figure out the possibilities for improvement. As for some cumulative parameters, 45 min was chosen as the time interval based on the fact that the average travel time of central districts was 42.7 min in 2014, see
Table 12.
Table 12.
Evaluation indicators for employment centers.
Table 12.
Evaluation indicators for employment centers.
| Evaluation Dimension | Indicator | Municipal Center | Municipal Sub-Center | Hi-Tech Park |
|---|
| LJZ | HHZL | NJXL | RMGC | WJC | XJH | CHJ | ZJ |
|---|
| Level of Development | Job Density (10,000/km2) | 9.2 | 5.1 | 7.8 | 7 | 2.7 | 6.3 | 3 | 1.4 |
| Function Mix | Jobs-Housing Ratio | 10.3 | 2.0 | 3.2 | 2.6 | 1.1 | 2.6 | 2.8 | 1.8 |
| Transport Support | Area Reachable within 45 min (km2) | 208.9 | 277.2 | 267.0 | 283.8 | 143.9 | 258.0 | 225.4 | 275.7 |
| Cumulative Commuter Percentage within 45 min (%) | 61 | 72 | 67 | 71 | 74 | 67 | 62 | 66 |
| Local Environment | Employment Population Density in Area Reachable within 45 min (10,000/km2) | 1.5 | 1.4 | 1.4 | 1.5 | 1.4 | 1.3 | 1.1 | 0.8 |
| Service Capability | Cumulative Number of Commuters within 45 min (10,000) | 9.5 | 8.4 | 10.0 | 5.0 | 3.5 | 5.5 | 9.3 | 14.5 |
| Percentage of Cumulative Commuters within 45 min in Employment Population (%) | 22 | 12 | 14 | 7 | 12 | 10 | 20 | 49 |
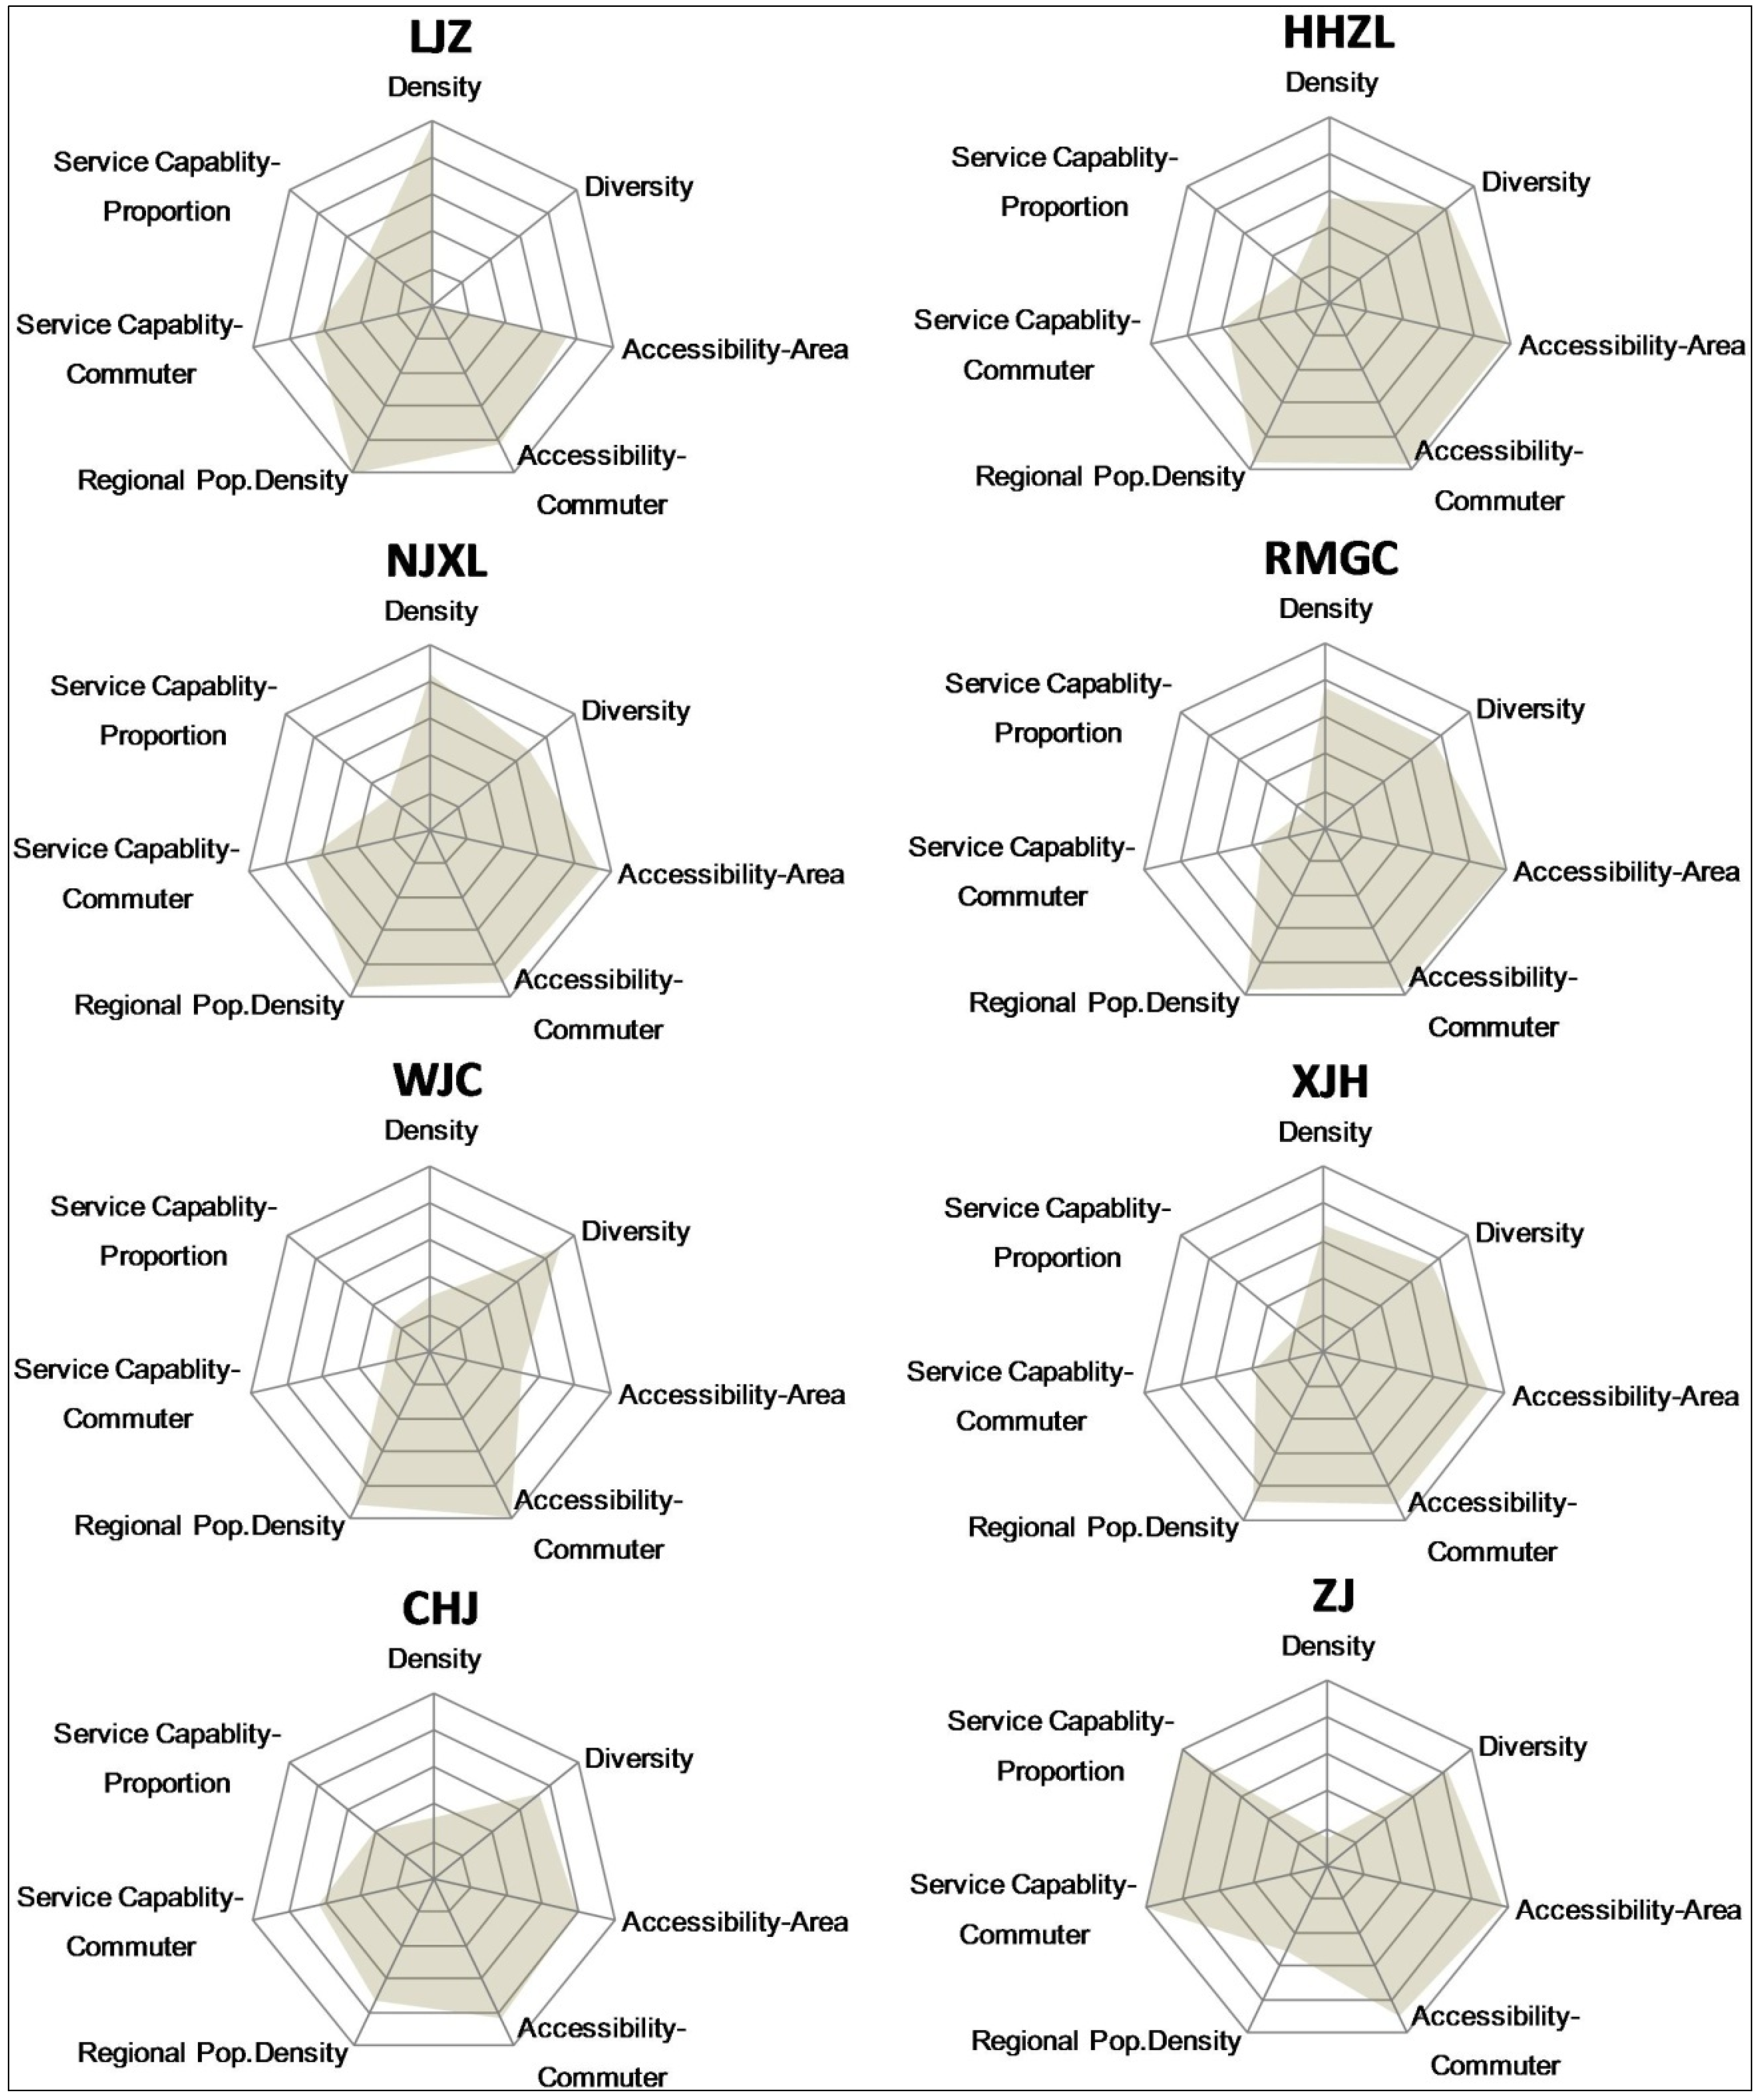
First, the evaluation criteria needed to be pinned down. For example, the more an area is developed, the higher the land use efficiency is; the closer the jobs-housing ratio is to 1, the greater the function mix is; the more the area reachable within 45 min and higher the cumulative percentage of commuters is, the better the transport support is; the higher the employment population density is in the peripheral areas, the better the environment is; the more the cumulative number of commuters is within a 45-min interval, the higher the percentage of commuters in the employment population and the greater the service capability toward specific areas in the city is. Then the highest or lowest value for each indicator was selected as the benchmark (5 points) to calculate the difference between the indicator value and corresponding benchmark. The final score of the indicator was then drawn according to the percentage that the difference value accounted for. Based on the results, a five-dimensional and seven-indicator radar diagram of each employment center was drawn, see
Figure 6.
According to macro analysis and overall evaluation if the radar maps, the eight employment centers selected by the study could be divided into the following categories:
The first is the employment center with a gathering power, including three municipal centers—HHZL, NJXL, RMGC—and one sub-center, that is XJH. They were similar with regard to quite a few indicators, implying their superiority in terms of location, function, transport, etc. in the urban spatial structure. Meanwhile, they are the most traditional city centers of Shanghai. As regards the influence on peripheral areas, individual employment centers did not demonstrate a high indicator value concerning the employment population gathering effect. The main reason could be that the population of the inner city kept spreading outward and its function turned more into business. Under such circumstances, the inner city as a whole became an area of core functions with the greatest gathering power, but individually, indicators of them did not appear to be significant. Therefore, central districts, namely the inner city, need to disperse both the population and public service. Otherwise, the spatial mismatch of central districts of Shanghai would be intensified and it would be harder for peripheral areas to become influential employment centers.
Figure 6.
Multi-dimensional evaluation radar maps of employment centers.
Figure 6.
Multi-dimensional evaluation radar maps of employment centers.
The second is the employment center with improvable functions, including the CHJ hi-tech park and WJC sub-center. The former demonstrated quite balanced indicator values but would score a better development only after the improvement of functions and supporting facilities; while the latter showed distinct advantages and shortcomings which were somewhat related to temporal and spatial factors. For example, due to a relatively short development history, centers in this category lay focus mainly on a mix of functions which are not well developed and therefore have a limited service capability. Additionally, due to geographical disadvantages, their current supporting facilities such as the metro system are relatively weak. These centers, through improvement of functions, would make positive contributions to the jobs-housing spatial adjustment of their peripheral areas.
The third is the employment center with local adjustment potentials, including LJZ municipal center and the ZJ hi-tech park. As an area developed at a later stage of urban development of Shanghai, LJZ grows along with the Pudong district and now has the highest job density among central districts. Its function has been monotonous since the very beginning and that remains one of its limits though attention has been paid to the function mix. Meanwhile, since it is located in the coastal area, the transport facilities were relatively weak. To solve the problem, efforts need to be made to enhance the transport system, promote the development of mutually complementary functions within a certain accessibility scope (e.g., 30 min) and improve the local jobs-housing spatial match. ZJ has a distinctly positive impact on peripheral areas. However, it remains a relatively sparsely populated area with low development density. The increase of jobs and expansion of employment scope would inevitably lead to longer commuting distance and higher investment in transport resources.
5.2. Improvements in Favor of the Commuters
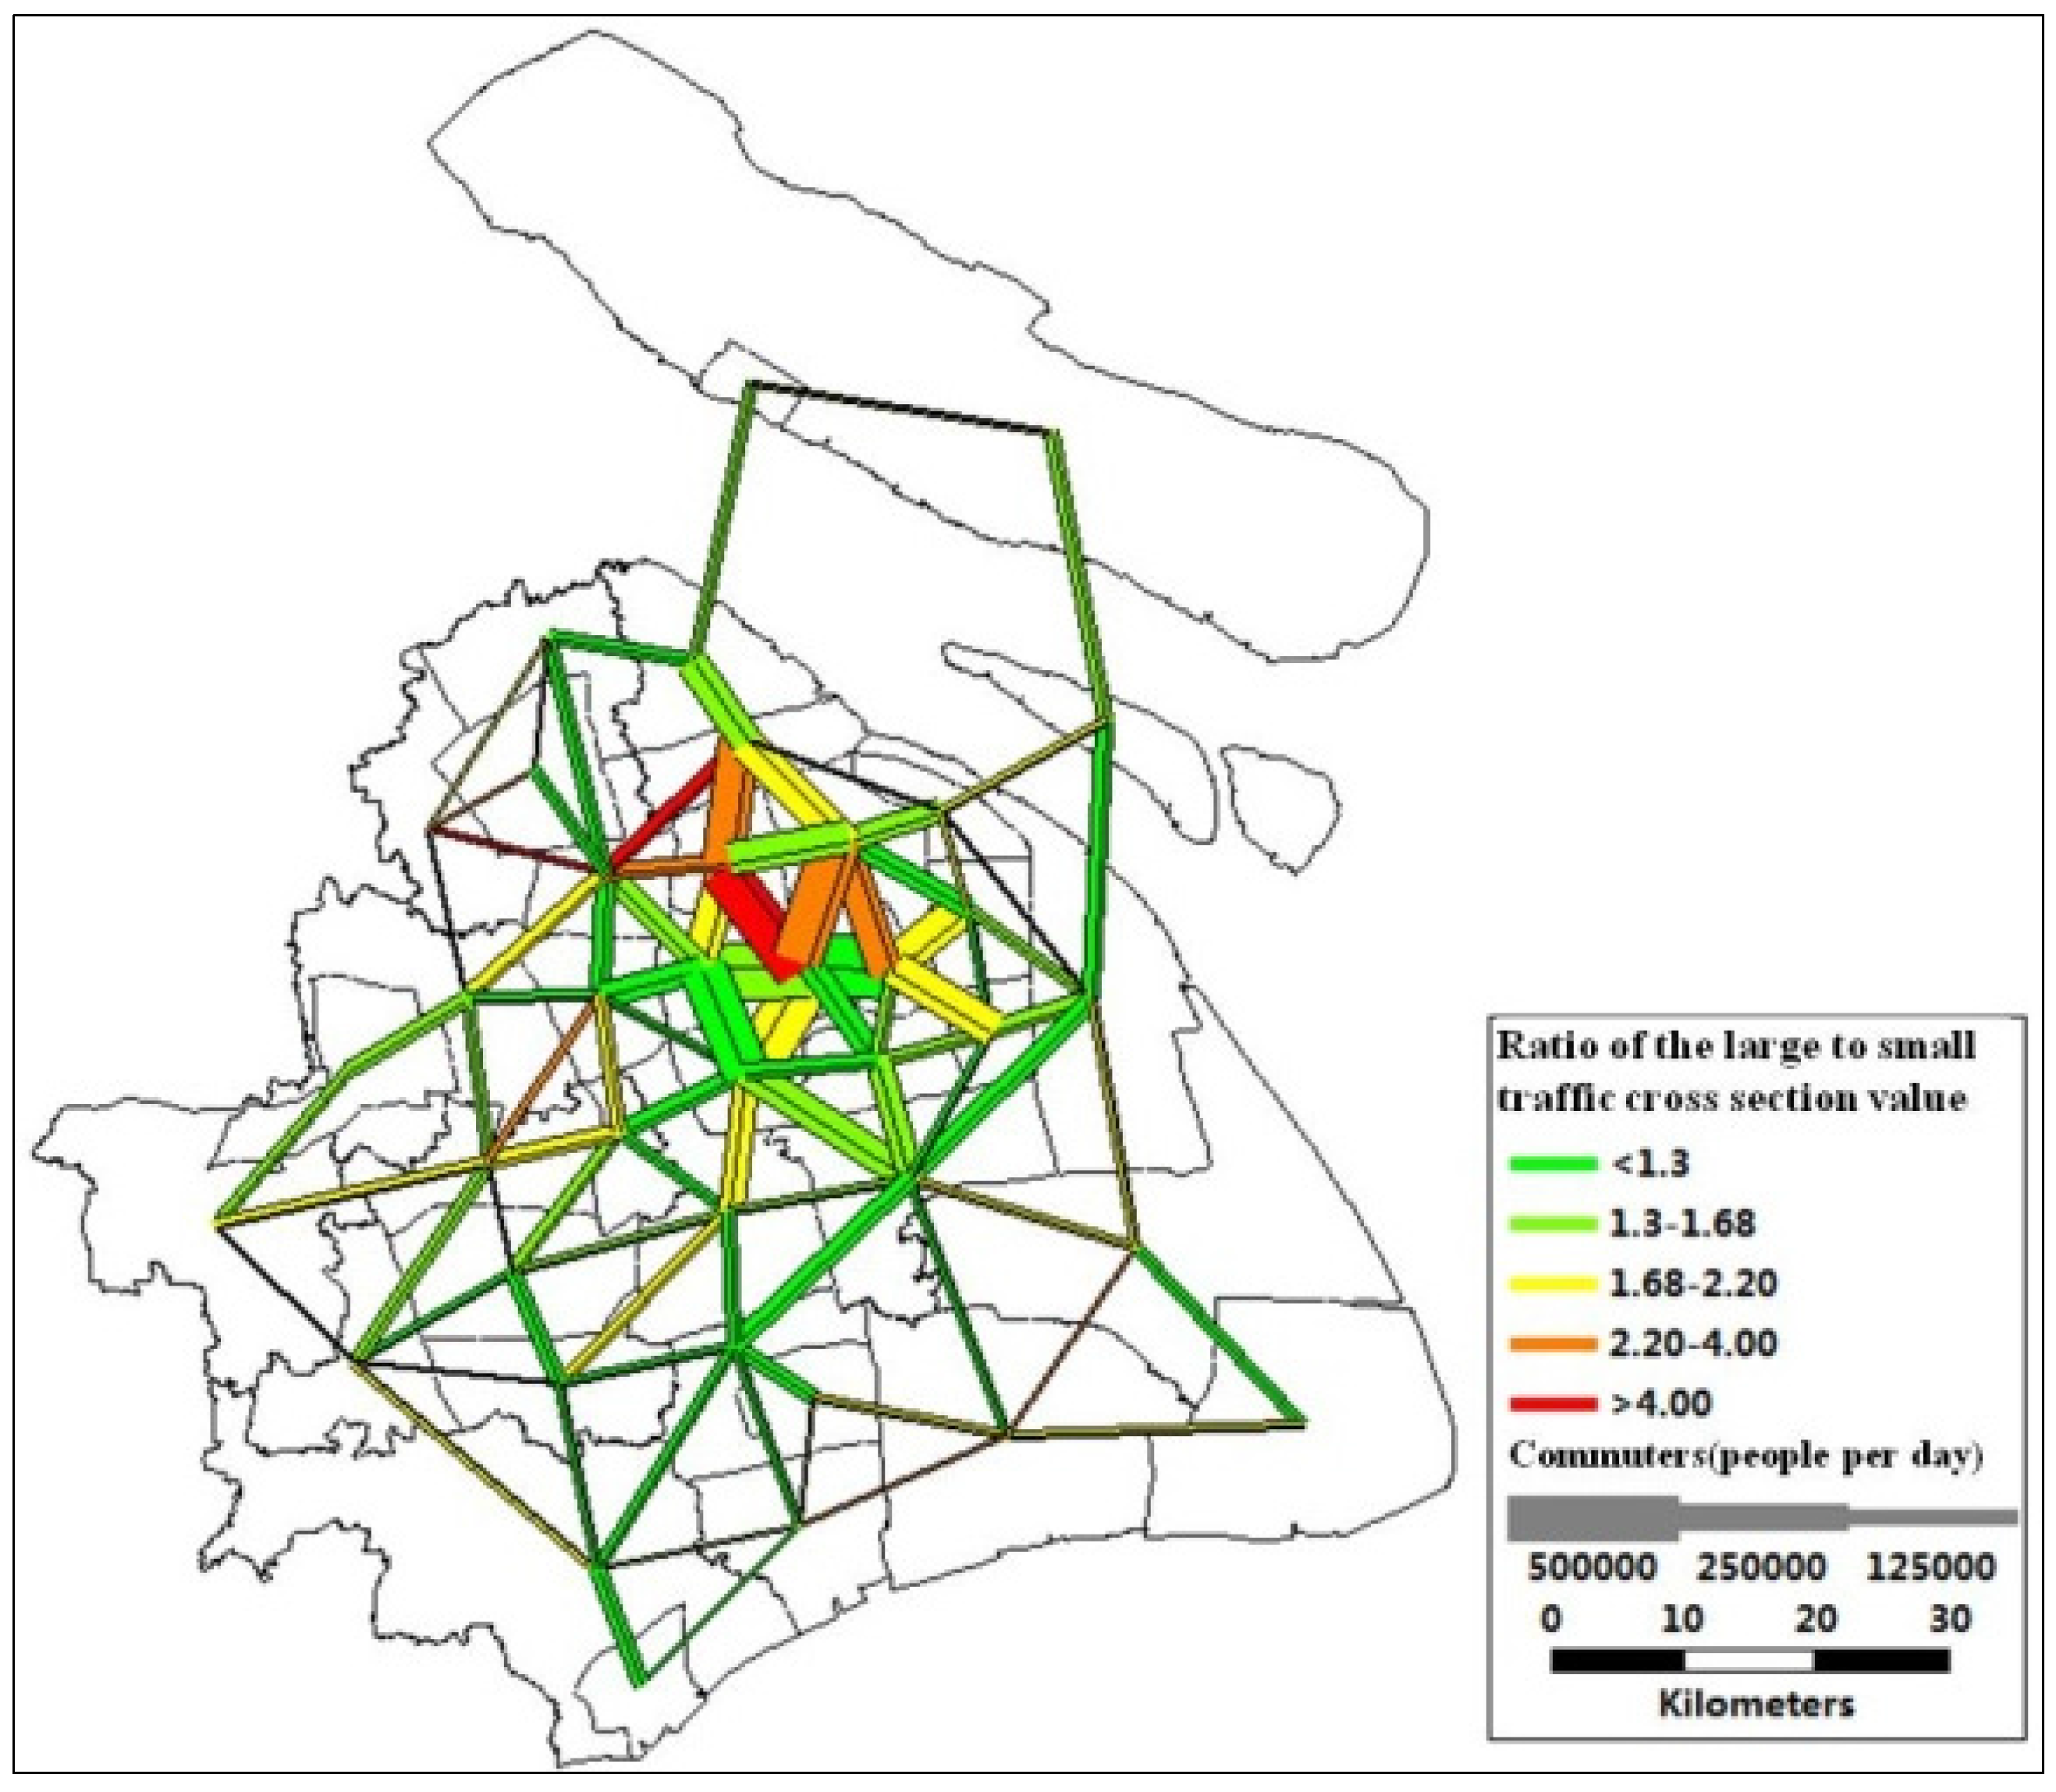
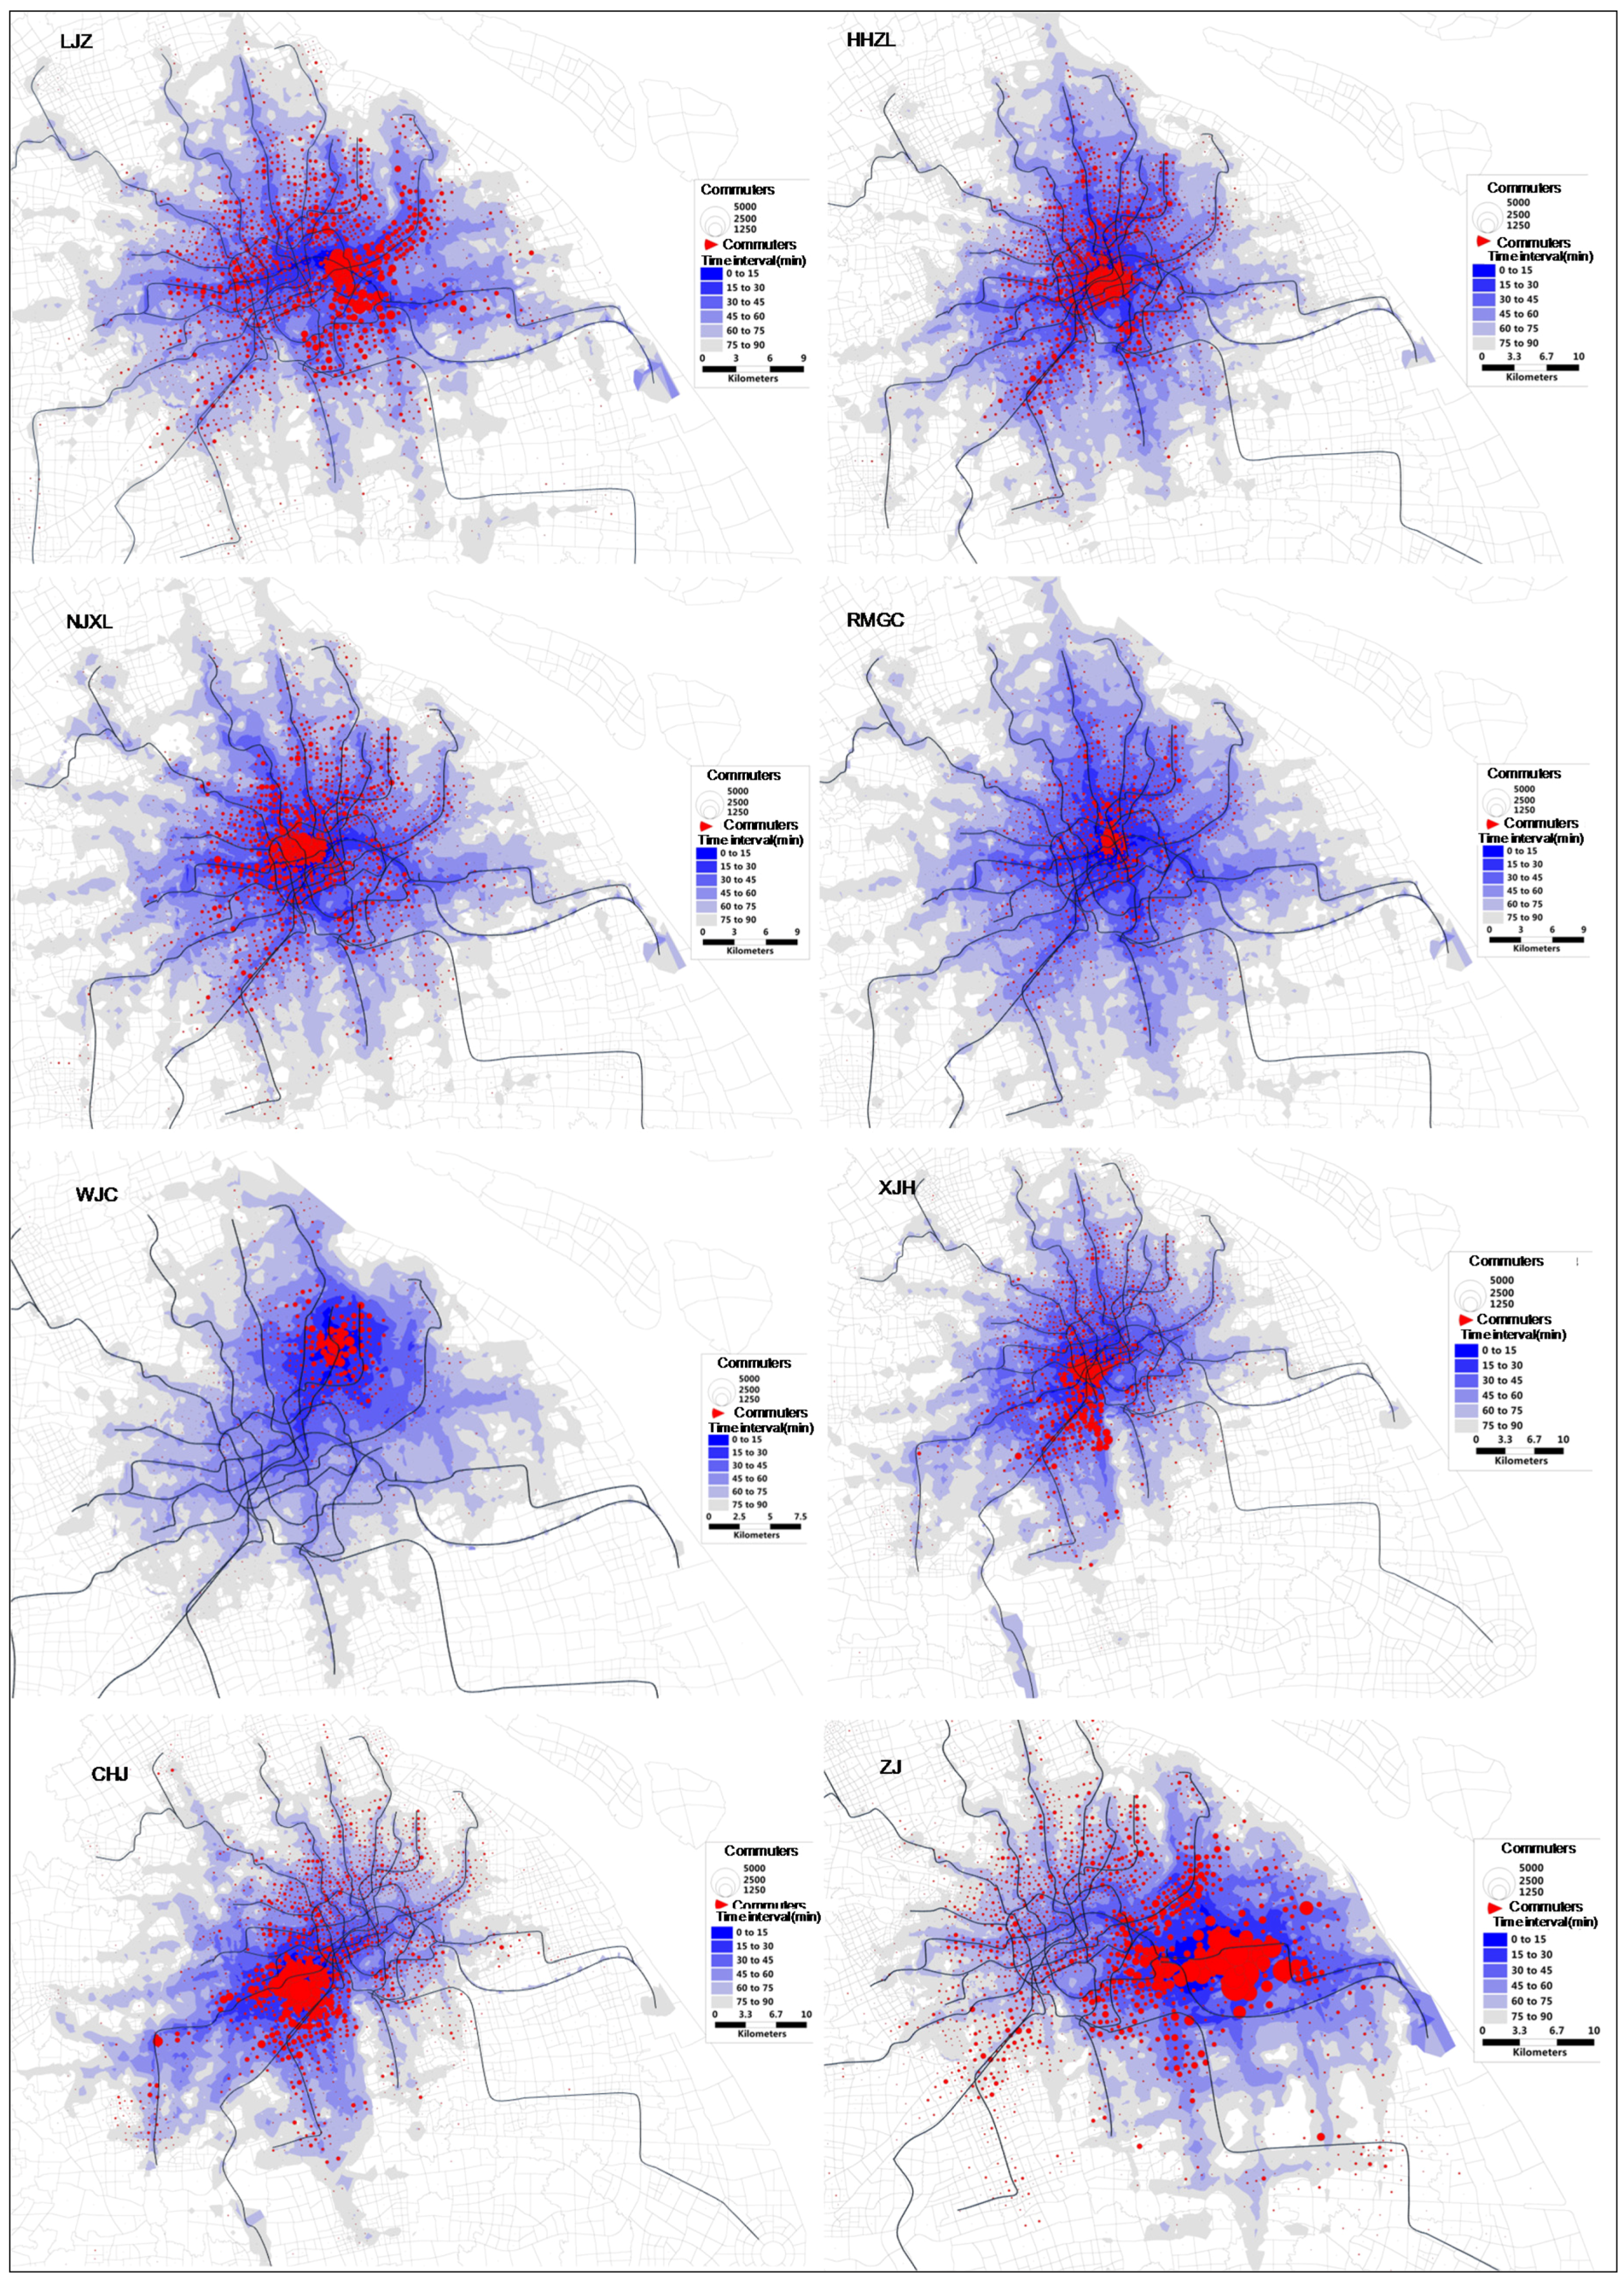
According to the distribution of commuters within the employment centers and its superposition with the public transport network isochronous data, commuters prefer a geographical proximity between their houses and workplaces (see
Figure 7). Specifically, the indicators showed that with proper transport support, commonalities could be found among the cumulative percentages of commuters who travel short distance, for instance the above-mentioned finding that the percentage of commuters living with a 3–4 km radius accounted for about 30%. However for megacities, this is of low probability. Due to the high housing costs, most commuters have to buy houses in the peripheral areas of central districts or suburbs at the expense of short commuting time. This is proved by another finding mentioned earlier that 85% of the commuters lived within a 15 or 22 km radius and their average commuting time registered about 60 min.
Under such circumstances, for a large city or megacity, the most effective way is to improve the efficiency of its public transport system so as to support spatial activities of large scale and scope. Only in so doing could the commuters find suitable places of residence in a broader area. A prerequisite for the improvement of efficiency is the enhancement of the system capacity. Most importantly, a balance should be built between demand and supply. Major efforts include increasing the capacity and efficiency of the radiative public transport corridor and adding ring roads or tangent roads, connecting employment centers in the peripheral areas to the transport hubs. In this way, the scale effect of the population-gathering transport hubs could be fully utilized to improve the transport accessibility and attractiveness of those employment centers and balance the passenger flows of the radiative corridors. This is a discussion over the impact of the improvement of jobs-housing spatial mismatch on residents’ commuting behaviors from the perspective of an improved transport system.
On the basis of an improved public transport network, attempts need to be made to carry out further jobs-housing spatial adjustments and achieve a jobs-housing match within a reasonable scope. This is to ensure that public resources of all sorts could be utilized to the fullest at the lowest cost. On the condition that the development of central districts has already broken the boundaries of the Outer Ring, expanding from a spatial scope of around 600 km2 to 1000 km2, the radius extended from 10 km to 15–20 km with part of the roads and corridors seeing their spatial activity scopes almost doubled. Therefore, it is necessary to establish more employment centers in the peripheral areas of the central districts. The accessibility analysis made by the study is also applicable to the new employment centers. It is feasible to connect them to the transport hubs around the Middle Ring or outside the Outer Ring so as to reinforce their role as employment centers and their public service function. By combining them with the current transport corridors, their influence on surrounding areas would be enhanced, eventually leading to a decrease of the commuting time and improvement of residents’ life.
Figure 7.
Distribution of commuters in employment centers and its superposition with the public transport network isochronous data.
Figure 7.
Distribution of commuters in employment centers and its superposition with the public transport network isochronous data.
6. Conclusions
The study analyzed the jobs-housing spatial relations of Shanghai’s central districts from the perspective of the commuting transport, illustrating, at a macro level, the issue of jobs-housing spatial mismatch on the basis of the commuting distance data and presenting the reality of jobs-housing spatial mismatch via the superposition of commuter distribution and accessibility indicators calculated by the cumulative opportunity model. The author found that, according to the analysis of typical employment centers, jobs-housing spatial mismatch was inevitable under some conditions. It took shape during the formation of the urban spatial structure and was resulted from the lag of policies. The mismatch itself is hypothetical and therefore needs to be proved by the change of commuting distances, employment center accessibility, and commuter distribution. In the meantime, it is more relevant to discussion how to address the mismatch of the slow variable of spatial structure through the adjustment of fast variables.
Therefore, the study is not of the purpose of proving that jobs-housing mismatch exists in Shanghai, nor does it aim at identifying indicators that could be used to prove the mismatch. Instead, it analyzed the impact of a hypothetical jobs-housing mismatch on the commuting characteristics and behaviors so as to prove the existence of it and more importantly, identify possible ways to improve jobs-housing spatial distribution and the commuting transport system. One strategy is to improve the accessibility or functions of the employment centers, namely, to adjust the transport system or enhance its functions; another is to increase residences in areas with good accessibility to employment centers; a third is to establish more employment centers in areas with good overall accessibilities such as the passenger flow breaking points on public transport corridors.
The study attempts to establish a planning and analyzing method which can be used to identify, in the spatial systems of megacities, the problems of jobs-housing imbalance and spatial mismatch, as well as defects in the transport network. Such a method can hopefully be used to optimize the utilization of land and spatial layout of city functions, improve the public transport system, relieve the excessive commuting traffic load and meet the goal of low carbon and energy-saving transport. Such a planning issue is commonly faced by megacities in China and the world as a whole as they develop rapidly. Findings of the study can be drawn upon by other megacities and fast developing big cities.
At present, theoretical and empirical studies on the relationship between jobs-housing balance and the commuting traffic mainly focus on excess commuting and transport accessibility. While studies on the former discuss the overall efficiency of a city or a specific macro area and are used to evaluate the development of personal motor vehicles and public transport networks in the city; studies on the latter attach emphasis on a local area or a group and are more used to analyze and address specific problems. First, on the basis of the present study and following the methodology of research on excess commuting, we analyzed the overall development situations of Shanghai central districts, discussed the service quality of personal motor vehicles and the public transport network and compared the findings with situation in Beijing. Second, commuters of an employment center who use their personal vehicles were separated from those relying on the public transport. Competent authorities of Shanghai lately released part of the public transport IC card record, which could be utilized together with the mobile signaling data to reinforce the accuracy of accessibility analysis based on the road networks for motor vehicles. Third, the accessibility analysis in the present research was developed upon the cumulative opportunities model and is fitter for case studies. We are currently improving the accessibility model so as to better assess the service efficacy or geographical locations of employment centers. In so doing, we could evaluate the results against the current concentrated employment size and thus expound on the degree of match between different transport networks and jobs-housing spatial development.


