Article

Neighborhood Built Environments Affecting Social Capital and Social Sustainability in Seoul, Korea

1
Department of Urban Planning and Housing Policy, Gyeonggi Research Institute, 1150 Gyeongsu-daero, Jangan-gu, Suwon 16207, Korea
2
Department of Urban Planning and Engineering, Hanyang University, 222 Wangsimni-ro, Seongdong-gu, Seoul 04763, Korea
*
Author to whom correspondence should be addressed.
Sustainability 2016, 8(12), 1346; https://doi.org/10.3390/su8121346
Submission received: 12 September 2016 / Accepted: 4 November 2016 / Published: 21 December 2016
(This article belongs to the Section Sustainable Urban and Rural Development)

Abstract

:
This study investigates the theoretical causal relationships among neighborhood built environments, social capital and social sustainability using structural equation modeling (SEM), through a case study in Seoul, Korea. The dataset consisted of responses from a questionnaire survey completed by 500 respondents. Neighborhood built environments were also objectively measured by GIS analysis, using a 250-m buffer based on the home addresses of the respondents. A total of four latent variables of the neighborhood physical environments were used in the model: perceived neighborhood environment, characteristics of the residential area, land use diversity and accessibility to parks and sport facilities. Respondents’ demographic and socioeconomic characteristics were also considered in the model. The results of the analysis indicate that there is a statistically significant causal relationship among neighborhood physical environment, social capital and social sustainability. The results also suggest that neighborhood-level spatial and non-spatial factors can influence the formation of social capital that affects social sustainability. Moreover, this result indicates the possibility that urban spatial planning can play a critical role in social issues.

1. Introduction

Urban regeneration has been a recent key issue of urban policy in Korea. From the mid-20th century, Korea has experienced high-speed economic growth concentrated only on quantitative growth and economic benefit. In accordance with this, cities in Korea have also grown, focusing on land speculation and increased size. Until recently, large-scale renewal projects, which can be characterized as “demolish and redevelop”, have represented a significant proportion of urban planning schemes. Consequently, traditional settlements were destroyed, and communities and their sense of place have also vanished. The Yongsan Tragedy of 2009 [1,2] raised public alarm about conventional redevelopment schemes and resulted in the wide dissemination of the idea that urban planning should consider more than economic aspects.
The recently-announced Seoul Urban Regeneration Comprehensive Plan and Seoul Sustainable Development Master Plan [3,4,5,6] reflect the paradigm shift from economic-centered to sustainability-centered urban redevelopment. Both of these new plans for Seoul focus on happiness, quality of life and other social values. In addition, along with economic and environmental aspects, the social aspect is considered part of the sustainability of Seoul. The social sustainability issue is especially meaningful because, until recently, mainly environmental sustainability has been emphasized by municipal governments in Korea, although there have been radical social changes. Recently, Korean society has been facing a decrease in population and an increase in single-person families, especially elderly people living alone [7]. Arguably, community spirit, which used to be a virtue of traditional society, had been severely diminished along with quality of life. Thus, Korean society has to consider sustainability, recognizing that the very definition of social sustainability is the ability to maintain a certain state of society now and in the future.
To achieve social sustainability, social capital is expected to be one of the nonphysical contributory factors. Social capital exists among members of society and can promote cooperation and a feeling of solidarity. Unlike physical or human capital, social capital is engendered by relationships and interactions among people. There can be three types of social capital: bonding, bridging and linking [8]. Bonding social capital is the connection between people with a similar demographic background, while bridging social capital refers to connections to people who have different demographic backgrounds [8]. Different from these two types of social capital, linking social capital is a connection to an influential figure. Thus, a place for people to meet and interact plays a key role in the development of social capital, especially bonding social capital.
However, little research has been done to investigate the relationship between social capital and neighborhood built environments in Korea. Accordingly, in new development or regeneration projects, social capital is generally not considered. In addition, there is a lack of awareness about spatial elements that can contribute to social sustainability in planning policies. Although the Seoul Urban Regeneration Comprehensive Plan [3] considers sustainability to be one of its objectives, there is no specific design scheme suggested, only abstract guidelines. The Seoul Sustainable Development Master Plan [4] is also abstract in general, and there is only an awareness of facilities rather than design elements that can directly affect social sustainability.
Therefore, neighborhood design elements should be explored, and spatial planning elements that can be beneficial for social sustainability and social capital should be suggested and applied to urban planning. This study aims to investigate the relationship among neighborhood built environment, social capital and social sustainability in urban space with an integrative approach. It aims thereby to determine how neighborhood built environments can influence social capital and social sustainability.

2. Literature Review and Theoretical Framework

The notion of sustainability became prominent after the Brundtland Report [9] was released in 1987, and social sustainability was suggested as a part of sustainable development. As Colantonio [10] (p. 5) points out, social sustainability was not considered independently at that time, but as a social aspect of economic sustainability or environmental sustainability. Owing to its origin, in most cases, social sustainability is defined in relation to development. Polèse and Stren [11] offered the development-context definition, emphasizing the economic and social dimensions of sustainability [12] (pp. 3–5), defining social sustainability as “development (and/or growth) that is compatible with harmonious evolution of civil society… with improvements in the quality of life for all segments of the population” [11] (pp. 15–16). Occasionally, sustainability is defined as a normative concept to be considered during development [13] or just as a process itself [14]. Sometimes, sustainability is defined as a quality of society [15]. Consequently, the definition of social sustainability remains ambiguous, with diverse definitions from various fields and perspectives, which cause difficulty in defining and pursuing social sustainability.
Similarly, urban social sustainability has been defined in the context of development. Yiftachel and Hedgcock [16] uniquely defined urban social sustainability as a “continuing ability of a city to function as a long-term viable setting for human interaction, communication and cultural development” [16] (p. 140). Nevertheless, social sustainability in the urban context is not clearly defined. Instead of reaching a consensus, many researchers suggest key concepts or themes of urban social sustainability. For instance, Dempsey et al. [17] stated that urban social sustainability is identified by two dimensions: social equity and the sustainability of communities. Several contributing factors of urban social sustainability are also discussed. These contributing factors can be generally categorized into two types: nonphysical and physical factors [17]. An important consideration here is that nonphysical factors can be influenced and sometimes shaped by physical environments. For instance, safety and security can be improved by environmental design [18,19,20]. Although the relationships can vary by scale, physical factors can contribute directly and also indirectly by influencing nonphysical factors of social sustainability.
Among several nonphysical factors, such as social mix [21] or social justice [15], social capital is one of the important nonphysical factors. Several definitions have been suggested by scholars regarding social capital. Bourdieu defined social capital as “the sum of the resources, actual or virtual, that accrue to an individual or a group by virtue of possessing a durable network of more or less institutionalized relationships of mutual acquaintance and recognition” [22] (p. 119), whereas Coleman [23] described social capital as a productive social network. Putnam [24] defined the concept of social capital in a manner similar to Bourdieu because it includes networks, norms and trust, which allow members of a certain group to efficiently achieve their goals together. Likewise, Fukuyama [25] defined social capital as an informal norm that encourages cooperation among individuals. Adopting the concept of the social relationship, Australian Bureau of Statistics (ABS) adopted a working definition of social capital proposed by Winter [26] as “social relations of mutual benefit characterized by norms of trust and reciprocity” [27] (p. 4).
Social capital can have many virtues. Regarding economy, social capital can be advantageous by reducing various expenses resulting from societal malfunctions [24,28] because social capital engenders the credibility and productivity of society. In the field of health science, researchers have noted that social capital induces people to become involved in more physical activities and to work toward increased health [29]. With the recognition of the many benefits of social capital, several nations and diverse international organizations have sought to establish a definition, measurement and policies to build up social capital since the beginning of the 21st century. For instance, the OECD and British Office for National Statistics adopted the definition by Healy and Côté [30], defining social capital as “networks together with shared norms, values and understandings that facilitate cooperation within or among groups” [30] (p. 41). The World Bank stated, “social capital refers to the institutions, relationships, and norms that shape the quality and quantity of a society’s social interactions… Social capital is not just the sum of the institutions which underpin a society—it is the glue that holds them together” [31].
Precedent studies that investigate into the relationship between social sustainability and social capital are mostly theoretical. Baines and Morgan [32] and Sinner et al. [33] insisted that trust, harmony and cooperation, which a civil society requires to maintain itself, require social capital. Thus, promoting and retaining social capital are crucial factors of social sustainability. Similarly, Woodcraft et al. [34] stated that social capital can contribute to social sustainability since it can “help people to put down roots, feel secure and at home, and develop a sense of belonging” [34] (p. 32).
A relationship between social sustainability and social capital has also been found empirically. People who live in a neighborhood with abundant social capital are less likely to move away from this neighborhood [35]. Considering that long-term residents are important to social sustainability [17,36], the study by Kan [35] indicates social capital as a possible contributing factor. A similar empirical result showed that social capital has a positive impact on social sustainability [37]. Theoretical studies in the field of urban policy also speculate that social capital can influence social sustainability. Particularly, the U.K. puts effort into enlarging the social capital of deprived areas with the aim of promoting social sustainability [38,39,40].
Physical factors are also related to social sustainability. Several organizations have suggested built environment as one of the key factors in achieving social sustainability. Literature on the relationship between neighborhood built environment and social sustainability focuses on key concepts in environmental design, such as a sense of place [41], equitable access to fundamental services, decent housing [10] and amenities [34]. Meeting places [42], a mix of housing types [43] and a mix of land use [44,45,46] are also suggested to be related to social sustainability. There have also been several empirical studies regarding the impact of neighborhood built environment on social sustainability. Most have focused on density as an important neighborhood built environment factor related to social sustainability [43,44,46,47]. The density, disorder or maintenance of a neighborhood [48], the quality of the perceived environment [45] and parks [49] are suggested to be related to social sustainability.
As previously mentioned, nonphysical factors, such as social capital, are related to physical factors. Social capital is not just the sum of individuals’ capabilities or capital. It is established through interactions and exists in networks among people. Therefore, in the development of social capital, space for interaction is needed, and this highlights the importance of the environment in the process of developing social capital in the neighborhood. Many studies have found a significant relationship between social capital and the environment according to various scales. Regarding urban form and walkability as factors related to social capital, Leyden [50] and Kamruzzaman et al. [51] found a significant relationship between a walkable urban form and social capital. The results of these studies have shown that macro-scale factors, such as land use, density, neighborhood type and walkability, have relationships with social capital. Instead of investigating the neighborhood type, some studies in Korea found a relationship between social capital and a mixed rate of housing size or land use [52,53]. In summary, neighborhood built environments of diverse scales relate to social capital and/or social sustainability.
Literature supports the idea that there are logical connections among social sustainability, social capital and the neighborhood built environment. Accordingly, this study suggests an integrated model of the neighborhood built environment, social capital and social sustainability. The theoretical background is predetermined for further empirical analysis. Both the physical (built) and socioeconomic neighborhood environment can influence inhabitants’ daily lives and their behaviors. To the same extent, people have different social interactions according to different environments [24,37,44]. People tend to interact more or less [17,24] or have a different kind of social relationship [24].
Social capital can be seen as a consequence or result of social interaction. The term “social”, one of the components of “social capital”, indicates the relationship or network, and social capital does exist in the network. To this extent, it can be said that social interaction, which is affected by various environments, is necessary for the development of social capital. When focusing on the “capital” of “social capital”, social capital can produce diverse forms of output from the economic benefit of collective action among the members of society. Coleman [23] also stated that social capital can “facilitate certain actions of actors within the structure” [23] (p. S98). Furthermore, social capital can be a contributing factor or key theme of social sustainability [32,33]; hence, it is sometimes considered synonymous to “social sustainability” itself. Apparently, it can be said that when there is abundant social capital, there is more social sustainability. However, this does not mean that social capital is the same as social sustainability. Specifically, social capital is a relationship among members of society that can potentially create positive or negative outcomes, while social sustainability is a societal ability.
From this aspect, social sustainability, an end state [34], can be an outcome of social capital. Social sustainability can be defined as an ability to sustain society, because “sustain” means maintaining a certain state that is determined by both physical and nonphysical factors. Thus, physical factors (e.g., built environment: accessibility, decent housing, attractive public spaces) and nonphysical factors (e.g., social capital, community, safety) can influence urban social sustainability. Although these are fragmented approaches, a few studies have tried to examine the relationship between social capital and possible contributing elements of social sustainability, such as sense of community, residential mobility, participation in community affairs, and so on [35].
As mentioned, social sustainability can be directly influenced by neighborhood built environment. In terms of social equity, the key emerging concept of precedent studies [32,33,46], spatial planning can affect accessibility to essential services or facilities, jobs, and so on. In terms of well-being or happiness, which are emerging concepts in social sustainability [10], neighborhood built environment factors, such as amenity or maintenance, can be influential [34,37]. Conclusively, neighborhood built environment directly affects social capital and affects social sustainability both directly and indirectly. The empirical analysis of the research is based on this framework.
Building on precedent studies and in the hope of complementing their shortcomings, this study, first, suggests an integrated model of the built environment, social capital and social sustainability, which it also empirically examines. Second, this study investigates the causal relationships by using structural equation modeling (SEM), which has been rarely applied in previous studies. Specifically, the study examines the precedent theory that the built environment affects social capital and that social capital can contribute to social sustainability. Finally, micro-scale built environment variables, which have been seldom considered, are applied for the in-depth study of the relationship between the built environment and social aspects.

3. Methodology

3.1. Case Study Area and Data

This study focuses on four administrative municipalities in Seoul, South Korea. Figure 1 presents the location of the case study area. Four local municipalities of Seoul were selected for the survey [54,55], which was developed and conducted exclusively for this study between 17 April 2015 and 24 April 2015, with 500 adults living in the study area. The four administrative local municipalities (gu) in Seoul—Seongdong-gu, Gwangiin-gu, Dongdaemun-gu, Jungnang-gu—are residential areas that can represent the general demographic characteristics of Seoul, in terms of aged population (above 65 years old), resident population and foreign population (Table 1). Their socioeconomic characteristics are very similar to each other in terms of low to moderate household income levels.
Samples were equally allocated first in the four local municipalities, with quota sampling based on the demographic characteristics of the area (Appendix A, Table A1). There were nine questions asking about demographic factors, three questions about social sustainability, three questions about social capital and six questions about satisfaction with the neighborhood environment (Table A2). Except for one question about social sustainability and two questions about social capital, all of the questions were answered on a 5-point Likert scale [56].
Along with the survey questions, public datasets [57,58,59] were also used to measure neighborhood environments. Using ArcGIS (ArcGIS for Desktop, 10.0; ESRI, Redlands, CA, USA, 2010), neighborhood built environments were measured within 250-m buffer areas based on the home addresses of the respondents. Global integration and local integration [60] values were measured by the ArcGIS plug-in AxWoman (Axwoman, 6.0; Gävle, Sweden, 2012). A description of the data is presented in Table A3.

3.2. Definition of Variables

3.2.1. Social Sustainability

In this study, social sustainability is defined as an end state [10]. The main concern of this study is to identify the contributing factors of social sustainability. Therefore, social sustainability should be defined as a certain state, not as a characteristic of development, nor as a normative concept. Sustainability is the ability to maintain something at a certain rate or level. Thus, in this study, social sustainability is defined as the ability to maintain one society’s certain state or existence.
The scale is also an important issue in investigating social sustainability. Contributing factors can be different depending on the scale, from nation to community [17,61]. Bramley et al. [46] and Dempsey et al. [17] conceptualized urban social sustainability to consist of two aspects: social equity and sustainability of community. Social equity refers to equitable access to essential services [62]. Sustainability of community refers to the ability of society itself, or its manifestation as a local community, to sustain and reproduce itself at an acceptable level of functioning [45].
This study examines urban social sustainability on a neighborhood scale. Although there is no consensus for the definition of neighborhood in terms of scale, neighborhood is the smallest unit of a city both in physical and social terms. Furthermore, neighborhood is not just a physical concept, but also a social and psychological concept. Thus, applying the neighborhood scale can be a pertinent approach. This study’s measure of urban social sustainability is based on Bramley et al. [46] and Dempsey et al. [17], particularly the sustainability of community [63]. According to Bramley and Power [43] and Dempsey et al. [17], sustainability of community consists of five elements: social interaction and network, residential stability, security, participation in collective community services and pride in and sense of place. Three elements are set as measurements in this regard: sense of community, residential sustainability and participation in collective community services (Table 2).
Sense of community is an individual’s attachment as a member of the community. It refers to the overall satisfaction of residents with the community [48] and is related to the norms or values of the community [64]. Willingness to keep living in the neighborhood, which is related to perceived neighborhood environment quality [65] and social capital [35], is a part of community stability because long-term residents are essential for such stability [17,36]. Participation becomes an important element in social sustainability theory in accordance with the enlarged interest in governance. Specifically, participation in community affairs can affect social sustainability by means of policy efficiency or residents’ democratic exercise of rights [10].

3.2.2. Social Capital

The majority of studies on social capital indicate three to five important elements: Social capital in this research also includes three elements, networks, trust and reciprocity (Table 3). These have also been applied in precedent studies in Korea [66,67,68,69]. This study asked four questions to measure the elements of social capital.
Networks are considered to be the core element of social capital. In measuring social capital in neighborhoods, networks are measured by the relationships among neighbors. Thus, the number of close neighbors and frequency of conversation with neighbors are used to measure networks. Trust can also be an essential element of social capital [23,69] and refers to trust in neighbors at the neighborhood scale. Reciprocity is the tendency to pursue the common good even when there is no certainty of reward. In accordance with this, reciprocity has an aspect of normality and is sometimes considered and measured as a similar concept to trust [70]. Thus, the expectation of help from neighbors in an emergency is measured as an indicator.

3.2.3. Neighborhood Built Environment

Perceived environment variables are measured by the survey respondents’ perceptions. Neighborhood perceived environment quality showed a relationship with social capital [71,72,73], and it can be relevant to social sustainability [47,65]. Other studies also used perceived environment variables, such as the existence of green space, safety and maintenance [44,74]. Furthermore, because the physical ability and psychological accessibility of individuals vary, environment factors can be perceived divergently by different people. Thus, it can be compelling to analyze accessibility to public facilities or public open spaces as the perceived environment [41,68,71,75]. A total of six variables comprise two latent variables and appear to be reliable (Table 4).
Explanatory analysis helps to construct latent variables consisting of objectively-measured variables. Due to divergent scales and criteria, measured variables are standardized by the z-score (Table A4). Using SPSS 21.0 (IBM SPSS Statistics, 21.0; IBM, Armonk, NY, USA, 2012), a principle component analysis with the Varimax rotation method was applied. Two factors were loaded after eliminating items with low factor loadings (less than 0.5) and low communalities (less than 0.4). The Kaiser–Meyer–Olkin test (0.703) and Bartlett’s test (χ2 = 1794.271, p = 0.000) were used to verify the factor analysis.
Land use diversity and the characteristics of residential area are the latent variables loaded from factor analysis (Table 5). Land use diversity has a high proportion of commercial use and business use with a high value of land use mix (LUM) [76]. It has been emphasized that this is related to social capital or social sustainability [44,45,47,51,53,65]. The second variable is the characteristics of residential areas, where an area with a high proportion of single-family houses and row/multi-family houses, narrow roads and many intersections (small blocks) can be interpreted as similar to a neighborhood type [41,50,71,73].

3.2.4. Demographic and Socioeconomic Characteristics

Precedent studies have confirmed the influence of individuals’ demographic factors or neighborhood socioeconomic status (SES) on social capital or social sustainability [68,77,78]. With the irrelevant variables excluded by correlation analysis (Table A5), four individual demographic factors are included in the model. Neighborhood SES is measured by poverty rate [79], and the average market price of housing is also considered. The average market price of apartments from the past year (April 2014–April 2015) [80] is set as a proxy variable of the average market price of housing (Table 6).

4. Analysis

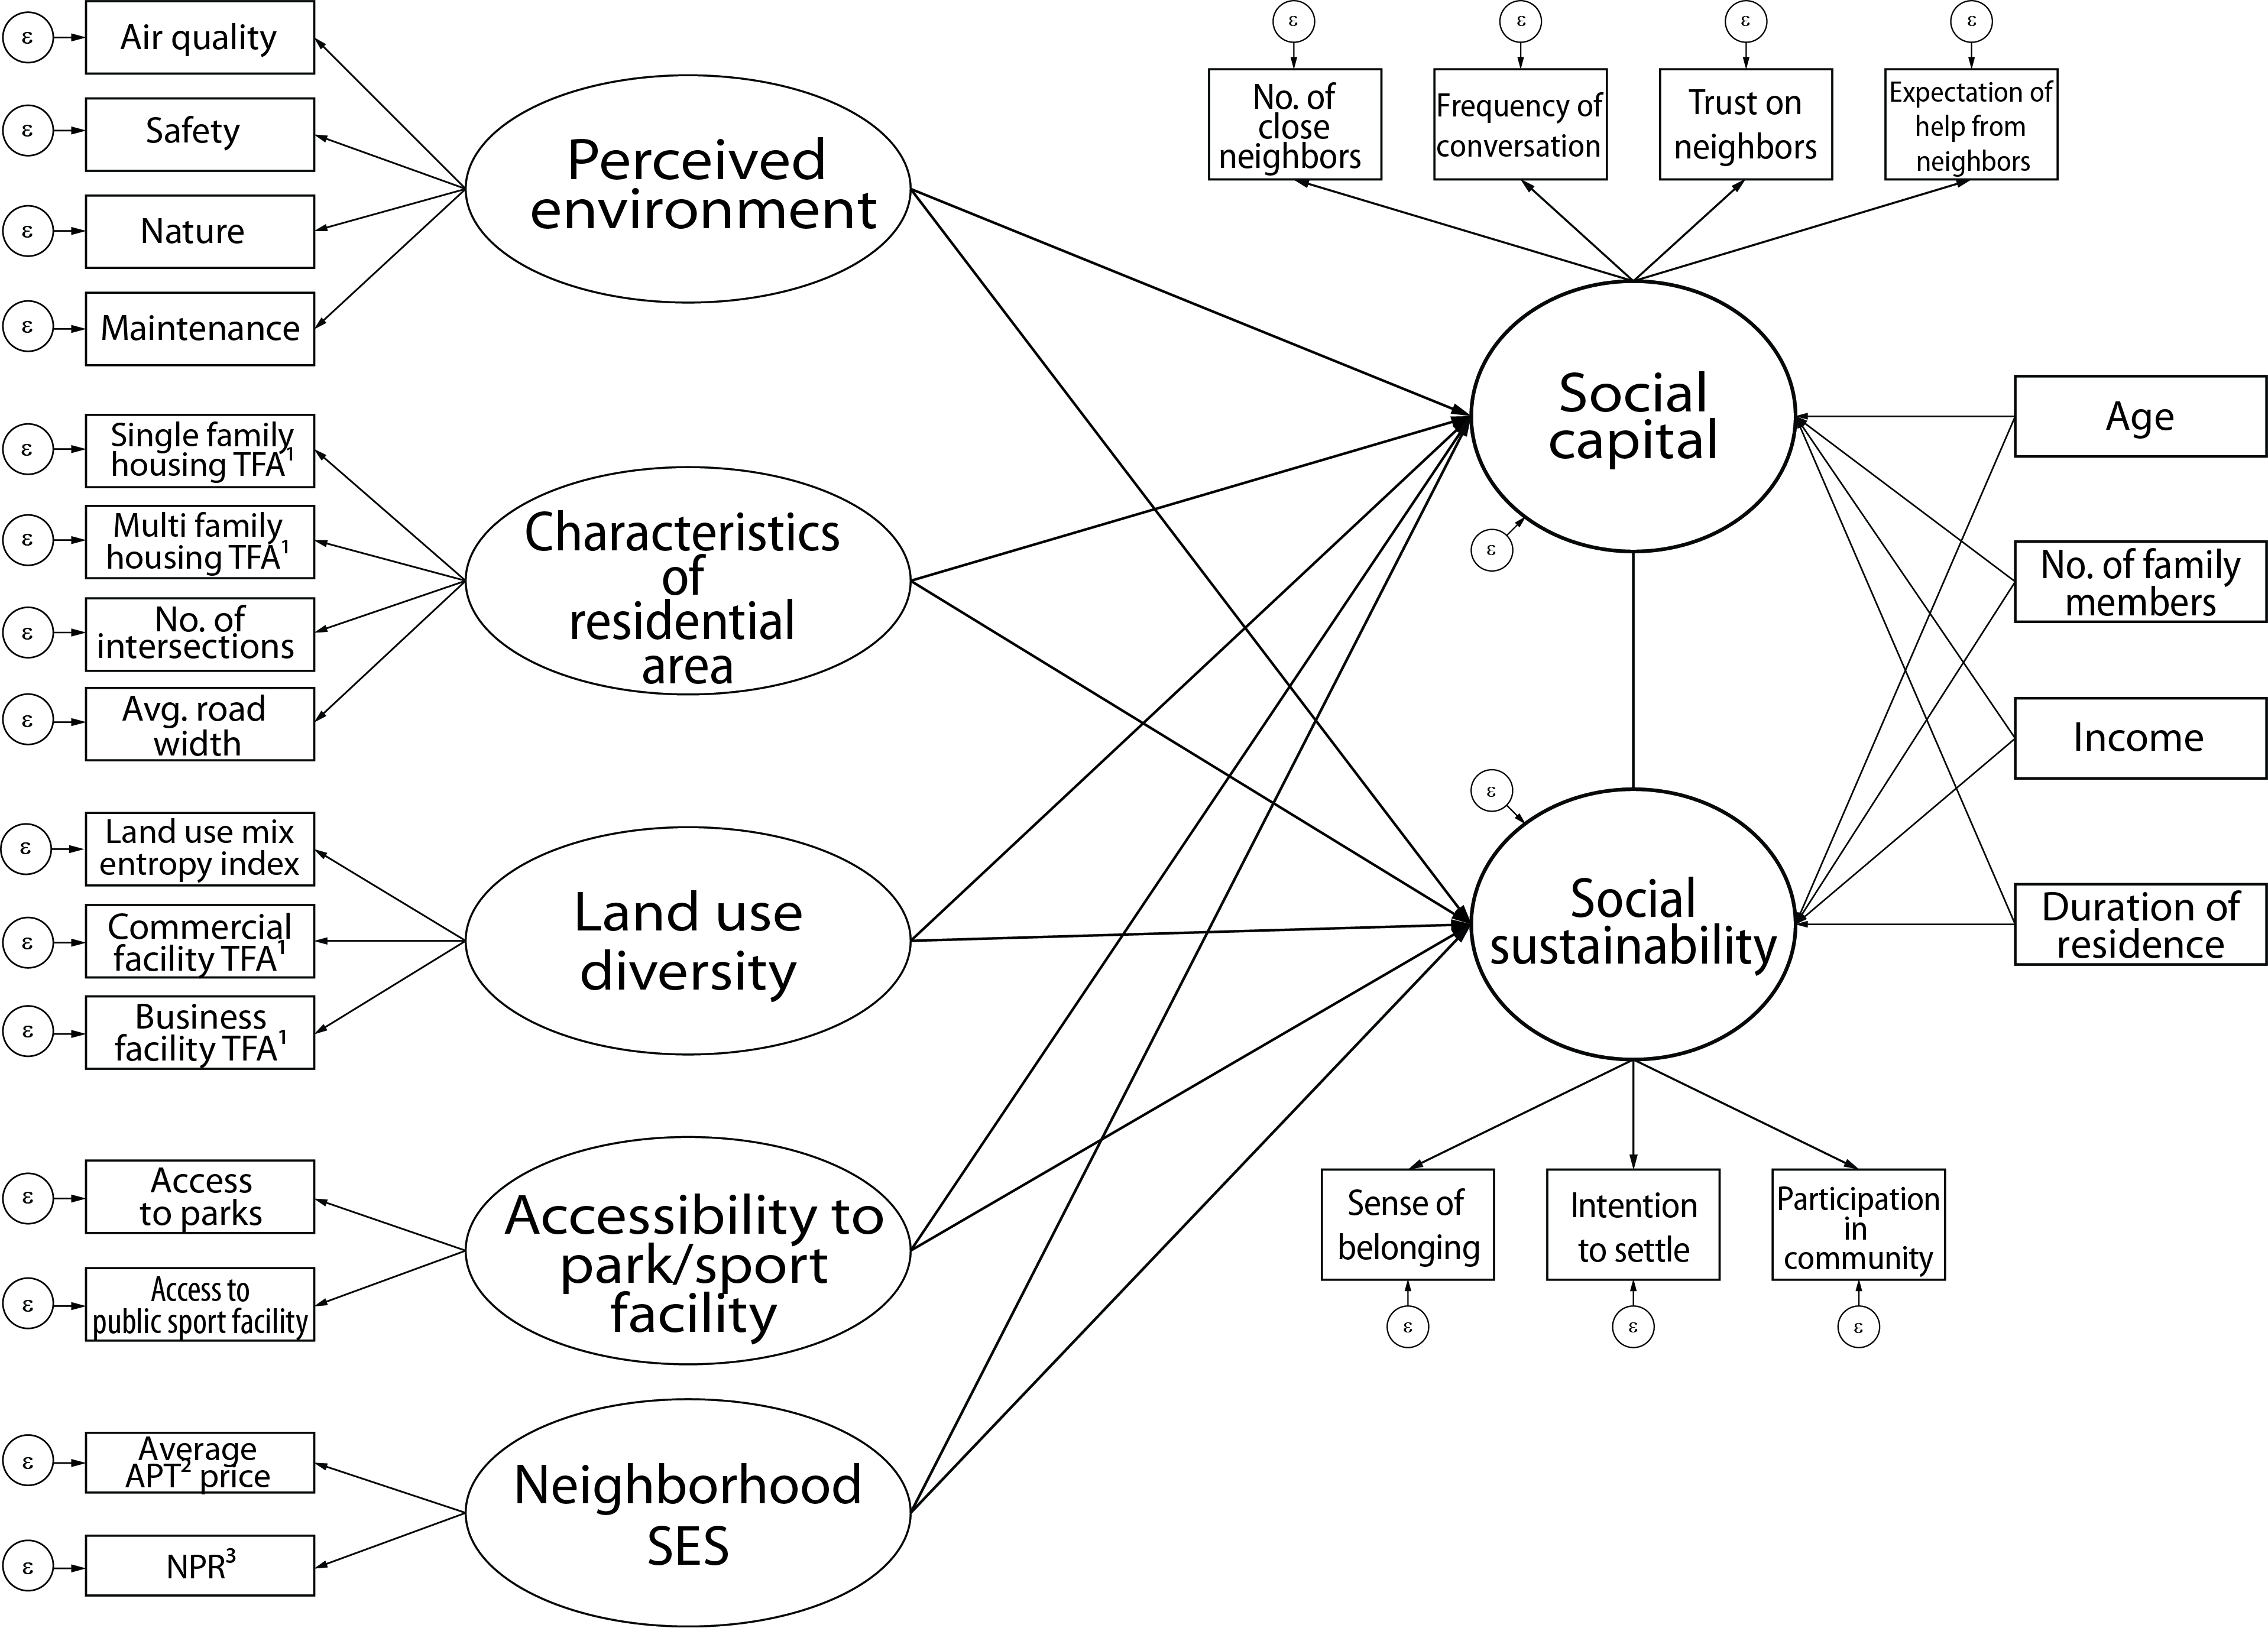
Figure 2 presents the SEM of this study based on the integrated theoretical model of the neighborhood environment, social capital and social sustainability. Neighborhood environment variables affect both social capital and social sustainability. Demographic characteristics and neighborhood SES are also included in the model as moderating variables, because they can have an influence on social capital and social sustainability.
The neighborhood environment latent variables can have a direct impact on social capital and social sustainability. Thus, demographic characteristics and neighborhood SES were used as the moderating variables. In addition, those variables indirectly influence social sustainability by influencing social capital. Neighborhood environment variables drawn from factor analysis are extracted by principal factor extraction and rotated by the Varimax method. Therefore, there is no covariance between the two latent variables of perceived quality of neighborhood environment and accessibility to parks and public sport facilities. However, covariances are set among some observed variables because of the possibility of associations among them. Neighborhood SES was not extracted by factor analysis, and so, it can have covariance with neighborhood environment latent variables. 
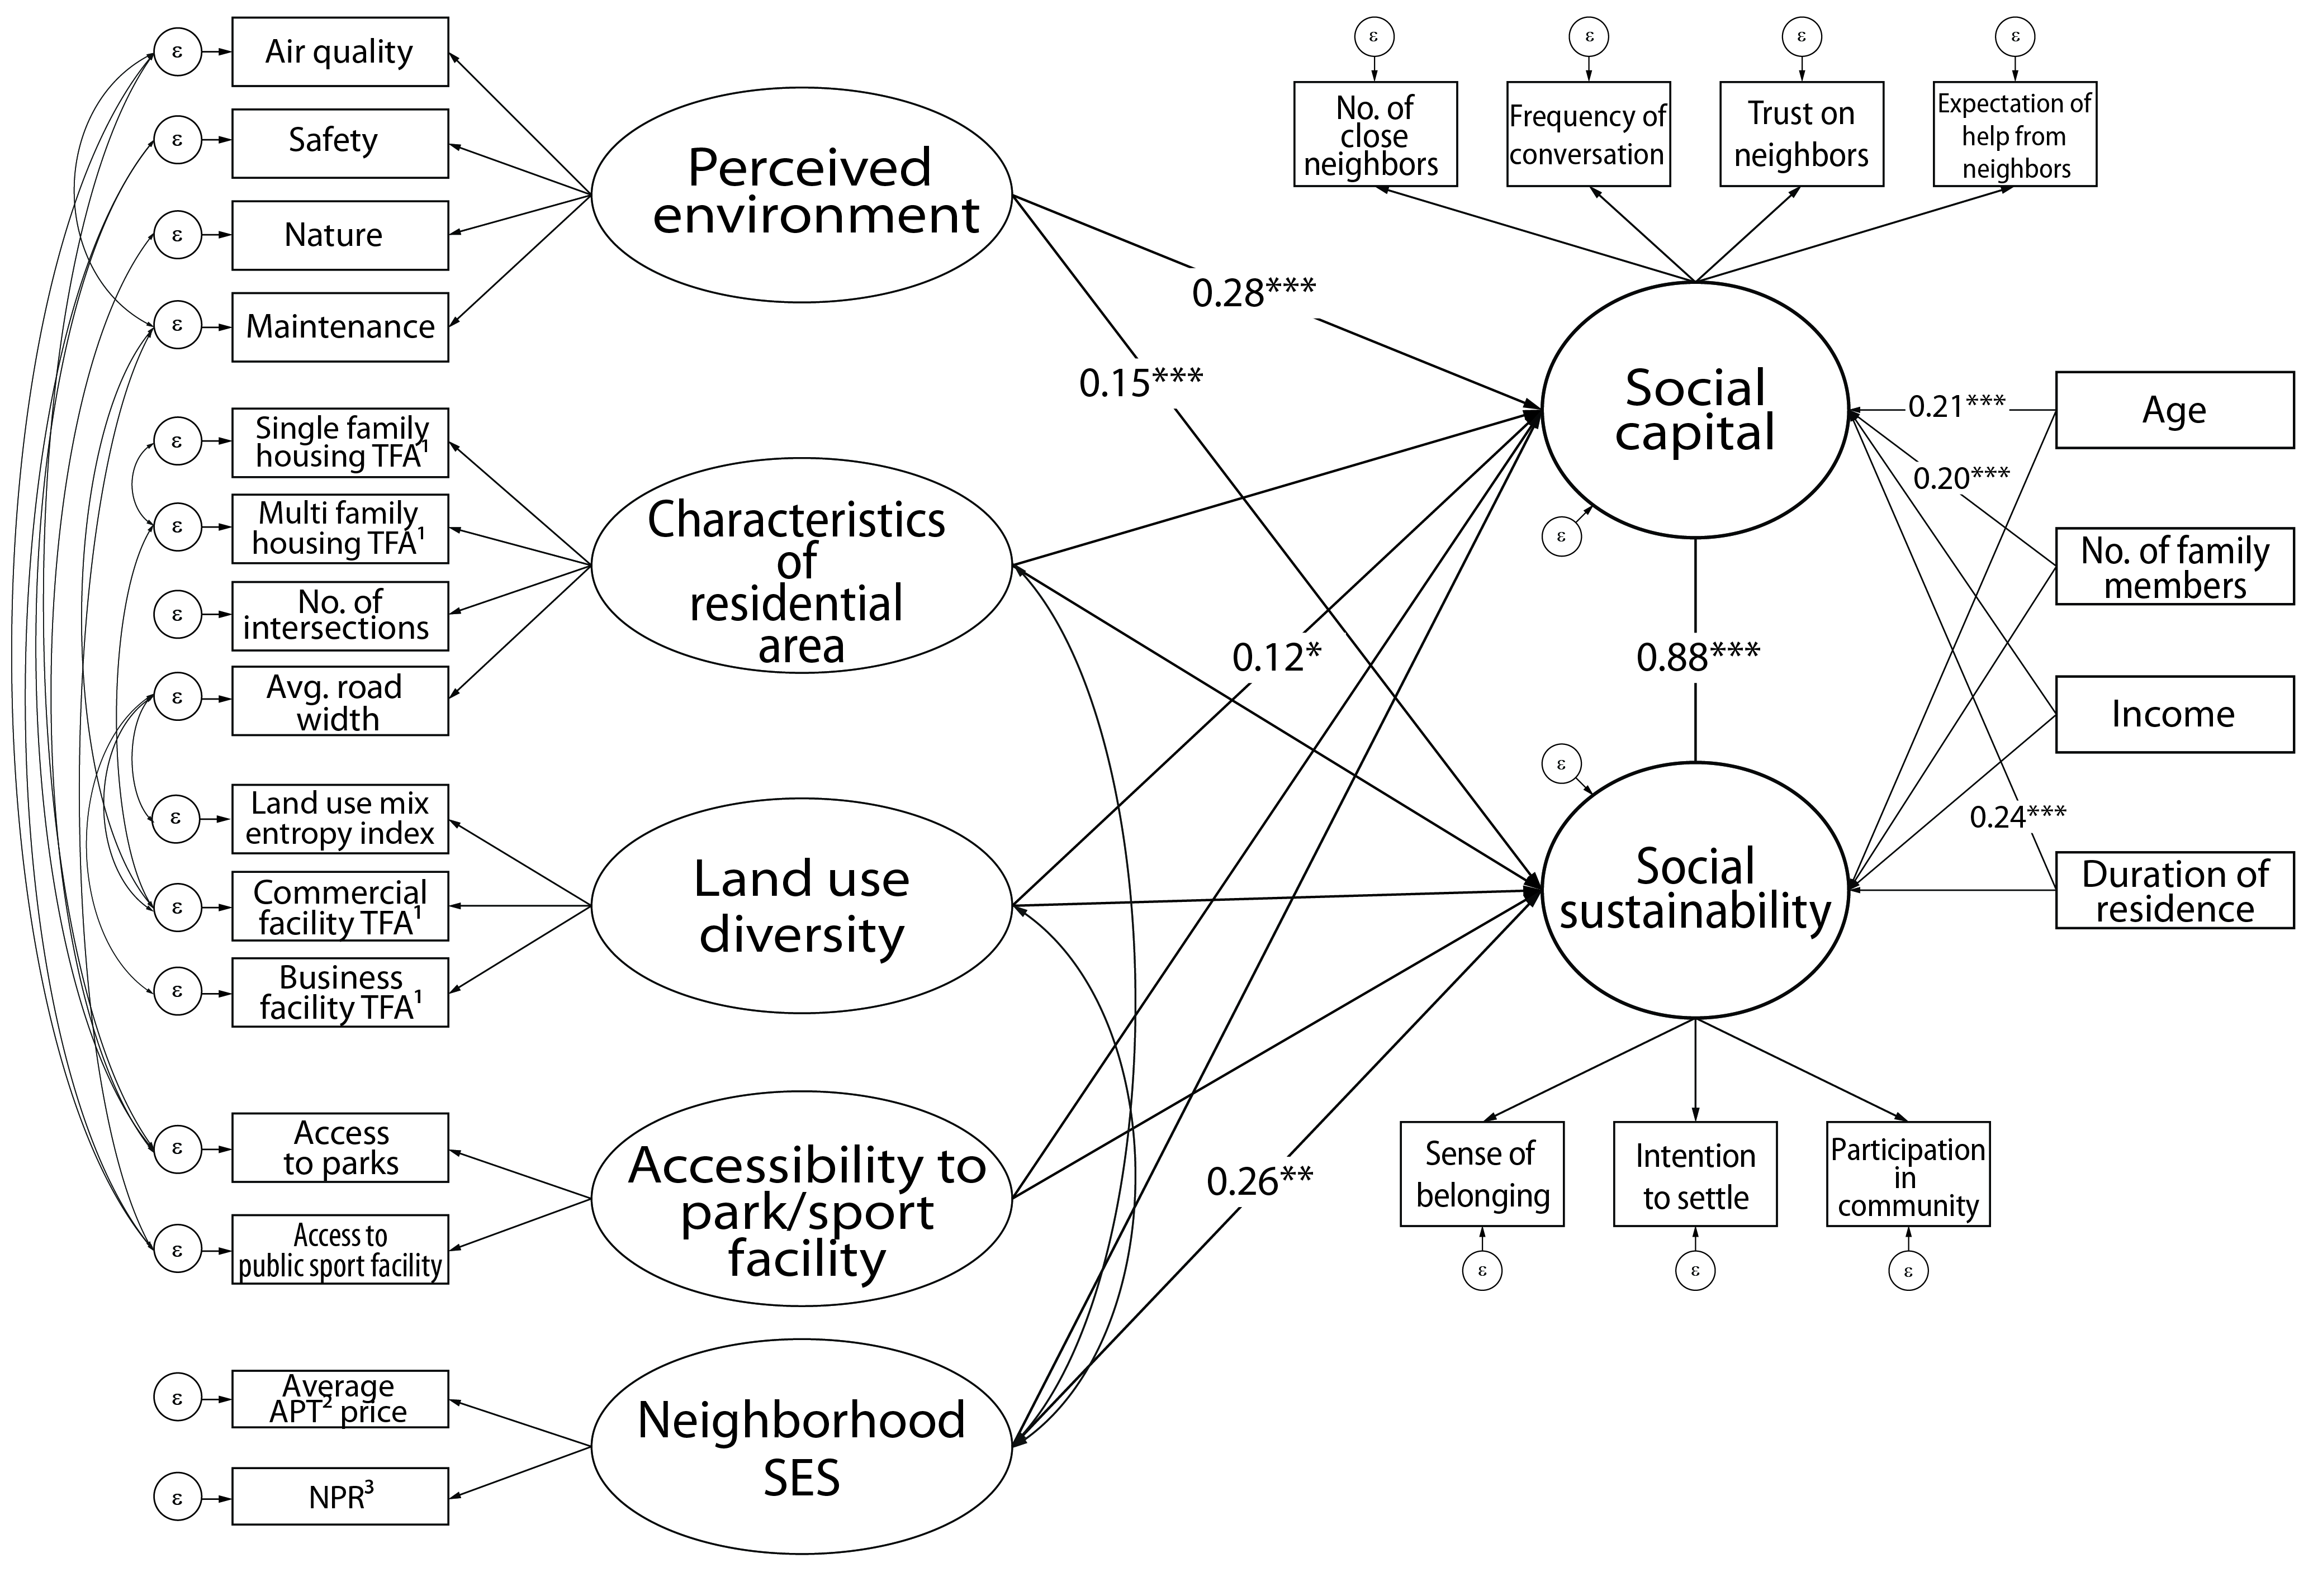
Figure 3 shows the complete model [81], which satisfies most of the fit indices commonly used in precedent studies (Table 7). The parameter estimate of the model is presented in Table A6.
Coefficient values of the paths among neighborhood environment, social capital and social sustainability, including moderating variables, are shown in Table 8. With regard to social sustainability, the quality of the perceived neighborhood environment (0.284), land use diversity (0.120) and accessibility to parks and public facilities are significant and have a positive impact on social capital. Only the characteristic of the residential area is not significant. Among the moderating variables of age and duration of residence, each has a significant and positive impact on social capital.
With social sustainability, most of the neighborhood environment variables show no significant influence, except the quality of perceived neighborhood environment, which has a positive impact (0.147). Among moderating variables, no demographic characteristics appear to be significant. However, unlike social capital, neighborhood SES shows a significant and positive impact [82]. Among the factors, social capital has the most significant and strongest impact (0.867) on social sustainability.
The path coefficient analysis provides the impact of paths and statistical significance. However, it does not present the indirect effect of variables that can be delivered through the medium [83]. Therefore, to evaluate the total effect of variables in the model, both the direct and indirect effects need to be analyzed (Table 9).
Perceived environment quality not only has a positive direct effect on social capital, but also has both positive direct and indirect effects on social sustainability. Among the neighborhood environment variables, perceived environment has the most significant and strongest impact on social sustainability. Accessibility to parks and public sport facilities has a direct significant and positive effect on social capital (0.306), but there is no direct significant effect on social sustainability. However, it has an indirect positive effect (0.265) by influencing social capital; consequently, it has a significant impact on both social capital and social sustainability. Land use diversity has a significant positive impact (0.120) on social capital, but has no significant direct effect on social sustainability. Although there is a significant indirect effect (0.104), no significant effect of the diversity of land use on social sustainability is found. The characteristics of a residential area do not have an effect on either social capital or social sustainability.

5. Discussion

The results of the present analysis indicate that there is a statistically significant relationship between neighborhood built environment, social capital and social sustainability. A total of four latent variables of neighborhood environment are used in the model. The quality of the perceived neighborhood environment and accessibility to parks and sport facilities are organized based on theory and precedent studies, while the characteristics of a residential area and the diversity of land use based on commercial and business use are extracted by factor analysis. Among the built environment variables, only the characteristics of a residential area show no statistically-significant impact on either social capital or social sustainability.
The quality of the perceived neighborhood environment has a positive effect on social capital. This relationship has been suggested in precedent studies [36,68,74,78] that amenity and social cohesion or closeness among inhabitants have positive relationships with social capital. Namely, in a neighborhood with a good environment, inhabitants tend to have more activity in the neighborhood and have more opportunity to encounter and interact with their neighbors.
Perceived neighborhood environment quality not only has a positive direct effect on social capital, but also has both positive direct and indirect effects on social sustainability. Namely, among the neighborhood environment variables, the quality of perceived environment has the most significant and strongest impact on social sustainability. With regard to social sustainability, the indirect effect (0.246) of the quality of perceived environment has a stronger impact than its direct effect (0.147). However, the importance of the good quality of the neighborhood environment has been customarily emphasized only as an essential condition of habitation. The result implies that the quality of the perceived environment has its importance as a factor that affects the development of social capital in the neighborhood as much as a factor that affects inhabitant satisfaction.
Accessibility to parks and public sport centers has also been reported to have a positive relationship with social capital. Recent studies have found that social capital and physical activity are related because physical activity can be an opportunity to establish social relationships. Furthermore, better accessibility to public spaces and facilities can result in greater likelihood of their use and thus to more social activity. According to Cairnduff [84], sports can assist in creating communities with high levels of positive social outcomes, such as social capital, which in turn can make them more resilient to negative outcomes as a result of economic, social and cultural changes [85]. The result that sport facilities only influence social sustainability through social capital shows a similar idea that sports can influence social sustainability by engendering social capital. That is, social capital plays a role as a medium of enhancing social sustainability. In sum, places and facilities that can function as community spaces, such as parks or public sport facilities, should be considered essential elements of planning for promoting social capital and social sustainability.
Although less significant, land use diversity has a direct positive effect on social capital. It shows less significance compared to other significant neighborhood environment variables (p = 0.061). One possible explanation is that, as Jacobs [86] and New Urbanists insisted in the Charter of the New Urbanism [87], mixed-use development can attract people to the street and thereby engender social interaction. Another possible explanation is that comparatively lower residential density can be beneficial to social capital. Land use diversity consists of LUM and total floor area of commercial use and business use. Among those variables, as the parameter estimate indicates the coefficient of the observed variables, LUM is 0.966, and the total floor area of commercial use is 0.805. This is the characteristic of the area where land use is highly mixed, with the majority designated for commercial use, and residential density is comparatively low. Therefore, this finding is in agreement with Dempsey et al.’s conclusion [17] that interaction among neighbors tends to decrease in high-density residential areas.
Among the factors directly related to social sustainability in the model, social capital is the most significant and influential factor that has a positive effect on social sustainability. Moreover, as the result indicates, accessibility to parks and public sport facilities has influence only through social capital. In this study, social capital is defined as a resource that can produce social sustainability, rather than the same notion. The result empirically indicates that enhancing social capital can contribute to enhanced social sustainability.
One noteworthy point is an evident difference between perceived neighborhood environment and measured neighborhood environment in terms of significance. As the analysis results indicate, latent variables consisting of measured variables have mostly no significant relationship with social capital or social sustainability. However, the neighborhood environment variables identified from the survey show significant relationships with both social capital and social sustainability. Dave’s research [44] implies a similar result that applied both physical (objectively measured) and perceived (subjectively) density. While most perceived density variables had significant relationships with social sustainability, there was no significant relationship with physical density.

6. Conclusions

Social sustainability and social capital have become important issues in Korea, particularly in urban planning and regeneration policies. In the case of social capital, interest has been drawn to both academic and political fields, whereas social sustainability recently became an issue in Seoul’s policy. However, there is no specific guideline or suggested design scheme. This derives from a lack of research on the spatial elements that can influence social sustainability and social capital. This study suggested an integrative model of neighborhood environment, social capital and social sustainability and empirically examined the model.
With regard to social sustainability, social capital has a more influential positive impact than any other factor, according to the present analysis. The results indicate that enhancing social capital will result in a more sustainable society. Neighborhood environment, such as the quality of perceived environment or accessibility to parks and public sport facilities, also has a significant impact on social sustainability. This can possibly explain how the quality of the perceived environment can directly influence inhabitants’ intention to keep living in the neighborhood, whereas the others predominantly have a direct influence on social capital.
Diverse neighborhood environments have significant influence on social capital. Perceived environment quality, land use diversity and accessibility to parks and public sport facilities have a positive influence on social capital. The perceived good quality of an environment can promote residents’ spending time in the neighborhood, resulting in a greater chance of social interaction. Land use diversity can have similar aspects of influence because mixed use development can attract more people to the area, which has been emphasized by new urbanists. Accessibility to parks and public sport facilities also has a positive influence. In preceding studies, physical activity has been emphasized as being strongly related to social capital. The result also shows the same perspective. The results of this study emphasize that future urban policy should manage social sustainability, social capital and neighborhood built environment in an integrative manner. In the Seoul Sustainable Development Master Plan [4], although four strategies are suggested—i.e., (a) establishment of a social system that alleviates social polarization and social discrimination; (b) establishment of a harmonious society; (c) establishment of a healthy and safe city; (d) making and promoting a culture-ecosystem—there is a fragmented approach to managing those strategies. For instance, to achieve the strategy of “establishment of a harmonious society for everyone” [4] (p. 20), the establishment of governance by promoting resident participation is suggested. However, the detailed schemes are only focused on policies about planning regulations or disclosure of information. Resident participation can be engendered by policies, but can also be promoted by designing neighborhood environments more favorable to increase social interaction or social capital.
In the same manner, this study substantiates the importance of the neighborhood environment in dealing with social issues. The results indicate that urban spatial planning can play a critical role in social issues. However, urban policies on social issues still lack awareness of the role of the neighborhood built environment. One of the main focuses of the Seoul Sustainable Development Master Plan [4] is the establishment of a social system that alleviates social polarization and social discrimination without any consideration of spatial solutions. Although the plan generally gives an abstract outline, only social policies are suggested. For instance, the plan sets vitalizing the neighborhood community as an objective, in order to enhance residential welfare. In achieving the objective, there is no mention of improving the neighborhood physical environment or of promoting or enhancing community development. This study suggests that adopting certain elements, such as accessible public sport facilities or the good quality of the environment, should also be included in the social policies. However, this does not mean that the neighborhood built environment is the definitive and only factor in sustainable development. Other factors, such as socio-cultural context and economic factors can be also influential.
Furthermore, the results suggest that perceived environment and accessibility to parks or sport facilities should be considered essential elements in urban planning and urban regeneration aiming to enhance social capital and social sustainability. This is also suggested in precedent studies because the good quality of the environment and facilities where people establish relationships positively affect social capital and social sustainability. The present findings also indicate the importance of such neighborhood environment elements.
The study has a few limitations. First, this study limited the term social sustainability and applied it extensively in its aspect of community social sustainability. In addition, a limited number of social sustainability indicators were applied in the analysis. Second, the detailed process of the neighborhood environment influencing social capital was not fully investigated. We could only conceptualize that the built environment can function as a space where social interaction and relationships are engendered. Third, there was limited use of neighborhood environment variables. Variables such as population density and width of pedestrian roads were not included in the model due to limited access to the data. Lastly, this study has an unduly environmental deterministic approach. Although demographic factors and socioeconomic factors are controlled, there can be still other factors that can affect social capital or social sustainability, such as cultural factors which can influence individual’s social behavior.

Acknowledgments

This research was supported by Basic Science Research Program through the National Research Foundation of Korea (NRF) funded by the Ministry of Education (NRF-2015S1A5A8014384).

Author Contributions

As first author, Chisun Yoo has initiated and completed this study including the survey and wrote an initial draft of this study. Sugie Lee, as a corresponding author, further developed the research idea and suggested proper methods for an analysis of this research. He has also reviewed the manuscript and finalized it. Both authors have read and approved the final manuscript.

Conflicts of Interest

The authors declare no conflict of interest. The founding sponsors had no role in the design of the study; in the collection, analyses, or interpretation of data; in the writing of the manuscript, and in the decision to publish the results.

Appendix A

Table A1. Comparison of actual and sample populations.
CategorySeongdong-guGwangjin-guDongdaemun-guJungnang-gu
AgeSexActualSampleActualSampleActualSampleActualSample
19–29Male11.011.211.612.011.612.011.011.2
Female10.710.412.112.010.710.410.811.2
30–39Male12.012.011.912.011.612.011.812.0
Female11.812.011.812.010.911.210.911.2
40–49Male11.912.011.111.211.511.211.812.0
Female11.311.211.511.210.710.411.511.2
50–64Male14.114.413.313.614.514.415.916.0
Female17.316.816.816.018.518.416.315.2
The comparison between the actual population and the sample population of the study area is presented. Because the largest difference between the actual and sample populations is 1.1%, which is for Jungnang-gu’s female population and the age group of 50–64 years, the sampling appropriately represents the target population. Resident registration statistics data of 2015 from the Ministry of the Interior [88] were used as the sampling base.
Table A2. Survey contents.
Latent VariablesVariablesContentNote
Social sustainabilitySense of belongingSense of belonging as member of community4-point
Community stabilityIntention to keep living in the neighborhood5-point
ParticipationParticipation in neighborhood affairs5-point
Social capitalNetworkNumber of close neighborsperson
Frequency of conversation with neighbors4-point
TrustTrust in neighbors in general5-point
Trust and ReciprocityExpectation of help from neighbors in case of emergency5-point
Satisfaction in neighborhood environmentAir qualitySatisfaction with air quality of neighborhood5-point
MaintenanceSatisfaction with maintenance of neighborhood5-point
Safety from crimeSatisfaction with safety from crime of neighborhood5-point
Natural environmentSatisfaction with natural environment of neighborhood5-point
Green space accessibilitySatisfaction with green space accessibility of neighborhood5-point
Public sport facility accessibilitySatisfaction with public sport facility accessibility of neighborhood5-point
Demographic factorsSex, age, education, household income, duration of residence, number of family members
Table A3. Descriptive analysis of variables.
Latent VariablesVariablesCategoryCount%MeanSDMin.Max.
Social sustainabilitySense of belongingNone316.402.410.6714
Weak24149.79
Moderate19339.88
Strong193.93
Intention to live in the neighborhoodNot at all102.073.420.8815
Not much489.92
Moderate20241.74
A little17636.36
Very much489.92
Participation in neighborhood activityNever participate347.022.80.8915
Barely participate13728.31
Neutral22145.66
Sometimes participate7816.12
Mostly participate142.89
Social capitalNumber of close neighbors 484100.003.544.15020
Frequency of conversation with neighborsNever7916.322.340.8114
Barely18438.02
Sometimes19740.70
Frequently244.96
Trust in neighborsNot at all112.273.060.7415
Not much7615.70
Moderate27757.23
A little11223.14
Very much81.65
Expectation of help from neighbors in emergencyNot at all142.893.110.8715
Not much10221.07
Moderate20442.15
A little14730.37
Very much173.51
Perceived environmentAir qualityVery bad4910.122.70.9115
Somewhat bad13628.10
Moderate21845.04
Somewhat good7214.88
Very good91.86
Safety from crimeVery bad163.313.10.8215
Somewhat bad8216.94
Moderate23748.97
Somewhat good13728.31
Very good122.48
Natural environmentVery bad183.723.20.9115
Somewhat bad7515.50
Moderate21444.21
Somewhat good14630.17
Very good316.40
MaintenanceVery bad173.513.090.8415
Somewhat bad8317.15
Moderate24049.59
Somewhat good12726.24
Very good173.51
Accessibility to public sport facilitiesVery bad183.723.290.9415
Somewhat bad6814.05
Moderate19339.88
Somewhat good16433.88
Very good418.47
Accessibility to parks or green spacesVery bad132.693.570.9615
Somewhat bad489.92
Moderate14630.17
Somewhat good20241.74
Very good7515.50
Measured environmentSingle-family house total floor area (m2) 8362.86120.0034,149.8
Row/multi-family house total floor area (m2) 22,399.120,688.60144,391.6
Number of intersections (No.) 103.762.21277
Average road width (m) 7.23.31.4726.3
LUM entropy index (index) 0.470.1900.95
Commercial facility total floor area (m2) 58,398.645,253.4441.4264,289.1
Business facility total floor area (m2) 3245.68634.2089,990.8
Table A4. Variables used in factor analysis.
VariablesMeanMin.Max.Unit
Single-family housing total floor area (ln) *8.36−4.6110.44m2
Row/Multi-family housing total floor area (ln) *9.16−4.6111.88m2
Apartment total floor area (ln) *9.92−4.6113.29m2
Commercial facility total floor area (ln) *10.666.0912.48m2
Business facility total floor area (ln) *1.95−4.6111.41m2
LUM entropy index **0.4700.95index
Average road width (ln) *1.890.393.27m2
Number of intersections103.71277no.
Average global integration0.820.580.99index
Average local integration4.730.218.05index
Average gradient (ln) *−1.65−5.372.74degree
Average Euclidean distance to bus stops158.424.63674.59m
Number of bus stops3.63014no.
Average Euclidean distance to subway stations496.6412.071535.96m
Number of subway stations0.2403no.
Number of libraries and cultural facilities0.6305no.
Parks and open spaces total area (ln) *5.82−4.6111.60m2
Average Euclidean distance to parks/open spaces164.30533.52m
Number of street trees113.020349no.
* Log transformation is conducted on the variables that are not normally distributed; ** Land Use Mix (LUM) is referenced from Frank and Pivo’s LUM entropy index [76]. Land use is categorized into three types (residential, commercial and business office).
Table A5. Correlation analysis of demographic and socioeconomic factors.
Dependent VariableObserved VariableSexAgeIncomeEducationResidence DurationNumber of Family Members
Social capitalNo. of close neighbors0.050 0.230**0.102*0.062 0.372**0.223**
Trust in neighbors0.068 0.167**0.058 0.031 0.167**0.175**
Expectation of help from neighbors0.068 0.110*0.086 0.015 0.181**0.198**
Frequency of conversation0.048 0.250**0.116*0.034 0.216**0.232**
Social sustainabilityIntention to live in the neighborhood−0.060 0.021 −0.032 −0.016 0.142**0.080
Sense of belonging0.070 0.209**0.131*0.007 0.205**0.204**
Participation in community affairs0.140**0.214**0.144*0.028 0.187**0.264**
* p < 0.10, ** p < 0.05.
Table A6. Parameter estimates.
Latent VariablesObserved VariablesStandardized Coefficientzp
Quality of perceived neighborhood environmentAir quality0.72620.800.000
Safety from crime0.65519.950.000
Natural environment quality0.73524.350.000
Maintenance0.76322.920.000
Residential area characteristicSingle house floor area (ln)0.72827.210.000
Row/multi-family house floor area (ln)0.53314.870.000
Average road width (ln)−0.881−41.660.000
Number of intersections (ln)0.74027.420.000
Land use diversityLand use mix index (ln)0.96644.590.000
Business use floor area (ln)0.58218.100.000
Commercial use floor area (ln)0.80534.040.000
Accessibility to parks and public sport facilitiesSatisfaction on public sport facility accessibility0.95812.030.000
Satisfaction on park accessibility0.66110.980.000
Neighborhood SESAverage price of apartment (10 k/m2 KRW)0.56912.080.000
100% poverty rate0.74215.730.000
Social capitalNumber of close neighbors (ln)0.67819.000.000
Trust in neighbors0.67520.280.000
Expectation of help from neighbors in case of emergency0.65519.260.000
Frequency of conversation with neighbors0.76024.460.000
Social sustainabilityIntention to live in the neighborhood0.44510.140.000
Sense of belonging0.66017.420.000
Participation in community affairs0.54913.850.000

References and Notes

  1. In Yongsan, Seoul, some residents who opposed redevelopment refused to move out of the property. Police raided the property on 20 January 2009; five civilians and one policeman died, and 24 people were wounded. Information available online: http://www.humanrightskorea.org/2013/yongsan-tragedy-protestors-pardoned/ (accessed on 3 December 2016).
  2. Jeong, Eunju. Yongsan Tragedy: Protestors pardoned. Human Rights South Korea. 2013. Available online: http://www.humanrightskorea.org/2013/yongsan-tragedy-protestors-pardoned/ (accessed on 3 December 2016).
  3. Seoul Urban Regeneration Comprehensive Plan Press Release. Seoul Metropolitan Government. Available online: https://opengov.seoul.go.kr/press/4218285 (accessed on 7 May 2015).
  4. Seoul Sustainable Development Master Plan. Seoul Metropolitan Government. Available online: http://opengov.seoul.go.kr/sanction/4534705 (accessed on 16 June 2015).
  5. The Seoul Urban Regeneration Comprehensive Plan was announced on 10 March 2015. It was established by the Department of Urban Regeneration in the City of Seoul. The plan designated 27 priority areas for urban regeneration and categorized the areas into four types (i.e., deteriorated industrial area, historical-cultural specialization area, under-utilized/under-developed area and deteriorated residential area) based on their physical and socioeconomic characteristics. For the deteriorated residential area regeneration, it is suggested to encourage residential regeneration with community preservation, rather than demolishing and redevelopment. Information available online: https://opengov.seoul.go.kr/press/4218285 (accessed on 7 May 2015).
  6. The Seoul Sustainable Development Master Plan was established by the Committee of Sustainable Development in the City of Seoul and announced to the public on 12 April 2015. The plan states that “sustainable development is a universal development strategy of mankind which is the balanced development consisting of preservation of environment, economic development and stability and integration of society”. It suggests a five-year plan consisting of three main parts: environmental, economic and socio-cultural sustainability. Each part has four strategies and 6–7 tasks. Information available online: http://opengov.seoul.go.kr/sanction/4534705 (accessed on 16 June 2015).
  7. 2015 Population and Housing Census Press Release. Korea National Statistical Office. Available online: http://kostat.go.kr/portal/eng/pressReleases/1/index.board?bmode=download&bSeq=&aSeq=356507&ord=1 (accessed on 11 September 2016).
  8. Woolcock, M.; Sweetser, A. Bright ideas: Social capital-the bonds that connect. ADB Rev. 2002, 34, 26–27. [Google Scholar]
  9. World Commission on Environment and Development. Our Common Future; Oxford University Press: Oxford, UK, 1987. [Google Scholar]
  10. Colantonio, A. Measuring Social Sustainability: Best Practice from Urban Renewal in the EU; EIBURS Working Paper Series; Oxford Brookes University: Oxford, UK, 2008; Available online: http://oisd.brookes.ac.uk/sustainable_communities/resources/SocialSustainability_Metrics_and_Tools.pdf (accessed on 23 May 2015).
  11. Polèse, M.; Stren, R.E. The Social Sustainability of Cities: Diversity and the Management of Change; University of Toronto Press: Toronto, ON, Canada, 2000. [Google Scholar]
  12. Colantonio, A. Social sustainability: A review and critique of traditional versus emerging themes and assessment methods. In Proceedings of the Second International Conference on Whole Life Urban Sustainability and Its Assessment, Loughborough University, Loughborough, UK, 22–24 April 2009; Horner, M., Price, A., Bebbington, J., Emmanuel, R., Eds.; Loughborough University: Loughborough, UK, 2009; pp. 865–885. [Google Scholar]
  13. Biart, M. Social sustainability as part of the social agenda of the European community. In Soziale Nachhaltigkeit: Von der Umweltpolitik zur Nachhaltigkeit? Arbeiterkammer Wien: Vienna, Austria, 2002; pp. 5–10. [Google Scholar]
  14. McKenzie, S. Social Sustainability: Toward Some Definitions; Hawke Research Institute Working Paper Series; Hawke Research Institute, University of South Australia: Adelaide, Australia, 2004; Volume 27, pp. 1–25. [Google Scholar]
  15. Littig, B.; Grießler, E. Social sustainability: A catchword between political pragmatism and social theory. Int. J. Sustain. Dev. 2005, 8, 65–79. [Google Scholar] [CrossRef]
  16. Yiftachel, O.; Hedgcock, D. Urban social sustainability: The planning of an Australian city. Cities 1993, 10, 139–157. [Google Scholar] [CrossRef]
  17. Dempsey, N.; Bramley, G.; Power, S.; Brown, C. The social dimension of sustainable development: Defining urban social sustainability. Sustain. Dev. 2011, 19, 289–300. [Google Scholar] [CrossRef]
  18. Dempsey, N.; Brown, C.; Bramley, G. The key to sustainable urban development in UK cities? The influence of density on social sustainability. Prog. Plan. 2012, 77, 89–141. [Google Scholar] [CrossRef]
  19. Lim, H.B. A Study on cognition and countermeasure of urban crime based on urban planning. J. Police Policies 2010, 24, 55–83. [Google Scholar]
  20. Min, Y.K.; Park, D.K.; Lee, D.K. Analysis of the impacts of policies for CPTED local security council: Focusing on the crime prevention effect. Korean Police Stud. Rev. 2015, 14, 63–89. [Google Scholar]
  21. Turkington, R.; Sangster, K. From housing to social mix: Housing’s contribution to social sustainability. Town Ctry Plan. 2006, 75, 184–185. [Google Scholar]
  22. Bourdieu, P.; Wacquant, L.J.D. An Invitation to Reflexive Sociology; University of Chicago Press: Chicago, IL, USA, 1992. [Google Scholar]
  23. Coleman, J. Social capital in the creation of human capital. Am. J. Sociol. 1988, 94, 95–120. [Google Scholar] [CrossRef]
  24. Putnam, R. Bowling Alone: The Collapse and Revival of American Community; Touchstone Books: New York, NY, USA, 2001. [Google Scholar]
  25. Fukuyama, F. Social capital, civil society and development. Third World Q. 2001, 22, 7–20. [Google Scholar] [CrossRef]
  26. Winter, I. Towards a Theorised Understanding of Social Capital; Australian Institute of Family Studies Working Paper 21; Australian Institute of Family Studies: Melbourne, Australia, 2000. [Google Scholar]
  27. Australian Bureau of Statistics. Social Capital and Social Wellbeing; Australian Bureau of Statistics: Canberra, Australia, 2002.
  28. Fukuyama, F. Social capital and the global economy. Foreign Aff. 1995, 74, 89–103. [Google Scholar] [CrossRef]
  29. Legh-Jones, H.; Moore, S. Network social capital, social participation, and physical inactivity in an urban adult population. Soc. Sci. Med. 2012, 74, 1362–1367. [Google Scholar] [CrossRef] [PubMed]
  30. Healy, T.; Côté, S. The Well-being of Nations; OECD: Paris, France, 2001. [Google Scholar]
  31. World Bank. What Is Social Capital? World Bank. Available online: http://www.worldbank.org/en/webarchives/archive?url=http%3A%2F%2Fweb.worldbank.org%2Farchive%2Fwebsite01360%2FWEB%2F0__CO-10.HTM&mdk=23354653/ (accessed on 14 October 2015).
  32. Baines, J.; Morgan, B. Sustainability Appraisal: A Social Perspective, International Institute for Environment and Development. Available online: http://pubs.iied.org/pdfs/G02181.pdf (accessed on 23 May 2015).
  33. Sinner, J.; Baines, J.; Crengle, H.; Salmon, G.; Fenemor, A.; Tipa, G. Sustainable development: A summary of key concepts. Ecol. Res. Rep. 2004, 2, 1–23. [Google Scholar]
  34. Woodcraft, S.; Bacon, N.; Caistor-Arendar, L.; Hackett, T. Design for Social Sustainability; Social Life: London, UK, 2012. [Google Scholar]
  35. Kan, K. Residential mobility and social capital. J. Urban Econ. 2007, 61, 436–457. [Google Scholar] [CrossRef]
  36. Silburn, R.; Lucas, D.; Page, R.; Hanna, L. Neighbourhood Images in Nottingham: Social Cohesion and Neighbourhood Change; Joseph Rowntree Foundation: York, UK, 1999. [Google Scholar]
  37. Yoo, C.; Lee, S. Neighborhood environment, social capital, and social sustainability of community: Explanatory study on causal relationships. J. Korea Plan. Assoc. 2015, 50, 5–23. [Google Scholar] [CrossRef]
  38. Various institutions and organizations, such as the Sustainable Development Commission and the Department for Communities and Local Governments, suggest a planning policy to enhance social sustainability. Information available online: http://www.sd-commission.org.uk/ (accessed on 11 December 2015) and https://www.gov.uk/government/publications/dclg-single-departmental-plan-2015-to-2020/single-departmental-plan-2015-to-2020 (accessed on 16 September 2016).
  39. Sustainable Development Commision. Available online at: http://www.sd-commission.org.uk/ (accessed on 11 December 2015).
  40. Single Departmental Plan: 2015 to 2020. Department for Communities and Local Governments. Available online: https://www.gov.uk/government/publications/dclg-single-departmental-plan-2015-to-2020/single-departmental-plan-2015-to-2020 (accessed on 16 September 2016).
  41. Wood, L.; Giles-Corti, B.; Bulsara, M. Streets apart: Does social capital vary with neighbourhood design? Urban Stud. Res. 2012, 2012, 1–11. [Google Scholar] [CrossRef]
  42. Chan, E.; Lee, G.K.L. Critical factors for improving social sustainability of urban renewal projects. Soc. Indic. Res. 2008, 85, 243–256. [Google Scholar] [CrossRef]
  43. Bramley, G.; Power, S. Urban form and social sustainability: The role of density and housing type. Environ. Plan. B Plan. Des. 2009, 36, 30–48. [Google Scholar] [CrossRef]
  44. Dave, S. Neighbourhood density and social sustainability in cities of developing countries. Sustain. Dev. 2011, 19, 189–205. [Google Scholar] [CrossRef]
  45. Dempsey, N. Are good-quality environments socially cohesive?: Measuring quality and cohesion in urban neighbourhoods. Town Plan. Rev. 2009, 80, 315–345. [Google Scholar] [CrossRef]
  46. Bramley, G.; Dempsey, N.; Power, S.; Brown, C.; Watkins, D. Social sustainability and urban form: Evidence from five British cities. Environ. Plan. A 2009, 41, 2125–2142. [Google Scholar] [CrossRef]
  47. French, S.; Wood, L.; Foster, S.A.; Giles-Corti, B.; Frank, L.; Learnihan, V. Sense of community and its association with the neighborhood built environment. Environ. Behav. 2014, 46, 677–697. [Google Scholar] [CrossRef]
  48. Nash, V.; Christie, I. Making Sense of Community; Institute for Public Policy Research: London, UK, 2003. [Google Scholar]
  49. Chiesura, A. The role of urban parks for the sustainable city. Landsc. Urban Plan. 2003, 68, 129–138. [Google Scholar] [CrossRef]
  50. Leyden, K.M. Social capital and the built environment: The importance of walkable neighborhoods. Am. J. Public Health 2003, 93, 1546–1551. [Google Scholar] [CrossRef] [PubMed]
  51. Kamruzzaman, M.D.; Wood, L.; Hine, J.; Currie, G.; Giles-Corti, B.; Turrell, G. Patterns of social capital associated with transit oriented development. J. Trans. Geogr. 2014, 35, 144–155. [Google Scholar] [CrossRef] [Green Version]
  52. Chun, H.S. A study on the social capital of apartment complex in large cities. Korean J. Soc. 2004, 38, 215–247. [Google Scholar]
  53. Kim, S.N.; Kim, J.H. The empirical relationship between the neighborhood-level social mix and the residents’ social capital and experience of receiving help. Korea Spat. Plan. Rev. 2013, 76, 93–112. [Google Scholar]
  54. Four administrative local municipalities were selected as the study areas among 25 local municipalities (gu) in Seoul. In the selection, the following aspects were considered. First, to reflect the general characteristics of the residential neighborhood environment, local municipalities including employment centers (Gangnam-gu, Yeongdeungpo-gu and Yeoido-dong, Jongno-gu and Jung-gu) and the hinterlands designated in the Seoul 2030 Plan were excluded (information available online: urban.seoul.go.kr/4DUPIS/download/sub3_1/1_seoul_plan.pdf, accessed on 15 June 2015). In addition, spatially-congregated local municipalities are considered to be preferable to minimize heterogeneous characteristics among case study areas, especially in the case of using data based on municipality units, such as demographic and socioeconomic characteristics and the municipality’s financial independence rate. Lastly, to include various neighborhood environments in the analysis, local municipalities with neighboring diverse housing types and natural environments are selected.
  55. Seoul 2030 Plan. Seoul Metropolitan Government. Available online: urban.seoul.go.kr/4DUPIS/download/sub3_1/1_seoul_plan.pdf (accessed on 15 June 2015).
  56. mong the questions, those about “sense of community” and “frequency of conversation with neighbors” used four-point Likert scales, since responses to those questions were expected to converge on a median value. The question about “number of close neighbors” had an open format because possible answers were unpredictable.
  57. SaeJuso DB (2014) is acquired from Korean Ministry of Land, Infrastructure, and Transport by request. The database contains geographic information of buildings and roads.
  58. Seoul Tax Roll (2013) is acquired from City of Seoul by request. It contains the specific usage of individual buildings.
  59. eoul Open Data Plaza Provides Public Data Including Population, Transportation, Environment, etc. Available online: data.seoul.go.kr/ (accessed on 10 September 2015).
  60. Integration is a value that indicates the connectedness of the street network in space syntax theory. Global integration indicates the connectedness of streets at the entire scale, while local integration indicates the connectedness of streets at the local scale, such as metric distance. Empirical studies based on space syntax theory insist that the integration value of street network has a positive relationship with walking or crime. See Lamíquiz, J.P.; López-Domínguez, J. Effects of built environment on walking at the neighbourhood scale. A new role for street networks by modelling their configurational accessibility? Trans. Res. Part A 2015, 74, 148–163; Hillier, B.; Sahbaz, O. An Evidence Based Approach to Crime and Urban Design: Or, Can We Have Vitality, Sustainability and Security All at Once?; Bartlett School of Graduate Studies: London, UK, 2004.
  61. Penninx, R.; Kraal, K.; Martinello, M.; Vertovec, S. Citizenship in European cities: Immigrants, Local Politics and Integration Policies; Ashgate: Aldershot, UK, 2004. [Google Scholar]
  62. Barton, H. Sustainable Communities: The Potential for Eco-Neighbourhoods; Earthscan: London, UK, 2000. [Google Scholar]
  63. Social equity is not considered because it is related to the matter of accessibility, which is influenced only by physical factors.
  64. Kearns, A.; Forrest, R. Social cohesion and multilevel urban governance. Urban Stud. 2000, 37, 995–1017. [Google Scholar] [CrossRef]
  65. Wilson, W.J.; Taub, R.P. There Goes the Neighborhood: Racial, Ethnic and Class Tensions in Four Chicago Neighborhoods and Their Meaning for America; Knopf: New York, NY, USA, 2006. [Google Scholar]
  66. Ha, S.K. Social capital across different housing tenure and community revitalization in Seoul. Hous. Stud. Rev. 2009, 17, 77–94. [Google Scholar]
  67. Ha, S.K.; Park, K.D. Influencing factors in social capital and regeneration of residential communities: Comparative study on housing estates in Seoul and rural village in Yeoju. Korean Local Gov. Rev. 2011, 12, 133–153. [Google Scholar]
  68. Park, S.H.; Park, B.H. Influence of neighborhoods characters on social capital. Soc. Welf. Policy 2012, 39, 85–123. [Google Scholar]
  69. Park, S.K.; Kim, H.Y.; Kang, H.K.; Park, S.H. The Terms and Prospects of Social Capital for the Invigoration of Community-Based Welfare; Korea Institute for Health and Social Affairs: Seoul, Korea, 2008. [Google Scholar]
  70. Office for National Statistics. Available online: http://www.ons.gov.uk/ons/dcp171766_371693.pdf (accessed on 3 October 2015).
  71. Mason, M.J. Attributing activity space as risky and safe: The social dimension to the meaning of place for urban adolescents. Health Place 2010, 16, 926–933. [Google Scholar] [CrossRef] [PubMed]
  72. Uzzell, D.; Pol, E.; Badenas, D. Place identification, social cohesion, and environmental sustainability. Environ. Behav. 2002, 34, 26–53. [Google Scholar] [CrossRef]
  73. Wood, L.; Shannon, T.; Bulsara, M.; Pikora, T.; McCormack, G.; Giles-Corti, B. The anatomy of the safe and social suburb: An explanatory study of the built environment, social capital and residents’ perceptions of safety. Health Place 2008, 14, 15–31. [Google Scholar] [CrossRef] [PubMed]
  74. Dempsey, N. Does quality of the built environment affect social cohesion? Urban Des. Plan. 2008, 161, 105–114. [Google Scholar] [CrossRef]
  75. Rogers, H.M.; Gardner, K.H.; Carlson, C.H. Social capital and walkability as social aspects of sustainability. Sustainability 2013, 5, 3473–3483. [Google Scholar] [CrossRef]
  76. Frank, L.D.; Pivo, G. Impacts of mixed use and density on utilization of three modes of travle: Single-occupant vehicle, transit, and walking. Transportation Research Record. 1994, 1466, 37–43, Accordingly, LUM can be calculated by the following formula: LUM = ( 1 ) × [ ( β 1 / α ) ln ( β 1 α ) + ( β 2 α ) ln ( β 2 α ) + ( β 3 / α ) ln ( β 3 α ) ] / ln ( n 3 ) where α = sum of all land use total floor area; β1 = residential use total floor area; β2 = commercial use total floor area; β3 = business use total floor area; n3 = number of land uses. [Google Scholar]
  77. Jun, H.J.; Hur, M. The relationship between walkability and neighborhood social environment: The importance of physical and perceived walkability. Appl. Geogr. 2015, 62, 115–124. [Google Scholar] [CrossRef]
  78. Kwak, H.K. A Study on Influential Factors on Neighborhood-related Social Capital. Korean Soc. Public Adm. 2003, 14, 259–285. [Google Scholar]
  79. Kwak set the poverty area as a variable if the proportion of beneficiaries of national basic livelihood (BNBL) in the neighborhood exceeds 10%. Instead of designating a “poverty area”, poverty rate (proportion of BNBL) is directly used. In order to ensure consistency in the directions of variables, the poverty rate is set to be “1−poverty rate (%) of basic administrative unit”. See Kwak, H.K. A Study on Influential Factors on Neighborhood-related Social Capital. Korean Soc. Public Adm. 2003, 14, 259–285.
  80. The data are collected from the Ministry of Land, Infrastructure and Transport’s Market Price Open System (http://rt.molit.go.kr/).
  81. Neighborhood environment variables drawn from factor analysis are extracted by principal factor extraction and rotated by the Varimax method. Therefore, there is no covariance between the two latent variables of the perceived quality of neighborhood environment and accessibility to parks and public sport facilities. However, covariances are set among some observed variables because there can be associations among them. Neighborhood SES was not extracted by factor analysis, so it can have covariance with neighborhood environment latent variables.
  82. In social sustainability theory or policy, economic development is considered an important contributing factor because the economic status of cities or communities is directly related to the quality of life. The Partnership for Sustainable Communities a joint organization of three government agencies, sets economic vitalization as one of the objectives in a sustainable community. Information available online: https://www.sustainablecommunities.gov (accessed on 3 December 2016).
  83. An indirect effect can be calculated by multiplication of the values of paths. For instance, if there is a path A → B → C, the indirect effect value of A on C can be calculated by multiplying the value of A → B by B → C.
  84. Cairnduff, S. Sport and Recreation for Indigenous Youth in the Northern Territory: Scoping Research Priorities for Health and Social Outcomes; Cooperative Research Centre for Aboriginal and Tropical Health and Australian Sports Commission: Darwin, Australia, 2001. [Google Scholar]
  85. Skinner, J.; Zakus, D.H.; Cowell, J. Development through sport: Building social capital in disadvantaged communities. Sport Manag. Rev. 2008, 11, 253–275. [Google Scholar] [CrossRef]
  86. Jacobs, J. The Death and Life of Great American Cities; Random House: New York, NY, USA, 1961. [Google Scholar]
  87. Congress for New Urbanism. Charter of the New Urbanism; McGraw-Hill: New York, NY, USA, 2000. [Google Scholar]
  88. 2015 Resident Registration Statistics Data. Ministry of the Interior. Available online: http://rcps.egov.go.kr:8081/jsp/stat/ppl_stat_jf.jsp (accessed on 13 August 2015).
Figure 1. Case study areas and respondents’ locations.
Sustainability 08 01346 g001
Figure 2. Framework of structural equation modeling (SEM). 1 TFP: Total Floor Area; 2 Apt: Apartment; 3 NPR: (1 − poverty rate) × 100.
Sustainability 08 01346 g002
Figure 3. Result of the structural equation model. Covariance values between observed variables omitted. * p < 0.1, ** p < 0.05, *** p < 0.01. 1 TFP: Total Floor Area; 2 Apt: Apartment; 3 NPR: (1 − poverty rate) × 100.
Sustainability 08 01346 g003
Table 1. Demographic characteristics of the study areas (2015).
Area (km2)Total PopulationAged Population (65+ Years Old)Resident PopulationForeign Population
Number%Number%Number%
Seoul city605.2510,369,0671,239,43111.959,550,20692.10415,0594.00
Study area (total)66.631,480,135181,00812.231,376,02292.9758,8803.98
Seungdong-gu16.86303,77737,16212.23288,31694.9112,3994.08
Gwangjin-gu17.06377,20439,46910.46355,48394.2420,1875.35
Dongdaemun-gu14.21376,32951,55913.70336,52989.4217,8714.75
Jungnang-gu18.50422,82552,81812.49395,69493.5884231.99
Table 2. Latent variable of social sustainability.
Latent VariableCronbach’s αMeasureContent
Social sustainability0.5620Sense of communitySense of belonging as a community member of a neighborhood
Community stabilityIntention to keep living in the neighborhood
ParticipationParticipation in neighborhood affairs
Table 3. Latent variable of social capital.
Latent VariableCronbach’s αMeasureContent
Social capital0.8324NetworkNumber of close neighbors
Frequency of conversation with neighbors
TrustTrust in neighbors
Trust and ReciprocityExpectation of help from neighbors in case of emergency
Table 4. Latent variables of perceived neighborhood environment.
Latent VariableCronbach’s αMeasure
Quality of perceived neighborhood environment0.7996Air quality satisfaction
Safety from crime satisfaction
Natural environment satisfaction
Maintenance satisfaction
Accessibility to parks and public sport facilities0.7745Park accessibility satisfaction
Public sport facilities satisfaction
Table 5. Latent variables of the objectively-measured neighborhood environment.
Latent VariableCronbach’s αObserved VariablesFactor Loading
Characteristics of residential areas0.8419Single-family housing total floor area (ln)0.866
Row/multi-family housing total floor area (ln)−0.841
Average road width (ln)0.801
Number of intersections0.765
Land use diversity0.8249Land Use Mix (LUM) entropy index0.898
Business facility total floor area (ln)0.881
Commercial facility total floor area (ln)0.765
Table 6. Neighborhood socioeconomic status (SES).
Latent VariableCronbach’s αObserved Variable
Neighborhood SES0.5620Average apartment market price (10 k/m2 KRW *)
(1 − poverty rate **) × 100
* KRW, Korean Won; ** Poverty rate, proportion of population under poverty line.
Table 7. Indices of the model fit.
LR χ2RMSEApCFITLI (NFI)SRMR
Criteria-≤0.08>0.050.9≤0.9≤≤0.08
Model640.4110.0550.0000.9200.9010.085
LR, Log-likelihood; RMSEA, Root Mean Square Error of Approximation; CFI, Comparative Fit Index; TLI(NFI), Tucker Lewis Index; SRMR, Standardized Root Mean Square Residual.
Table 8. Path coefficients of the structural equation model.
Latent VariablesCategoryVariablesStandardized Coefficientzp
Social capitalIndependentPerceived environment quality0.2845.250.000
Characteristics of a residential area−0.072−0.640.520
Land use diversity0.1201.870.061
Accessibility to parks/public sport facilities0.3065.480.000
ModeratingAge0.2094.300.000
Duration of residence0.2435.070.000
Income−0.030−0.560.573
Number of family members0.2034.300.000
Neighborhood SES−0.183−1.500.133
Social sustainabilityIndependentSocial capital0.86710.970.000
Perceived environment quality0.1472.350.019
Characteristics of a residential area0.0900.810.418
Land use diversity−0.087−1.320.187
Accessibility to parks/public sport facilities0.0631.010.313
ModeratingAge0.0190.350.726
Duration of residence0.0290.550.585
Income−0.004−0.070.945
Number of family members0.0510.930.352
Neighborhood SES0.2622.070.038
Table 9. Effect analysis of the structural equation model.
Latent VariablesVariablesTotalDirectIndirect
Standardized CoefficientzStandardized CoefficientzStandardized Coefficientz
Social capitalPerceived environment quality0.284**4.870.284***4.87
Characteristics of a residential area−0.072 −0.64−0.072 −0.64
Land use diversity0.120*1.830.120*1.83
Accessibility to parks/sport facilities0.306***5.520.306***5.52
Social sustainabilitySocial capital0.867***7.850.867***7.85
Perceived environment quality0.392***6.020.147**2.340.246***4.29
Characteristics of a residential area0.028 0.230.090 0.81−0.062 −0.63
Land use diversity0.017 0.24−0.087 −1.320.104*1.77
Accessibility to parks/sport facilities0.328***5.270.063 1.01−0.256***4.83
* p < 0.1; ** p < 0.05; *** p < 0.01.

