
How Attractive Is Upland Olive Groves Landscape? Application of the Analytic Hierarchy Process and GIS in Southern Spain

Abstract
:1. Introduction
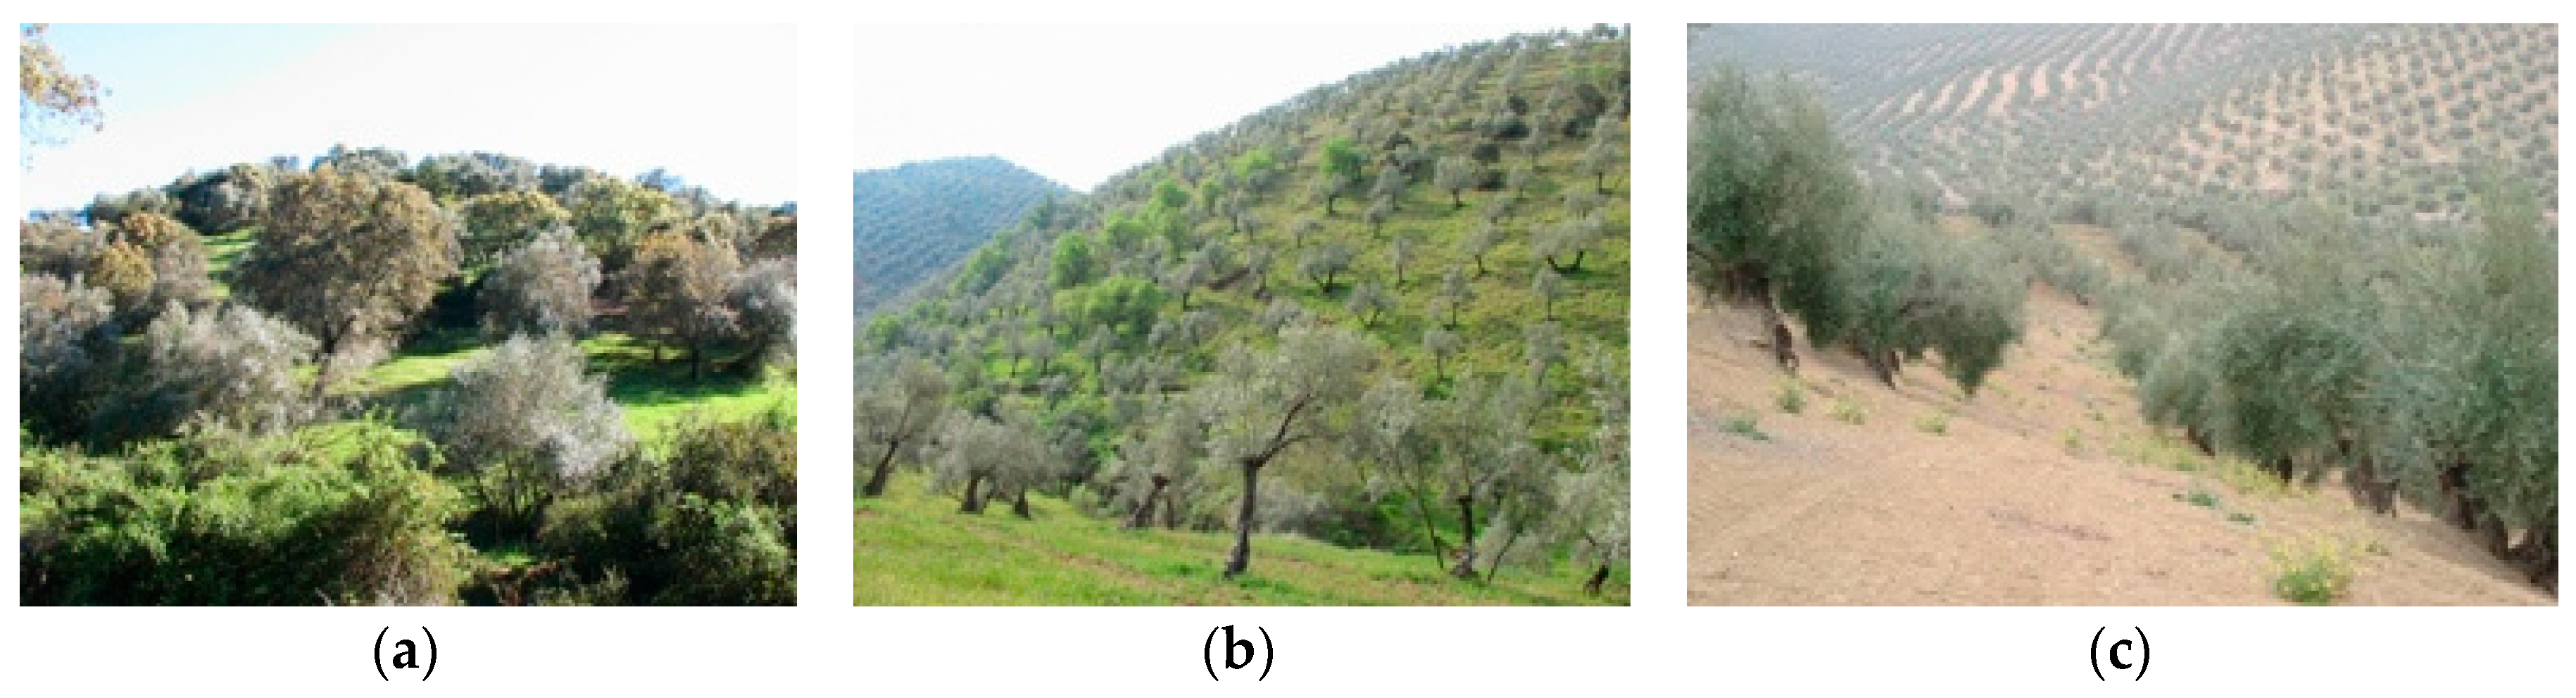
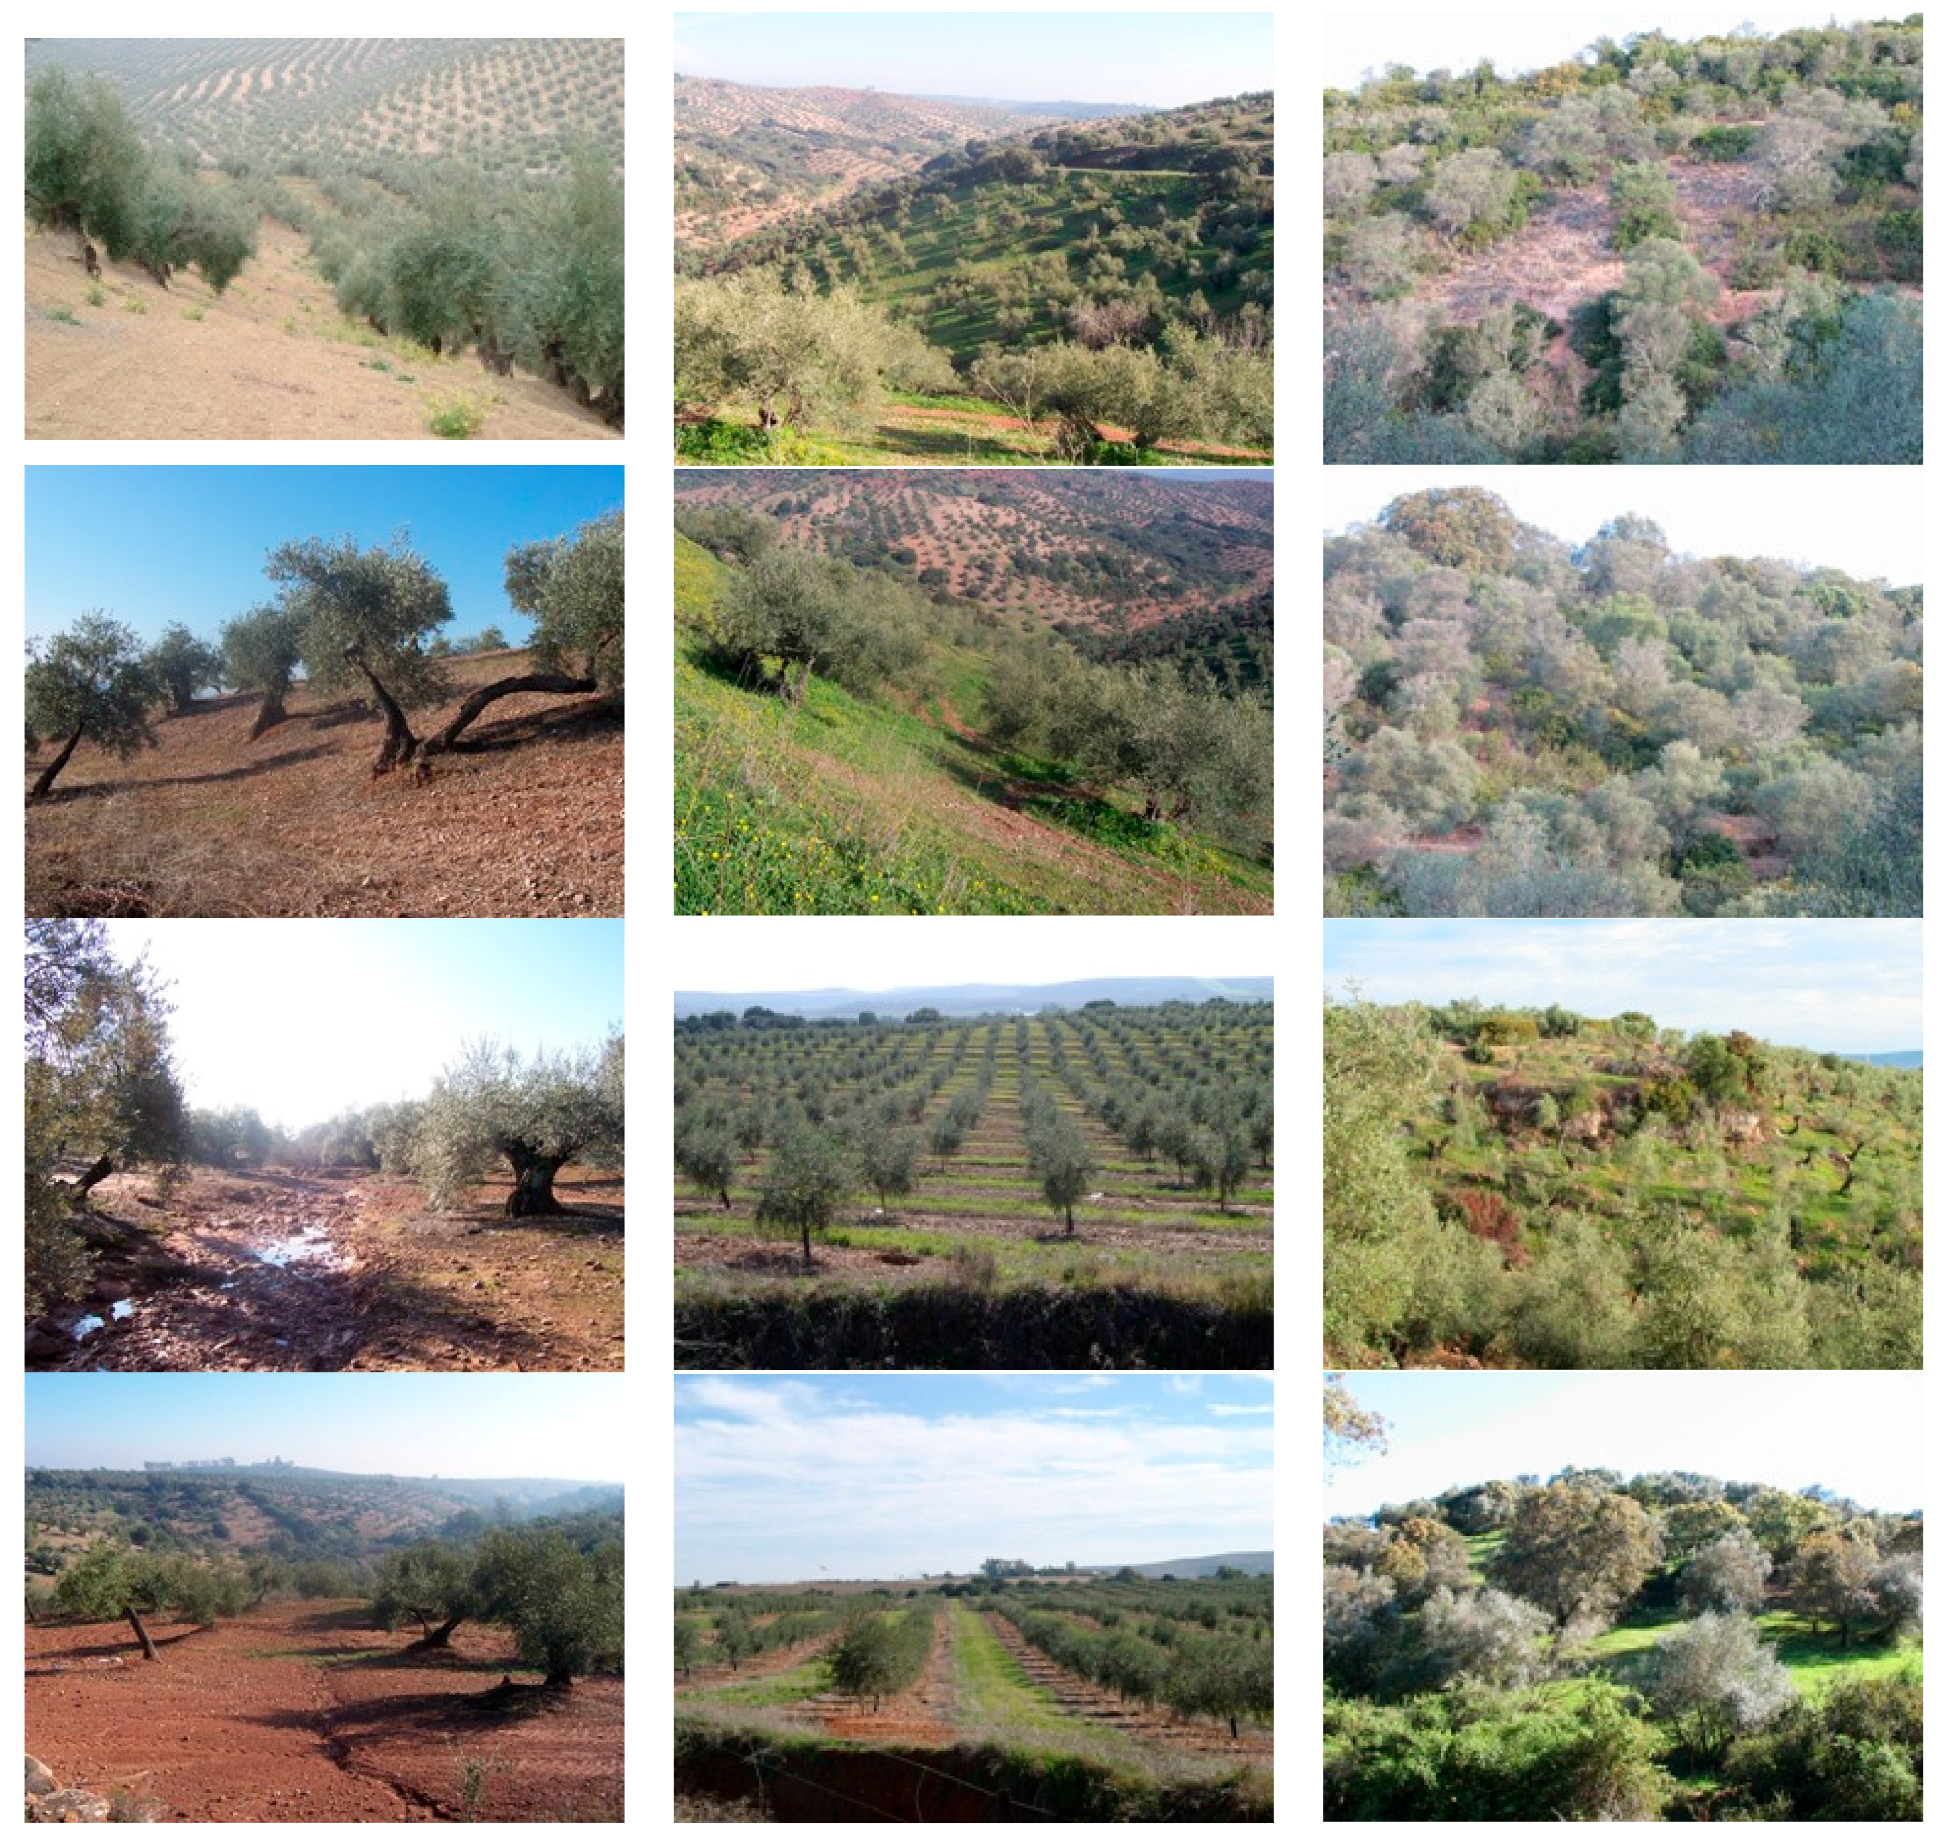
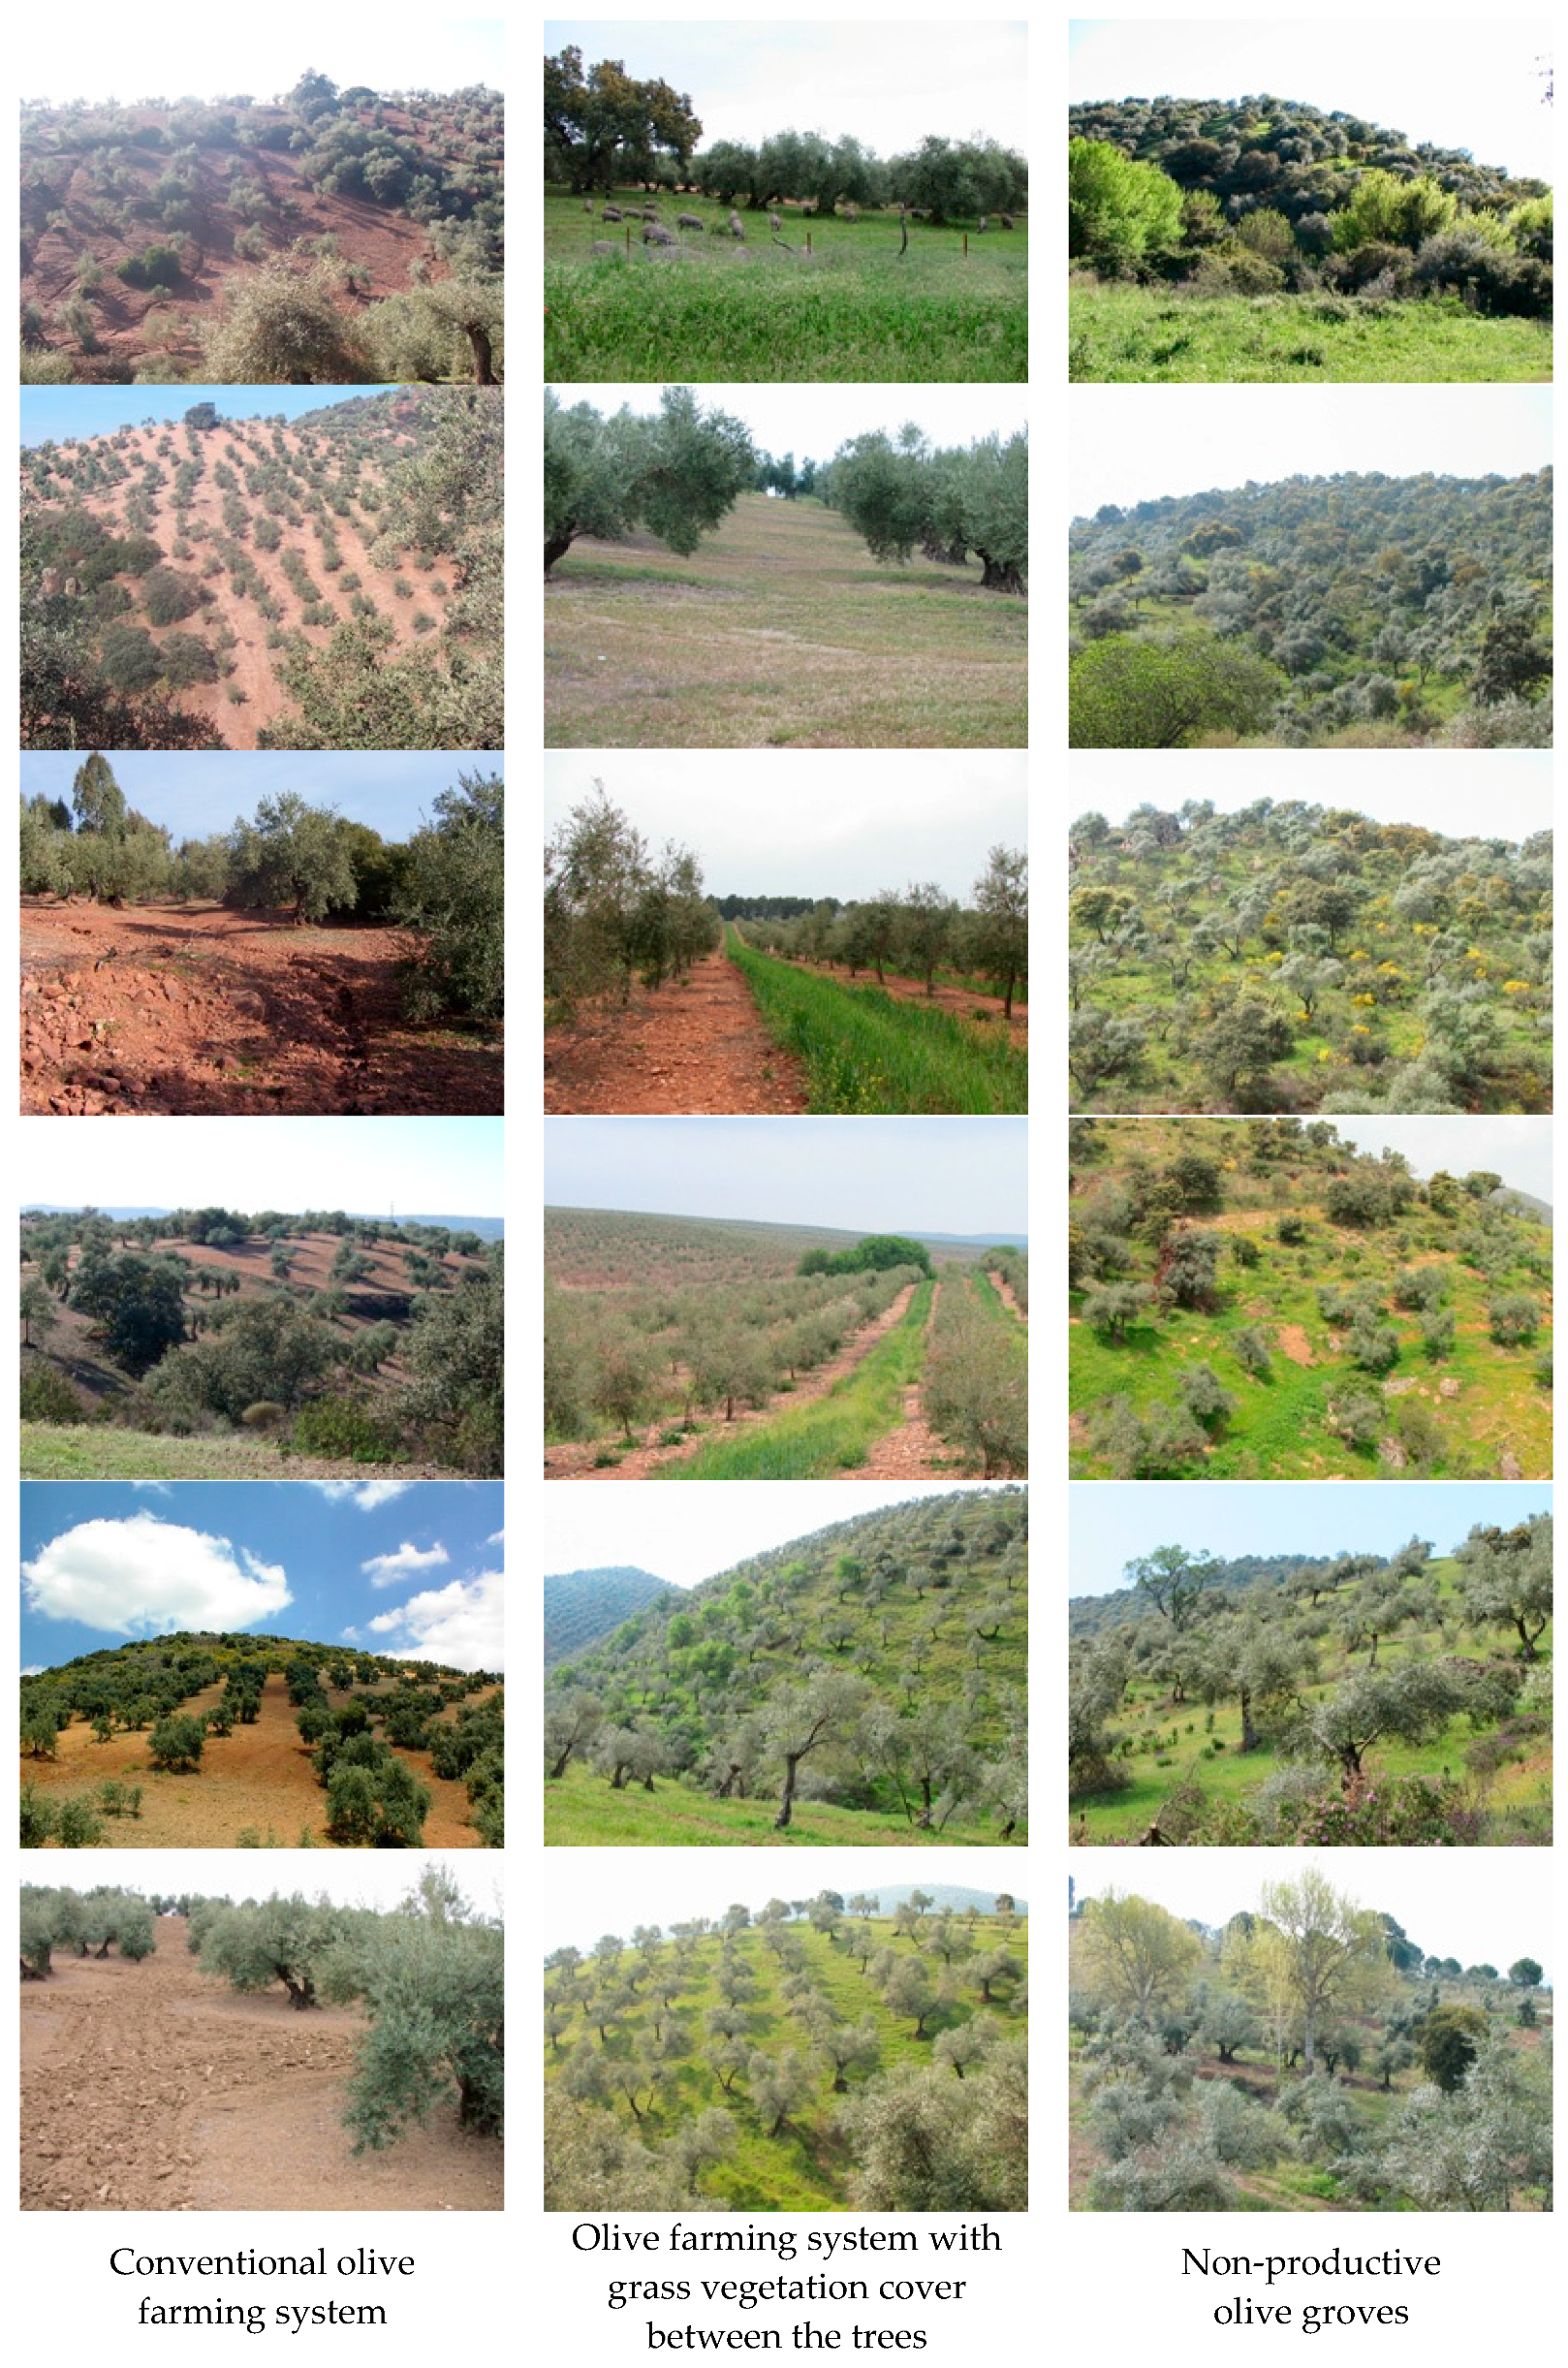
- Non-productive olive groves (now being replaced by local wild plants and trees and therefore becoming Mediterranean forest);
- Integrated and organic olive farming systems with grass vegetation cover between the trees;
- Conventional olive farming system without grass vegetation cover between the trees.
2. Materials and Methods
2.1. Study Area
2.2. Methodology
- First phase: Analytic Hierarchy Process (AHP) opinion survey on public preferences regarding the three types of olive landscapes;
- Second phase: The visibility assessment of the study area;
- Third phase: The assessment of visual quality of the study area.
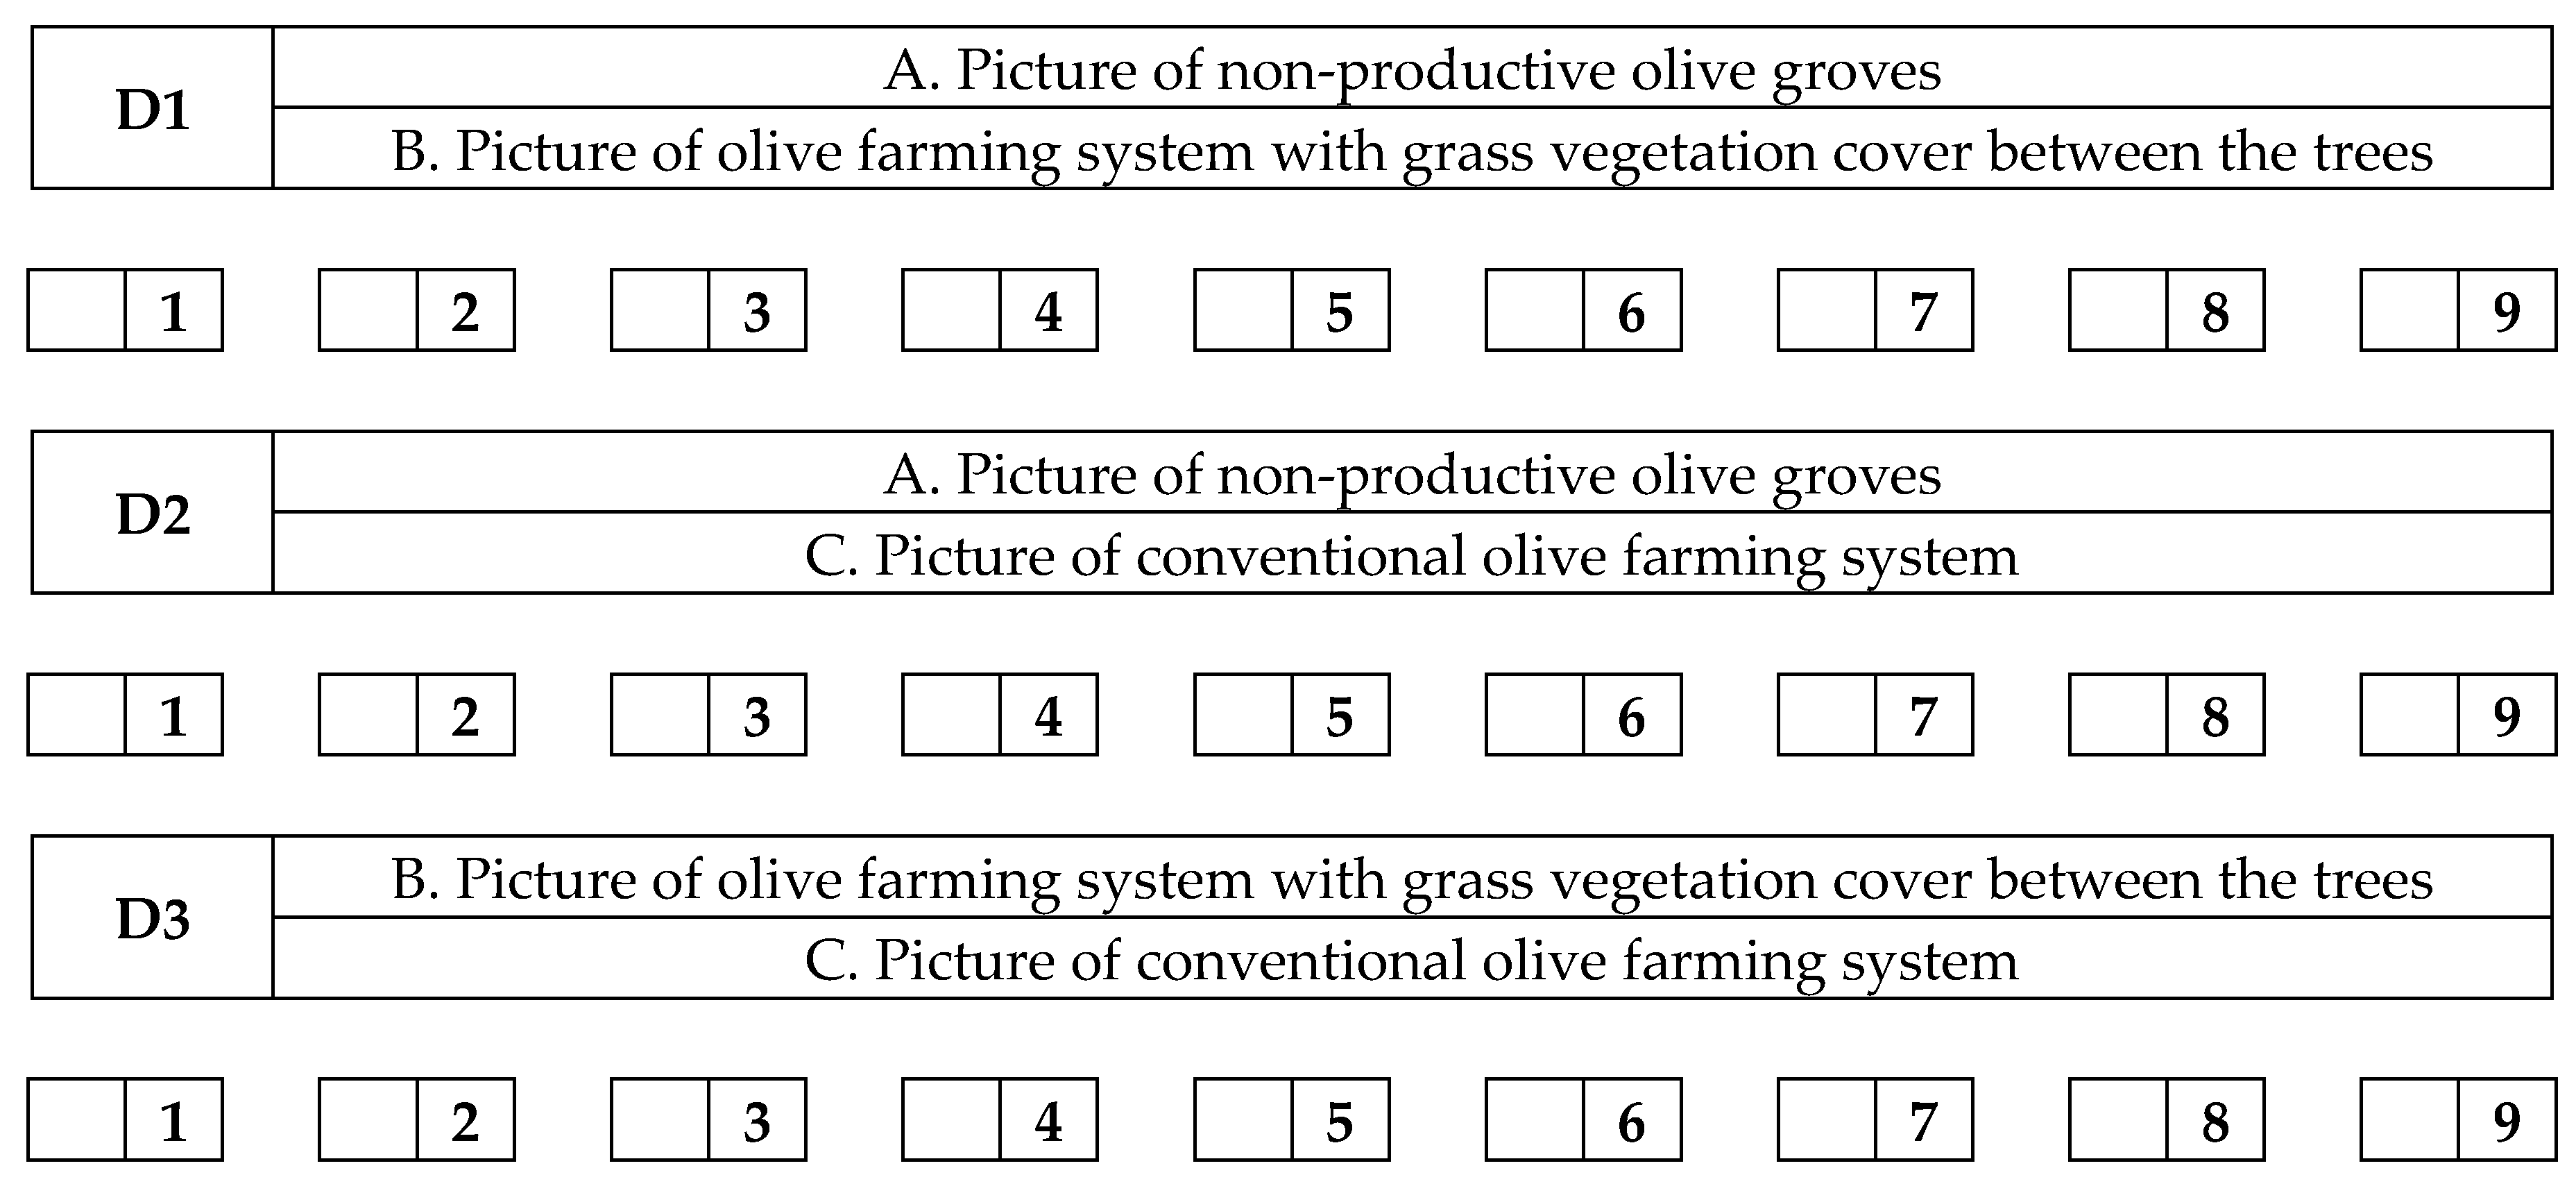
2.2.1. The Analytic Hierarchy Process (AHP) and the Opinion Survey on Public Preferences
- Younger than 35 (251 interviewed);
- 36–50 (128 interviewed); and
- 50–69 (95 interviewed).
- Municipalities with less than 10,000 inhabitants (130 interviewed);
- Municipalities with 10,000–25,000 inhabitants (88 interviewed); and
- Municipalities with more than 25,000 inhabitants (255 interviewed).
2.2.2. Visibility Assessment of the Study Area
2.2.3. Assessment of Visual Quality of the Study Area
3. Results
3.1. AHP Opinion Survey
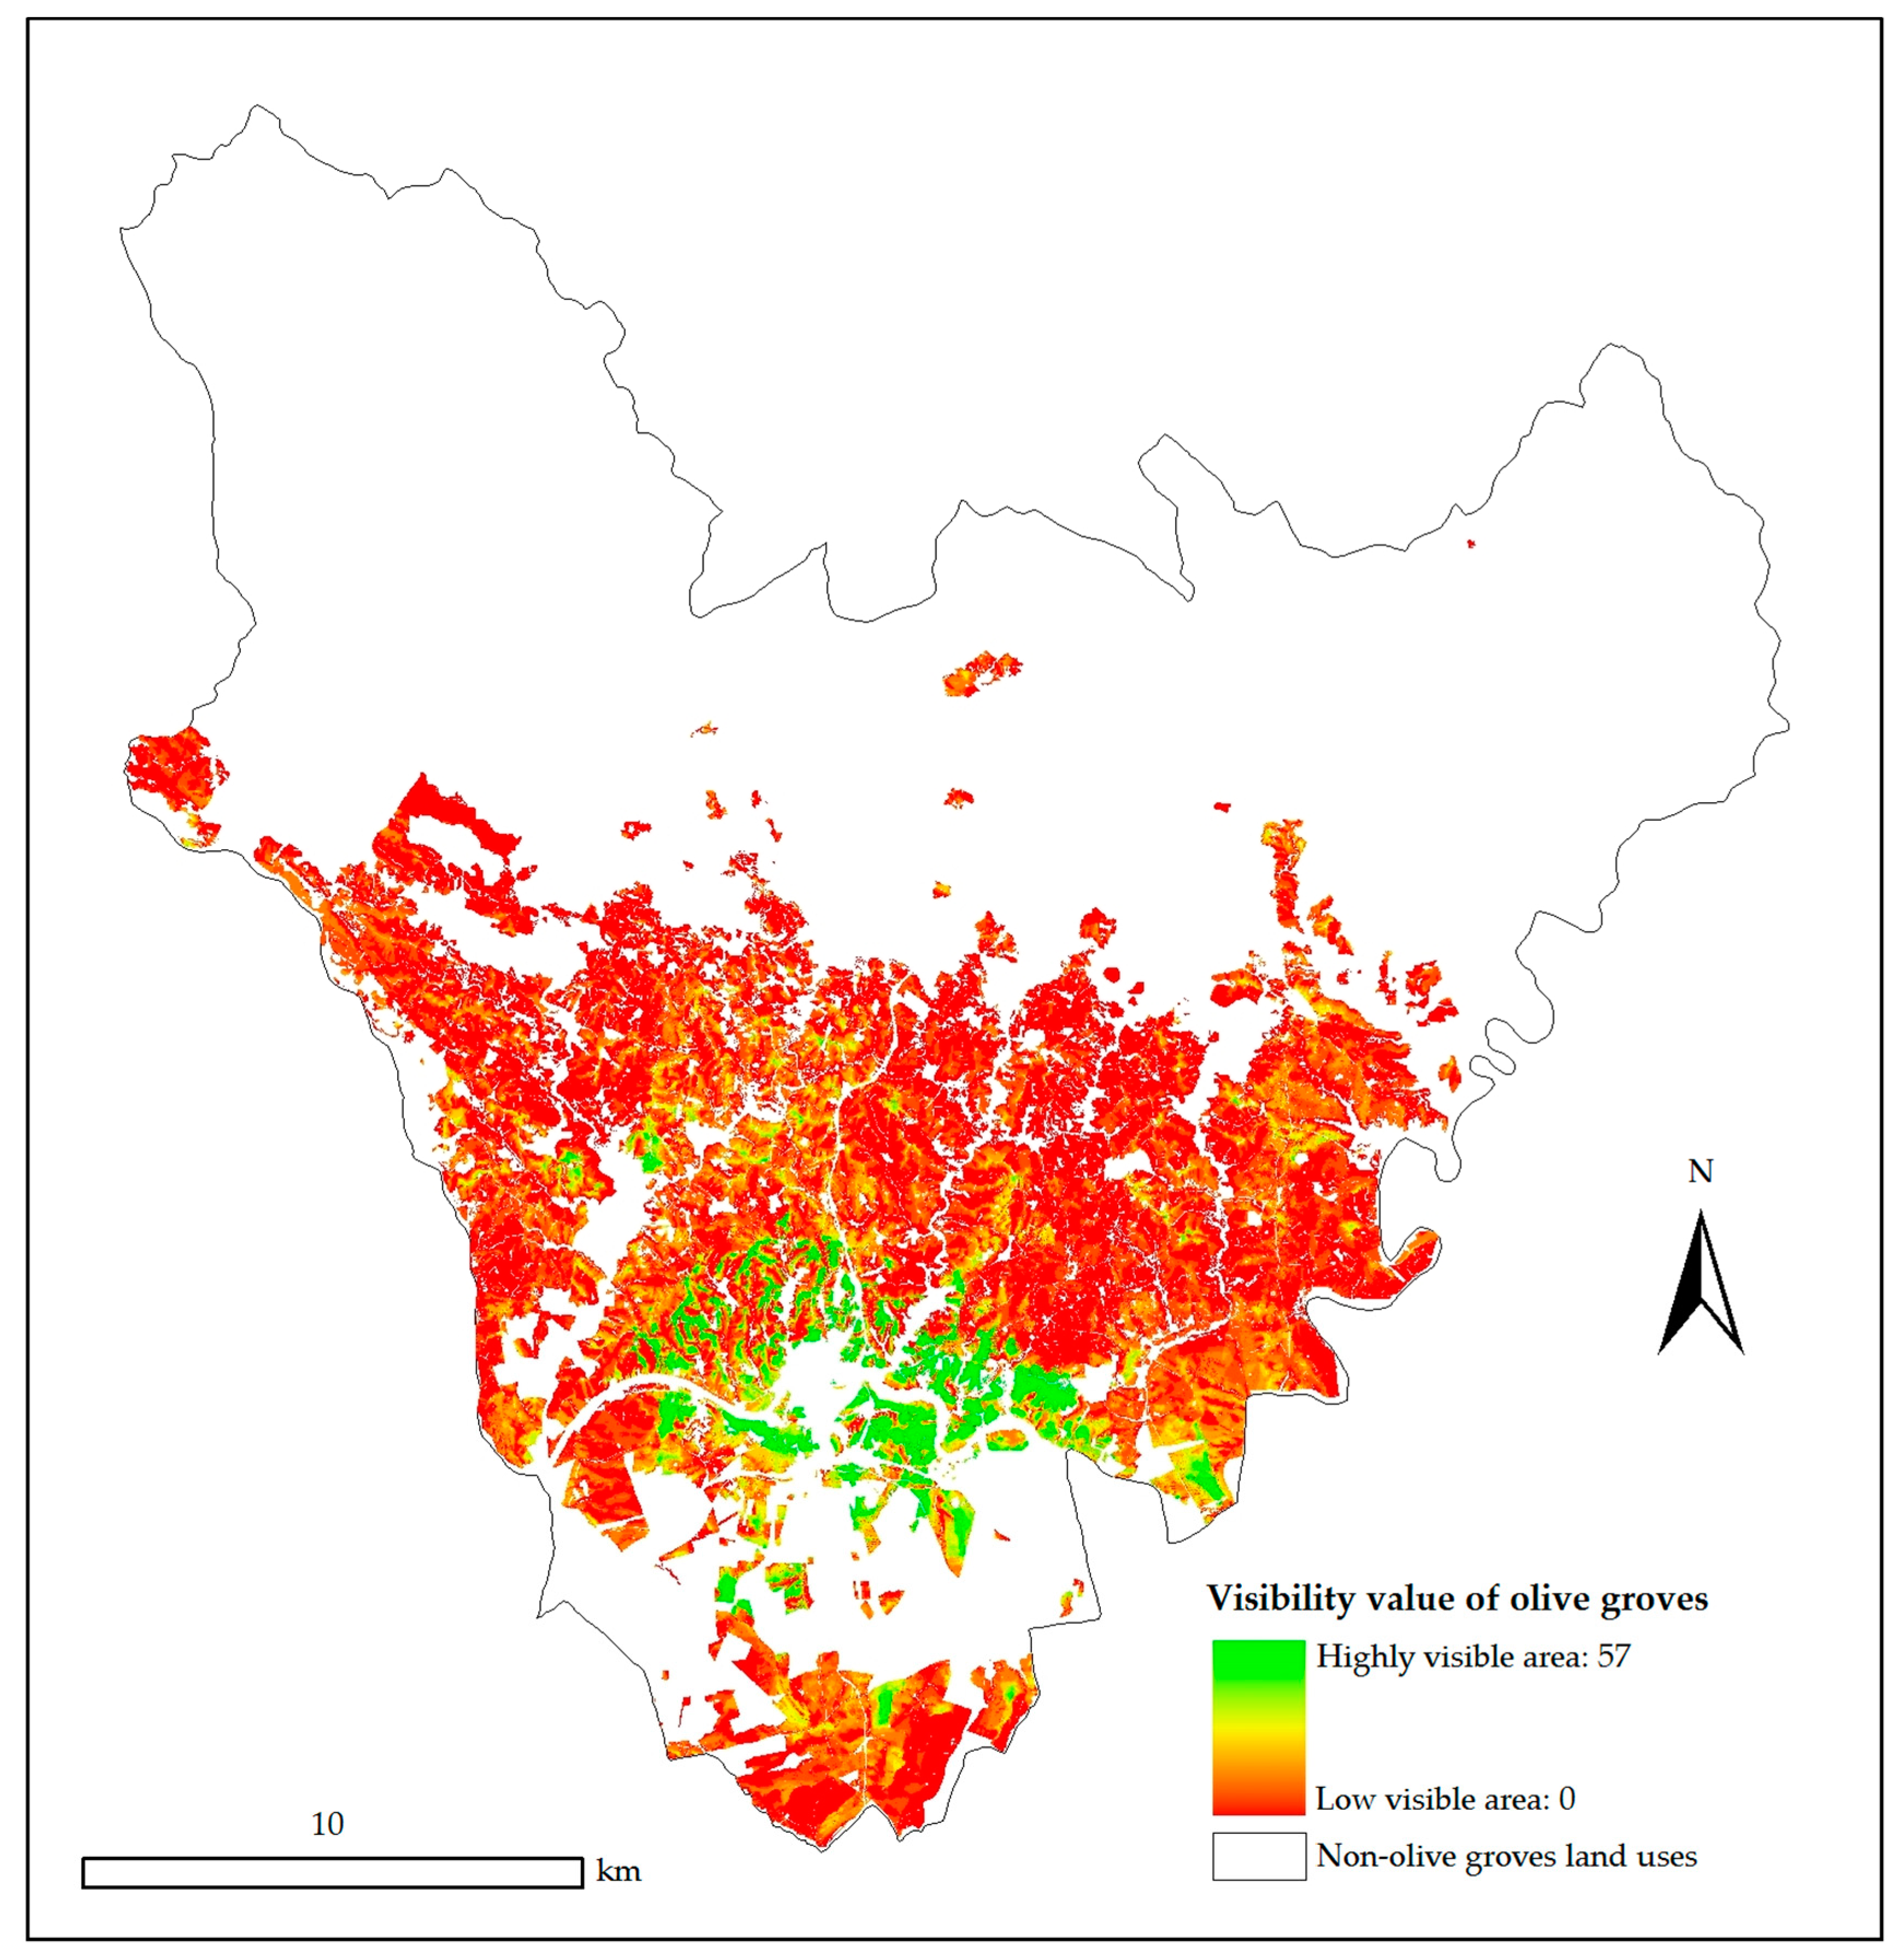
3.2. Visibility Assessment
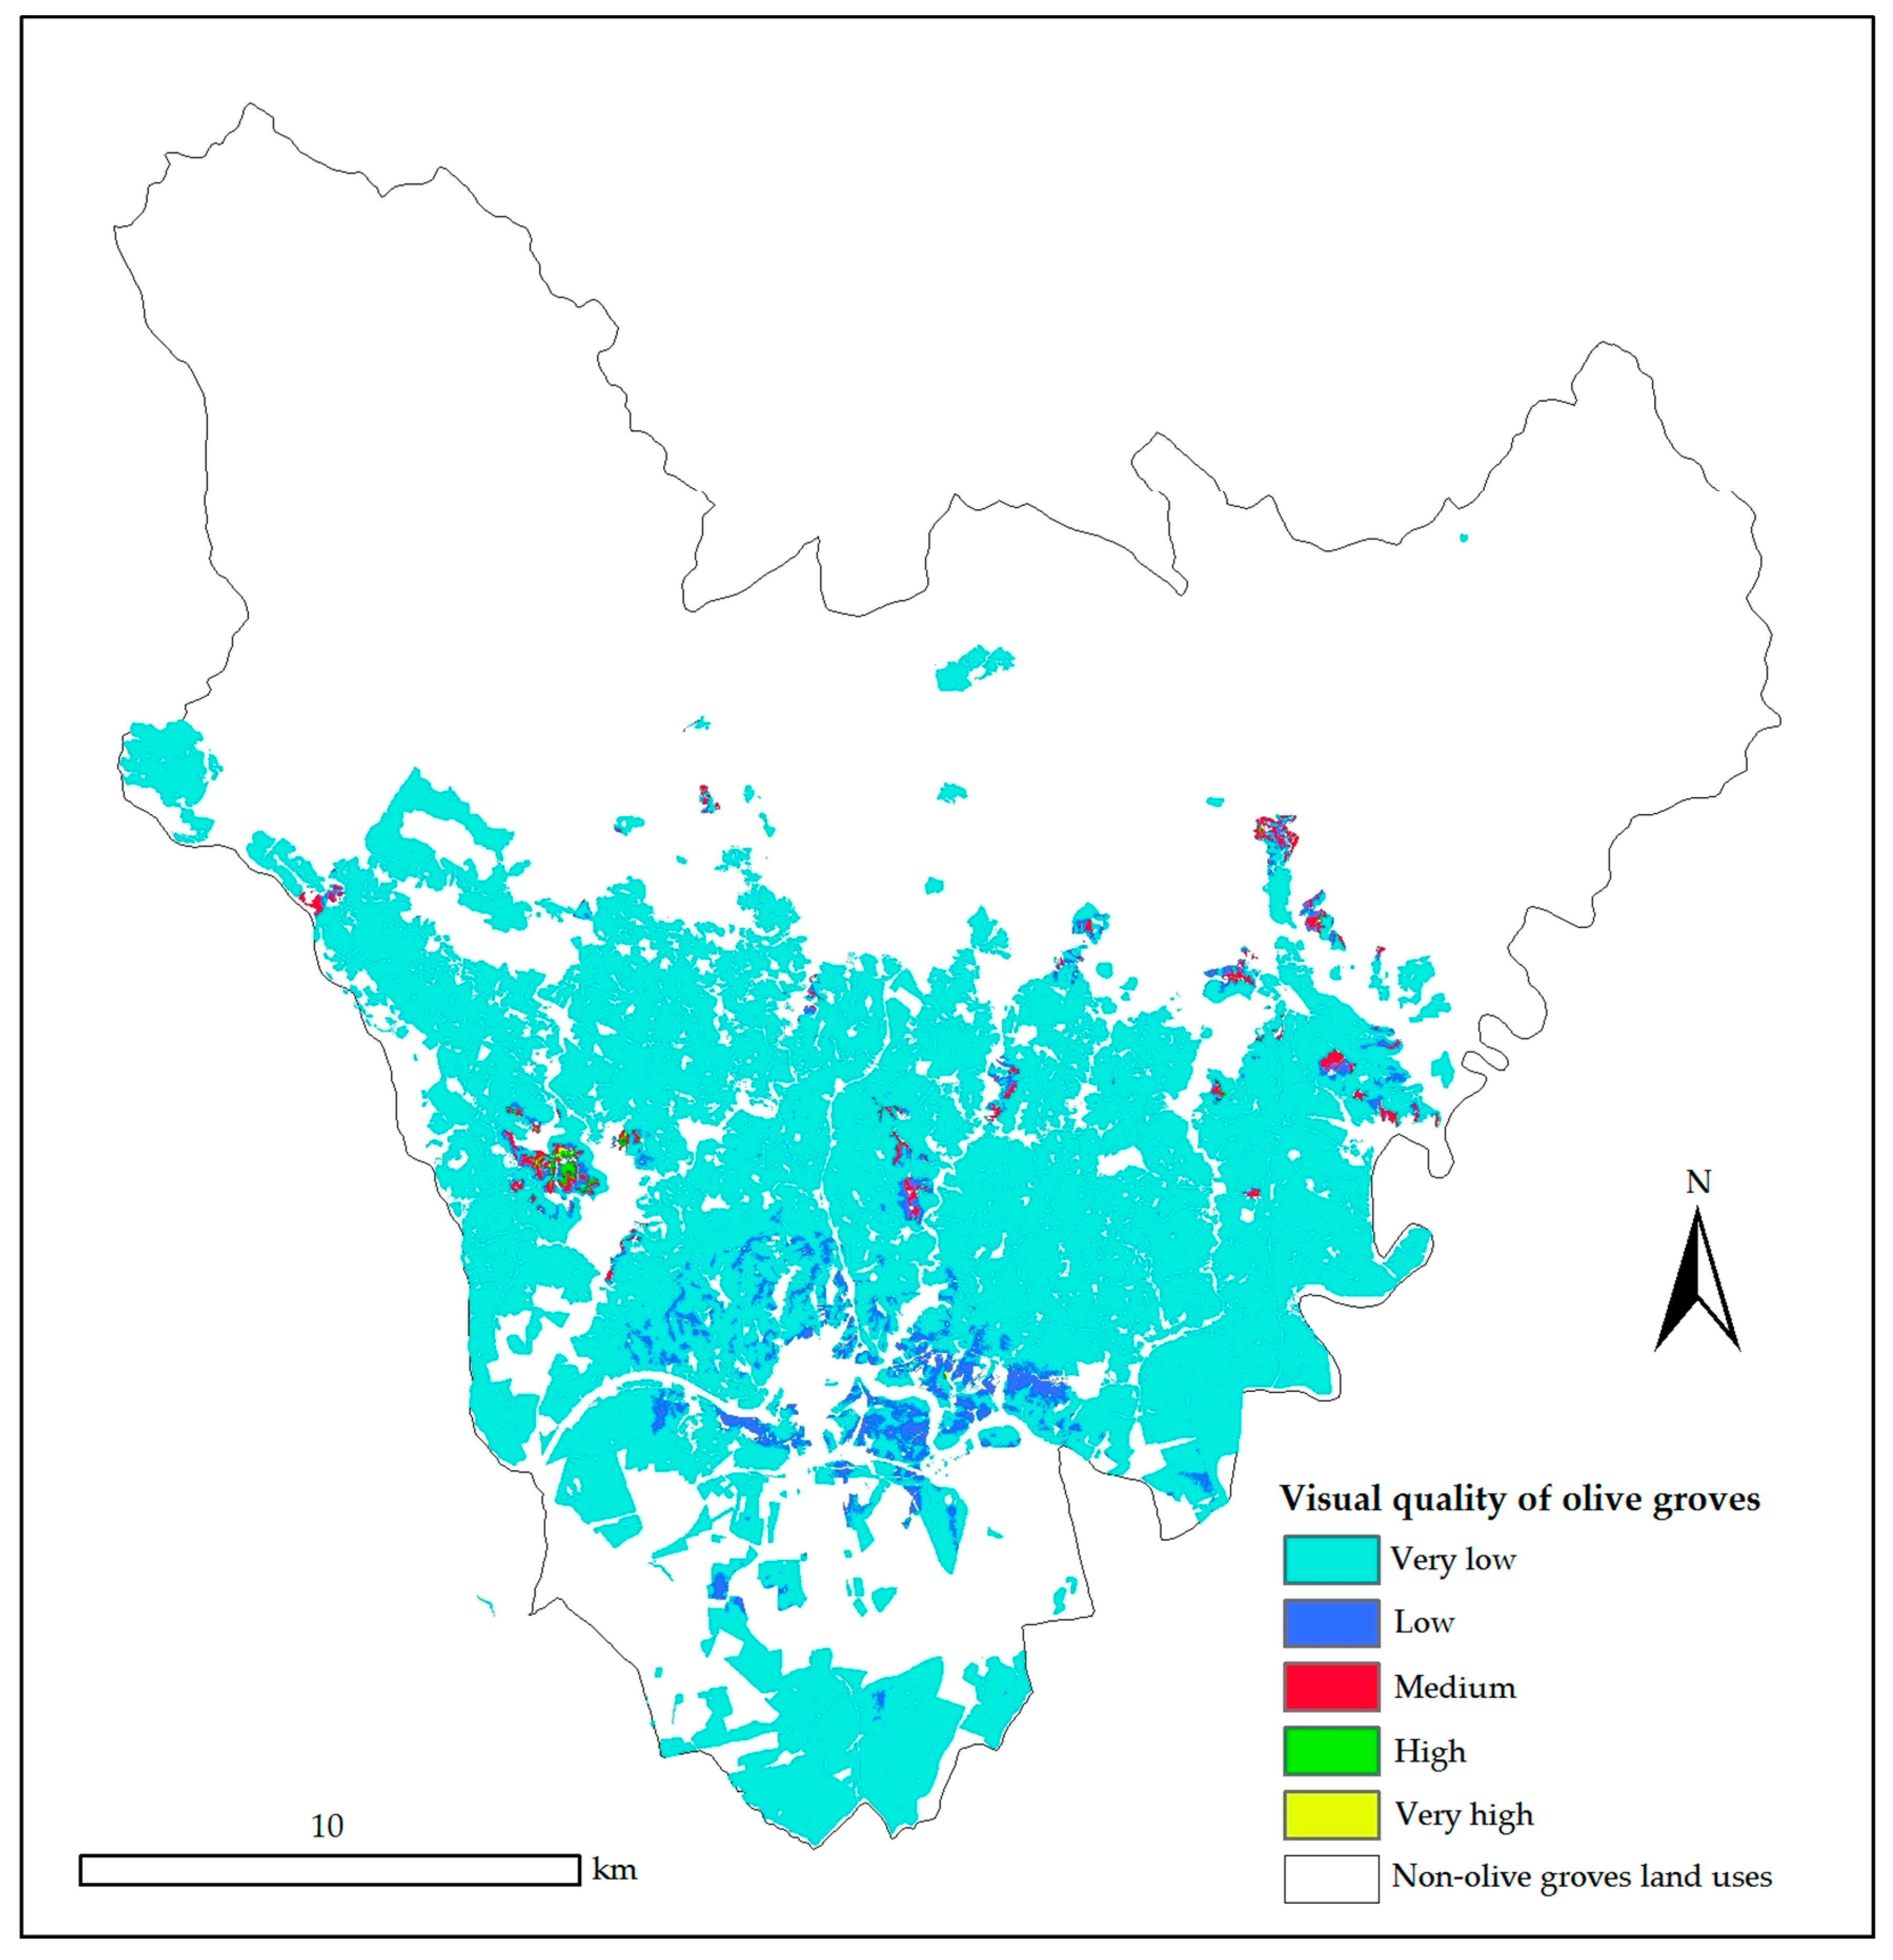
3.3. Visual Quality Assessment
- (1)
- Very low visual quality: Conventional olive groves with (0–10] visibility values and non-productive areas and olive groves with vegetation cover with 0 visibility values. Occupies 16,531.4 hectares (93%).
- (2)
- Low visual quality: Conventional olive groves with (10–57] visibility values and non-productive areas and olive groves with vegetation cover situated at spots with a visibility value of 1. Occupies 952.9 hectares (5%).
- (3)
- Medium visual quality: Non-productive olive groves and olive groves with vegetation cover situated at spots with a visibility value within the interval [2–6). Occupies 190.9 hectares (1%).
- (4)
- High visual quality: Non-productive olive groves and olive groves with vegetation cover situated at spots with a visibility value within [6–10). Occupies 27.8 hectares (0.2%).
- (5)
- Very high visual quality: Non-productive areas and olive groves with vegetation cover situated at spots with a visibility value within [10–57]. Occupies 3.2 hectares (0.02%).
4. Discussion
5. Conclusions
Acknowledgments
Author Contributions
Conflicts of Interest
Appendix A


Appendix B. Pair Comparisons of Three Different Pictures According AHP Method
References
- Guzmán-Álvarez, J.R.; Navarro-Cerrillo, R.M. Modelling potential abandonment and natural restoration of marginal olive Groves in Andalusia (South of Spain). J. Land Use Sci. 2008, 3, 113–129. [Google Scholar] [CrossRef]
- López-Bermúdez, F. Soil erosion by water on the desertification of a semi-arid Mediterranean fluvial basin: The Segura basin, Spain. Agric. Ecosyst. Environ. 1990, 33, 129–145. [Google Scholar] [CrossRef]
- Metzidakis, I. (Ed.) Recommendations for Olive Orchards that Will Be Abandoned. Olivero Project Communication No. 9. 2006. Available online: http://www.olivero.info (accessed on 10 September 2010).
- Nekhay, O.; Arriaza, M.; Boerboom, L. Evaluation of soil erosion risk using Analytic Network Process and GIS: A case study from Spanish mountain olive plantations. J. Environ. Manag. 2009, 90, 3091–3104. [Google Scholar] [CrossRef] [PubMed]
- Bignal, E.; McCracken, D. Low-intensity farming systems in the conservation of the countryside. J. Appl. Ecol. 1996, 33, 413–424. [Google Scholar] [CrossRef]
- Loumou, A.; Giourga, C. Olive Groves: The life and identity of the Mediterranean. Agric. Hum. Values 2003, 20, 87–95. [Google Scholar] [CrossRef]
- Siebert, S.F. Traditional agriculture and the conservation of biological diversity in Crete, Greece. Int. J. Agric. Sustain. 2004, 2, 109–117. [Google Scholar] [CrossRef]
- Sofo, A.; Nuzzo, V.; Palese, A.M.; Xiloyannis, C.; Celano, G.; Zukowskyj, P.; Dichio, B. Net CO2 storage in Mediterranean olive and peach orchards. Sci. Hortic. 2005, 107, 17–24. [Google Scholar] [CrossRef]
- EGMASA (Empresa de Gestión Medioambiental). Usos de Suelo de Andalucía; Consejería de Medio Ambiente: Seville, Spain, 2001. (In Spanish) [Google Scholar]
- Lothian, A. Landscape and the philosophy of aesthetics: Is landscape quality inherent in the landscape or in the eye of the beholder? Landsc. Urban Plan. 1999, 44, 177–198. [Google Scholar] [CrossRef]
- Barnett, V. Sampling Survey. Principles and Methods; Arnold: London, UK, 1997. [Google Scholar]
- Law, C.S.; Zube, E.H. Effects of photographic composition on landscape perception. Landsc. Res. 1983, 8, 22–23. [Google Scholar] [CrossRef]
- Shafer, E.L., Jr.; Brush, R.O. How to measure preferences for photographs of natural landscapes. Landsc. Plan. 1977, 4, 273–256. [Google Scholar] [CrossRef]
- Wherrett, J.R. Creating landscape preference models using the Internet as a medium for surveys. Landsc. Res. 2000, 25, 79–96. [Google Scholar] [CrossRef]
- Pérez, J.G. Ascertaining landscape perceptions and preferences with pair-wise photographs: Planning rural tourism in Extremadura. Spain. Landsc. Res. 2002, 27, 297–308. [Google Scholar] [CrossRef]
- Arriaza, M.; Cañas-Ortega, J.F.; Cañas-Madueño, J.A.; Ruiz-Aviles, P. Assessing the visual quality of rural landscapes. Landsc. Urban Plan. 2004, 69, 115–125. [Google Scholar] [CrossRef]
- Pflüger, Y.; Rackham, A.; Larned, S. The aesthetic value of river flows: An assessment of flow preferences for large and small rivers. Landsc. Urban Plan. 2010, 95, 68–78. [Google Scholar] [CrossRef]
- Yao, Y.; Zhu, X.; Xu, Y.; Yang, H.; Wu, X.; Li, Y.; Zhang, Y. Assessing the visual quality of green landscape in rural residential areas: The case of Changzhou, China. Environ. Monit. Assess. 2012, 184, 951–967. [Google Scholar] [CrossRef] [PubMed]
- Shuttleworth, S. Use of photographs as an environment presentation medium in landscape studies. J. Environ. Manag. 1980, 11, 61–76. [Google Scholar]
- Daniel, T.C.; Vining, J. Methodological issues in the assessment of landscape quality. In Behaviour and the Natural Environment; Altman, I., Wohwill, J.F., Eds.; Plenum Press: New York, NY, USA, 1983; pp. 39–83. [Google Scholar]
- Stewart, T.R.; Middleton, P.; Downton, M.; Ely, D. Judgements of photographs versus field observations in studies of perception and judgement of the physical environment. J. Environ. Psychol. 1984, 4, 283–302. [Google Scholar] [CrossRef]
- Sevenant, M.; Antrop, M. Landscape Representation Validity: A Comparison between On-site Observations and photographs with Different Angeles of View. Landsc. Res. 2011, 36, 363–385. [Google Scholar] [CrossRef]
- Saaty, T.L. The Analytic Hierarchy Process: Planning, Priority Setting, Resource Allocation; McGraw-Hill: New York, NY, USA, 1980. [Google Scholar]
- Vaidya, O.S.; Kumar, S. Analytic hierarchy process: An overview of applications. Eur. J. Oper. Res. 2006, 169, 1–29. [Google Scholar] [CrossRef]
- Gong, L.; Zhang, Z.; Xu, C. Development a Quality Assessment Index System for Scenic Forest Management: A Case Study from Xishan Mountain, Suburban Beijing. Forest 2015, 6, 225–243. [Google Scholar] [CrossRef]
- Thirumalaivasan, D.; Karmegam, M.; Venugopal, K. AHP-DRASTIC: Software for specific auifer vulnerability assessment using DRASTIC model and GIS. Environ. Model. Softw. 2003, 18, 645–656. [Google Scholar] [CrossRef]
- Saaty, T.L. Decision-making with the AHP: Why is the principal eigenvector necessary? Eur. J. Oper. Res. 2003, 145, 85–91. [Google Scholar] [CrossRef]
- Saaty, T.L. Multicriteria Decision Making: The Analytic Hierarchy Process; RWS Publications: Pittsburgh, PA, USA, 1990. [Google Scholar]
- Scott, M.J. MATLAB free Extension: Function AHPCAL. 2001. Available online: http://design.me.uic.edu/software (accessed on 21 September 2007).
- Forman, E.H.; Peniwati, K. Aggregating individual judgments and priorities with the Analytic Hierarchy Process. Eur. J. Oper. Res. 1998, 108, 165–169. [Google Scholar] [CrossRef]
- Silvennoinen, H.; Alho, J.; Kolehmainen, O.; Pukkala, T. Prediction models of landscape preferences at the forest stand level. Landsc. Urban Plan. 2001, 56, 11–20. [Google Scholar] [CrossRef]
- Tahvanainen, L.; Tyrväinen, L.; Ihalainen, M.; Vuorela, N.; Kolehmainen, O. Forest management and public perceptions-visual versus verbal information. Landsc. Urban Plan. 2001, 53, 53–70. [Google Scholar] [CrossRef]
- Karjalainen, E. The Visual Preferences for Forest Regeneration and Field Afforestation—Four Case Studies in Finland. Ph.D. Thesis, Faculty of Biosciences, University of Helsinki, Helsinki, Finlandia, 2006. [Google Scholar]
- Alho, J.M.; Kolehmainen, O.; Leskinen, P. Regression methods for pairwise comparasions data. In The Analytic Hierarchy Process in Natural Resources and Environmental Decision Making; Schmoldt, D., Kangas, J., Mendoza, G., Pesonen, M., Eds.; Kluver Academic Publishers: Dordrecht, The Netherlands, 2001; pp. 235–251. [Google Scholar]
- Ervin, S.; Steinitz, C. Landscape visibility computation: Necessary, but not sufficient. Environ. Plan. B 2003, 30, 757–766. [Google Scholar] [CrossRef]
- Sevenant, M.; Antrop, M. Settlement models, land use and visibility in rural landscapes: Two case studies in Greece. Landsc. Urban Plan. 2007, 80, 362–374. [Google Scholar] [CrossRef]
- Hernández, J.; García, L.; Ayuga, F. Assessment of the visual impact made on the landscape by new buildings: A methodology for site selection. Landsc. Urban Plan. 2004, 68, 15–28. [Google Scholar] [CrossRef]
- Rogge, E.; Nevens, F.; Gulinck, H. Reducing the visual impact of ‘greenhouse parks’ in rural landscapes. Landsc. Urban Plan. 2008, 87, 76–83. [Google Scholar] [CrossRef]
- O’Sullivan, D.; Turner, A. Visibility graphs and landscape visibility analysis. Int. J. Geogr. Inf. Sci. 2001, 15, 221–237. [Google Scholar] [CrossRef]
- Janušaitis, J.; Kamičaitytė-Virbašienė, R. Some methodical aspects of landscape visual quality preferences analysis. Environ. Res. Eng. Manag. 2004, 3, 51–60. [Google Scholar]
- Lu, D.; Burley, J.B.; Crawford, P.; Schutzki, R.; Loures, L. Quantitative methods in environmental and visual quality mapping and assessment: A Muskegon, Michigan watershed case study with urban planning implications. In Advances in Spatial Planning; Burian, J., Ed.; InTech: Rijeka, Croatia, 2012; Chapter 7; pp. 127–142. [Google Scholar]
- Vizzari, M. Spatial modelling of potential landscape quality. Appl. Geogr. 2011, 31, 108–118. [Google Scholar] [CrossRef]
- Linton, D.L. The assessment of scenery as a natural resource. Scott. Georgr. Mag. 1968, 84, 219–238. [Google Scholar] [CrossRef]
- Land Use Consultants. A Planning Classification of Scottish Landscape Resources; Occasional Papers; Countryside Commission for Scotland: Edinburgh, UK, 1971. [Google Scholar]
- Arthur, L.M.; Daniel, T.C.; Boster, R.S. Scenic assessment: An overview. Landsc. Plan. 1977, 4, 109–129. [Google Scholar] [CrossRef]
- Briggs, D.F.; France, J. Landscape evaluation: A comparative study. J. Environ. Manag. 1980, 10, 263–275. [Google Scholar]
- Martín, B.; Ortega, E.; Otero, I.; Arce, R.M. Landscape character assessment with GIS using map-based indicators and photographs in the relationship between landscape and roads. J. Environ. Manag. 2016, 180, 324–334. [Google Scholar] [CrossRef] [PubMed]
- Saaty, T.L.; Ozdemir, M.S. Why the magic number seven plus or minus two. Math. Comput. Model. 2003, 38, 233–244. [Google Scholar] [CrossRef]
- Blasco, E.; González-Olabarria, J.R.; Rodriguéz-Veiga, P.; Pukkala, T.; Kolehmainen, O.; Palahí, M. Predicting scenic beauty of forest stands in Catalonia (North-east Spain). J. For. Res. 2009, 20, 73–78. [Google Scholar] [CrossRef]
- Liao, W.; Nogami, K. Prediction of Near-View Scenic Beauty in Artificial Stands of Hinoki (Chamaecyparis obtusa S. et Z.). J. For. Res. 1999, 4, 93–98. [Google Scholar] [CrossRef]
- Schüpbach, B.; Junge, X.; Lindemann-Matthies, P.; Walter, T. Seasonality, diversity and aesthetic valuation of landscape plots: An integrative approach to assess landscape quality on different scales. Land Use Policy 2016, 53, 27–35. [Google Scholar] [CrossRef]
- Domingo-Santos, J.M.; de Villarán, R.F.; Rapp-Arrarás, I.; de Provens, E.C.P. The visual exposure in forest and rural landscapes: An algorithm and a GIS tool. Landsc. Urban Plan. 2011, 101, 52–58. [Google Scholar] [CrossRef]
- Hunziker, M.; Felber, P.; Gehring, K.; Buchecker, M.; Bauer, N.; Kienast, F. Evaluation of Landscape change by different social groups. Results of two empirical studies in Switzerland. Mt. Res. Dev. 2008, 28, 140–147. [Google Scholar] [CrossRef]


| Variable | Groups | Census | Sample | Chi-Squared Test for Equal Frequencies |
|---|---|---|---|---|
| Size of the municipality | <10,000 | 28.1% | 27.5% | χ2 = 2.187 p-value = 0.335 |
| 10,000–25,000 | 23.7% | 18.6% | ||
| >25,000 | 46.8% | 53.9% | ||
| Sex | Male | 46.8% | 48.6% | χ2 = 0.130 p-value= 0.718 |
| Female | 53.2% | 51.4% | ||
| Age | Less than 34 | 52.0% | 53.1% | χ2 = 0.236 p-value = 0.889 |
| 35–49 | 25.9% | 26.8% | ||
| 50–69 | 22.1% | 20.1% |
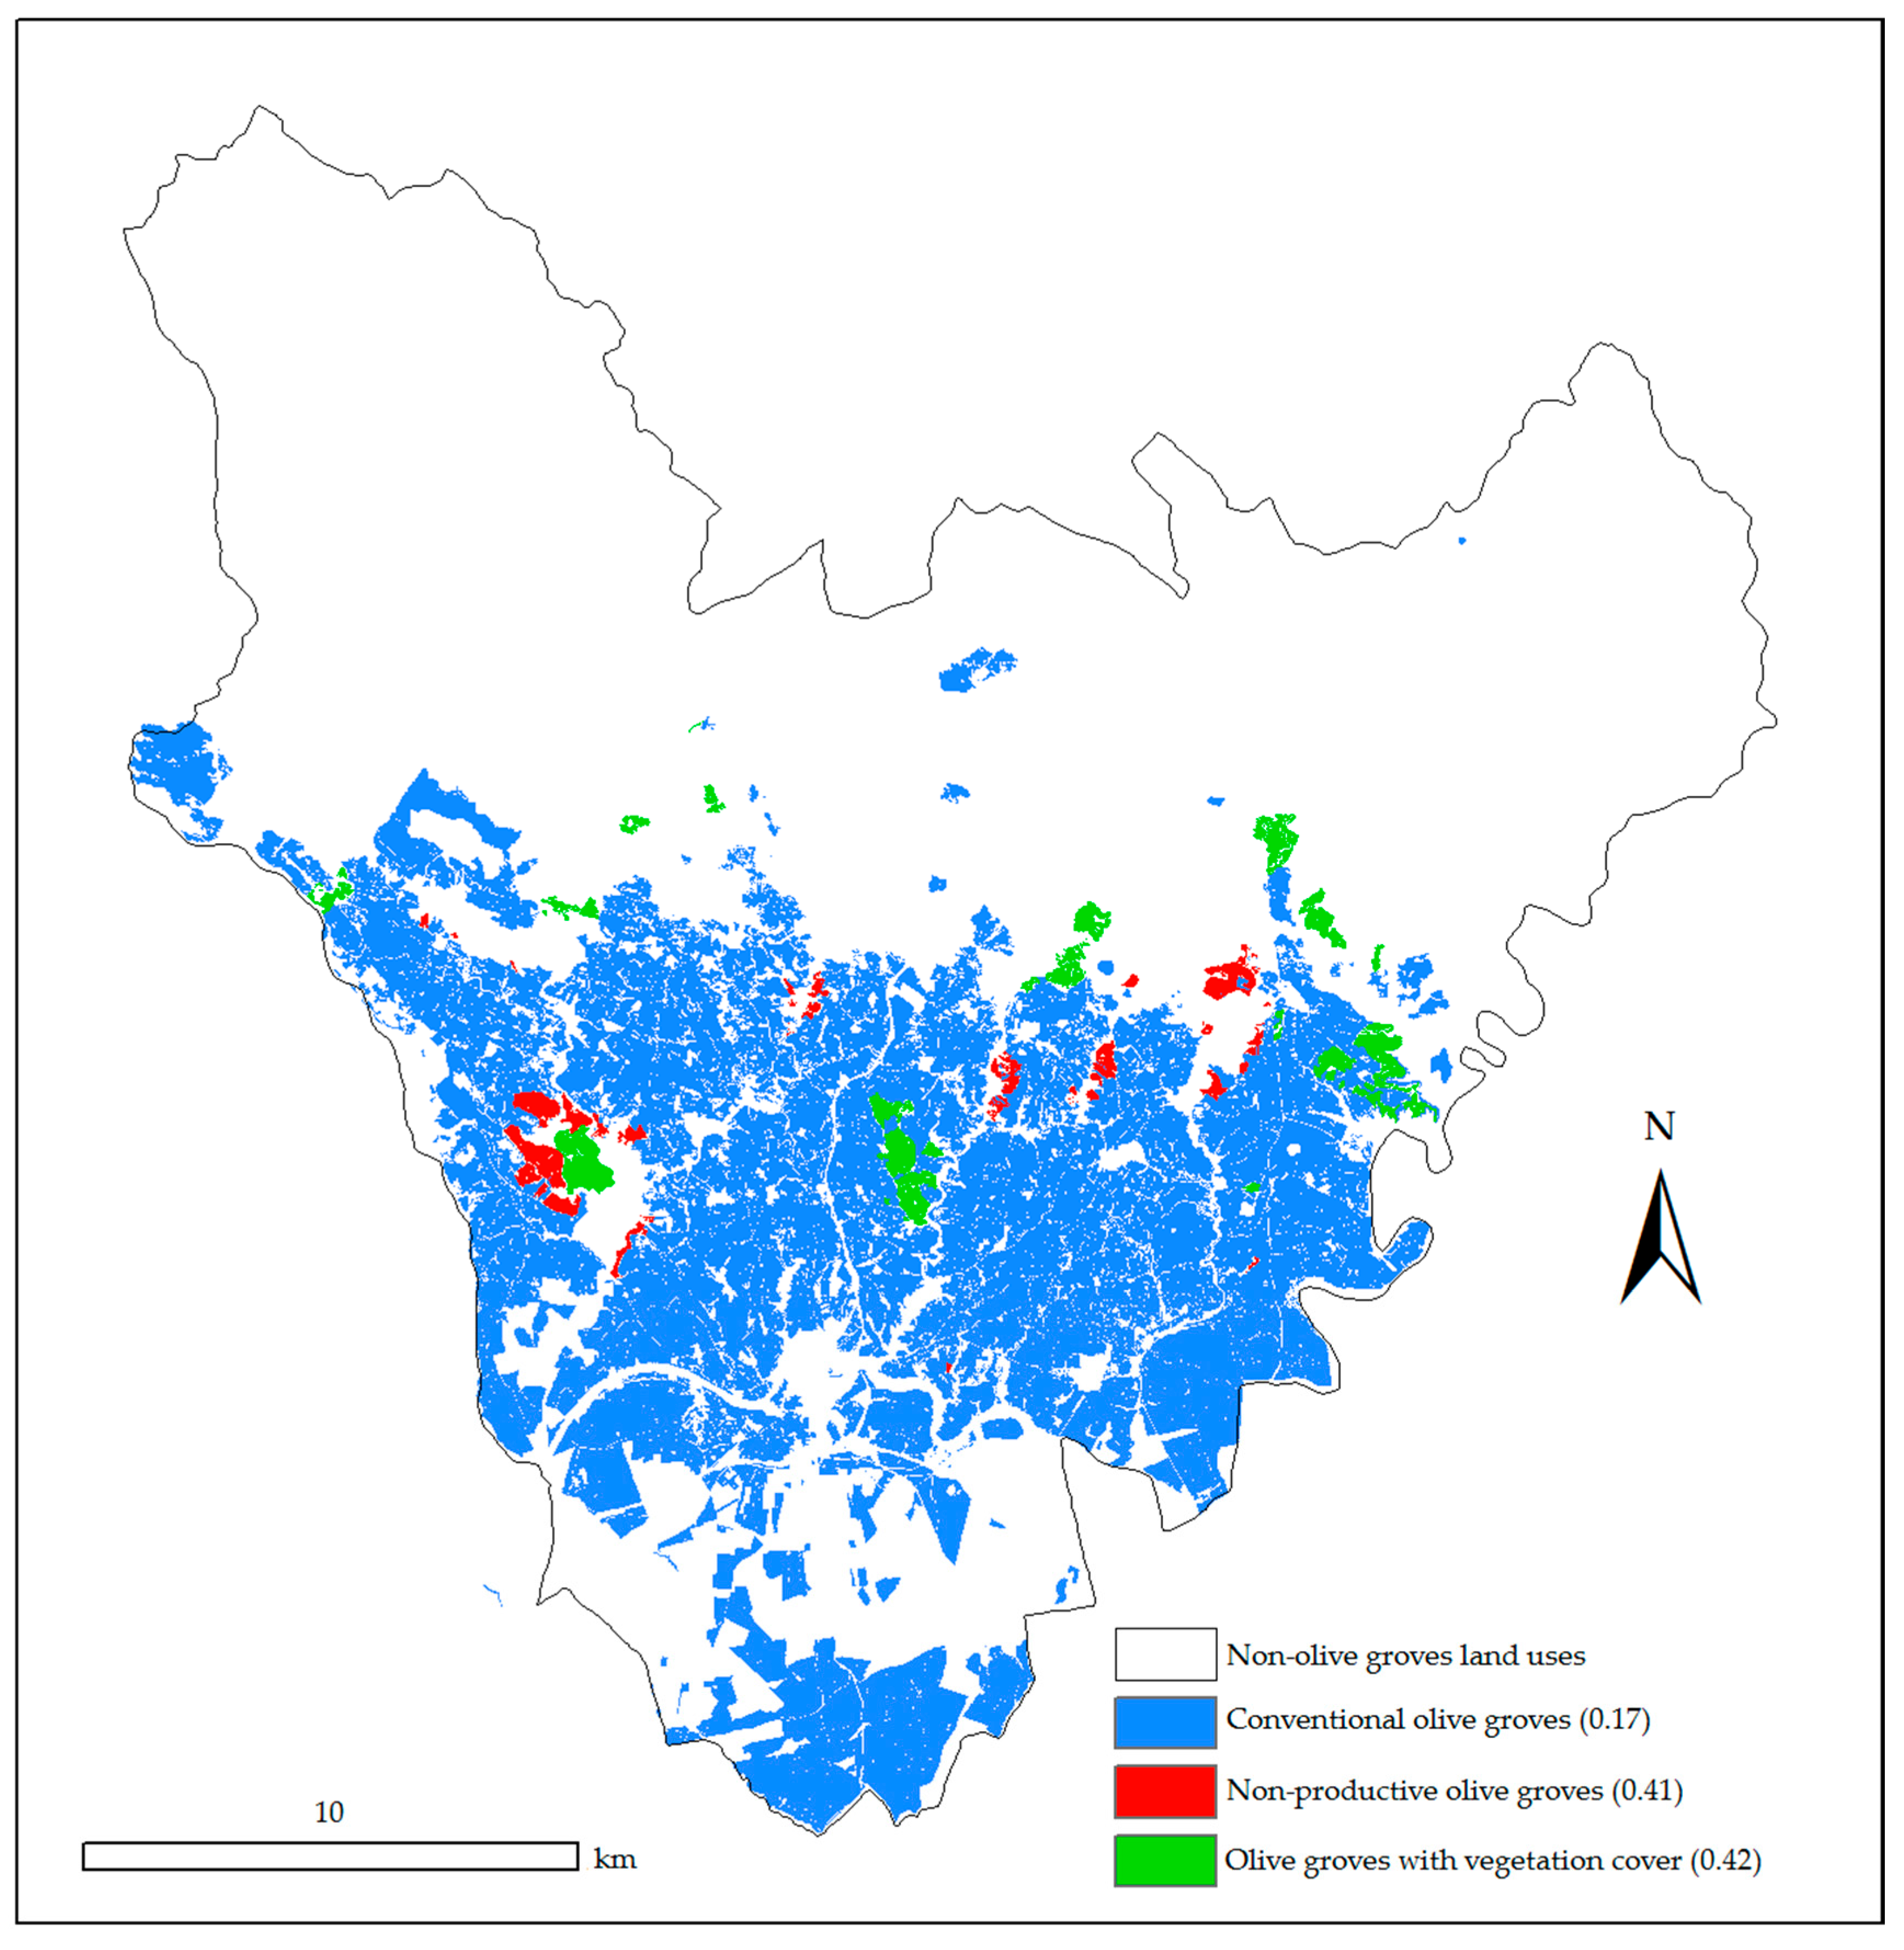
| Title 1 Olive Landscapes | Conventional Olive Farming System | Olive Farming System with Grass Vegetation Cover between the Trees (GVC) | Non-Productive Olive Groves |
|---|---|---|---|
| Relative weights CR = 0.0005; CI = 0.0003 | 0.1772 | 0.4155 | 0.4073 |
© 2016 by the authors; licensee MDPI, Basel, Switzerland. This article is an open access article distributed under the terms and conditions of the Creative Commons Attribution (CC-BY) license (http://creativecommons.org/licenses/by/4.0/).
Share and Cite
Nekhay, O.; Arriaza, M. How Attractive Is Upland Olive Groves Landscape? Application of the Analytic Hierarchy Process and GIS in Southern Spain. Sustainability 2016, 8, 1160. https://doi.org/10.3390/su8111160
Nekhay O, Arriaza M. How Attractive Is Upland Olive Groves Landscape? Application of the Analytic Hierarchy Process and GIS in Southern Spain. Sustainability. 2016; 8(11):1160. https://doi.org/10.3390/su8111160
Chicago/Turabian StyleNekhay, Olexandr, and Manuel Arriaza. 2016. "How Attractive Is Upland Olive Groves Landscape? Application of the Analytic Hierarchy Process and GIS in Southern Spain" Sustainability 8, no. 11: 1160. https://doi.org/10.3390/su8111160
APA StyleNekhay, O., & Arriaza, M. (2016). How Attractive Is Upland Olive Groves Landscape? Application of the Analytic Hierarchy Process and GIS in Southern Spain. Sustainability, 8(11), 1160. https://doi.org/10.3390/su8111160