1. Introduction
Primary energy sources take many forms, including nuclear energy, fossil energy (such as oil, coal and natural gas) and renewable sources (such as wind, solar and hydropower). These primary sources are converted to electricity, a secondary energy source, which flows through power lines and other transmission infrastructure to our home and business [
1].
Renewable Energy Sources (RES), which are naturally replenished, such as sunlight, wind, rain, biomass, tides, waves, hydropower, and geothermal heat, are favored for clean energy production and are regarded as the future energy as they encompass many advantages and benefits. The main driving powers and benefits that the global growth of the fossil fuel divestment and clean energy investment movement are reduction of global warming and air pollution, fuel supply diversity, the reduced risk of nuclear weapon production, and socio and economic development [
2,
3].
There are a wide variety of possible forms in which the energy can be stored [
4]: batteries, flywheels or compressed air, pumped hydroelectric, and capacitors. If renewable power is only partially available (e.g., due to clouds) or not available at all (e.g., no wind), the stored energy using hydrogen fuel cell and/or battery can compensate for intermittency or even provide full power. This makes the production of electrical energy comparatively difficult: it needs a back-and-forth conversion process, which reduces efficiency [
5].
Over the past years, renewable power has become a mainstream source of electricity generation around the world. However, the future greatly depends on the ability of the industry to continue to achieve cost of energy reductions and, ultimately, to achieve cost parity with conventional sources of generation. Hence, economic operation of power plants is very important to return a profit on the capital investment [
6].
Renewable energy systems can be grouped into stand-alone (Off-grid) systems and grid connected systems. A combination of different but complementary energy generation systems based on renewable energies or mixed (Renewable Energy Sources (RES)—with a backup of Liquefied Petroleum Gas (LPG)1/diesel/gasoline genset), is known as a hybrid power system [
7,
8,
9,
10]. Off grid renewable energy technologies satisfy energy demand directly and avoid the need for long distribution infrastructures. In addition, the use of a hybrid system has great significance in avoiding long waits for grid extension and permits the connection if it comes, improves health care and education in rural areas, increases economic productivity, creates local employment opportunities, strengthens social cohesion by providing access to electricity for all users, fights climate change and poverty, and allows for a better use of local natural resources [
11].
A limited amount of bulk (large scale) energy storage, mainly in the form of pumped hydro storage power plant, has long played a role in the world electric power grid, accounting for 98% of the current worldwide installed electrical storage capacity, and storage continues to grow in importance as a component of the electric power infrastructure [
12]. Advances in storage technologies and the increasing need for high quality, reliable electric power will likely lead energy storage to become a more substantial component of the electric power grid in the future [
13,
14].
Further factors that affect the choice of technology for a particular application are response time, discharge duration, discharge frequency, depth of discharge, and efficiency [
15]. The efficiency of energy storage devices varies widely across technologies, ranging from about 60% to as high as 94% [
16].
As of today, more and more investors, as individuals, institutions and countries, are reducing their carbon risk and diversifying their portfolios and energy production with the goal to harness the upside in the sustainable clean growth industries of the future as they are acutely aware of the impacts on the environment [
17]. However, the perception gap in renewable energy production remains the barrier for new investors and companies and hence, needs to be addressed so as to make our world a better place to live. Besides, most reports and studies shows that taking action to cut carbon pollution and slow global warming by investing in energy efficiency and renewable power generation would result in a positive return on investment, ultimately saving trillions of dollars [
18].
A quick glance at the electrification world map shows that rural areas are in great need of affordable and reliable electricity to achieve development. The lack of modern electricity impacts peoples’ lives and hampers the provision of basic services primarily in poor healthcare, stifled economic growth, toxic fumes, limited or no education and lack of safety [
19,
20,
21]. These endemic power shortages affect all aspects of life. The level of electrification in sub-Saharan Africa is low, with less than 10% of the rural households having access to electricity. Specifically, in Ethiopia, the electricity access, which is mostly limited to cities, is only 46% (grid accessible to 52% of the population), and, for the 81% of the people living in rural areas, this figure is less than 3%, while 86% of city residents have access to electricity.
The scope of this research is to address access to modern energy for the underserved communities and people living in poverty, who are disproportionately affected by the negative impacts of climate change, such as Abiy Addy, Ethiopia. Moreover, most rural areas in Ethiopia receive an abundant supply of solar, wind and hydro resources throughout the year due to the topographical location; however, most of the citizens lack access to modern and reliable electricity [
22,
23]. The resources are not exploited as they should be. Besides, recent increase in availability of climate-related and donor finance for low-carbon and climate-resilient development that prioritizes renewables are the main motivations for the study.
2. Methodology
The methodology used for this study comprises of Demand Side Management (DSM), resource assessment, identification of constraints, assumptions and hypothesis, system architecture or approaches to be dealt with optimization and sensitivity analysis are the main.
The initial cost, replacement and Operation and Maintenance (O & M) cost of each component (renewable energy sources, diesel generators, storage systems like battery and hydrogen fuel cell, and converter), cost of diesel fuel, annual real interest rate project lifetime, etc. also have to be provided. The software HOMER (Hybrid Optimization of Multiple Energy Resources) simulates the operation of a system by making the energy balance calculation every hour for each of the 8760 h in a year. It displays a list of configurations sorted based on the total Net Present Cost (NPC). The total net present cost represents the life cycle cost of the system. The calculation assesses all costs occurring within the project lifetime, including initial set-up costs, component replacement cost, maintenance and fuel cost. Therefore, the software repeats the optimization process for every selection of sensitivity variables. In this paper, monthly solar radiation, diesel fuel price, battery prices, PV prices as well as converter prices have been used as sensitivity variables. The final optimal solution of a hybrid renewable energy system refers to the lowest levelized Cost Of Electricity (COE) in $/kWh and least total NPC.
The configuration of hybrid power generation systems can be divided into three classes according to bus bar forms: pure AC bus bar system, pure DC bus bar system and hybrid AC-DC bus bar system. In this paper, AC configuration is used due to its compatibility with many solar Inverters, which are well designed for off grid and on grid electrification. AC-coupled systems where all loads and generators are coupled independently on a common AC-bus is currently evolving as a standard due to numerous advantages [
23]:
Standardized coupling of different components (AC-coupling);
Simplified design and operation of island grids;
Compatibility with existing grids;
Reduction of system costs; and
Increased reliability of supply and Expandability.
When considering system architecture in designing an Electric Storage System (ESS), there are basically two approaches, integrated approach and hybrid approach, with renewable resources together with storage systems in different possible combinations. For this study is concerned, both hybrid and integrated approaches of sixteen different combinations of generation mix configurations have been analyzed and studied in order to find the most feasible combination with the least levelized cost of electricity, which can be comparable to, or even below, the current Ethiopia national electricity tariff. The sixteen different configurations analyzed, presented in
Table 5, are summarized in three main categories: different combination of generation mix with battery as storage only, hydrogen fuel cell storage only, and both battery and hydrogen as storage.
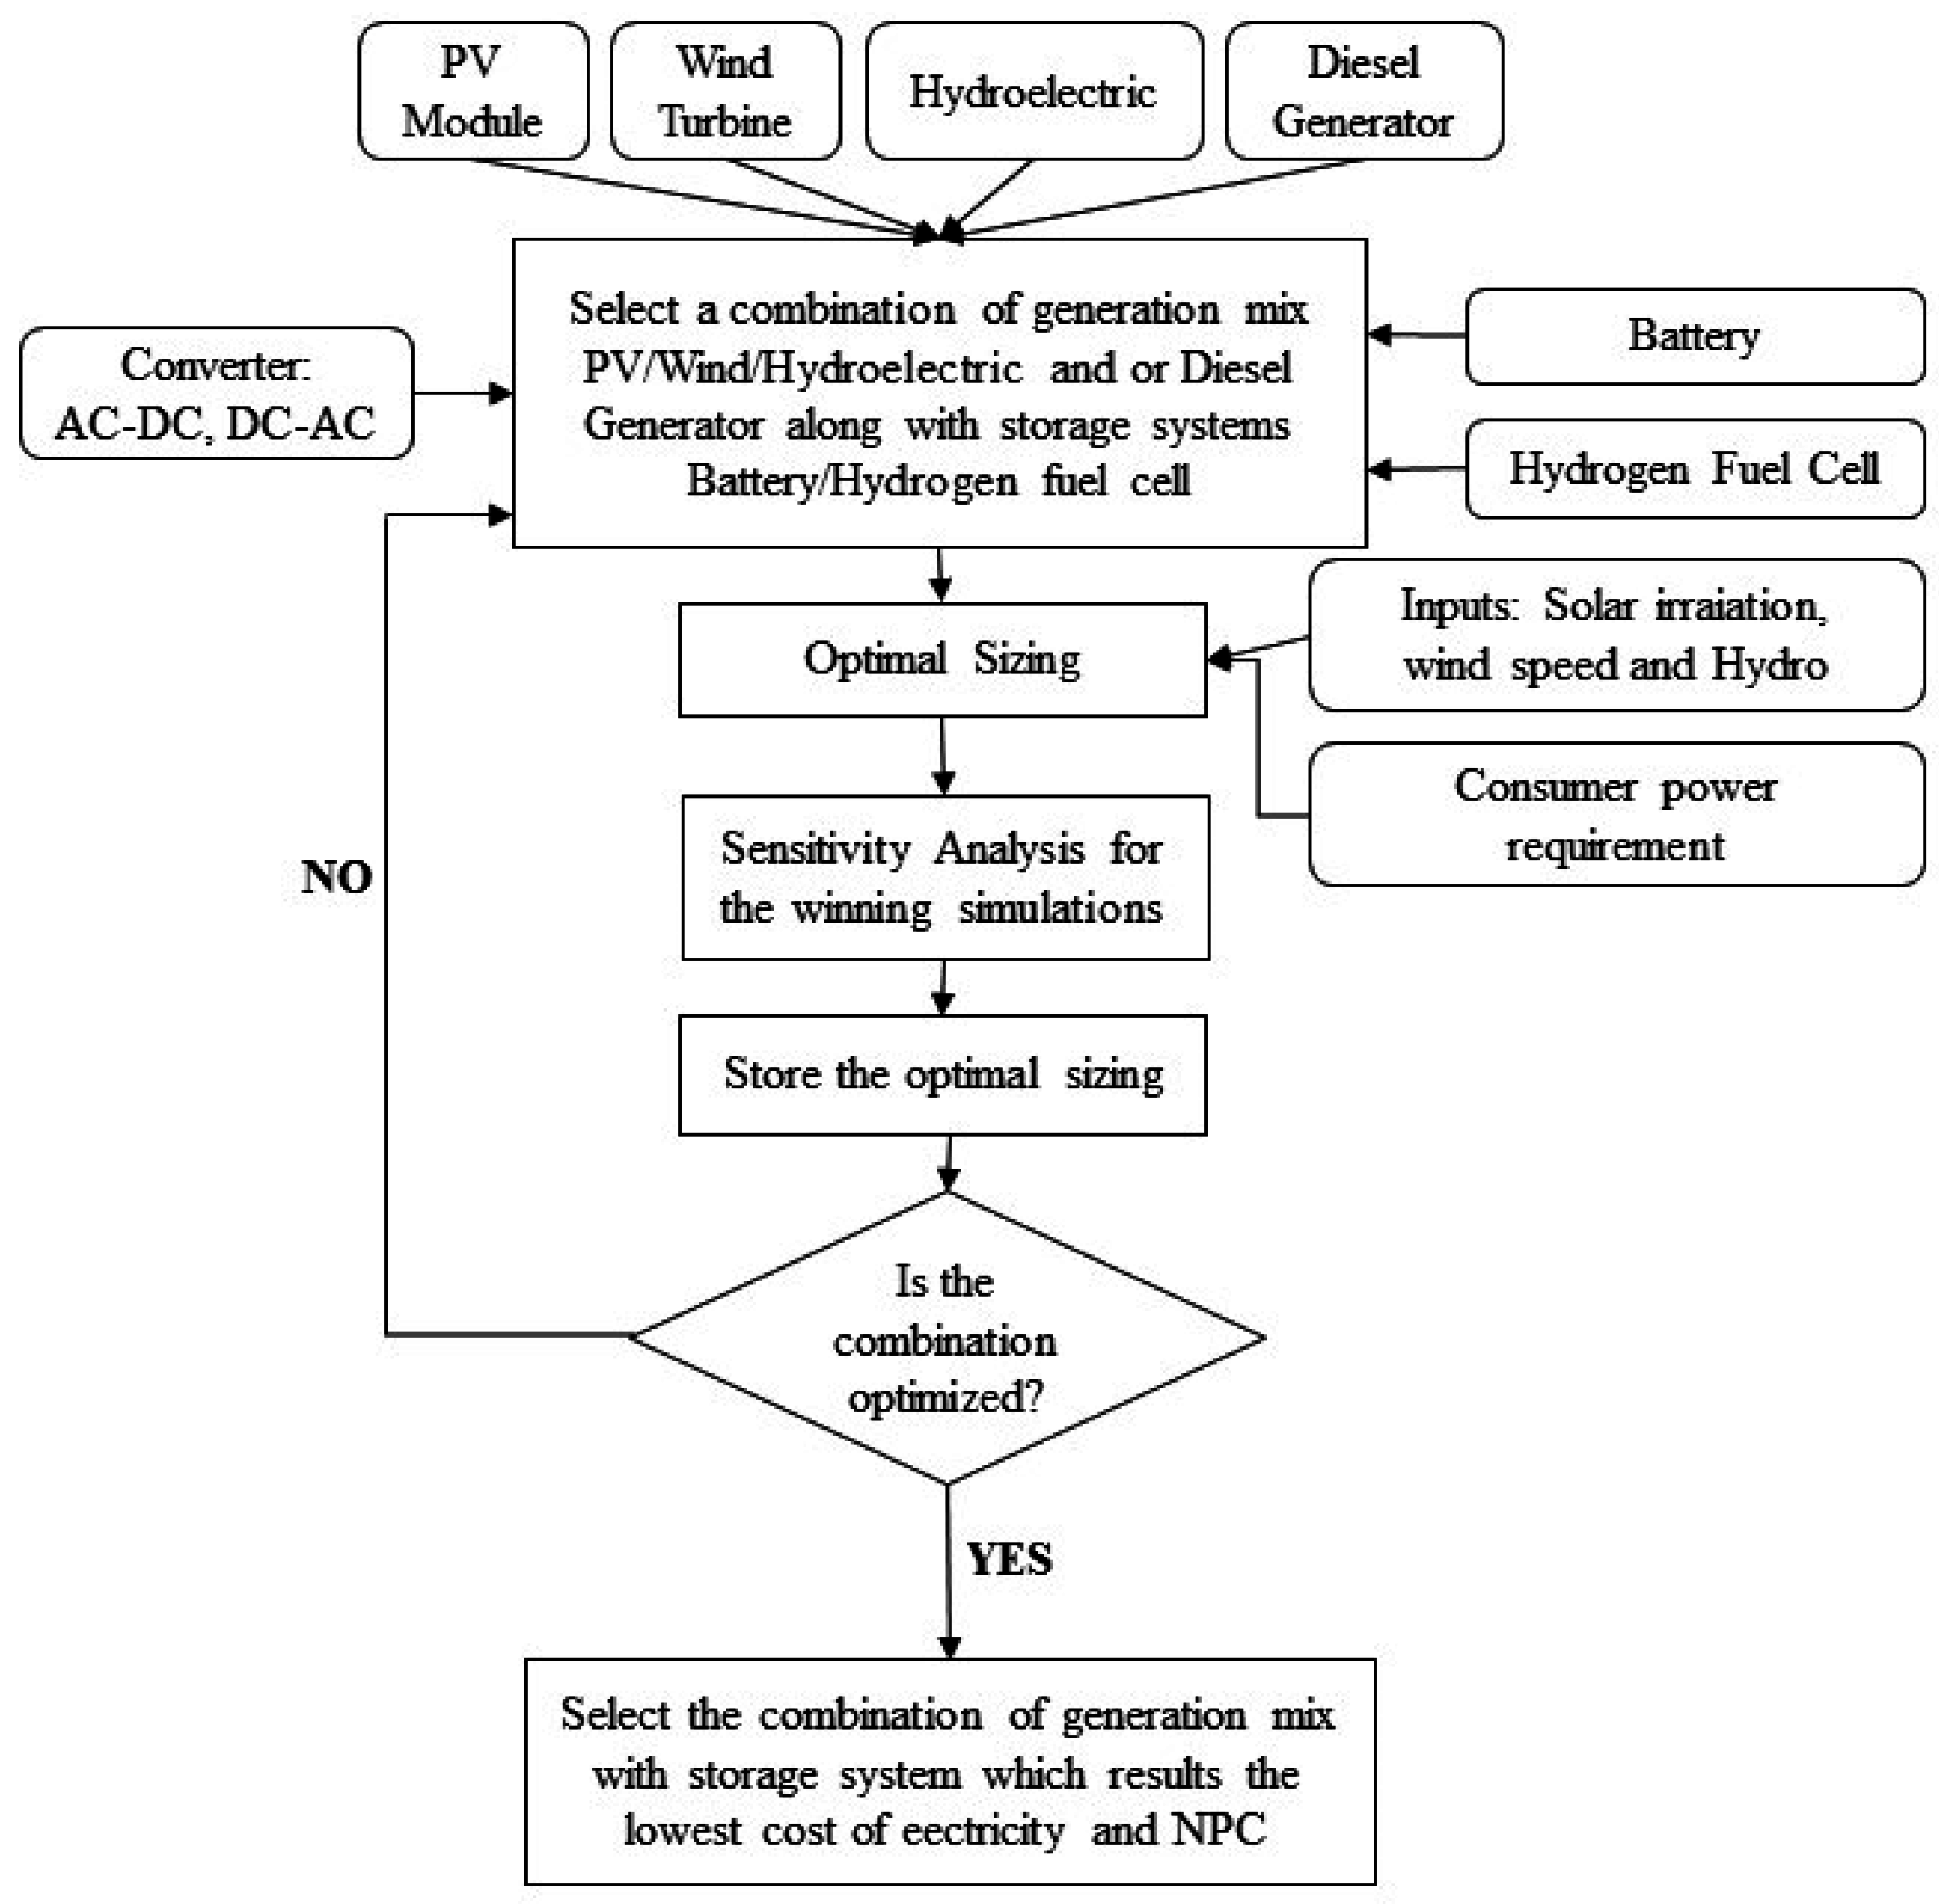
Whereas the simulation process models a particular system configuration, the optimization process determines the best possible system configuration. In HOMER, the best possible, or optimal, system configuration is the one that satisfies the user-specified constraints at the lowest total net present cost. Finding the optimal system configuration may involve deciding on the mix of components that the system should contain, the size or quantity of each component, and the dispatch strategy the system should use. In the optimization process, HOMER simulates many different system configurations, discards the infeasible ones (those that do not satisfy the user-specified constraints), ranks the feasible ones according to total net present cost, and presents the feasible one with the lowest total net present cost (NPC) as the optimal system configuration.
The goal of the optimization process is to determine the optimal value of each decision variable that interests the modeler. A decision variable is a variable over which the system designer has control and for which HOMER can consider multiple possible values in its optimization process. Possible decision variables in HOMER include: the size of the PV array, the number of wind turbines, the presence of the hydro system (HOMER can consider only one size of hydro system; the decision is therefore whether or not the power system should include the hydro system), the size of each generator, the number of batteries, the size of the AC-DC converter, the size of the electrolyzer, the size of the hydrogen storage tank, and the dispatch strategy (the set of rules governing how the system operates). Optimization can help the modeler find the optimal system configuration out of many possibilities. As a result, for the proposed microgrid, the study has used the optimization model shown in
Figure 1, allowing the system operation of different sources along with storage systems and then analyze the effect with some sensitivity values.
3. Case of Study
The socio-economic development of a country depends greatly on its level of electricity access. There are about 1.4 billion people around the world that lack access to electricity (81% rural residents), the majority of whom are living in sub-Saharan Africa [
24].
Ethiopia lies in East Africa; it is the cradle of humanity, and is a rugged, landlocked country split by the Great Rift Valley with a total area of 1.13 million square km, a vast country endowed with abundant renewable energy resources. Despite strong overall growth, it is, however, among the lowest energy consuming countries in the world. Only 46% of its 94.1 million inhabitants have access to electricity [
25,
26]. According to the Ethiopian Electric Power Corporation (EEPCo), the state-owned firm responsible for electricity generation, which operates an interconnected system, Ethiopia has a very high capacity of generating more electric power using Wind, Solar and Hydro power due to its geographical/topographical location with a capacity of 1350 GW of energy from wind, total solar energy reserve of 2.199 million TWh/annum, and the economically feasible hydropower potential has been estimated at 162,000 GWh/annum, the second largest in Africa, which aim to make Ethiopia climate resilient and have zero carbon growth by 2025 [
27].
Even though Ethiopia considers itself the powerhouse of Africa, for the 81% of the people living in rural areas, less than 3% have access to electricity, while 86% of the urban residents have access to electricity, which is seriously limiting the Country’s growth and development. Given the absence of other affordable power access, people still relay on traditional forms of energy, such as firewood (90% use traditional biomass for cooking, 70% use kerosene for lighting, and per capita electricity consumption is 77 kWh/year), which leads to increased deforestation, soil erosion, environmental pollution and health problems. The country’s system installed capacity is ~2332.6 MW with annual energy production equal to 4980.08 GWh, gross consumption (GWh) is equal to 3844.87, and length of distribution network (km) is 138,838 [
25,
26].
Due to the lack of natural resources and the cost of imported fuels, power generation in Ethiopia comes primarily from hydroelectric sources. According to EEPCo, Ethiopia’s total electricity, generation in 2014 was 3981.07 GWh. Though the contribution of hydropower is only 0.9% of the total energy supply, it generates 85.7% of electricity and is thus the country’s dominating electricity resource, followed by Diesel (7.39%) and Wind and geothermal (6.873%) electricity generation (see
Table 1).
In the ICS (Interconnected System), EEPCo currently operates hydro power, one geothermal, 102 generating units of Wind farm and 15 diesel grid-connected power plants with total capacities of 2000 MW, 7.3 MW, 153 MW and 172.3 MW, respectively. Another three hydropower and several diesel off-grid power plants with capacities of 6.15 MW and 31.34 MW, respectively, operate as Self-Contained Systems (SCS). The ICS is expanding, whereas the SCS is shrinking due to the interconnection of previously SCS served towns to the ICS. As of July 2015, a total of 5163 towns and villages with a total of nearly two million households were connected to the ICS and SCS by EEPCo (
Table 2). This system is still far from supplying the country’s demand and the government is in the process of building several hydropower dams. The largest of these are the huge Gibe III project and the Grand Ethiopian Renascence Dam (GERD) with capacities of 1870 MW and 6000 MW, respectively, which is expected to increase capacity by 8000 MW to a total of 10,000 MW by the end of 2018 [
27].
Over the past decades, the country has been plagued by frequent power outages, and this overloading of the network frequently disrupts the power supply of large commercial and industrial customers [
27]. The power demand of Ethiopia has been growing with an average rate of 25% per year during the last five years. To insure a reliable supply of energy at affordable price; sustainably increase access to modern energy technologies and services for lower-income householders, social facilities, and small and medium enterprises; gradually shift from traditional to modern energy; and ensure environmental sustainability to combat conditions in the energy sector in Ethiopia where grid electricity is not feasible, a hybrid off grid renewable energy based power systems has become an attractive solution. Hybrid systems use several generation technologies, therefore the selection of proper technologies and optimum sizing of the components has become of great importance in reducing the overall cost and increasing the reliability of the service. Additionally, changing market drivers are opening up new opportunities for hybrid energy systems, not only in island and remote locations but also grid-connected scenarios.
Hence, in order to overcome this situation and to combat climate change, the use of renewable energy is not only one possible solution, but necessary to reduce the consumption of coal and meet the energy demand by producing clean energy (which will effectively relieve the intense shortage of electricity). Therefore, an optimal configuration of renewables and storage for rural electrification will also attract the market and expand the coverage of electricity for rural and island locations in the near future.
Although the tariffs for electricity depend on the energy consumption, Ethiopia offers electricity to customers at the lowest price per kilowatt-hour of any country in the world [
24]. For instance, considering Kenya the neighboring country the electricity price per kilowatt-hour is €0.212, whereas Ethiopia’s electricity grid offers electricity at €0.07530 per kilowatt hour; consequently, the low price for electricity in Ethiopia is attracting more and more worldwide attention, especially for investors and foreign companies. These reductions of costs are because electricity consumption is not subject to Value-Added Tax (VAT). This exoneration is applied to encourage households to access electricity as a basic service.
Customers with a monthly consumption up to 50 kWh pay a flat rate of 0.273 ETB (€0.016) per month plus a service charge of either 1.4 ETB (€0.059) per month for 0–25 kWh or 3.4 ETB (€0.144) per month for 26–50 kWh. As a result, the average estimated monthly electricity bill is expected to be in the order of ETB 10–25 per month (€0.43–1.07). This represents less than 2% of average monthly expenditure of an average rural household, as the price paid by those households to buy kerosene for lighting is much higher than the relevant EEPCo tariff (
Table 3 and
Table 4).
The levelized cost of electricity per kWh is calculated as a sum of capital cost of generating infrastructure, variable costs of generations, transmission costs, distribution costs, sale and metering service costs, taxes and duties, and Value-Added Tax (VAT). The cost of generation (capital and fuel costs) generally constitutes more than 50% of the final electricity cost. For instance, as per EEPCo, excise and sur tax, and duty are zero, the charge for connection fee is about 500 ETB (€22) but can go up to €100. The connection fee is sometimes collected by EEPCo immediately or through time adding with the monthly customer’s bill over a 24-month or even longer period since most of the poor residents have difficulties to pay the connection costs instantly. The fee includes wiring to the house and the installation of an electric meter.
The ambition of the rough description and discussion of the national grid tariff is helpful in analyzing the feasibility and economical justifiability of grid extension in comparison with designing and construction on new off grid renewable energy sources with optimized storage system in providing electricity for the rural underserved communities regardless of where they are located.
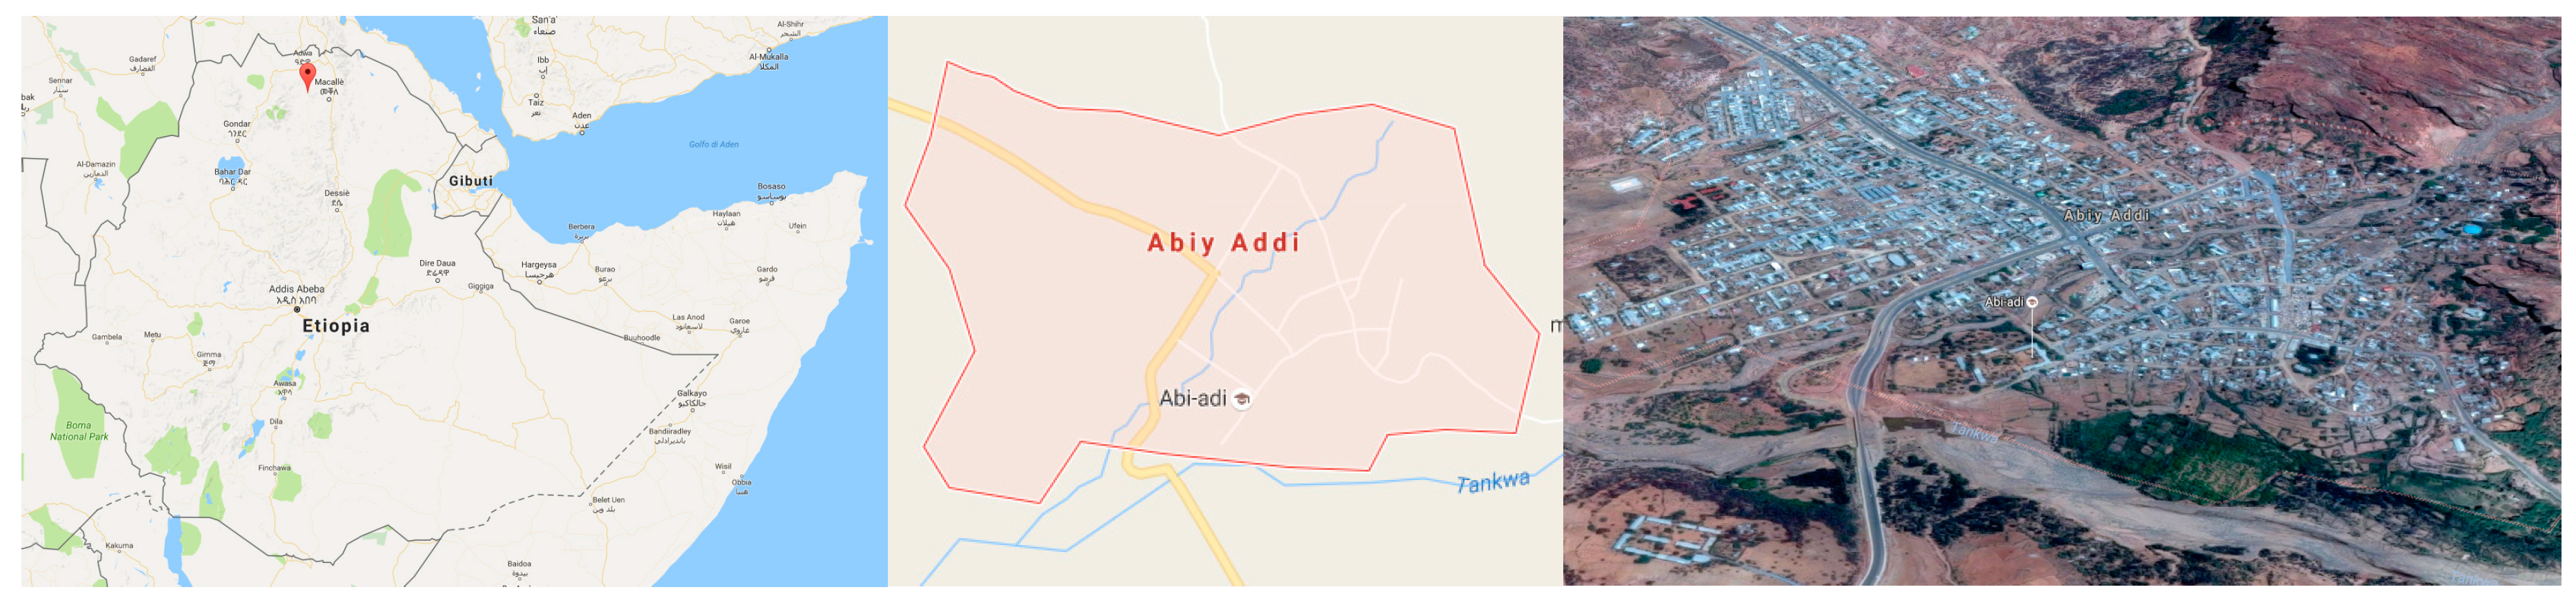
The focus of this study has been to investigate the optimum configuration of a hybrid system and storage system, which can supply electricity to a rural community in Ethiopia (
Figure 2). A rural village in north central Ethiopia separated from the grid, located about 870 km north of the capital city Addis Ababa in the Mehakelegnaw Zone of the Tigray Region has been studied. This town has a latitude and longitude of 13°37′23″N and 39°00′06″E, with an elevation ranging from 1917 to 2275 m above sea level. Approximately 21,450 residentes (3575 households) [
29] with an approximate daily electricity consumption of 15,640.246 kWh inhabit this town.
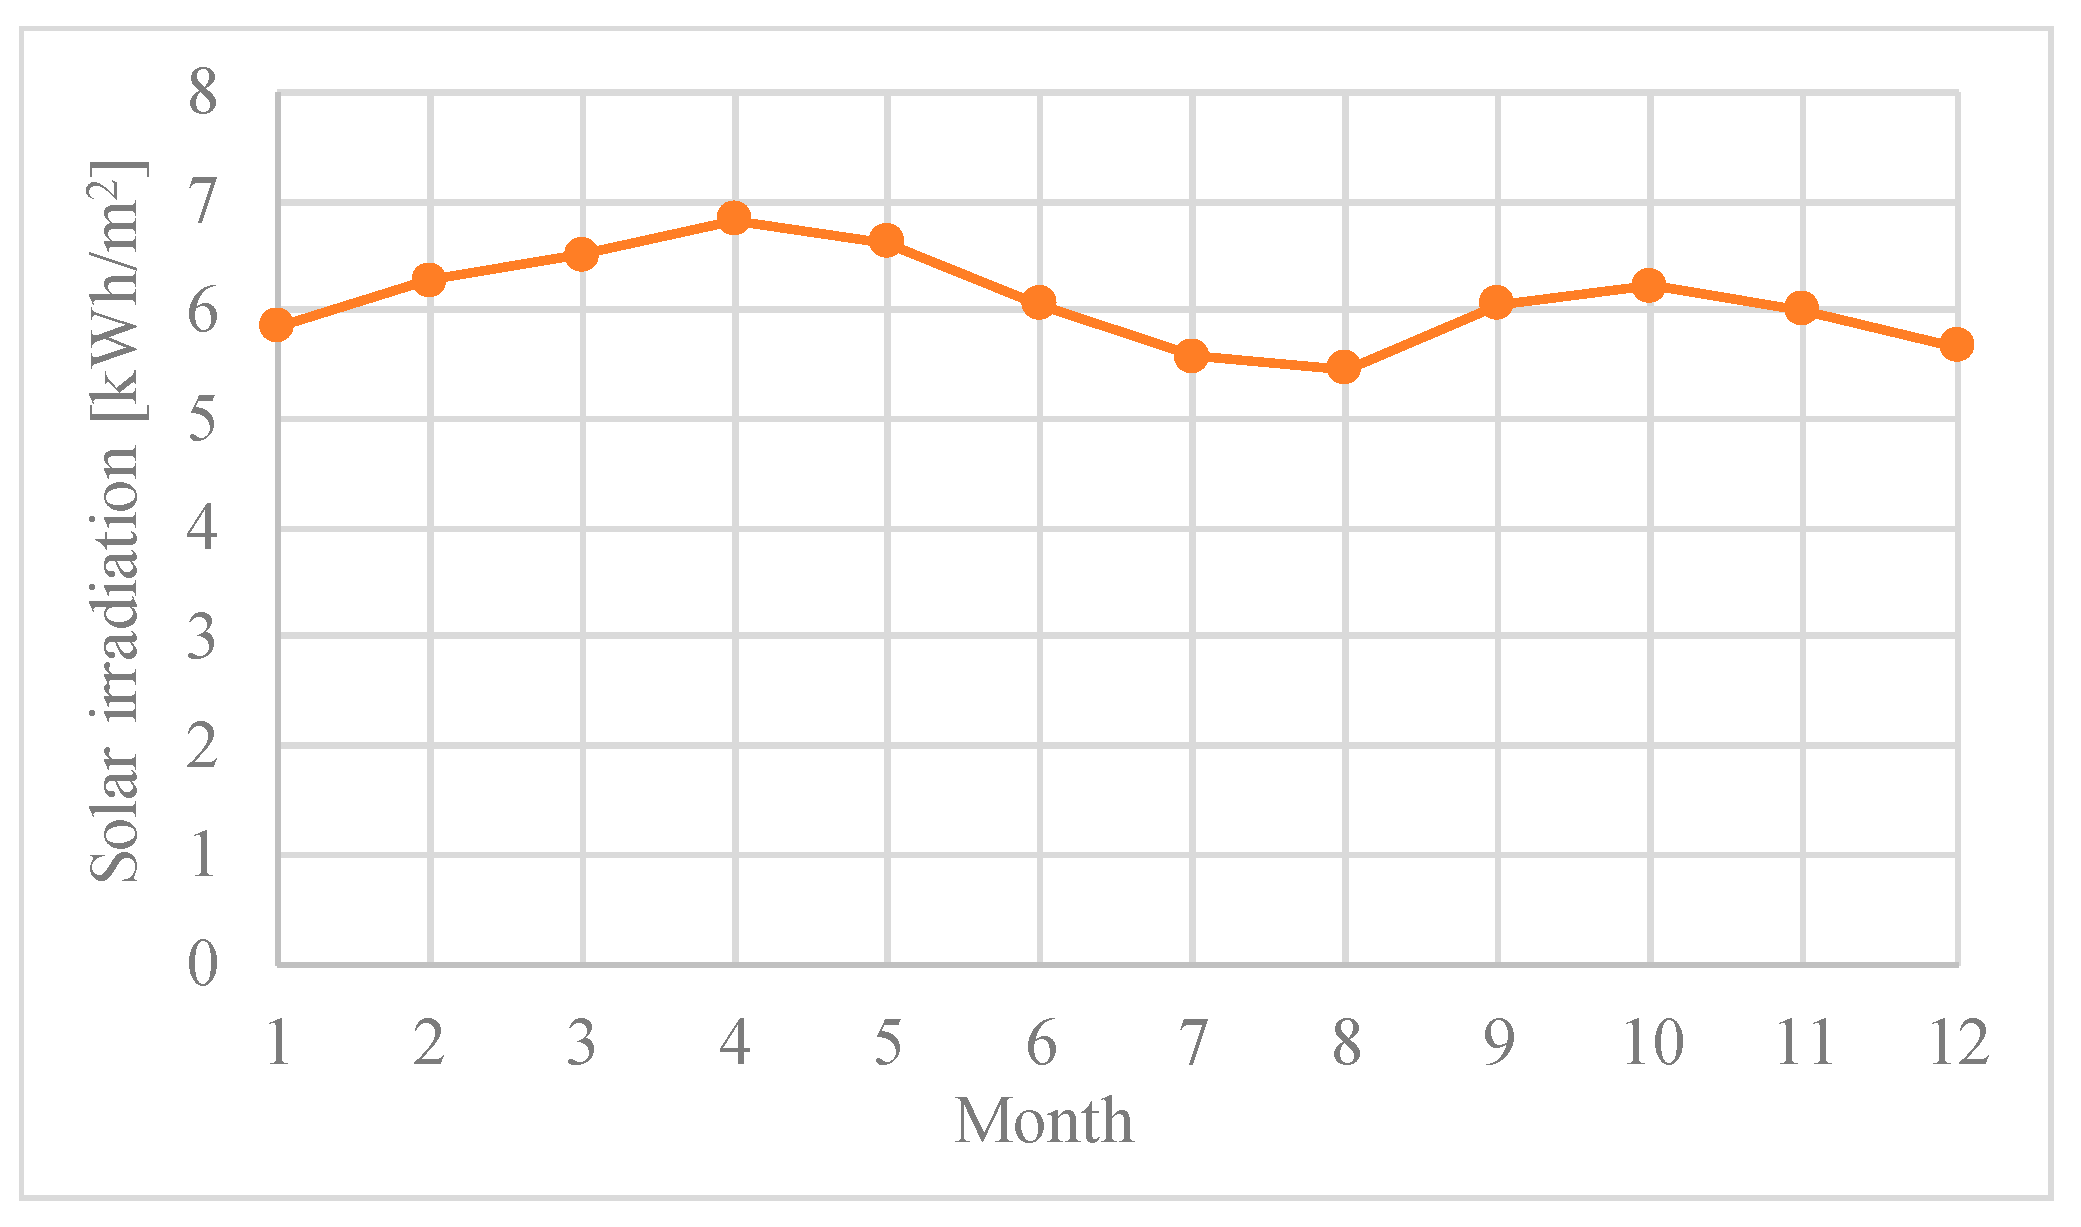
Abiy Addi receives an abundant supply of solar radiation throughout the year. In this work, the monthly average radiation data for this region are obtained from the NASA Surface Meteorology and Solar Energy data base (NASA, 2014) (
Figure 3).
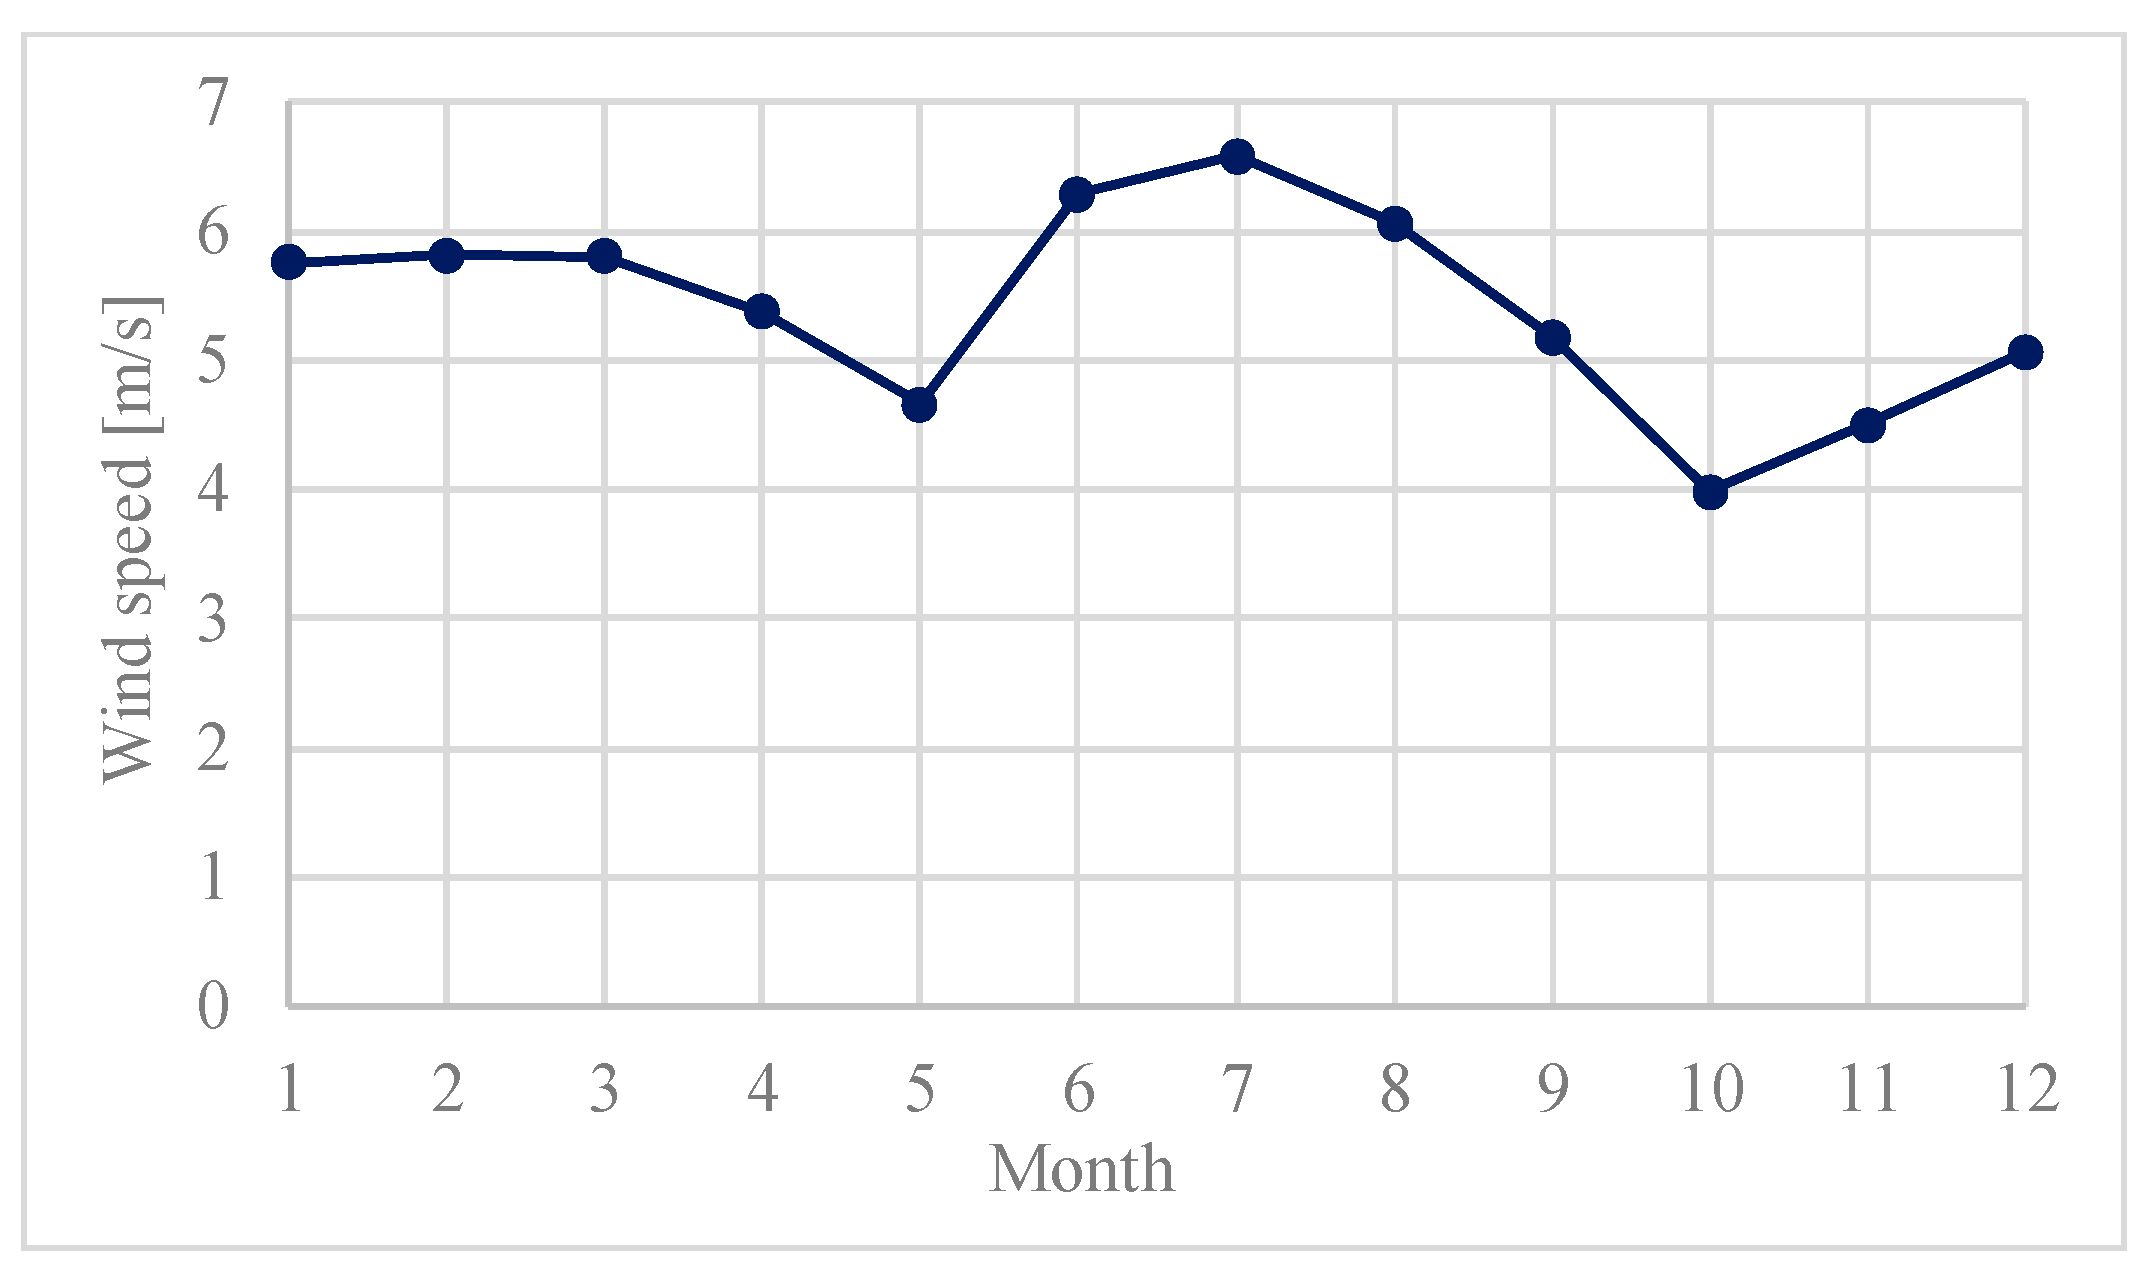
The Somali jet stream, which is formed after low pressure in the western Indian Ocean changes direction at the Horn of Africa, working together with the rift valley, brings excellent wind resource in Abiy Addi, Ethiopia. For this reason, Ethiopia currently has the largest modern wind farm in East Africa.
Figure 4 presents the wind speed during the year.
4. Simulation and Analysis of Results
In order to get an optimal usage of resources and storages system, a comparison is made comprising three main categories of simulation strategies: with battery storage only, hydrogen fuel cell storage only, and battery and Hydrogen combined storage system (
Figure 5). Hence, considering the above configuration, 14 different scenarios have been studied.
The different system configurations are simulated using HOMER to obtain the one that satisfies the specified technical constraints at the Least Life-Cycle Cost (LCC) and hence the least Net Present Cost (NPC) is obtained. HOMER calculates the total NPC using Equation (1):
where
is the total annualized cost,
is the annual real interest rate (discount rate—5.08% is used),
is the project lifetime and
is the capital recovery factor—a ratio used to calculate the present value of an annuity and is given by Equation (2), where
is the project lifetime in years (in our case 25 years):
Different approaches can be used to calculate the levelized
COE of renewable energy technologies as they vary by technology, country and project, based on the renewable energy resource, capital and operating costs, and the efficiency or performance of the technology. To calculate the Levelized Cost of Electricity (
COE), which is defined as the average cost per kWh of useful electrical energy produced by the system, HOMER divides the annualized cost of producing electricity (the total annualized cost minus the cost of serving the thermal load) by the total useful electric energy production. Hence, it calculates the
COE using Equation (3):
where
is total annualized cost of the system ($/year),
is boiler marginal cost ($/kWh),
is the total thermal load served (kWh/year),
is the AC primary load served (kWh/year),
is the DC primary load served (kWh/year),
is the deferrable load served (kWh/year), and
is the total grid sales (kWh/year). The second term in the numerator is the portion of the annualized cost that results from serving the thermal load. In our systems, since we do not serve a thermal load (
), this term equals zero.
Table 5 is the summarized categorized optimization result of the microgrid with Maximum Annual Shortage Capacity Constraint (MASCC) equal to 5% by considering lack of frequent O & M, as they are remotely located and access to resources fluctuates.
Table 5 summarizes all the different combinations used in order to get the optimal solution.
Looking at the optimization table above, we can compare the first three cases bearing in mind the total NPC, levelized
COE and operating cost over lifetime cycle of the microgrid:
Simulation result 1 (PV–Wind–Hydro–Dsl–Battery): It is clear that the system has the least initial capital compared to other generation mixes with the total NPC $6,935,825 and COE of $0.089-kWh, whereas having high cost for O & M of $155,620/year and a renewable fraction (or renewable penetration) of 0.99 since the optimal design comprised renewables and Diesel generator as a backup system.
Simulation result 2 (PV–Wind–Hydro–Dsl–Battery–H2): The system has similar initial capital with the first winning simulation compared to other generation mixes with a total NPC $6,943,358, Operation cost of $155,587/year and COE of $0.09/kWh and a renewable fraction (or renewable penetration) of 0.99 since the optimal design comprised renewables and Diesel generator as a backup system. The presence of Hydrogen storage makes the O & M cost a bit lower than with first case.
Simulation result 3 (PV–Wind–Hydro–Battery): It is clear that the system has slightly higher Initial capital compared to the first two generation mixes with a total NPC $7,011,074 and COE of $0.09/kWh. However, in this case, the Operation cost, $128,784/year, is lower than the first two cases having a renewable fraction (or renewable penetration) of 1 since the optimal design comprised only renewables.
Therefore, among the optimal solutions, considering the overall lifetime of the project, current environmental conditions, future advancement of technologies and large deployment of renewables and storages, the PV–Wind–Hydro–Battery combination having the lowest O & M cost and a renewable penetration of 1 is considered as the optimal solution for the proposed microgrid. For rural residents, who are far from the basic awareness, the use of Hydrogen as a storage is not recommended unless awareness is created and or it is protected well. The study has found that the use of storage as compressed hydrogen gas in entirely is not feasible since hydrogen production requires more electricity for the production and storage, which is due to the round trip efficiency of hydrogen.
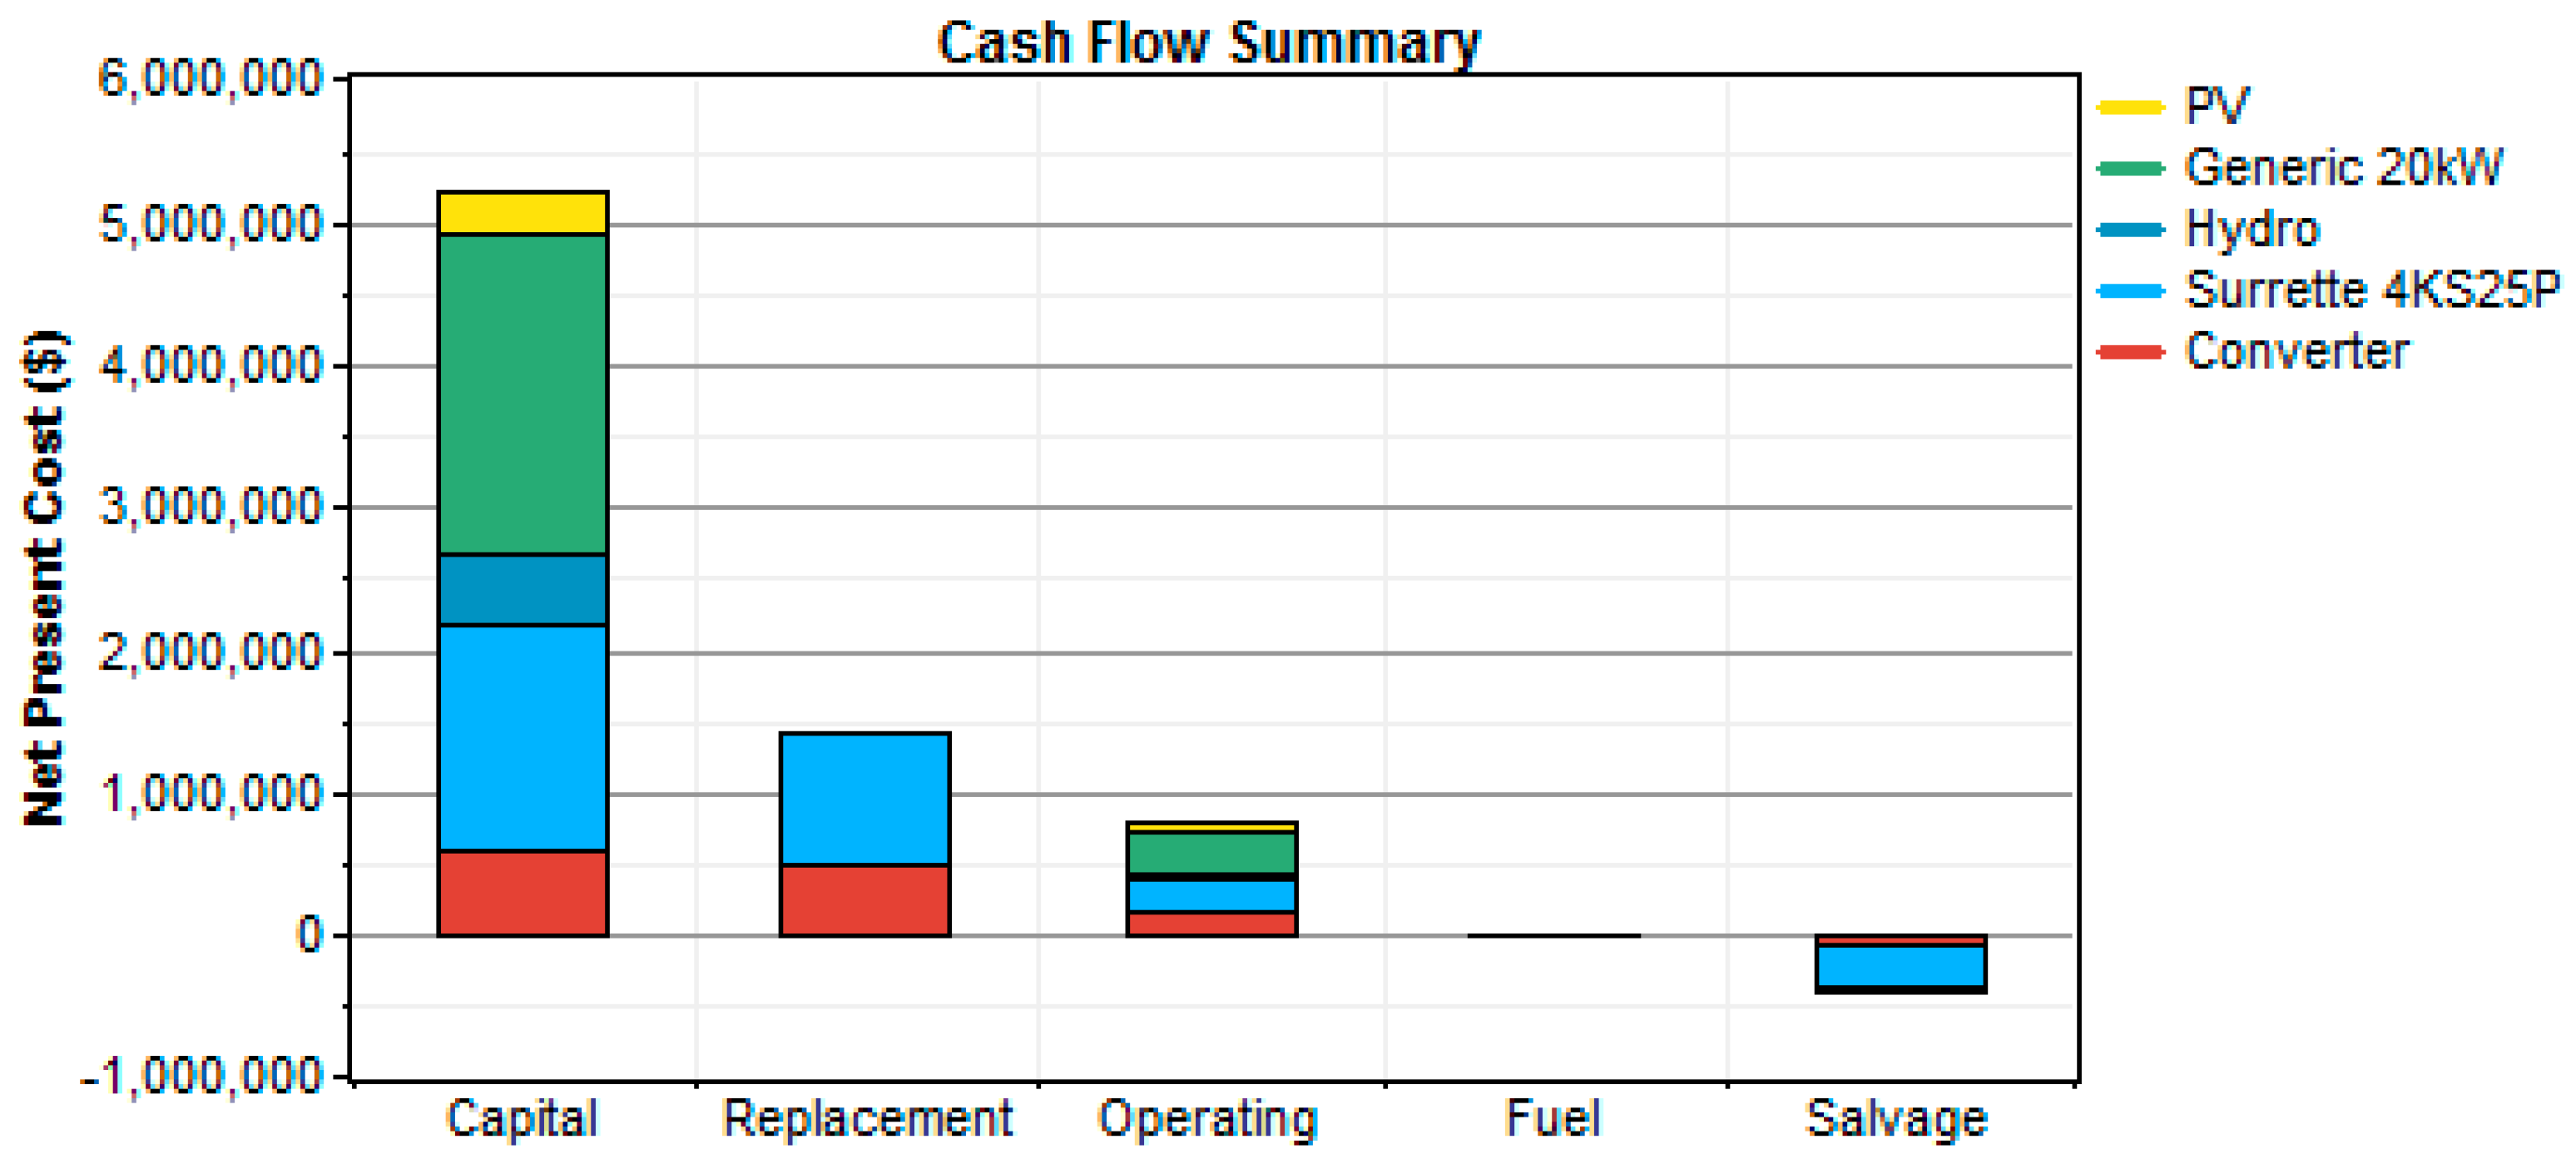
The cash flow summary, shown in
Figure 6, is computed on the PV–Wind–Hydro–Battery system.
As can be seen in
Figure 6, the system has low operating cost, only constituting 6.732% of the capita cost, with zero fuel cost, and, consequently, zero carbon emission. The simulation result shown in
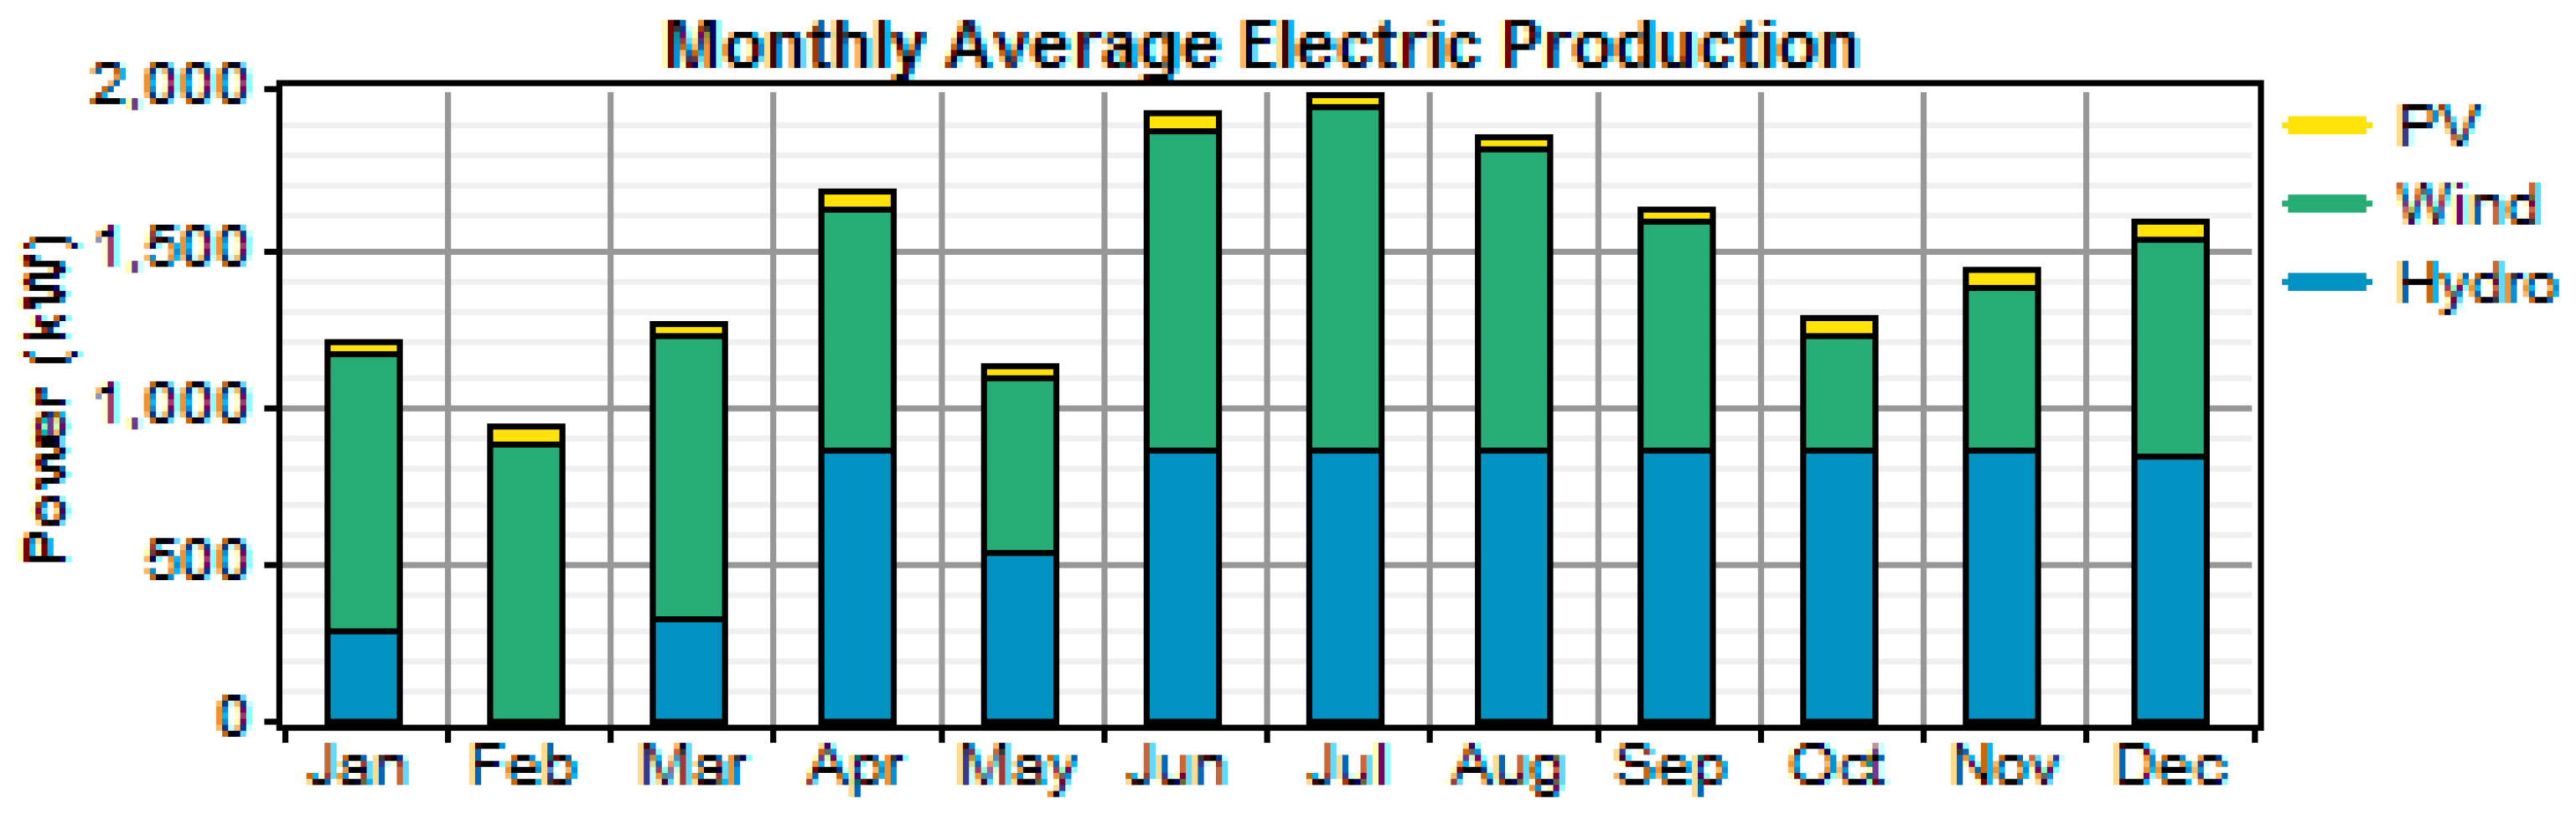
Figure 7 is the microgrid system electrical production comprised of 3% PV array, 52% Wind turbine and 45% Hydro turbines.
The load consumption is constituted as high as 99% with AC Primary load and only 1% of Deferrable load. The system also produces excess electricity of 7,217,087 kWh/year with unmet load of 168,213 kWh/year and capacity shortage of 288,677 kWh/year.
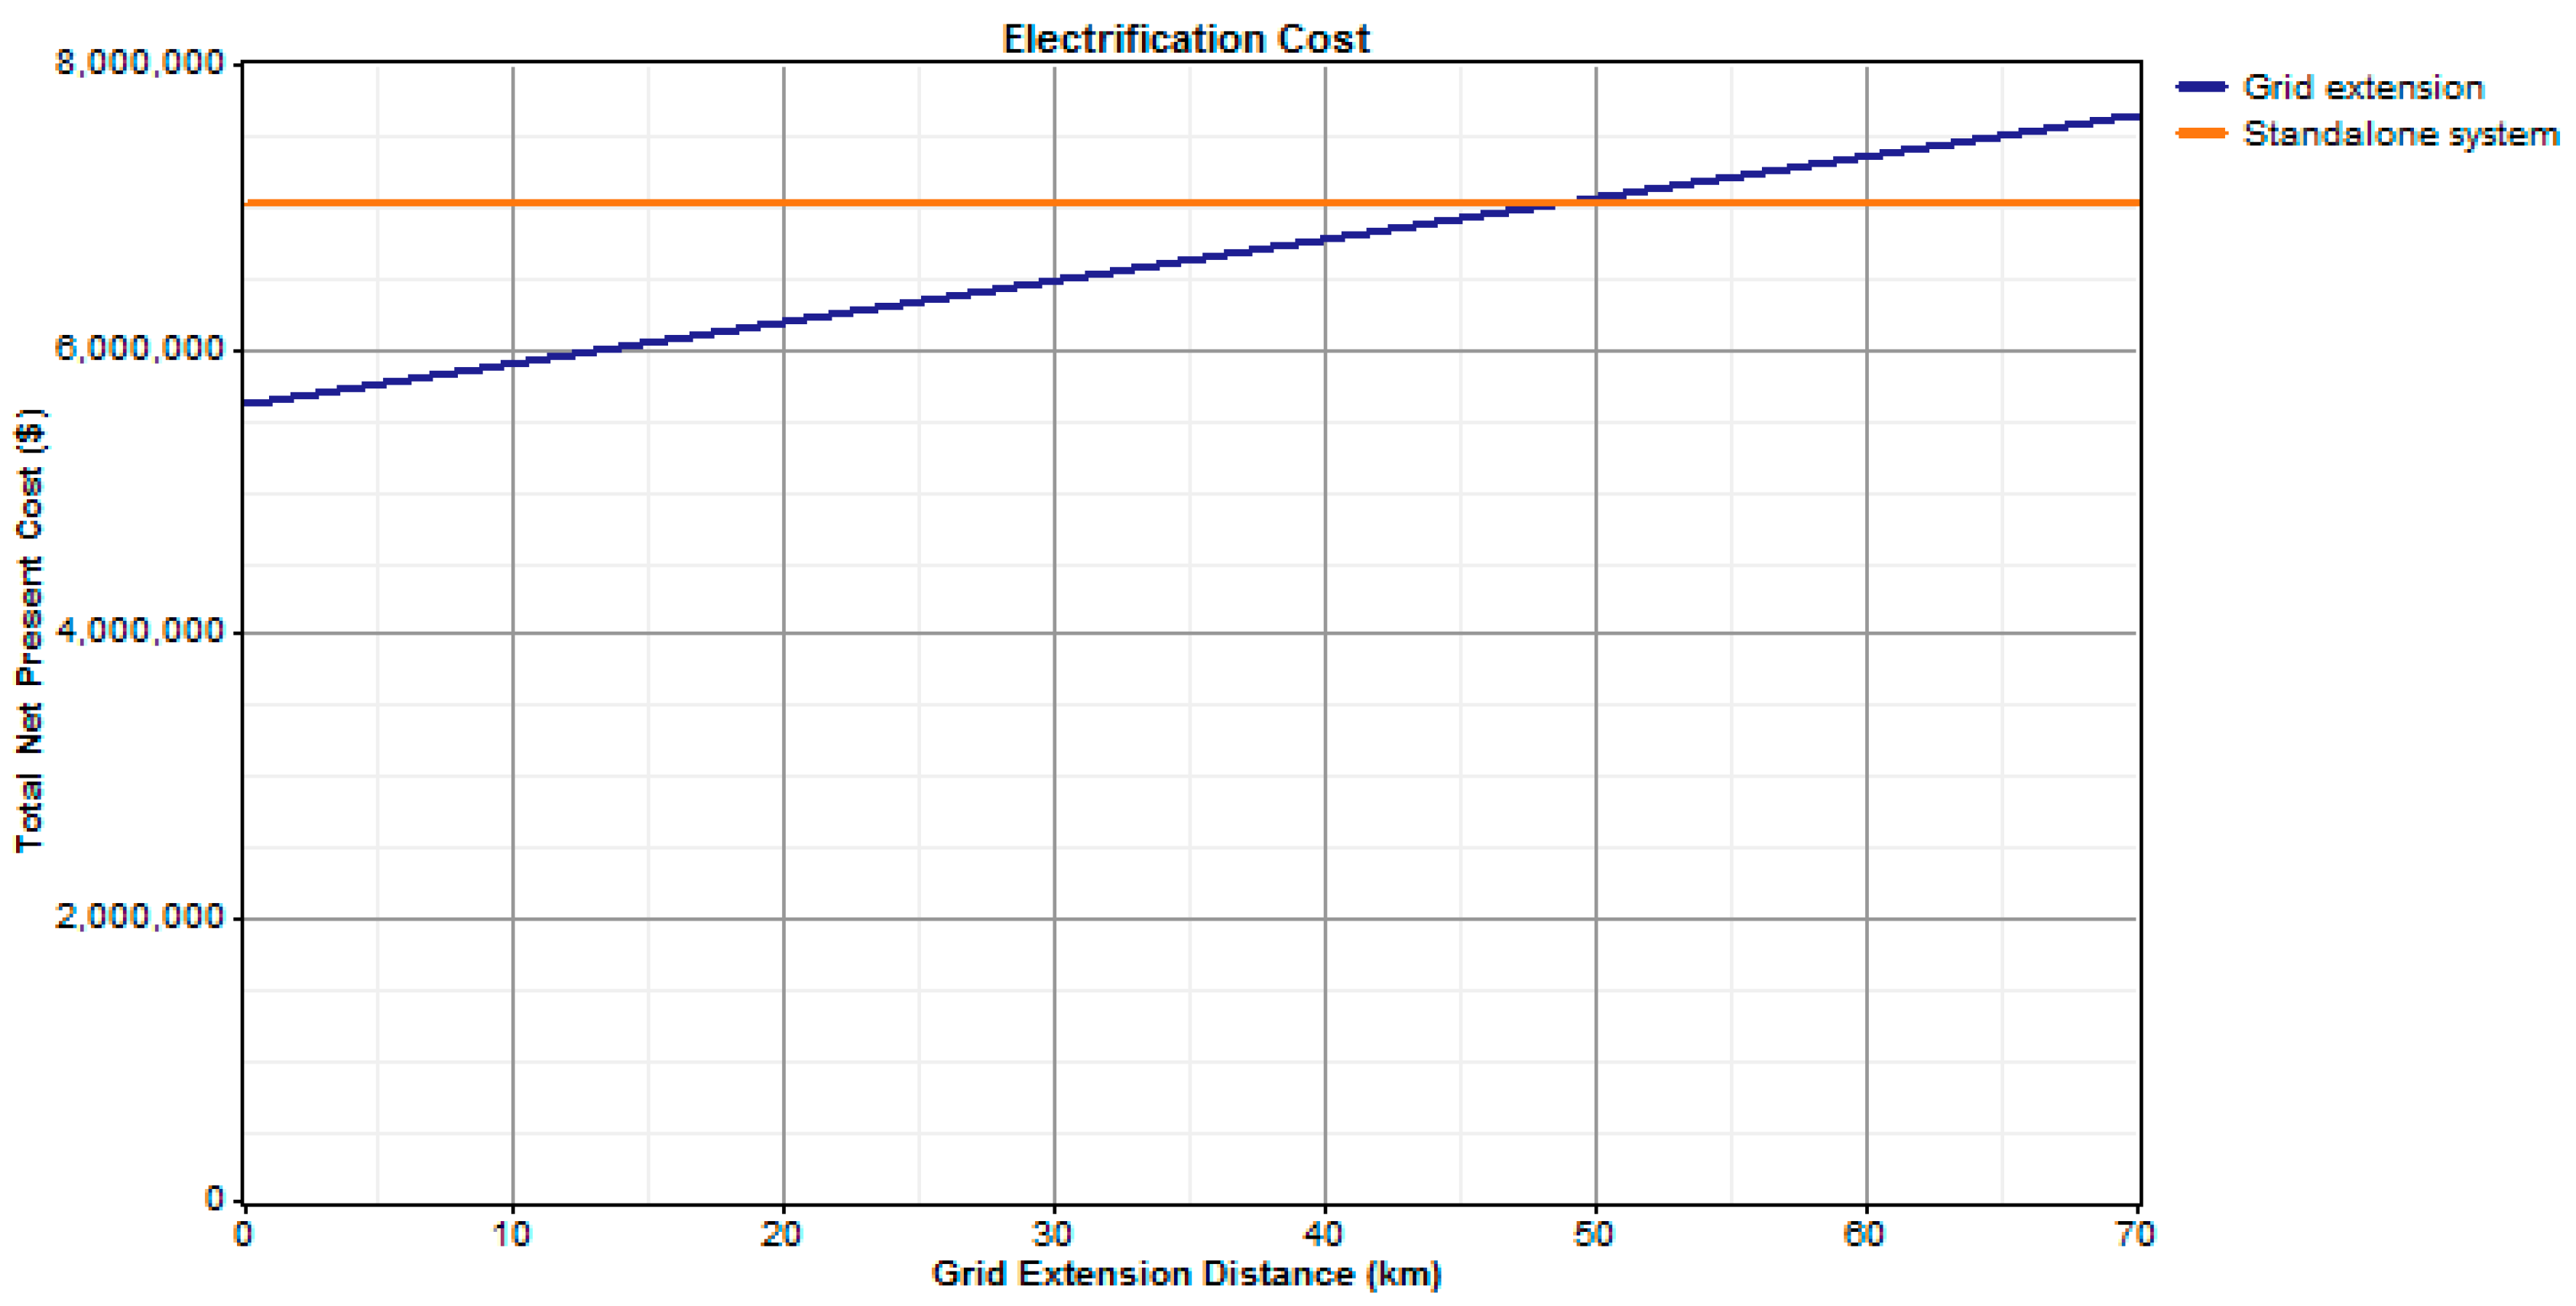
Grid extension connects the facility to the local utility grid. If available, grid extension is the most reliable and cost effective power supply. For the particular selected site, the computed breakeven distance is 48.3 km.
Figure 6 shows that the extension of the grid is feasible only if the distance of the microgrid to be implemented for the rural areas is less than or equal to the breakeven distance, which is ≤45.7 km, 46 km and 48.3 km for PV–Wind–Hydro–Dsl–Battery, PV–Wind–Hydro–Dsl–Battery–H2, and PV–Wind–Hydro–Battery systems, respectively; otherwise it will not be cost effective to extend electricity from the grid since the cost of extension, O & M, and losses related to transmission will be higher and leads to higher electricity tariff for the end users.
Figure 8 shows that the cost of extending lines to rural facilities is prohibitively expensive.
Consequently, considering the case study Abiy Addi, Ethiopia, which is 100 km from the nearest grid, the grid extension is not recommended. A realistic grid extension occurs only if we have enough generating capacity to cover different parts of the country. The quality of grid power in developing countries is often poor; in the case of Ethiopia, the system is still far from supplying the current users as they still suffer frequent power outages and rural residents do not have access to electricity almost at all with only less than 3% having access.
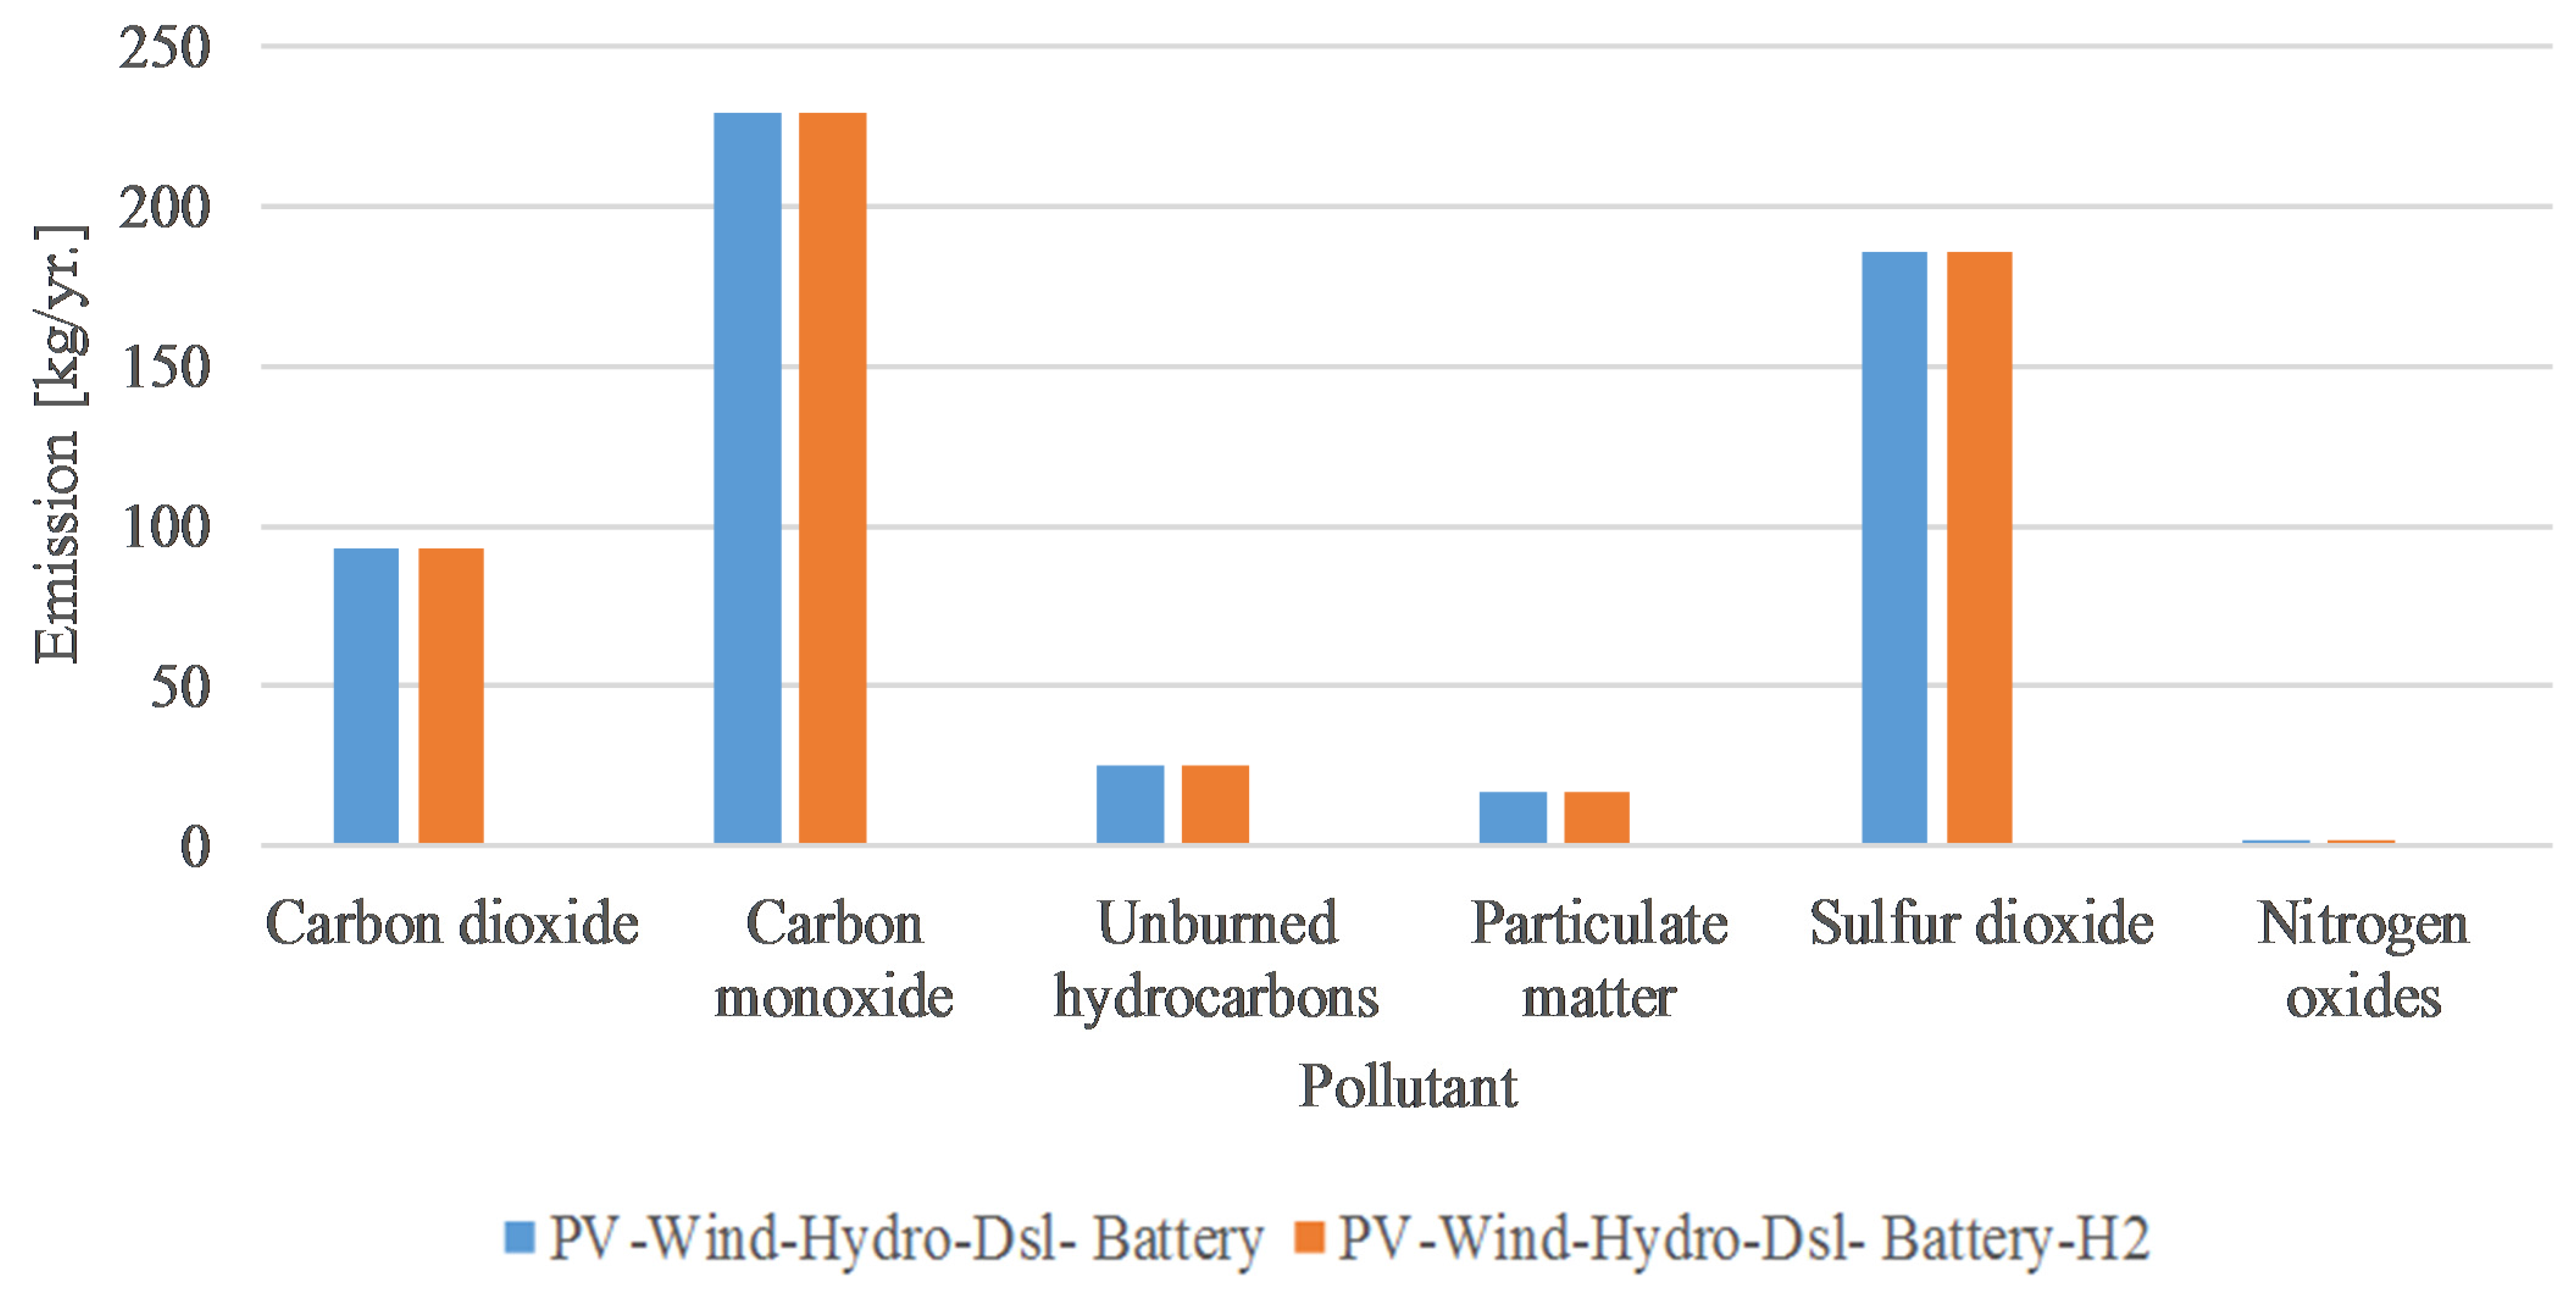
Hence, the implementation of the on-site microgrid would not be questionable despite the slightly higher cost of electricity compared to the current national tariff. The main issue of using electricity generation industries is related to the emission of greenhouse gases and their implication to climate change and human health. Among the many different generation mixes simulated,
Figure 9 shows the greenhouse emission of three simulation results.
PV–Wind–Hydro–Battery electricity generation method has a renewable fraction of 1, which implies that they do not produce carbon dioxide or other greenhouse emission that contributes to the global warming, whereas the two other systems, which use diesel generators, have the same amount of emissions—as high as 95,080 kg/year (
Figure 9).
Hence, to be in line with the current environmental impact issues and other factors, electricity generation with zero greenhouse gas is favored and recommended to be used despite higher initial cost of investment, which can be subsidized by the government and other concerning bodies to reduce the COE.
5. Sensitivity Analysis
The sensitivity analysis was realized using HOMER to investigate the effect of uncertainties or variations in major variables, namely cost (PV, Battery, Wind Turbine, Diesel and Converter), resource, constraint, and hub head of turbines, would have on the choice of micropower design. For this analysis, minimum and maximum values were chosen for the four variables and the results are shown below with superimposed levelized COE and total NPC.
5.1. Cost Variability
The main reason behind the reflection of cost variability is due to the considerable uncertainty about how the cost of technologies evolves over time, especially in developing countries like Ethiopia, where the market system and currency deviations are unpredictable and political forces are more indecisive.
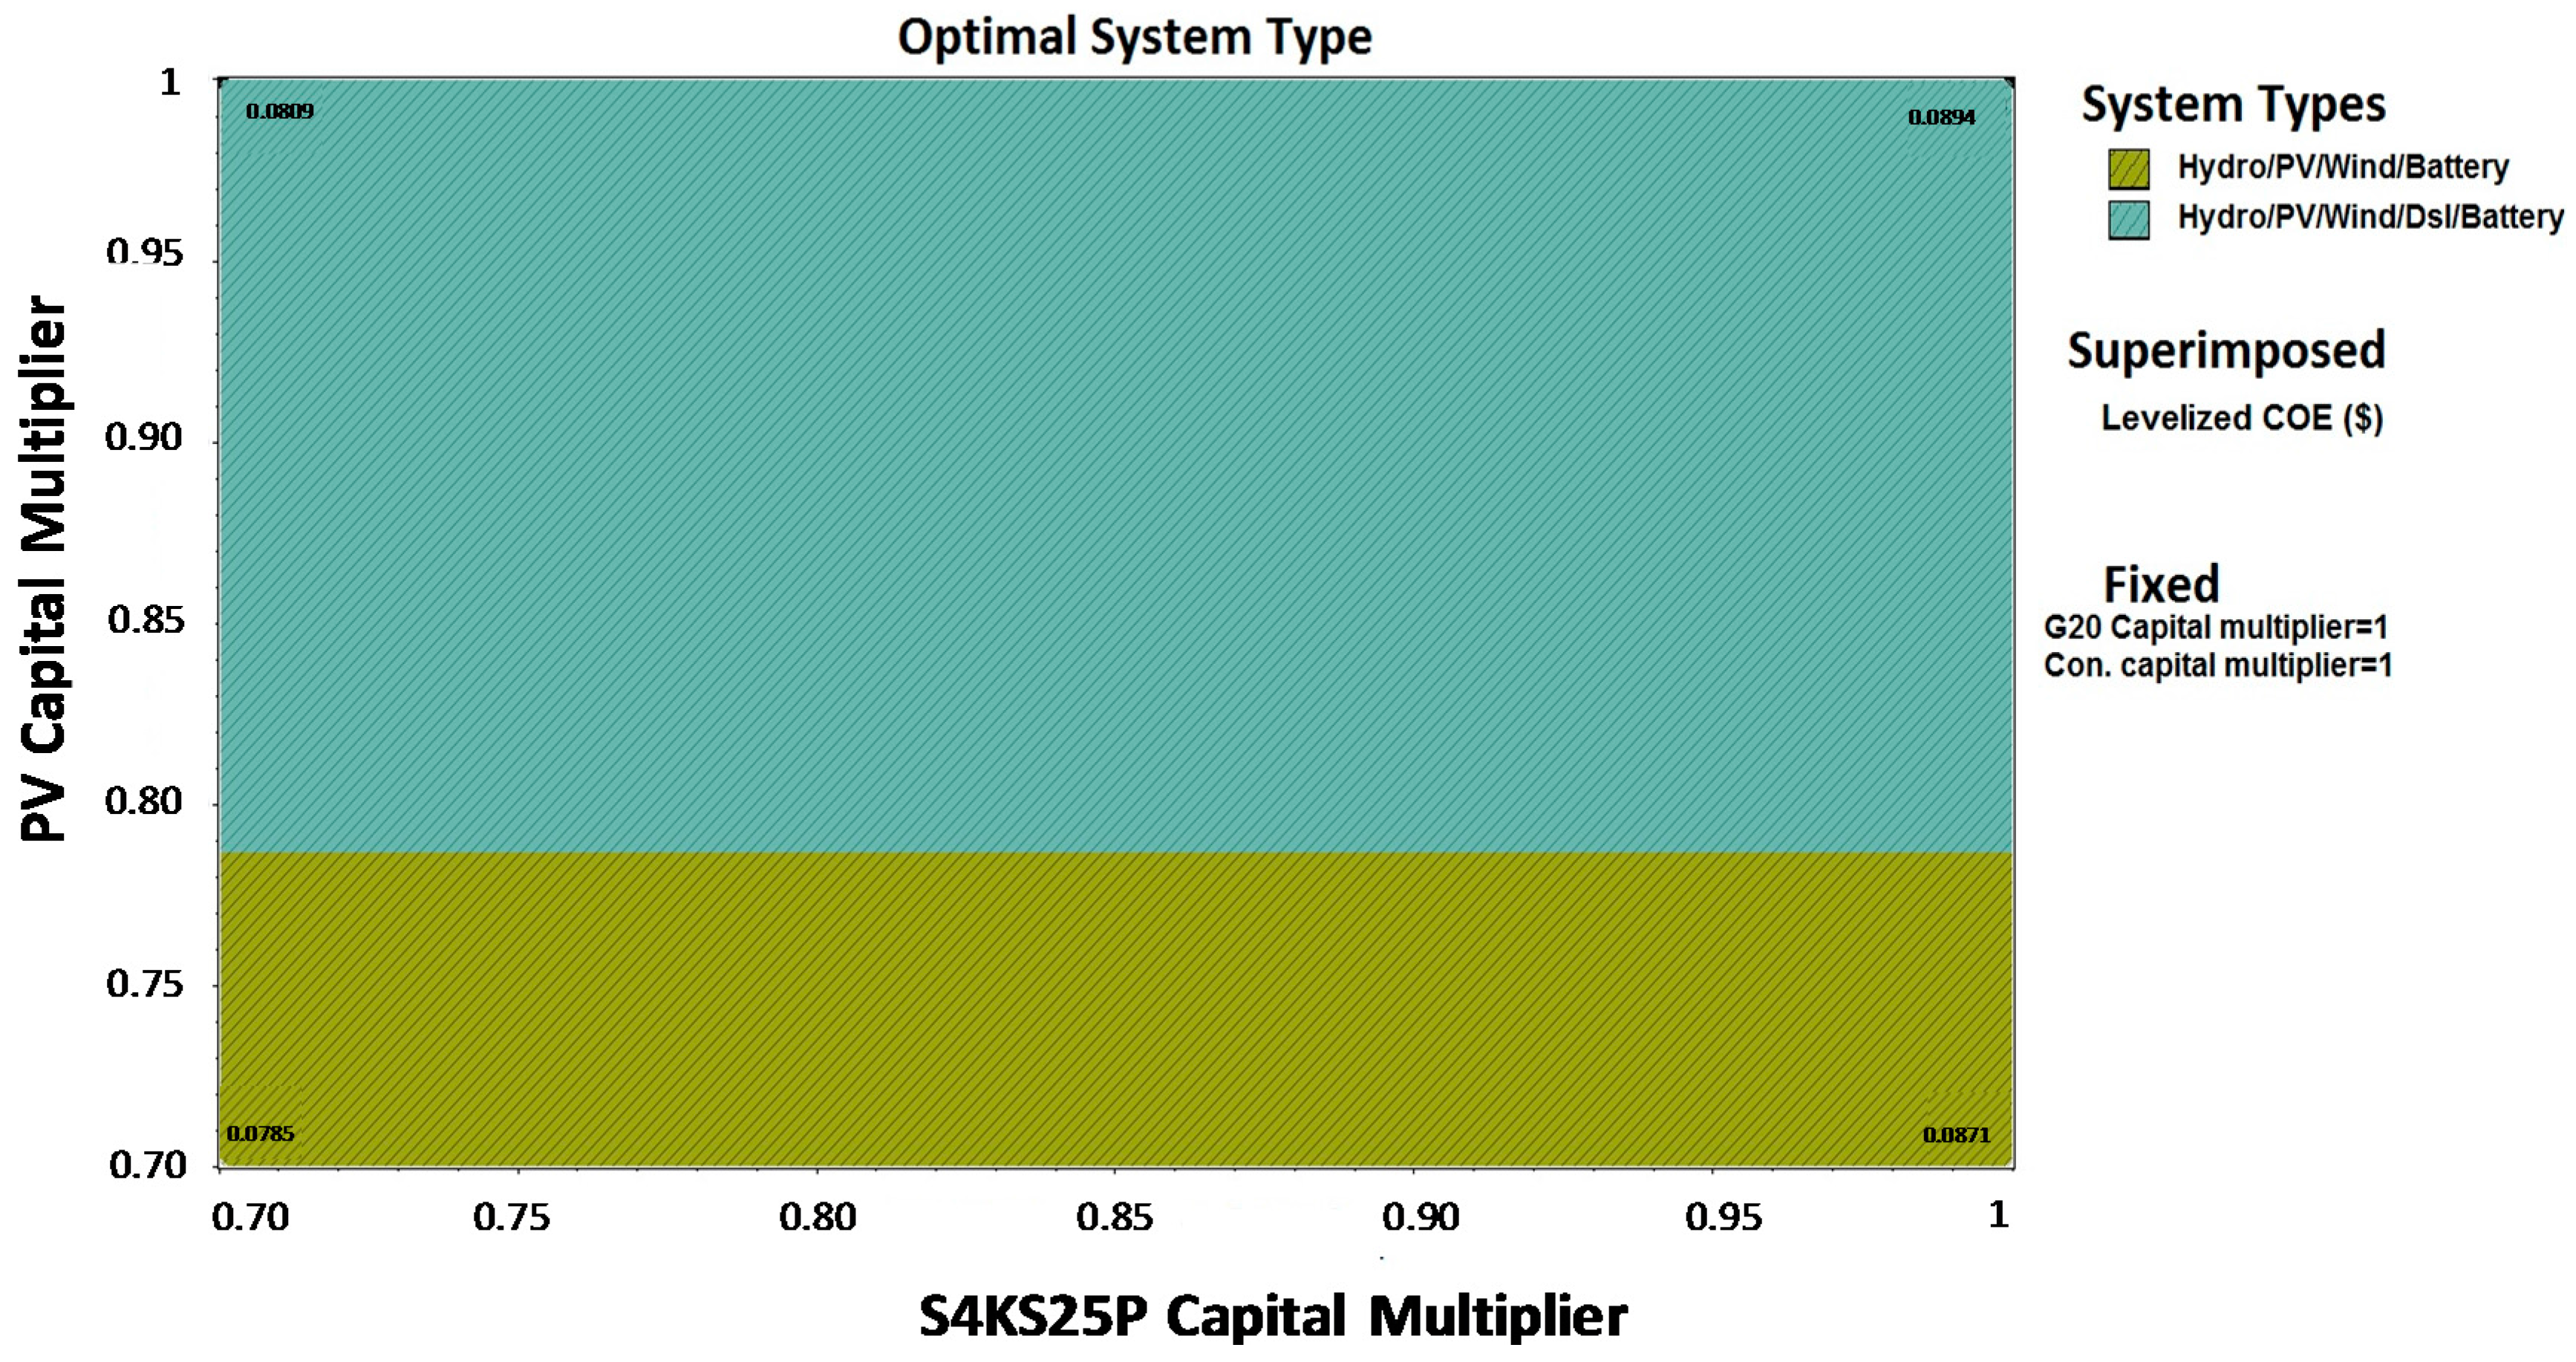
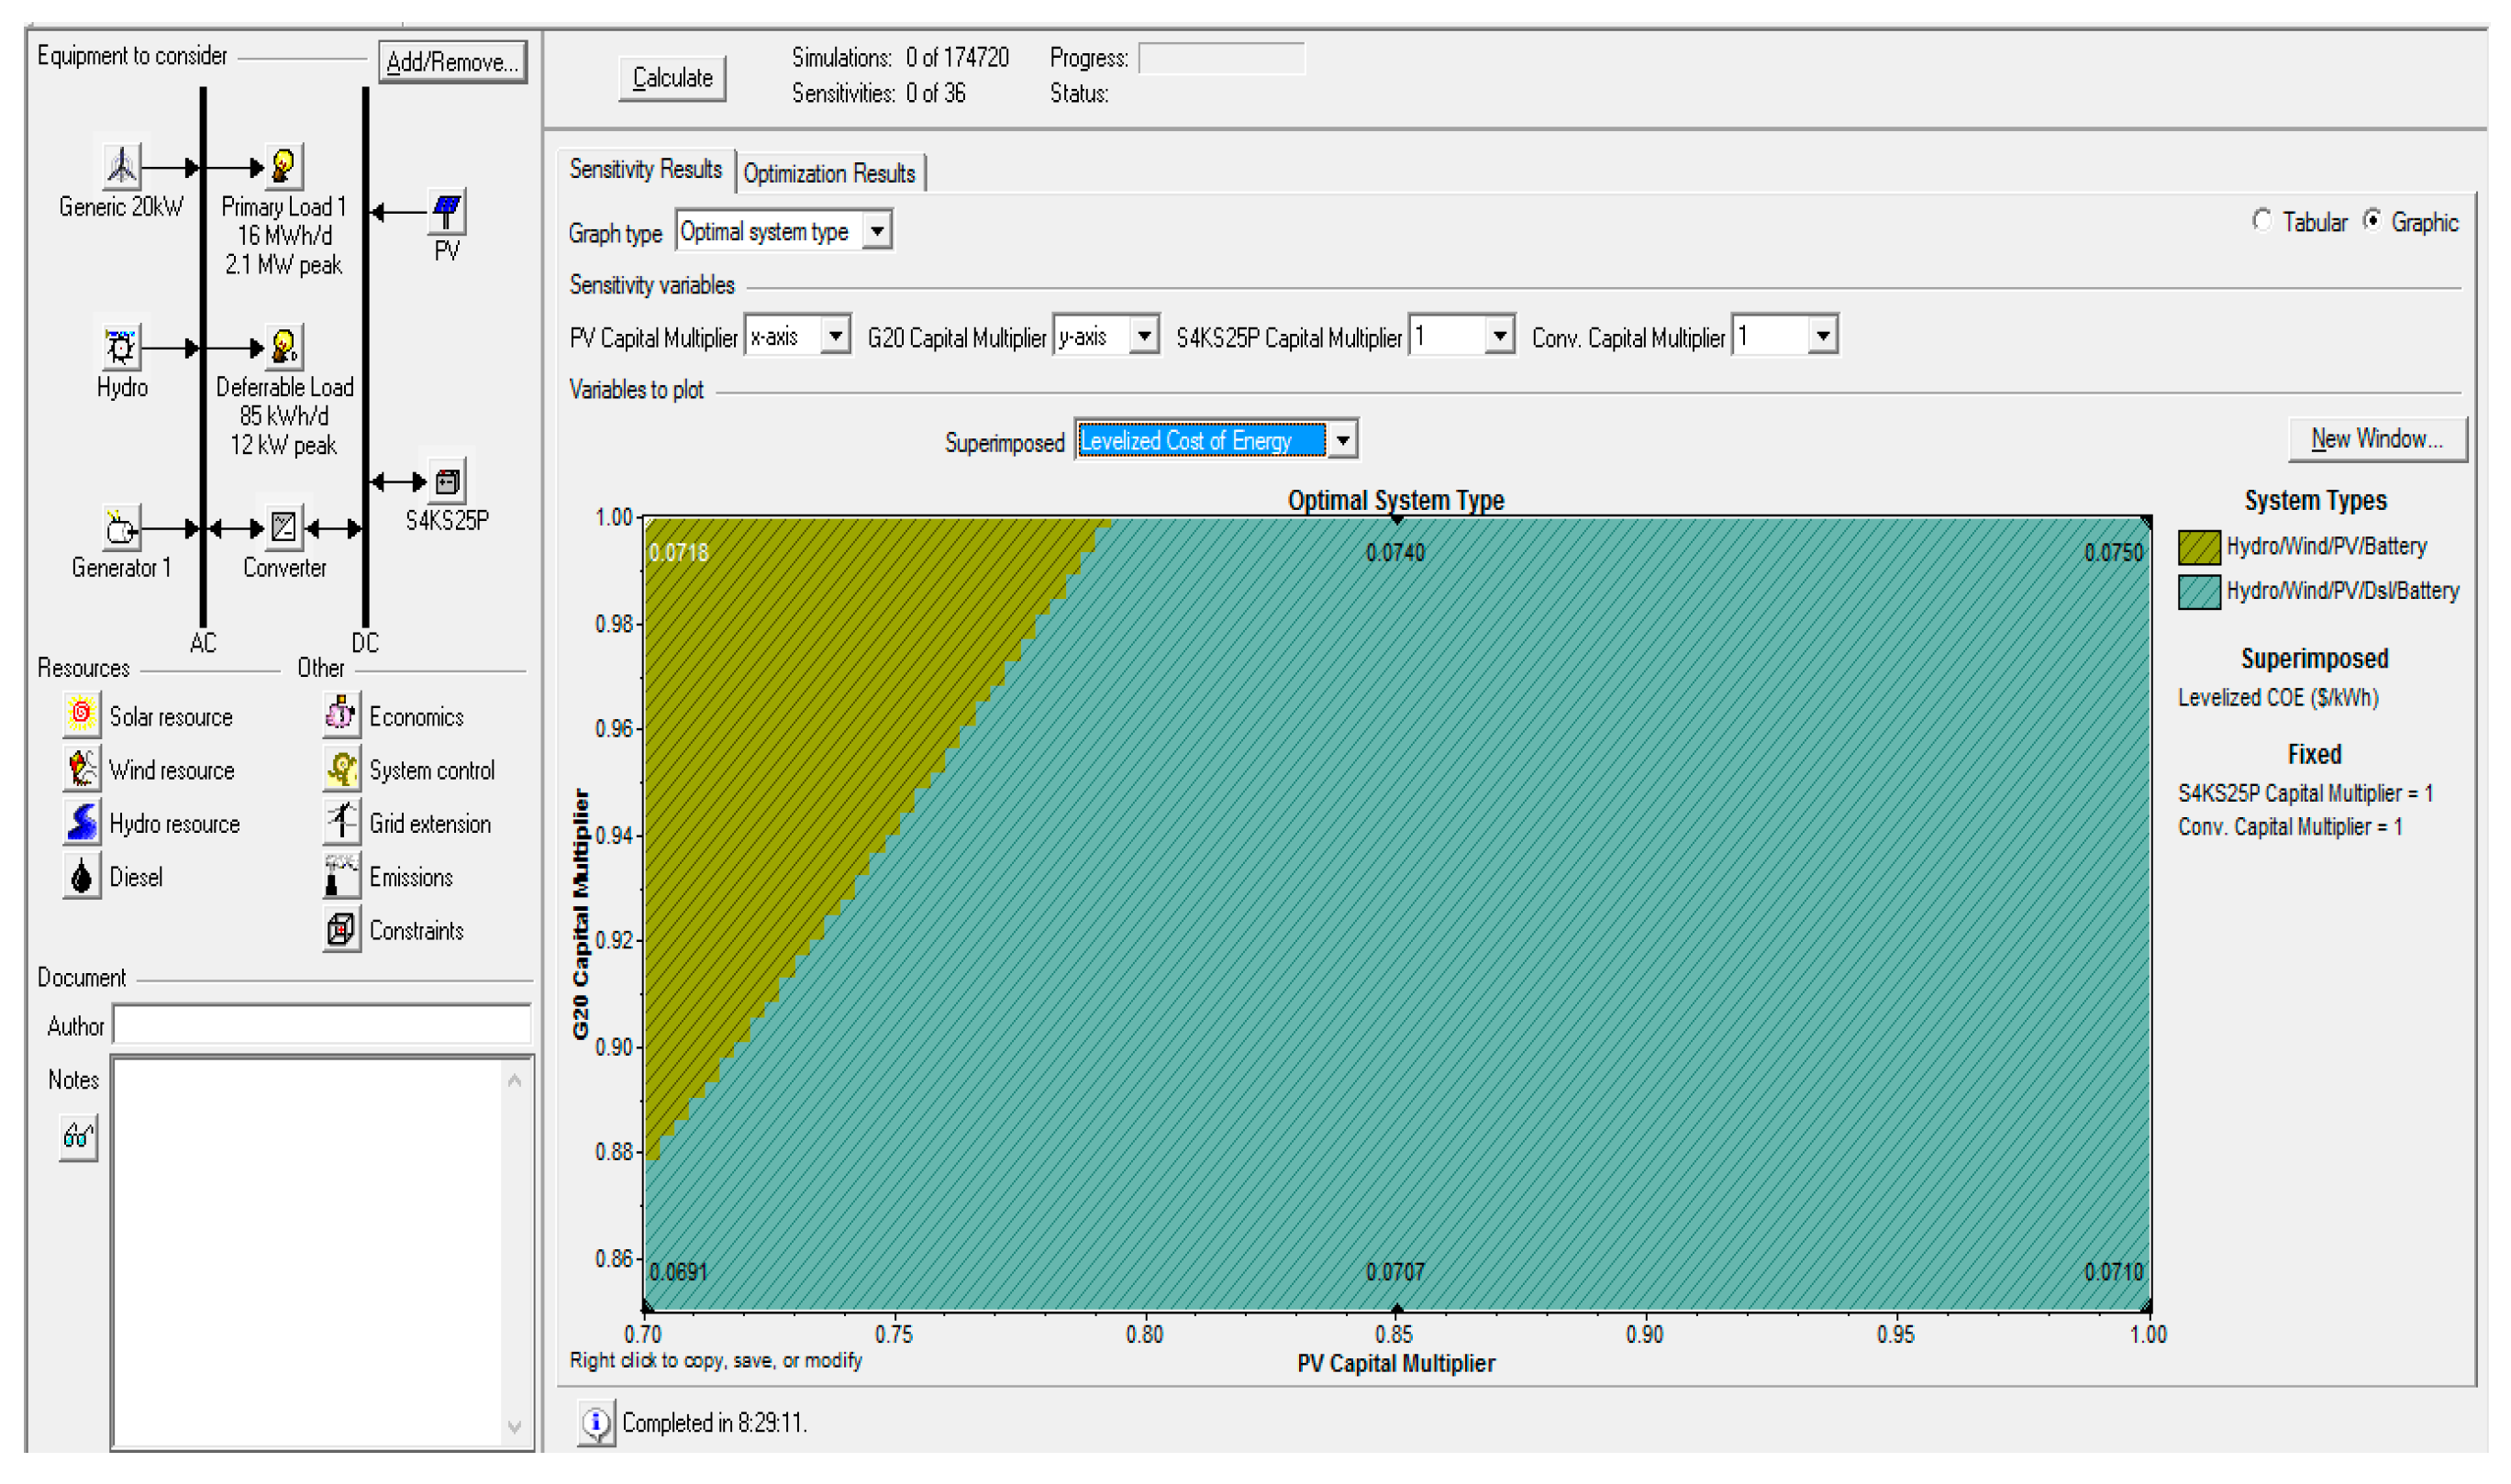
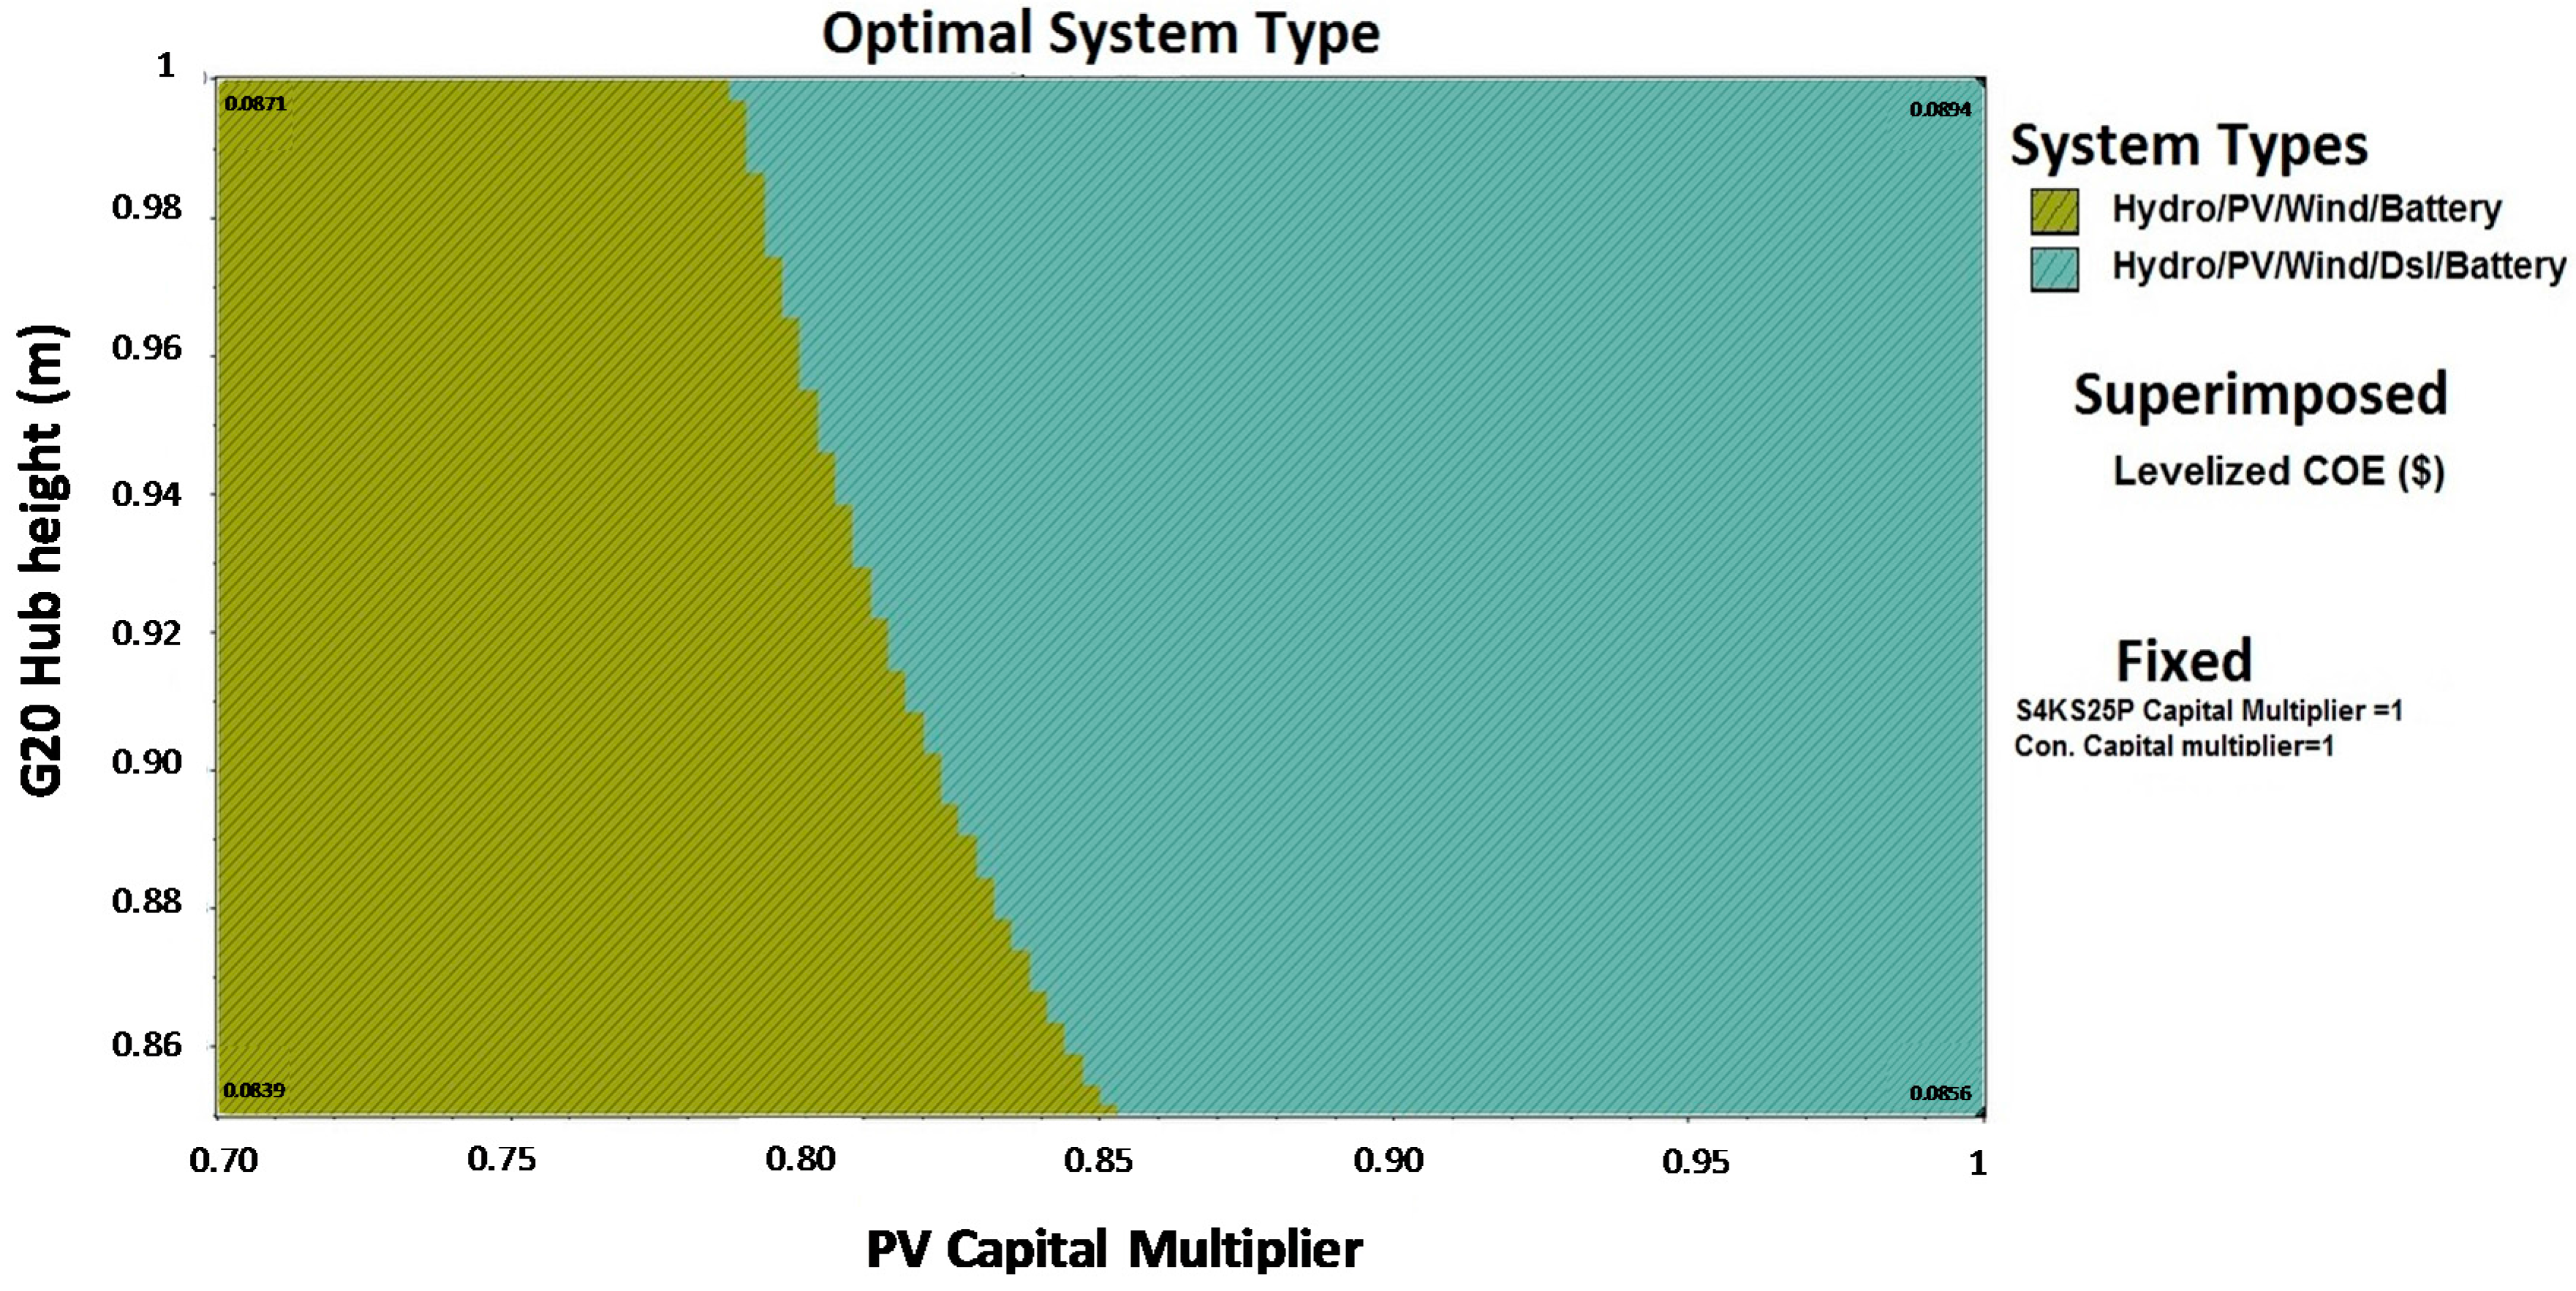
Figure 10 represents the change in choice of generation mix due to change in cost of components.
Hence, considering a reduction on the cost of evolving technologies, especially PV and Battery, the choice shifts towards PV–Wind–Hydro–Battery instead of PV–Wind–Hydro–Dsl–Battery having the least initial capital, total NPC and levelized
COE. It shows that cost of PV decrement in a range from 12%–30% from the current capital cost of PV while cost of battery decrement up to 30% from the current capital cost of the battery results in a pure 100% renewable generation (PV–Wind–Hydro–Battery) with less levelized
COE to users from 0.0785 $/kWh to 0.0871 $/kWh. Battery and converter kept constant, varying Wind and PV costs results change in generation mix and decrement on the cost of electricity (
Figure 11).
Whereas changing cost of Battery and Wind while keeping constant PV and converter cost results no change on the choice of the generation mix, however, results in a reduction of the levelized COE. Similarly, varying the cost of Wind and Converter while keeping constant the current capital cost for PV and battery results no change on the choice of the generation mix. However, it results in a reduction of the levelized COE. In addition, the same occurs when changing battery and converter, while keeping cost of PV and Wind unaltered.
5.2. Resource Variability
This sensitivity is done to analyze the effect of variability of resources on the total NPC of generation mix and levelized
COE.
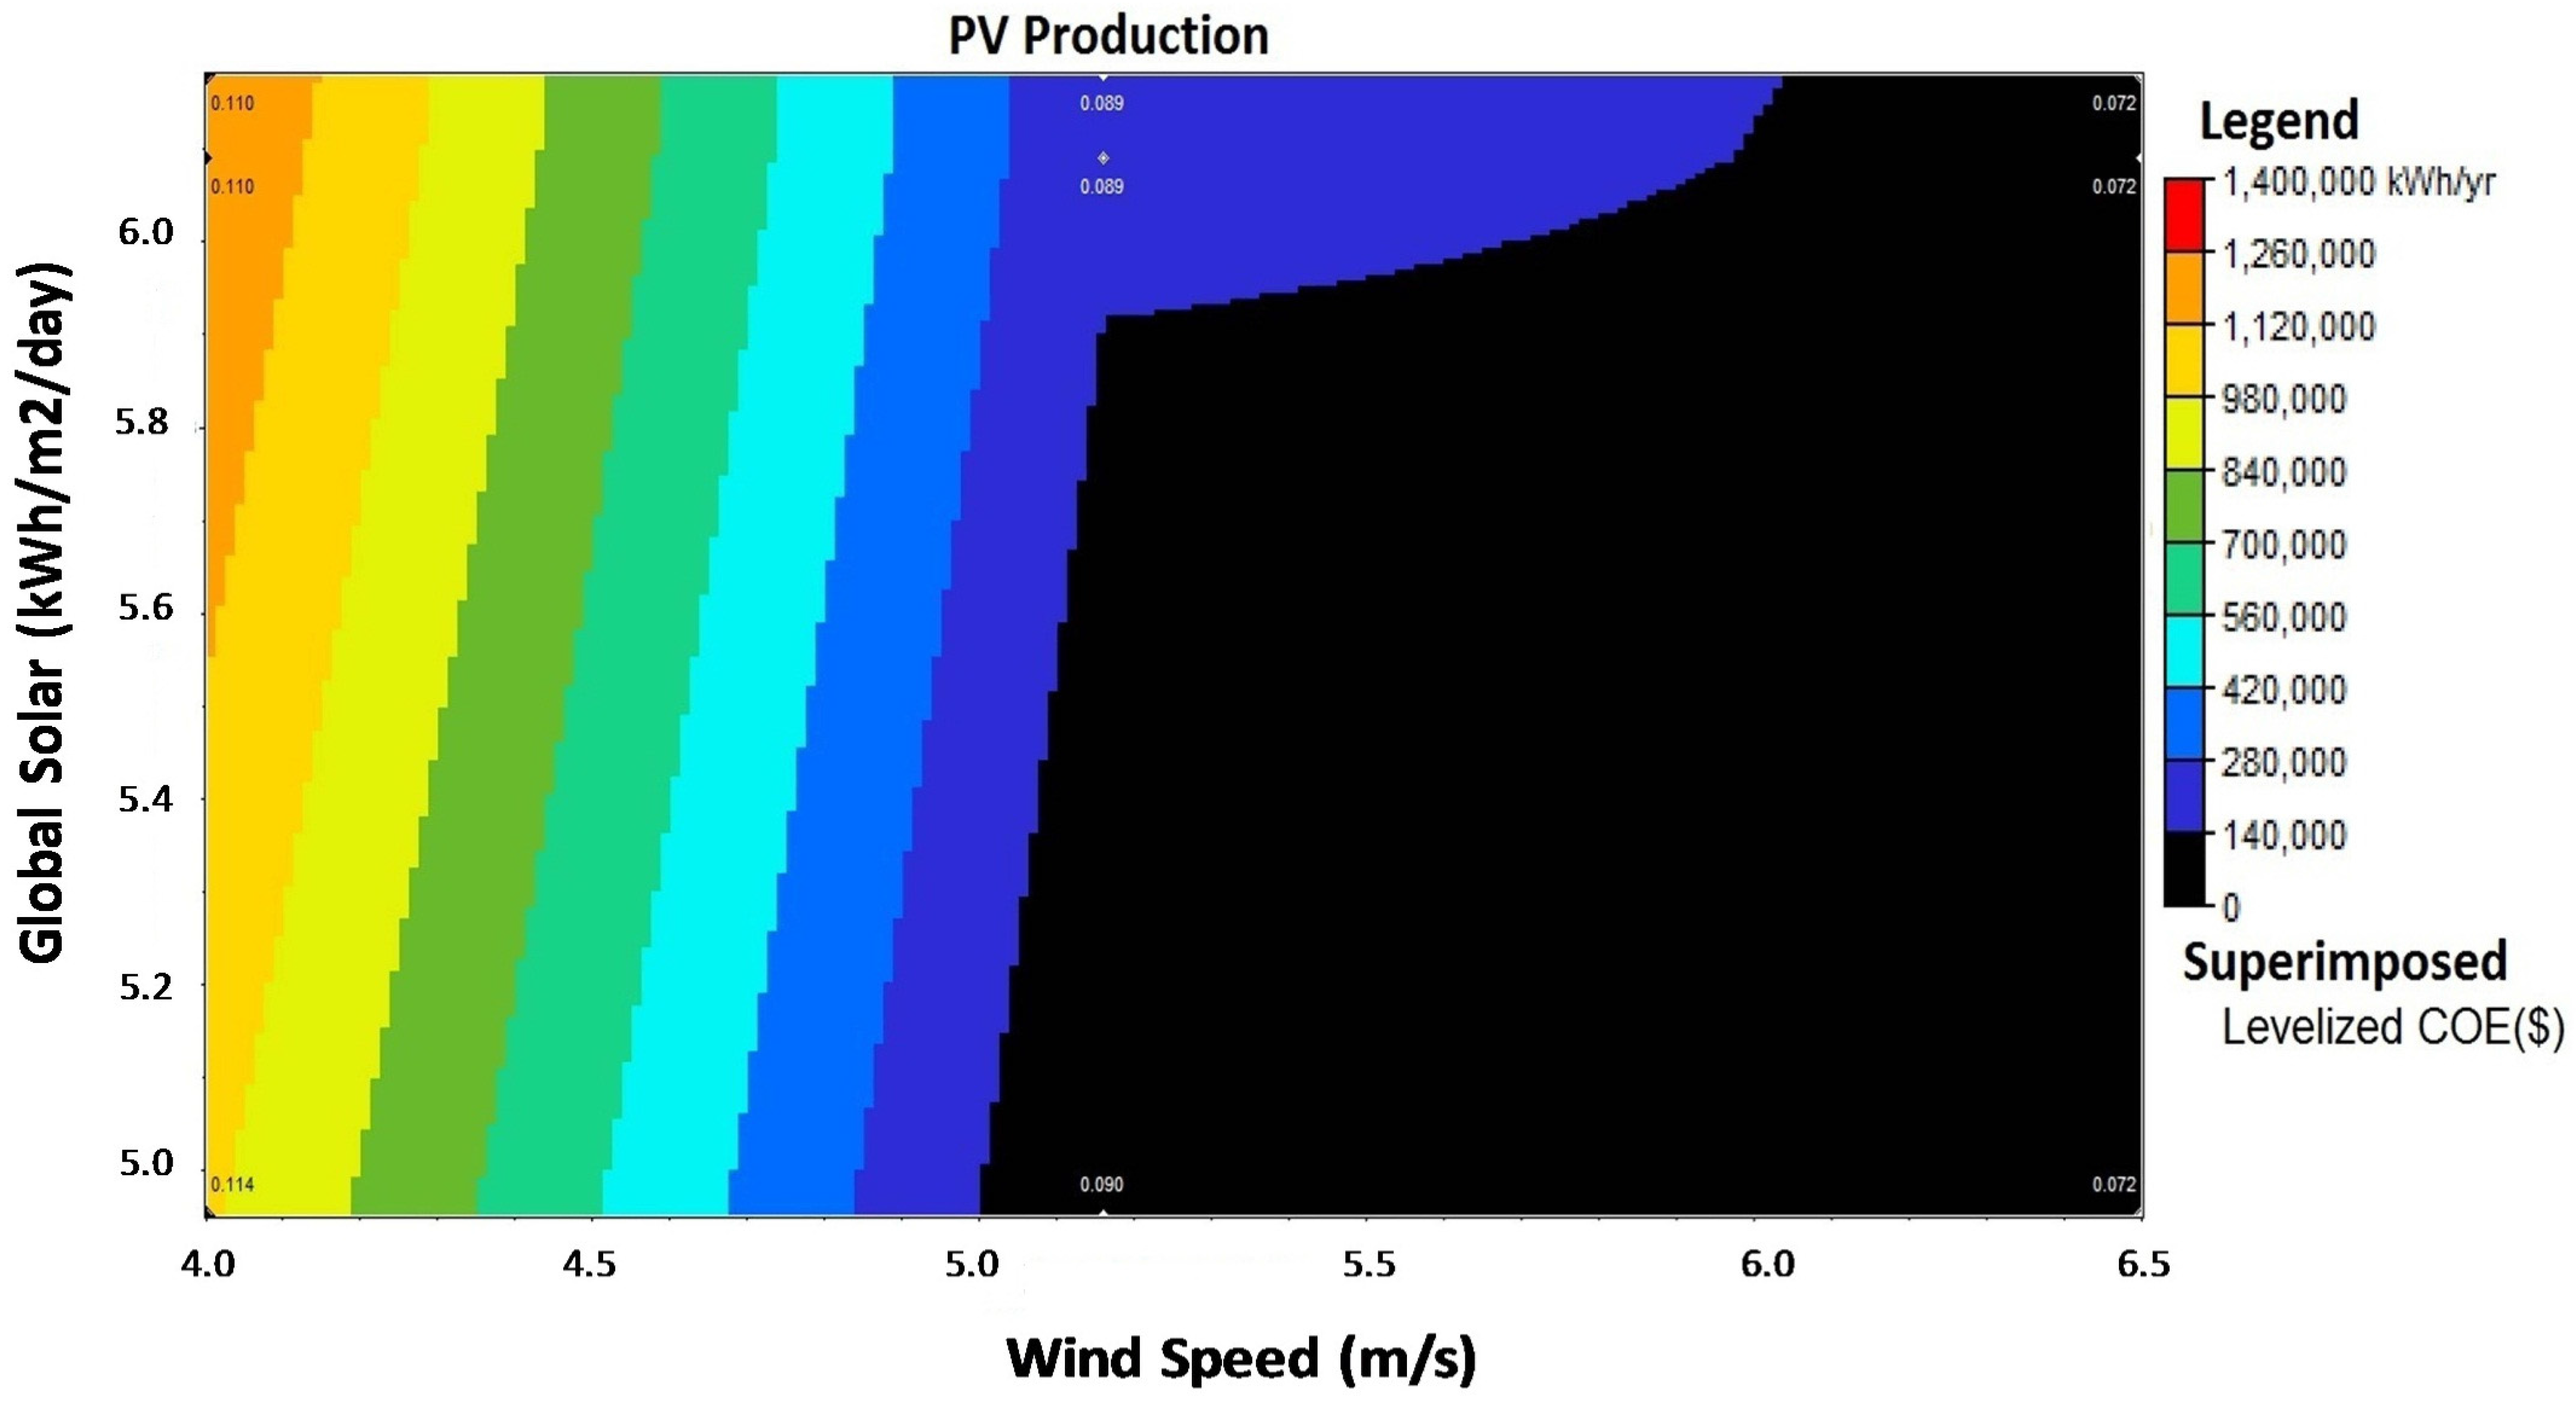
Figure 12 shows the variations on the cost due to the variability of resources (wind speed and solar radiation).
A successful design and deployment of renewable energy system is realized with site-specific time series renewable resources information along with associated weather data and installation of these systems close to the load that they are designed to serve. Considering two other rural locations in Ethiopia (Debre Markos and Kebri Dehar) with minimum and maximum solar irradiation from 6.09 kWh/m2/day to 6.18 kWh/m2/day and wind speed kept as is, with the increment of solar resource shows no change on the levelized COE, and, similarly, the decrement from the current measured solar resource 6.08 kWh/m2/day to 4.95 kWh/m2/day results very negligible reduction on the cost of electricity.
Whereas, without changing global solar irradiation but increasing and decreasing the wind resource to 6.5 m/s and 4 m/s, respectively, points out dramatic decrement on the Initial capital cost and a change of levelized COE from $0.089/kWh to $0.072/kWh and $0.110/kWh, respectively. This is due to the system architecture in which electricity generation is carried out largely using wind turbines (52%) not solar panels (3%). Had it been largely carried out with solar panels, it would result the same conclusion that the levelized COE dependency with variation on solar radiation on that particular area will be high. Hence, for rural areas where there is abundant RE resources, the correlation with the levelized COE is direct relation and the system architecture to be dealt accordingly. Additionally, considering both high wind resource and high solar radiation, the levelized cost of electricity drops down to $0.072/kWh. This show that the slight increment on solar radiation results no effect on the levelized COE while it has little effect on both total NPC and Operation cost.
5.3. Constraint Variability
A sensitivity analysis has also been conducted to see the effect of levelized
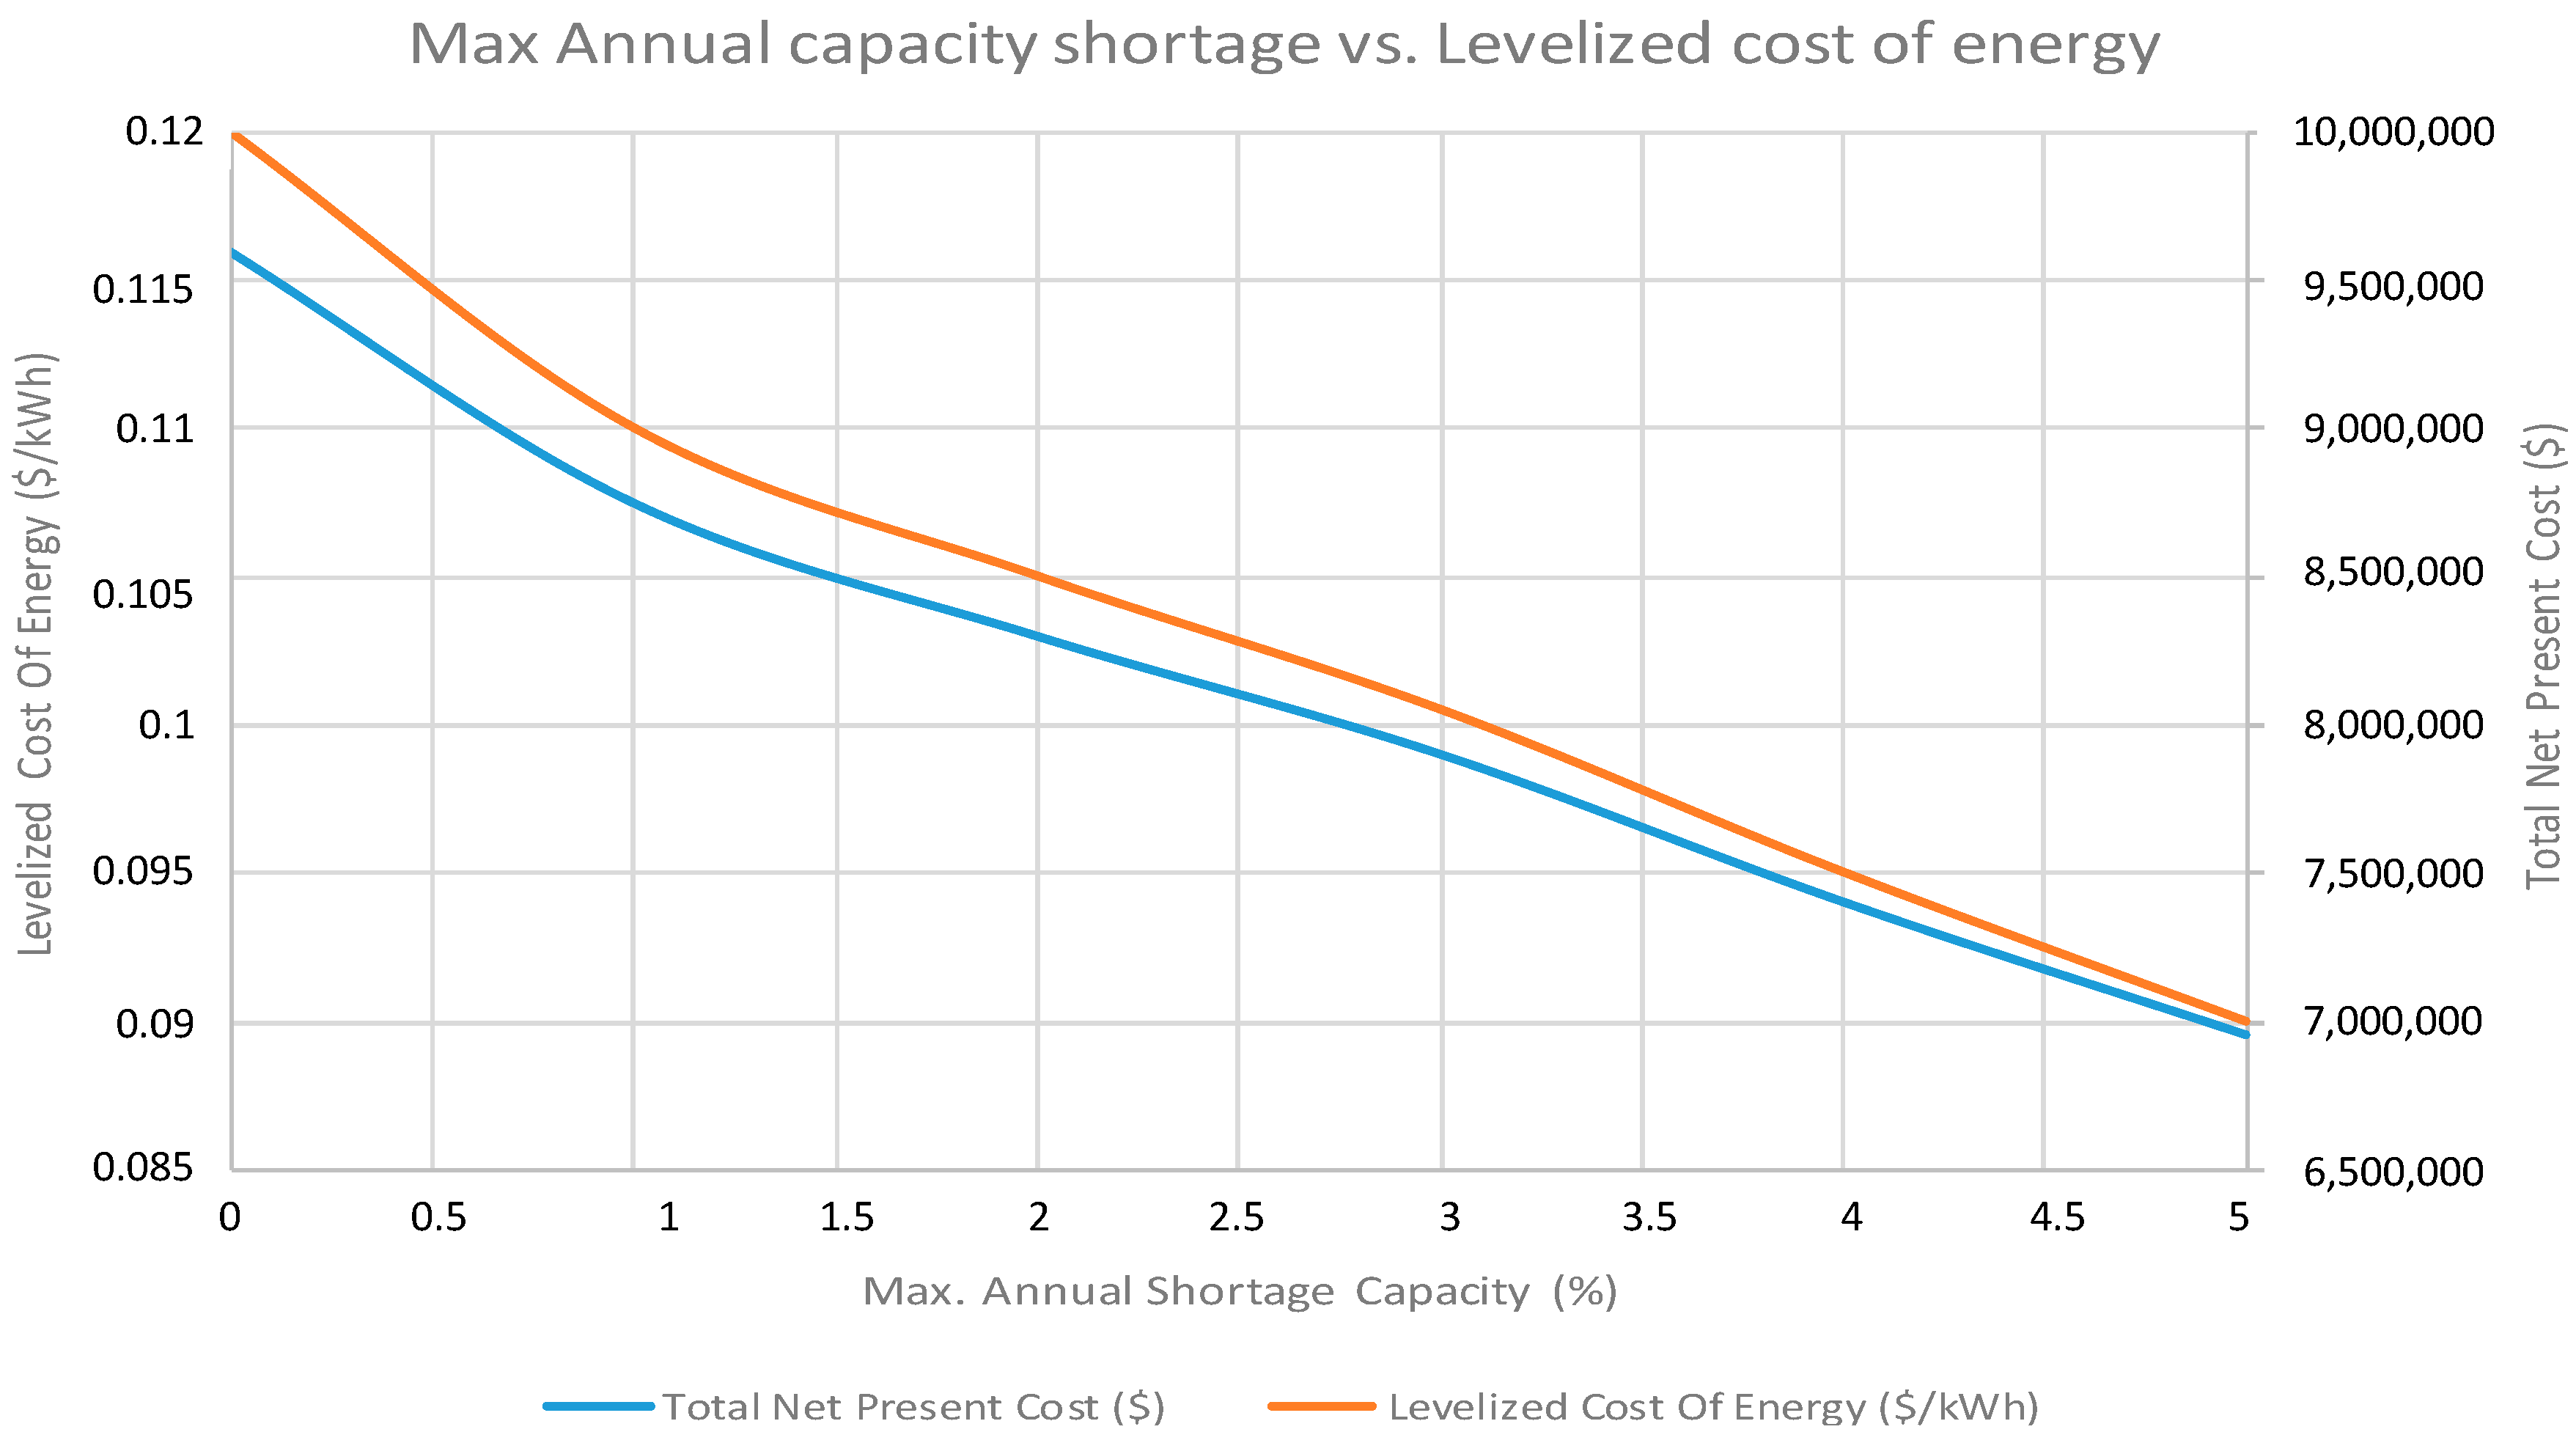
COE ($/kWh) by varying the maximum annual shortage capacity, taking into account the nature of RE and, as we do not have critical loads, starting from 0% (power system meets 100% of the electric load) to 5% (power system meets 95% of the electric load) in 1% increments, which we expect to possibly happen due to operation under challenging conditions, such as fluctuating or extreme temperatures, remote locations or lack of frequent maintenance (
Figure 13).
Considering PV–Wind–Hydro–Dsl–Battery generation mix with maximum annual capacity shortages (%) equal to 0, 1, 2, 3, 4 and 5, the levelized COE without subsidy is $0.120/kWh, $0.110/kWh, $0.105/kWh $0.100/kWh $0.095/kWh and $0.089/kWh, respectively, with an almost linear correlation. Conversely, considering PV–Wind–Hydro–Battery generation mix, the levelized COE without subsidy results $0.184/kWh, $0.135/kWh, $0.106/kWh and $0.09/kWh, respectively. As a result, regardless of the generation mix, it is clear that allowing some capacity shortage changes the result significantly in both cases.
5.4. Hub Head Variability
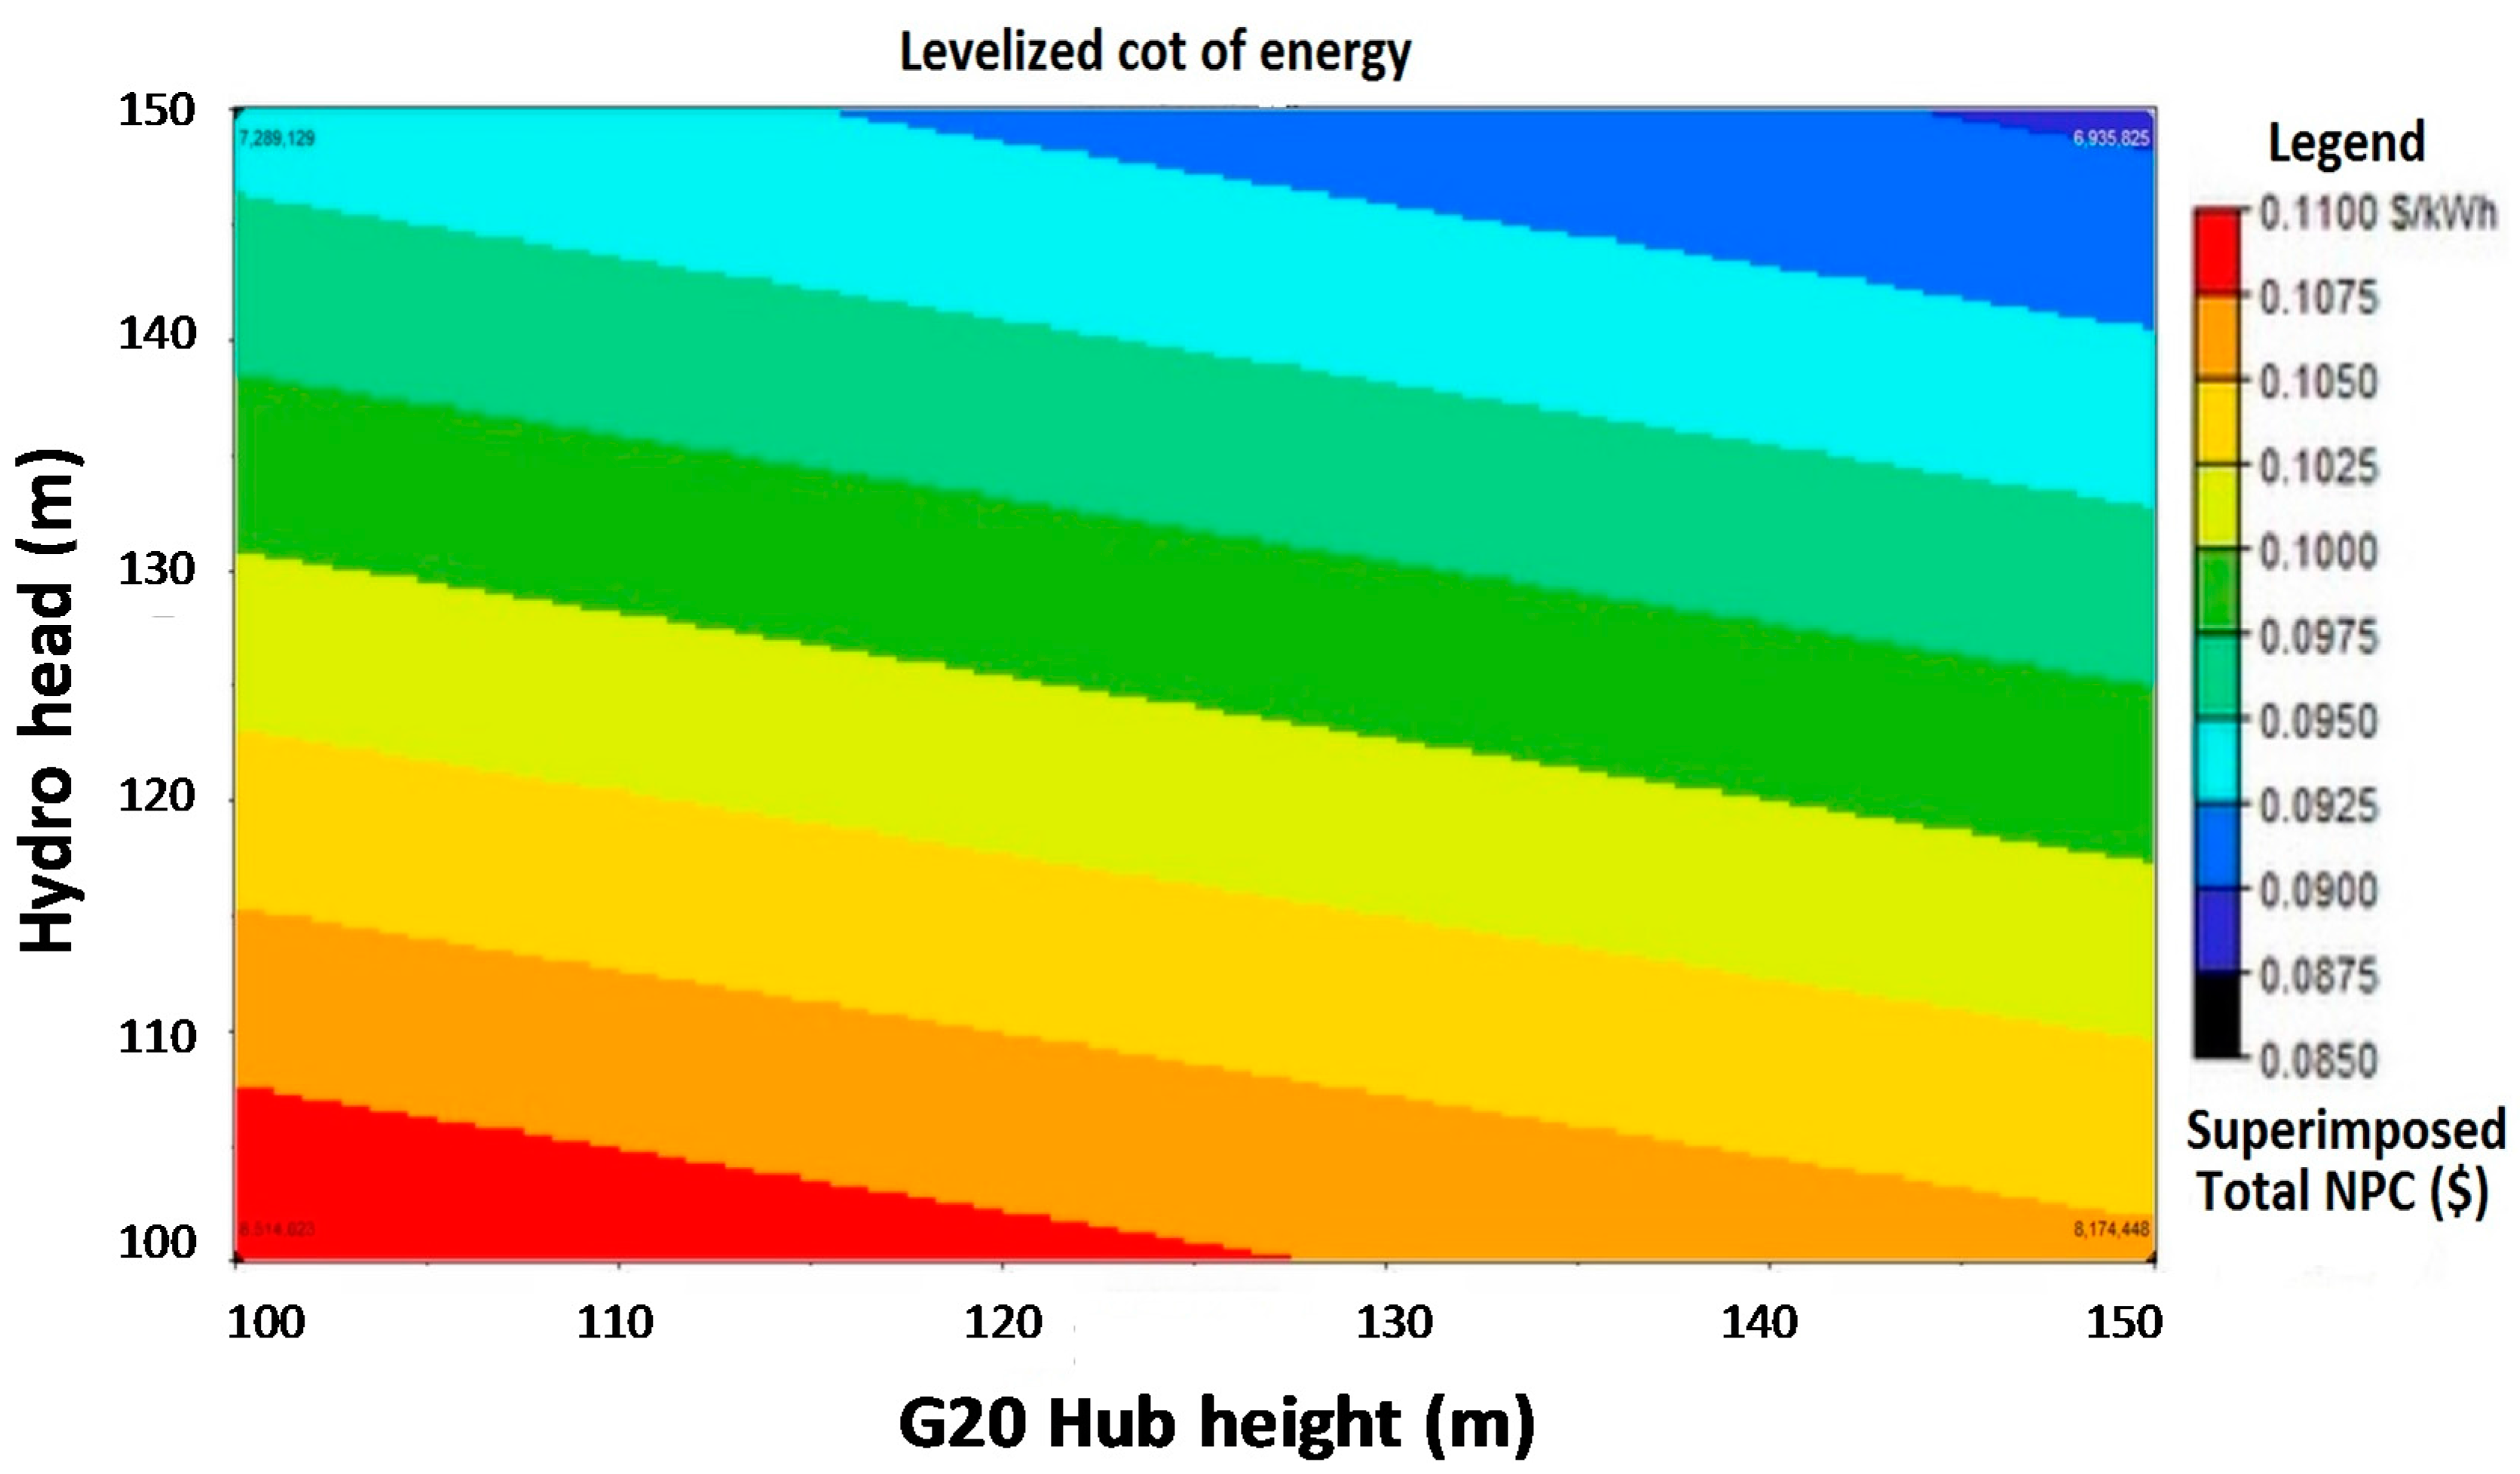
Figure 14 shows the different levelized
COE with superimposed total NPC variations due to the variation of the head of turbine for both Wind and Hydro resources.
Two hub heights are considered for the simulation, 100 m and 150 m, and considering both heights equal to 150 m, the levelized
COE is $0.09/kWh, whereas with both heights equal to 100 m, it is $0.112/ kWh. This shows that as the head for the turbines increases, the generating capacity increases; on the other hand, the cost for electricity production tends to fall accordingly. Looking at
Figure 14, decreasing the height of hydro to 100 m and keeping the wind to 150 m results $0.107/kWh, whereas the opposite results $0.095/kWh. It is, therefore, seen that there is a great reduction on the levelized
COE due to the increment of height of turbine for Hydroelectric than wind turbine and this is due to the available wind speed on that particular area.
6. Sensitivity Analysis
This research has shown that for an un-electrified rural area like Abiy Addi, a stand-alone microgrid is an optimum solution to bring electricity access to rural areas. The best possibilities found out in this research are the PV–Wind–Hydro–Dsl–Battery and PV–Wind–Hydro–Battery microgrid for Abiy Addi where the multiple renewable energy sources system generates the energy production. The system balance among wind, Hydro and solar is determined as in a conventional system, adjusting the costs of each to match the available energy. When wind, hydro or solar energy is available, the fuelled generator will shut down, saving its fuel cost; each of these sources offsets the need for diesel consumption, and yet including some diesel capacity improves the availability and reliability of power.
Due to the current environmental protection (benefit of both the natural environment and humans) and requirements, even if the generation mix of PV–Wind–Hydro–Battery current levelized COE is slightly higher than the generation mix with diesel generator as a back-up system, it is recommended to use the all the generation mix with 100% renewables. Besides, the O & M cost of diesel generator is expected to increase not decrease and is higher in comparison with the generation mix without diesel generation.
Thus, the optimal generation mixture with PV–Wind–Hydro–Battery storage systems configuration significantly addresses the problem in attaining electricity having the least operating cost of $128,817/year and 100% renewable penetration of resources. Though, with slightly higher cost of electricity (COE) of $0.09/kWh, total Net Present Capital (NPC) of $7,011,074 and initial capital of $5,210,000.
Remarkably, the study has also found that the microgrid generation mixture with hydrogen fuelled cell as storage systems configuration alone is infeasible or omitted condition for attainment of electricity, particularly to rural areas since it requires high demand of electricity for hydrogen production in a more efficient way. This is due to the round-trip efficiency of the hydrogen storage, which is typically less than 60%. As a result, for the simulation to provide an outcome, we need to increase the MASCC, consider large sources, or add larger battery storage. However, the use of additional battery storage together with the compressed hydrogen gas as storage for functionality without increasing the MASCC is recommended.
The cost of energy to the consumers for the lowest NPC is $0.09/kWh compared to the cost of $0.07/kWh if the area is to be connected to the grid. This difference of $0.02/kWh COE would yield a comparative long-term advantage for providers only if the rural areas to be electrified is within 48.3 km from the grid or nearby substations, but Abiy Addi is located 100 km from the nearest substation so the use of grid extension is not worthwhile. Besides, even if we want to extend the grid, we cannot due to limited generation capacity of the country, which cannot cover all areas. The extension of the existing electrical grid to rural areas is not always the best option considering the estimated capital cost of grid extension of about $25,000 per km, which can be higher for a difficult landscape like Abiy Addi rural area. With the implementation of this microgrid, transmission losses associated with grid extension would also be eliminated. In addition, its 100% renewable penetration means 0 kg/person CO2 emission compared to the general average of 3.46 kg/person CO2 emission in Ethiopia (metric tons per capita). Hence, the use of this RES microgrid would be a more cost effective option having less environmental impact.
Besides, despite the slightly higher COE ($/kWh) in comparison with the current national tariff of electricity in Ethiopia, access to basic energy services such as cooking is crucial for survival, while lighting and other services underpin health, education and services. Furthermore, the lack of modern electricity impacts peoples’ lives, primarily in poor healthcare, stifled economic growth, toxic fumes, limited or no education and lack of safety. Henceforth, this could be upended with subsidy from the government of Ethiopia to be in line with its major goal of the Growth and Transformation Plan (GTP) aiming to make Ethiopia climate resilient and have zero carbon growth by 2025, give special attention and put in place a lot of favorable conditions and good working environment for developers to participate in the energy sector, or support the project with donor finance for low-carbon and climate-resilient.
7. Conclusions
The main objective of this work is to help in reducing the high costs of electrification, low-cost methods and techniques in electricity networks that have not yet become widely used in sub-Saharan Africa, particularly in Ethiopia. A series of case studies with multiple configurations has been analyzed and conducted in Abiy Addi, Ethiopia, with the help of the Micropower optimization modeling simulator called HOMER, which lists the practical system configurations from the most cost-effective (least NPC) to the least cost-effective (highest NPC).
It has also been found that using different generation mixes is favorable and advantageous compared to using a single source like PV–Battery and/or Wind–Battery systems. Overall, the microgrid with the use of multiple renewable energy sources mixture offers:
more reliable power than any one source alone through energy diversity;
provide community sense of security, community building and information access;
use smaller storage systems while ensuring 24-h power;
29%–50% reduction in the initial capital cost of the system.
Therefore, the implementation of on-site microgrids for rural electrification plays an important role for the majority of the unelectrified communities by meeting the energy consumption demand services and hence can reduce the main impediments to socio economic development such as poverty, illiteracy, poor healthcare, and lack of safety and modern education. In addition, as most of the rural communities in Ethiopia are not electrified due to lack of generating capacity, the use of off-grid hybrid renewable resources as a solution is a best choice, both in attaining clean energy production and access to sustainable and reliable electricity for the underserved communities who live below the poverty line.
Nevertheless, due to the accelerating deployment, technology advancement, continuing improvement in the competitiveness of renewable power generation technologies, and mass production of batteries, the levelized COE as well the total NPC are expected to decline. For instance, considering the PV–Battery generation mix, by 2025 it will offer lower levelized COE compared to 2015 with an average cost decline of $0.076/kWh. However, continued improvement in the competitiveness of renewables will also be required even if the market barriers unrelated to price, which hinder the accelerated deployment of renewable power generation technologies, are removed, given the lack of a level playing field for renewables.


