
Modeling Acequia Irrigation Systems Using System Dynamics: Model Development, Evaluation, and Sensitivity Analyses to Investigate Effects of Socio-Economic and Biophysical Feedbacks

 ,
, 
 ,
,
Abstract
:1. Introduction
2. Experimental Methods
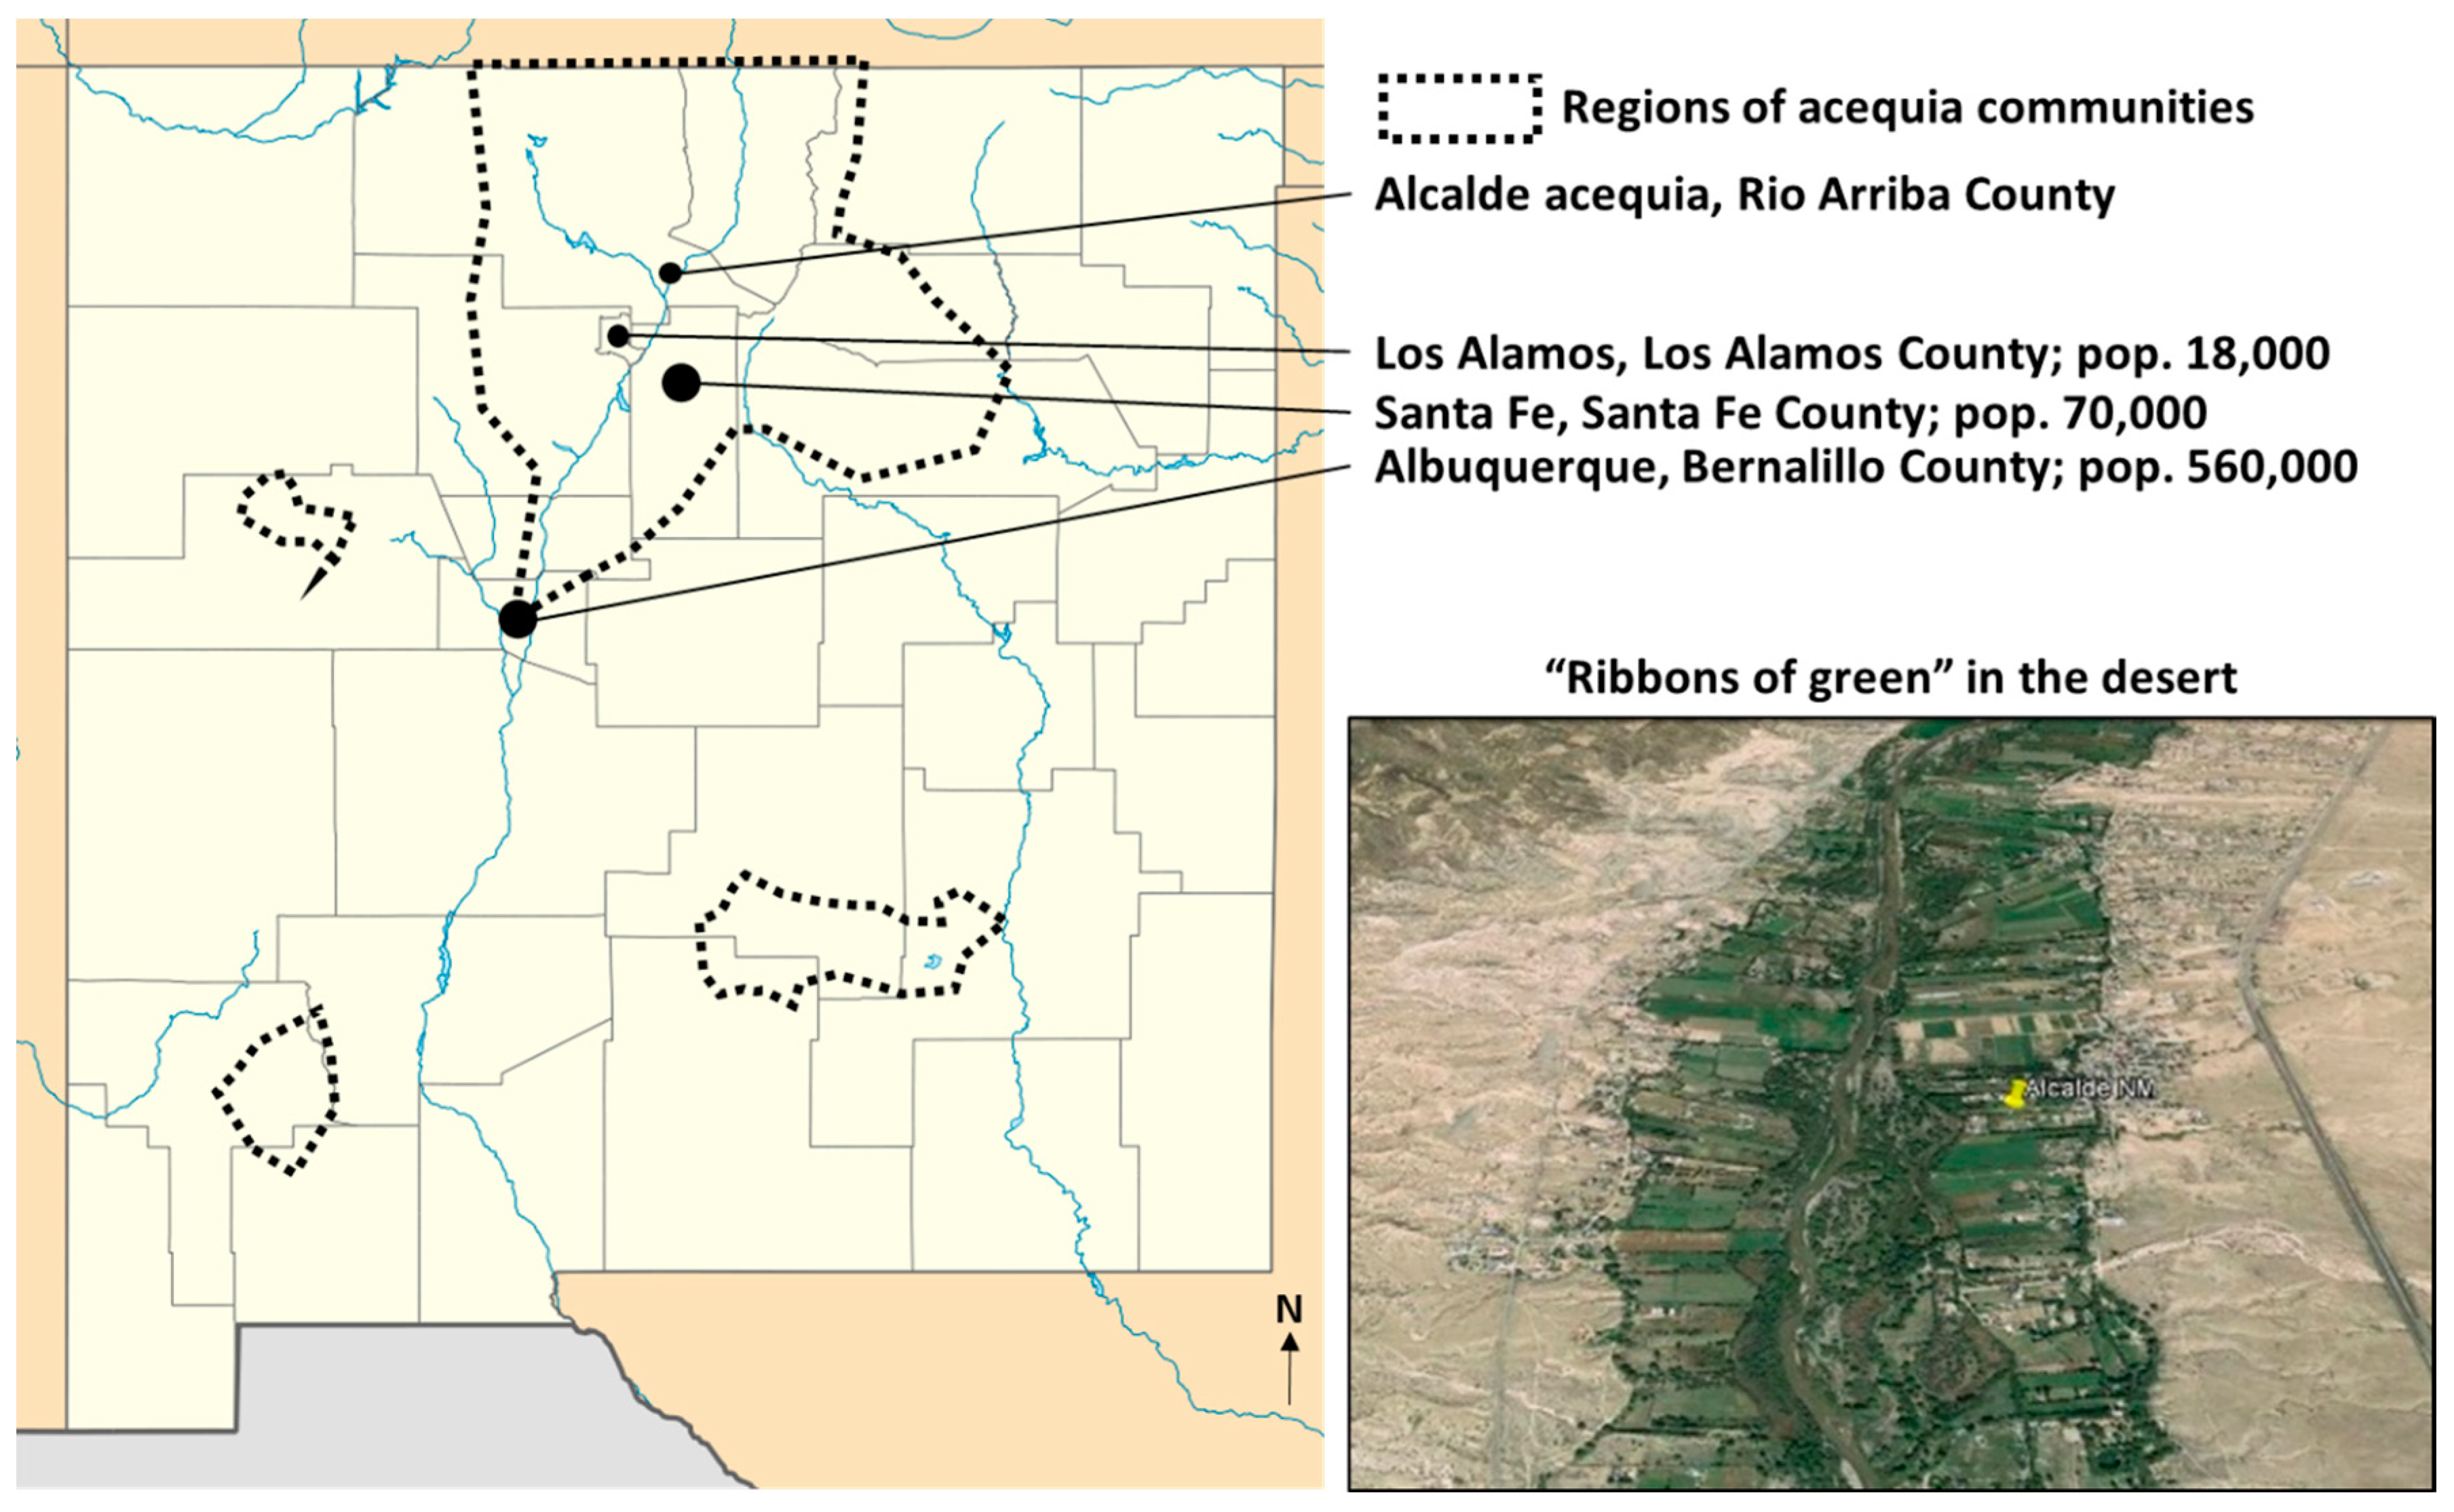
2.1. Test Site
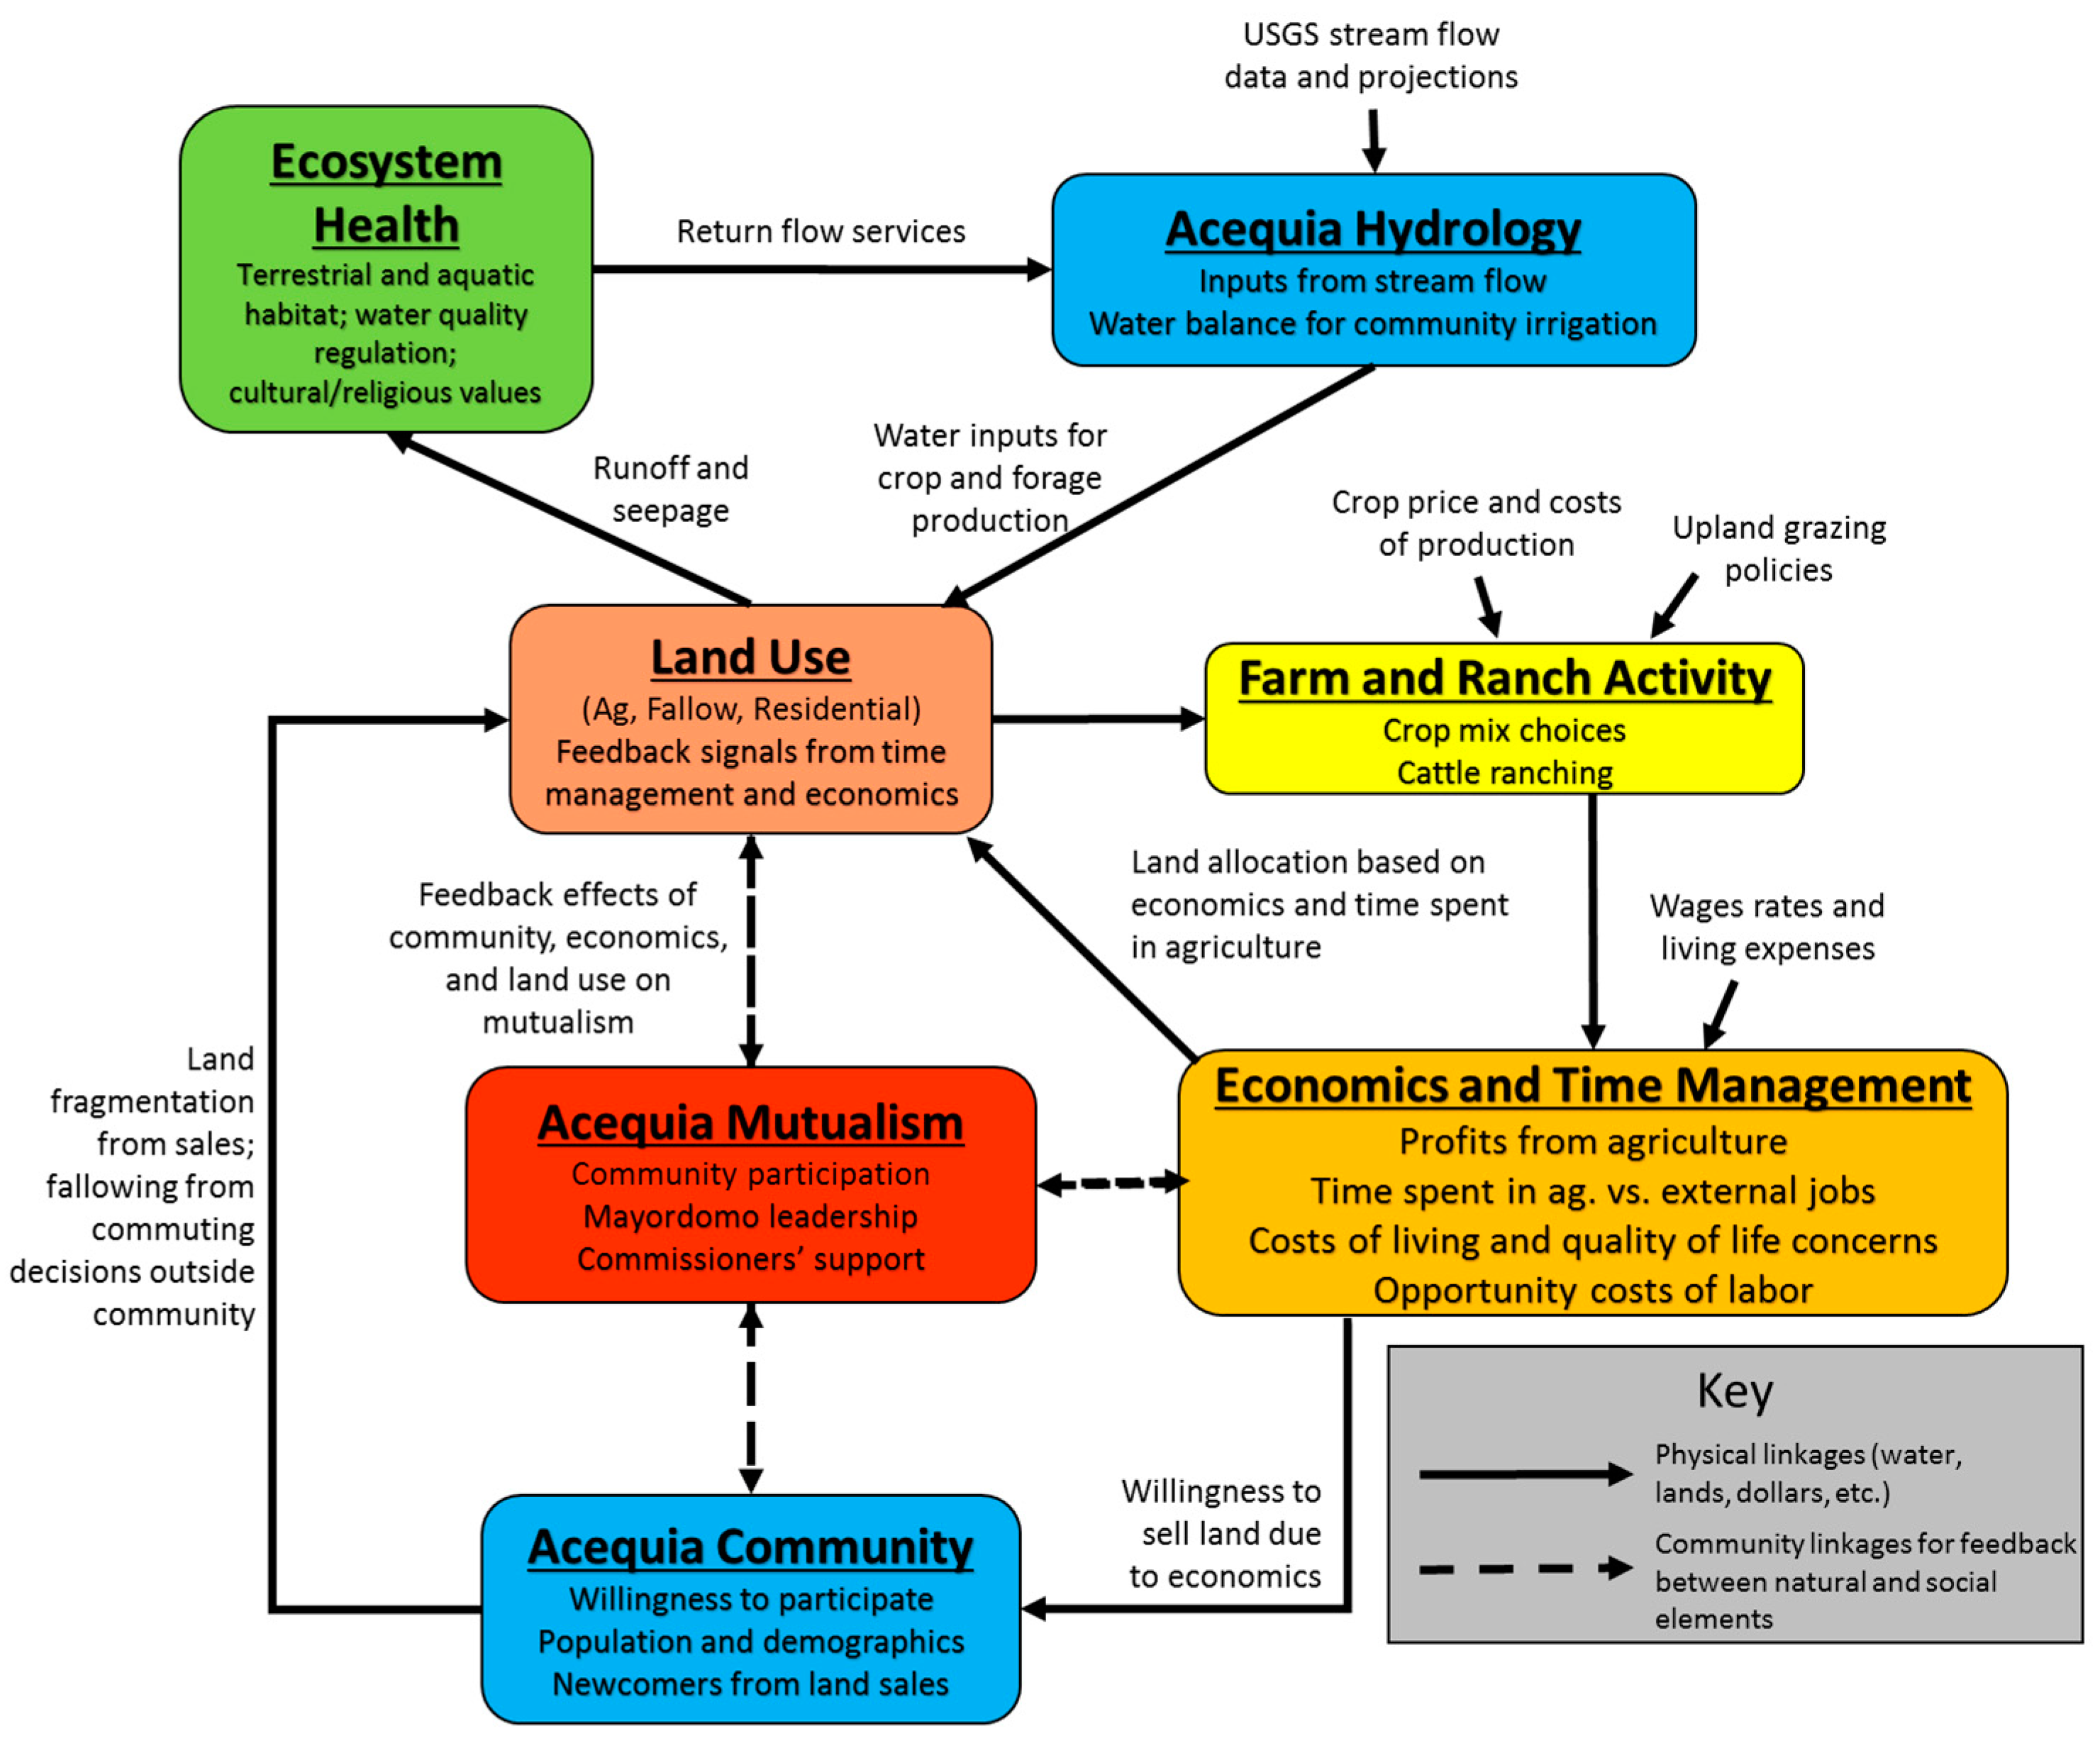
2.2. Dynamic Hypothesis
2.3. SD Model Overview
2.4. Stock-and-Flow Structures for System Building Blocks
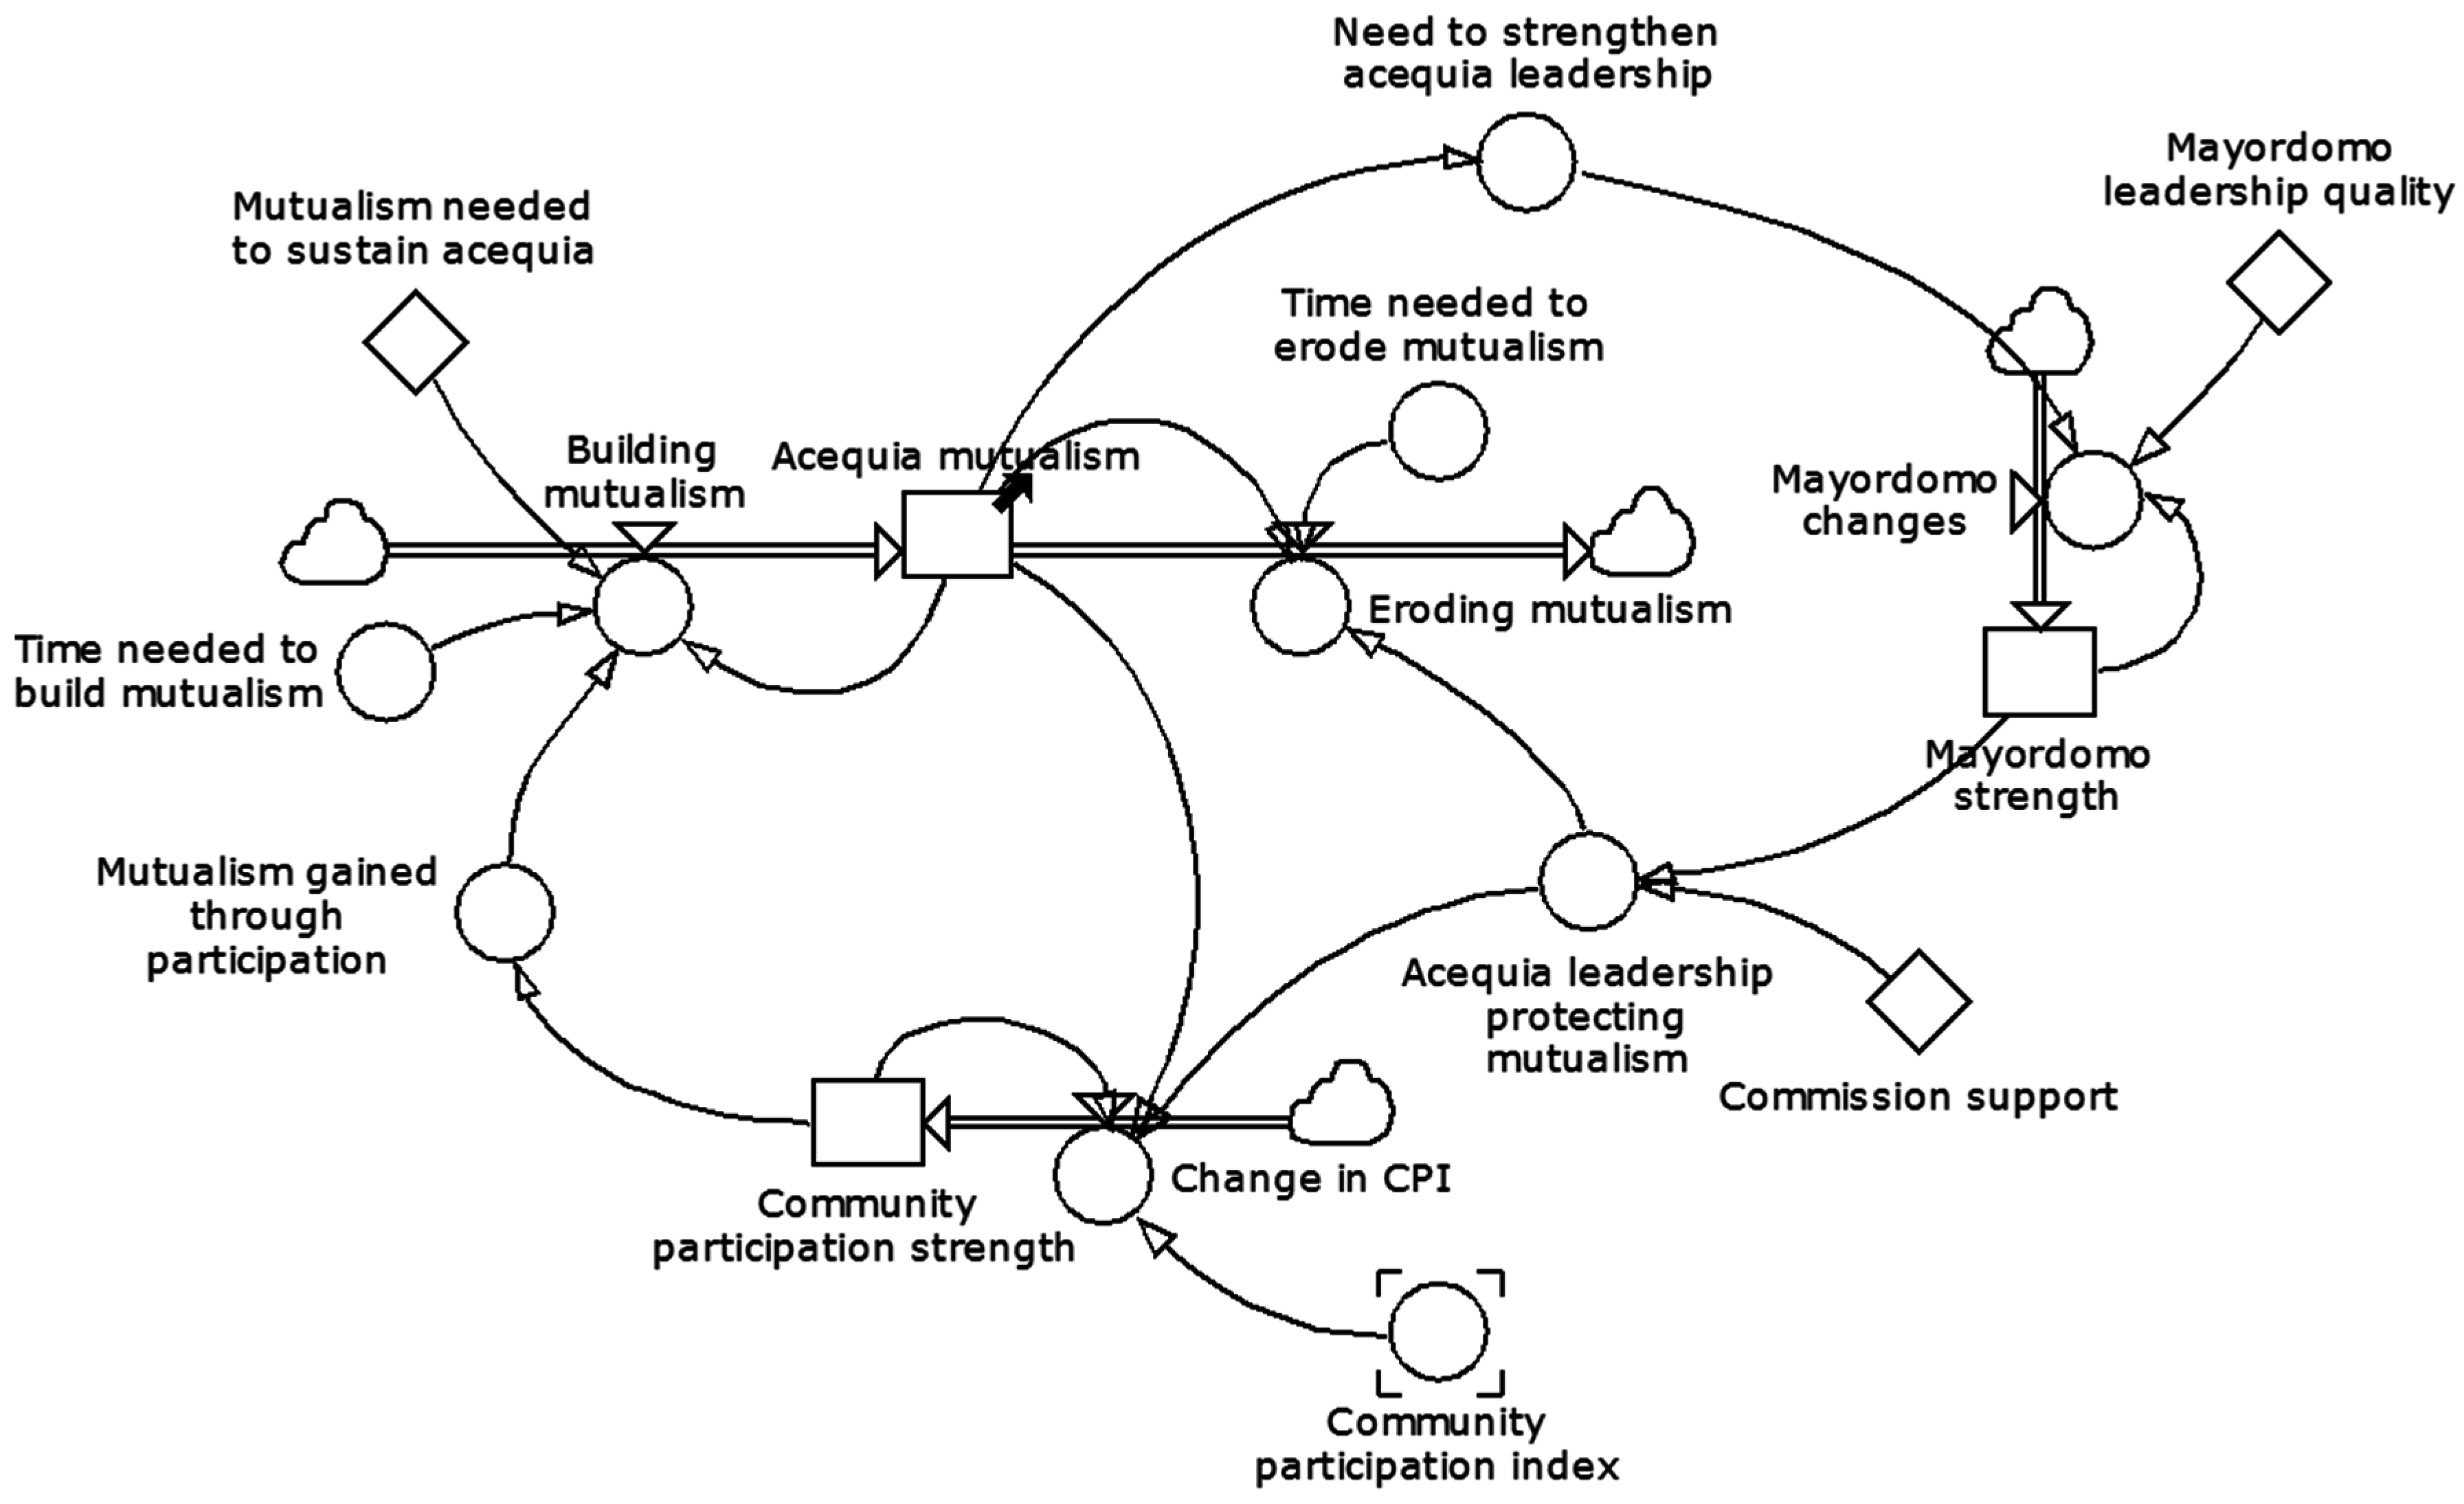
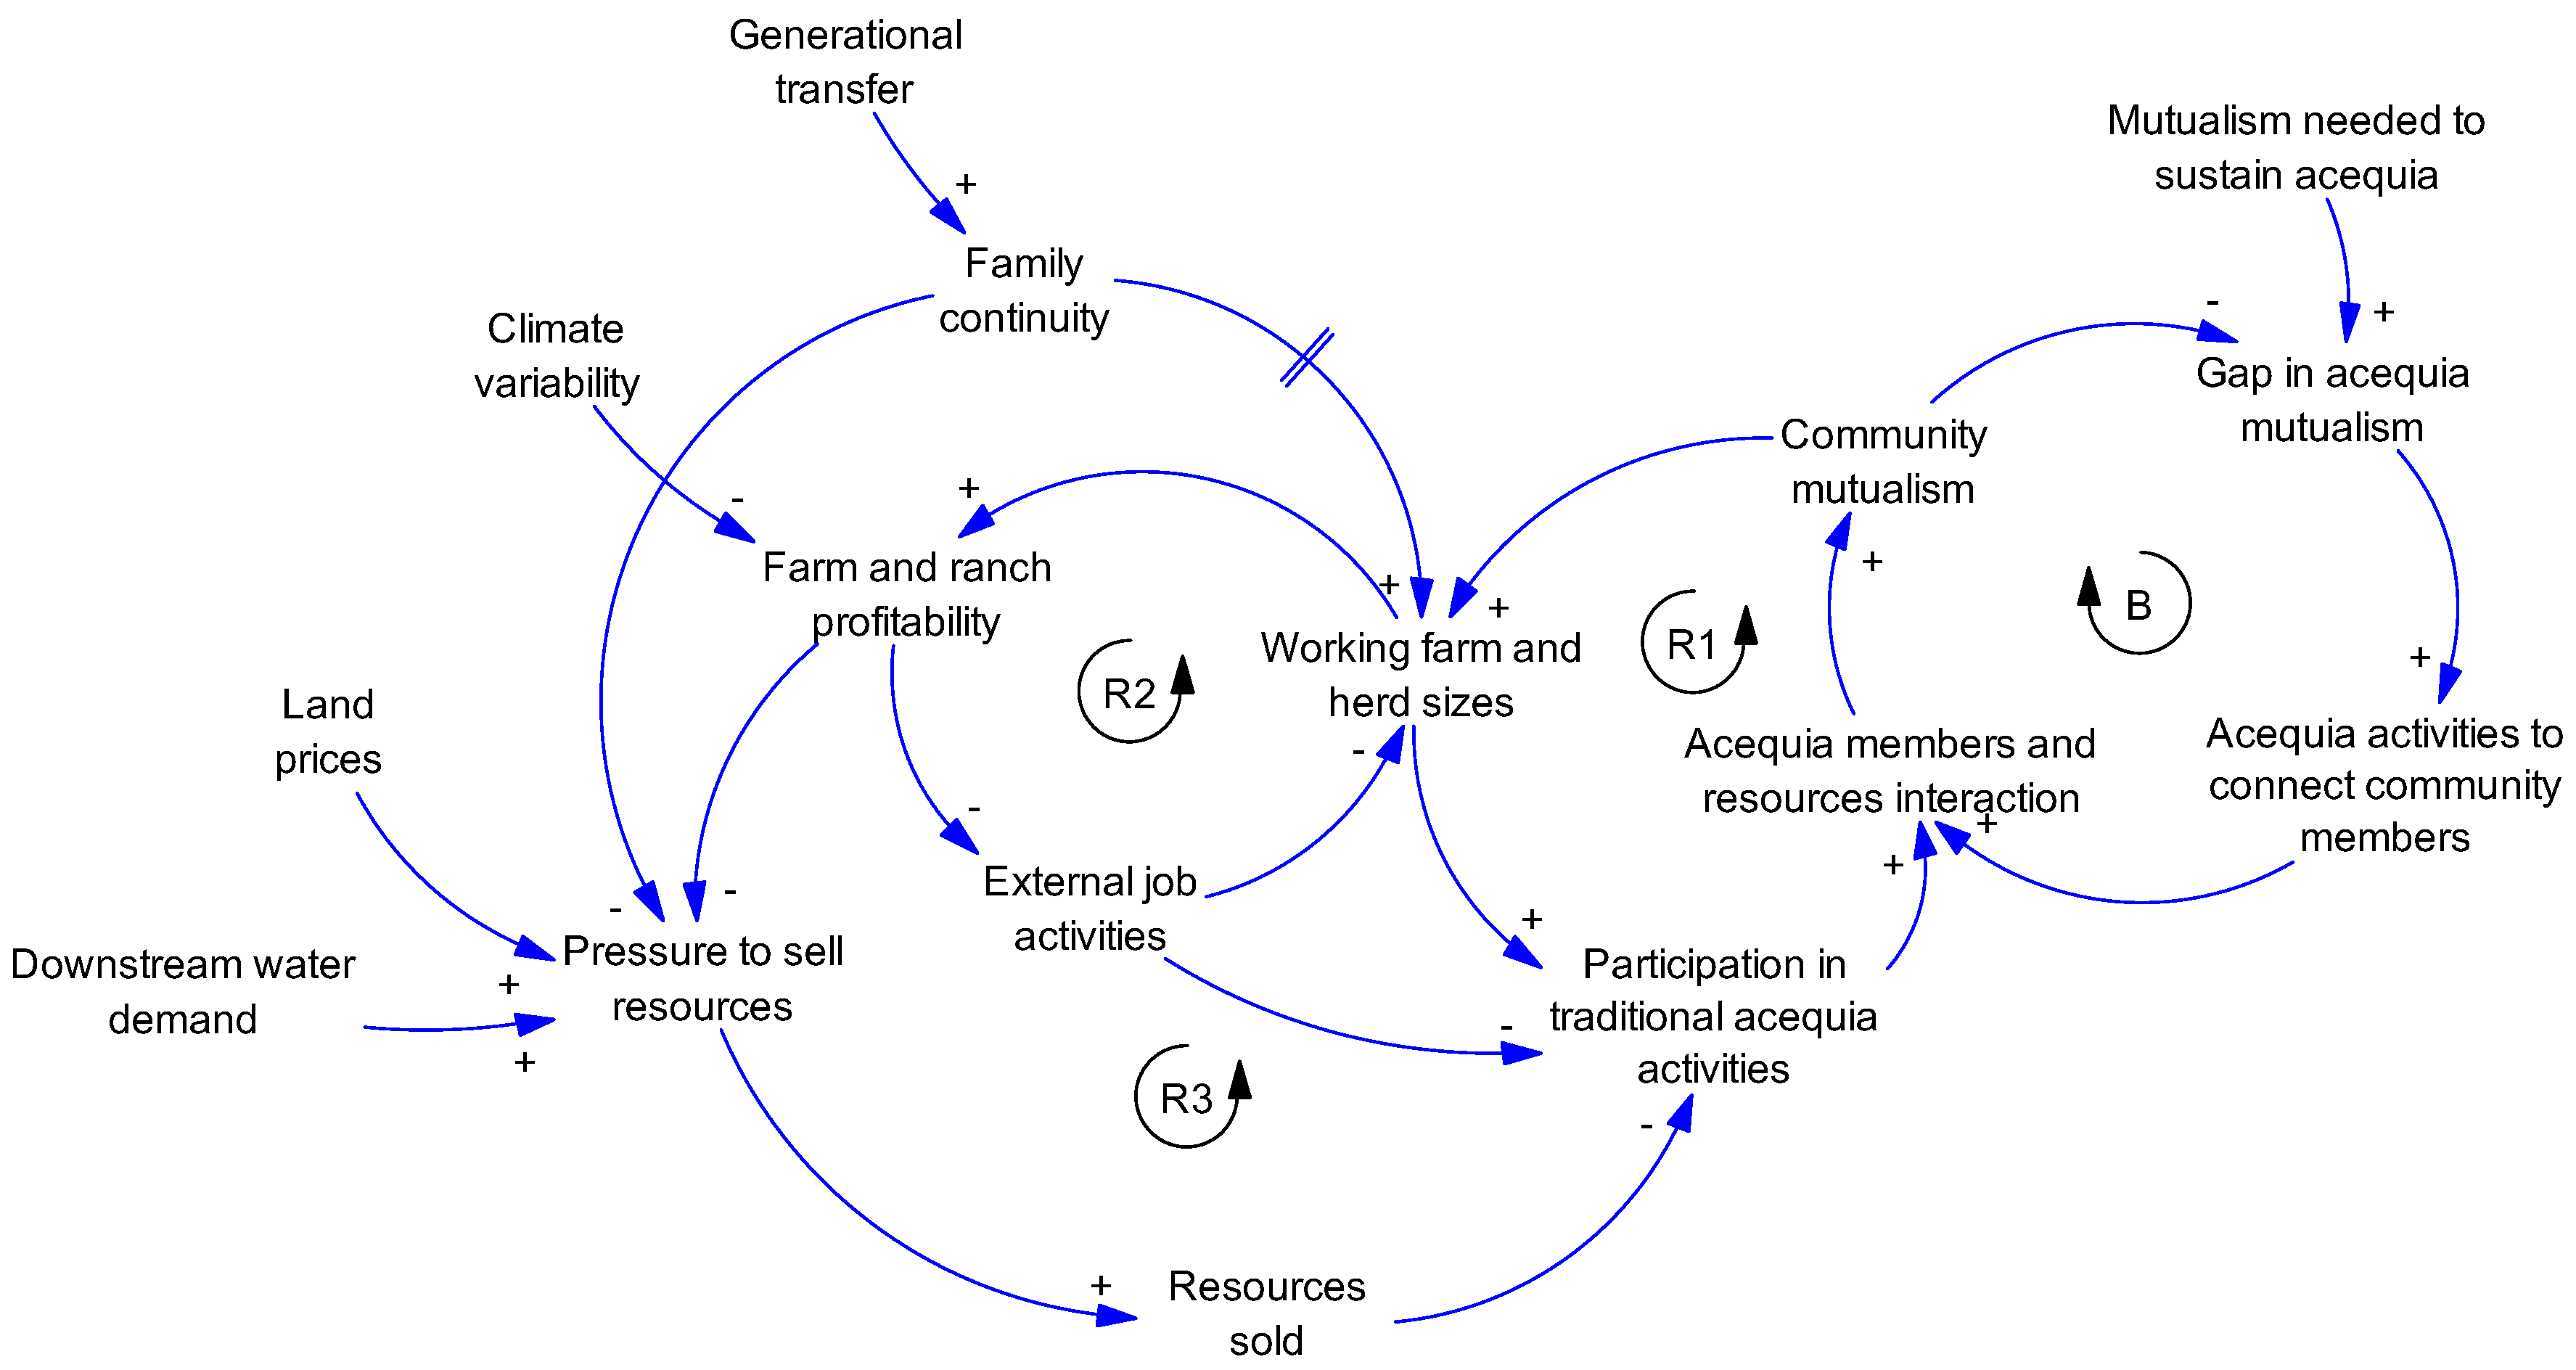
2.4.1. Acequia Mutualism
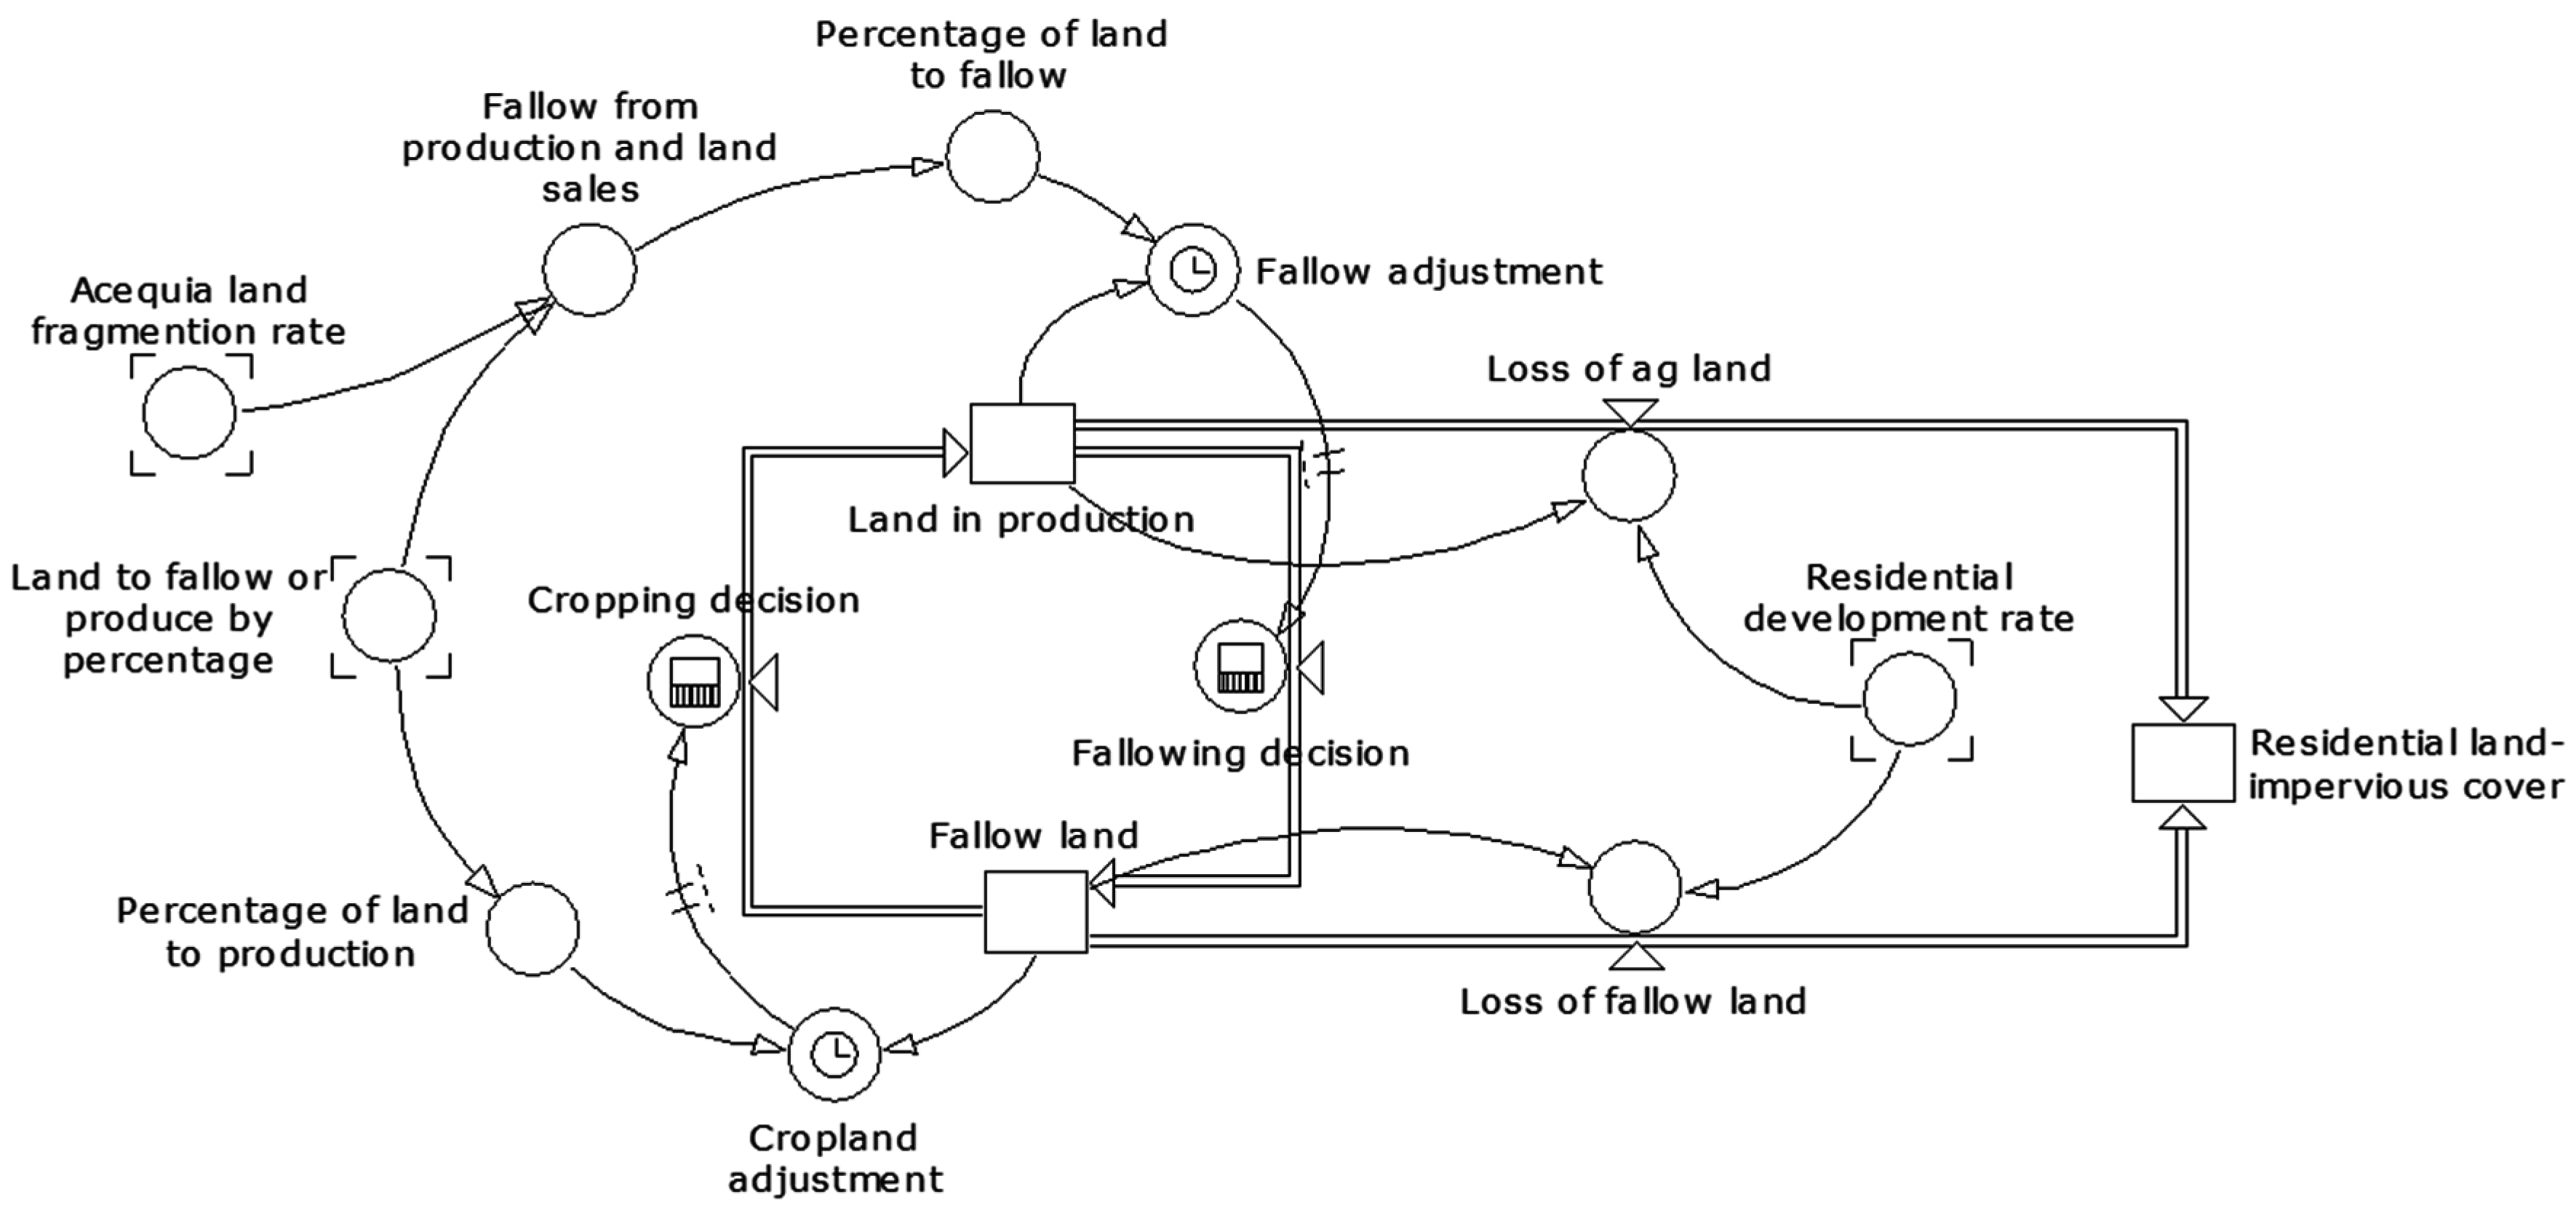
2.4.2. Land Use
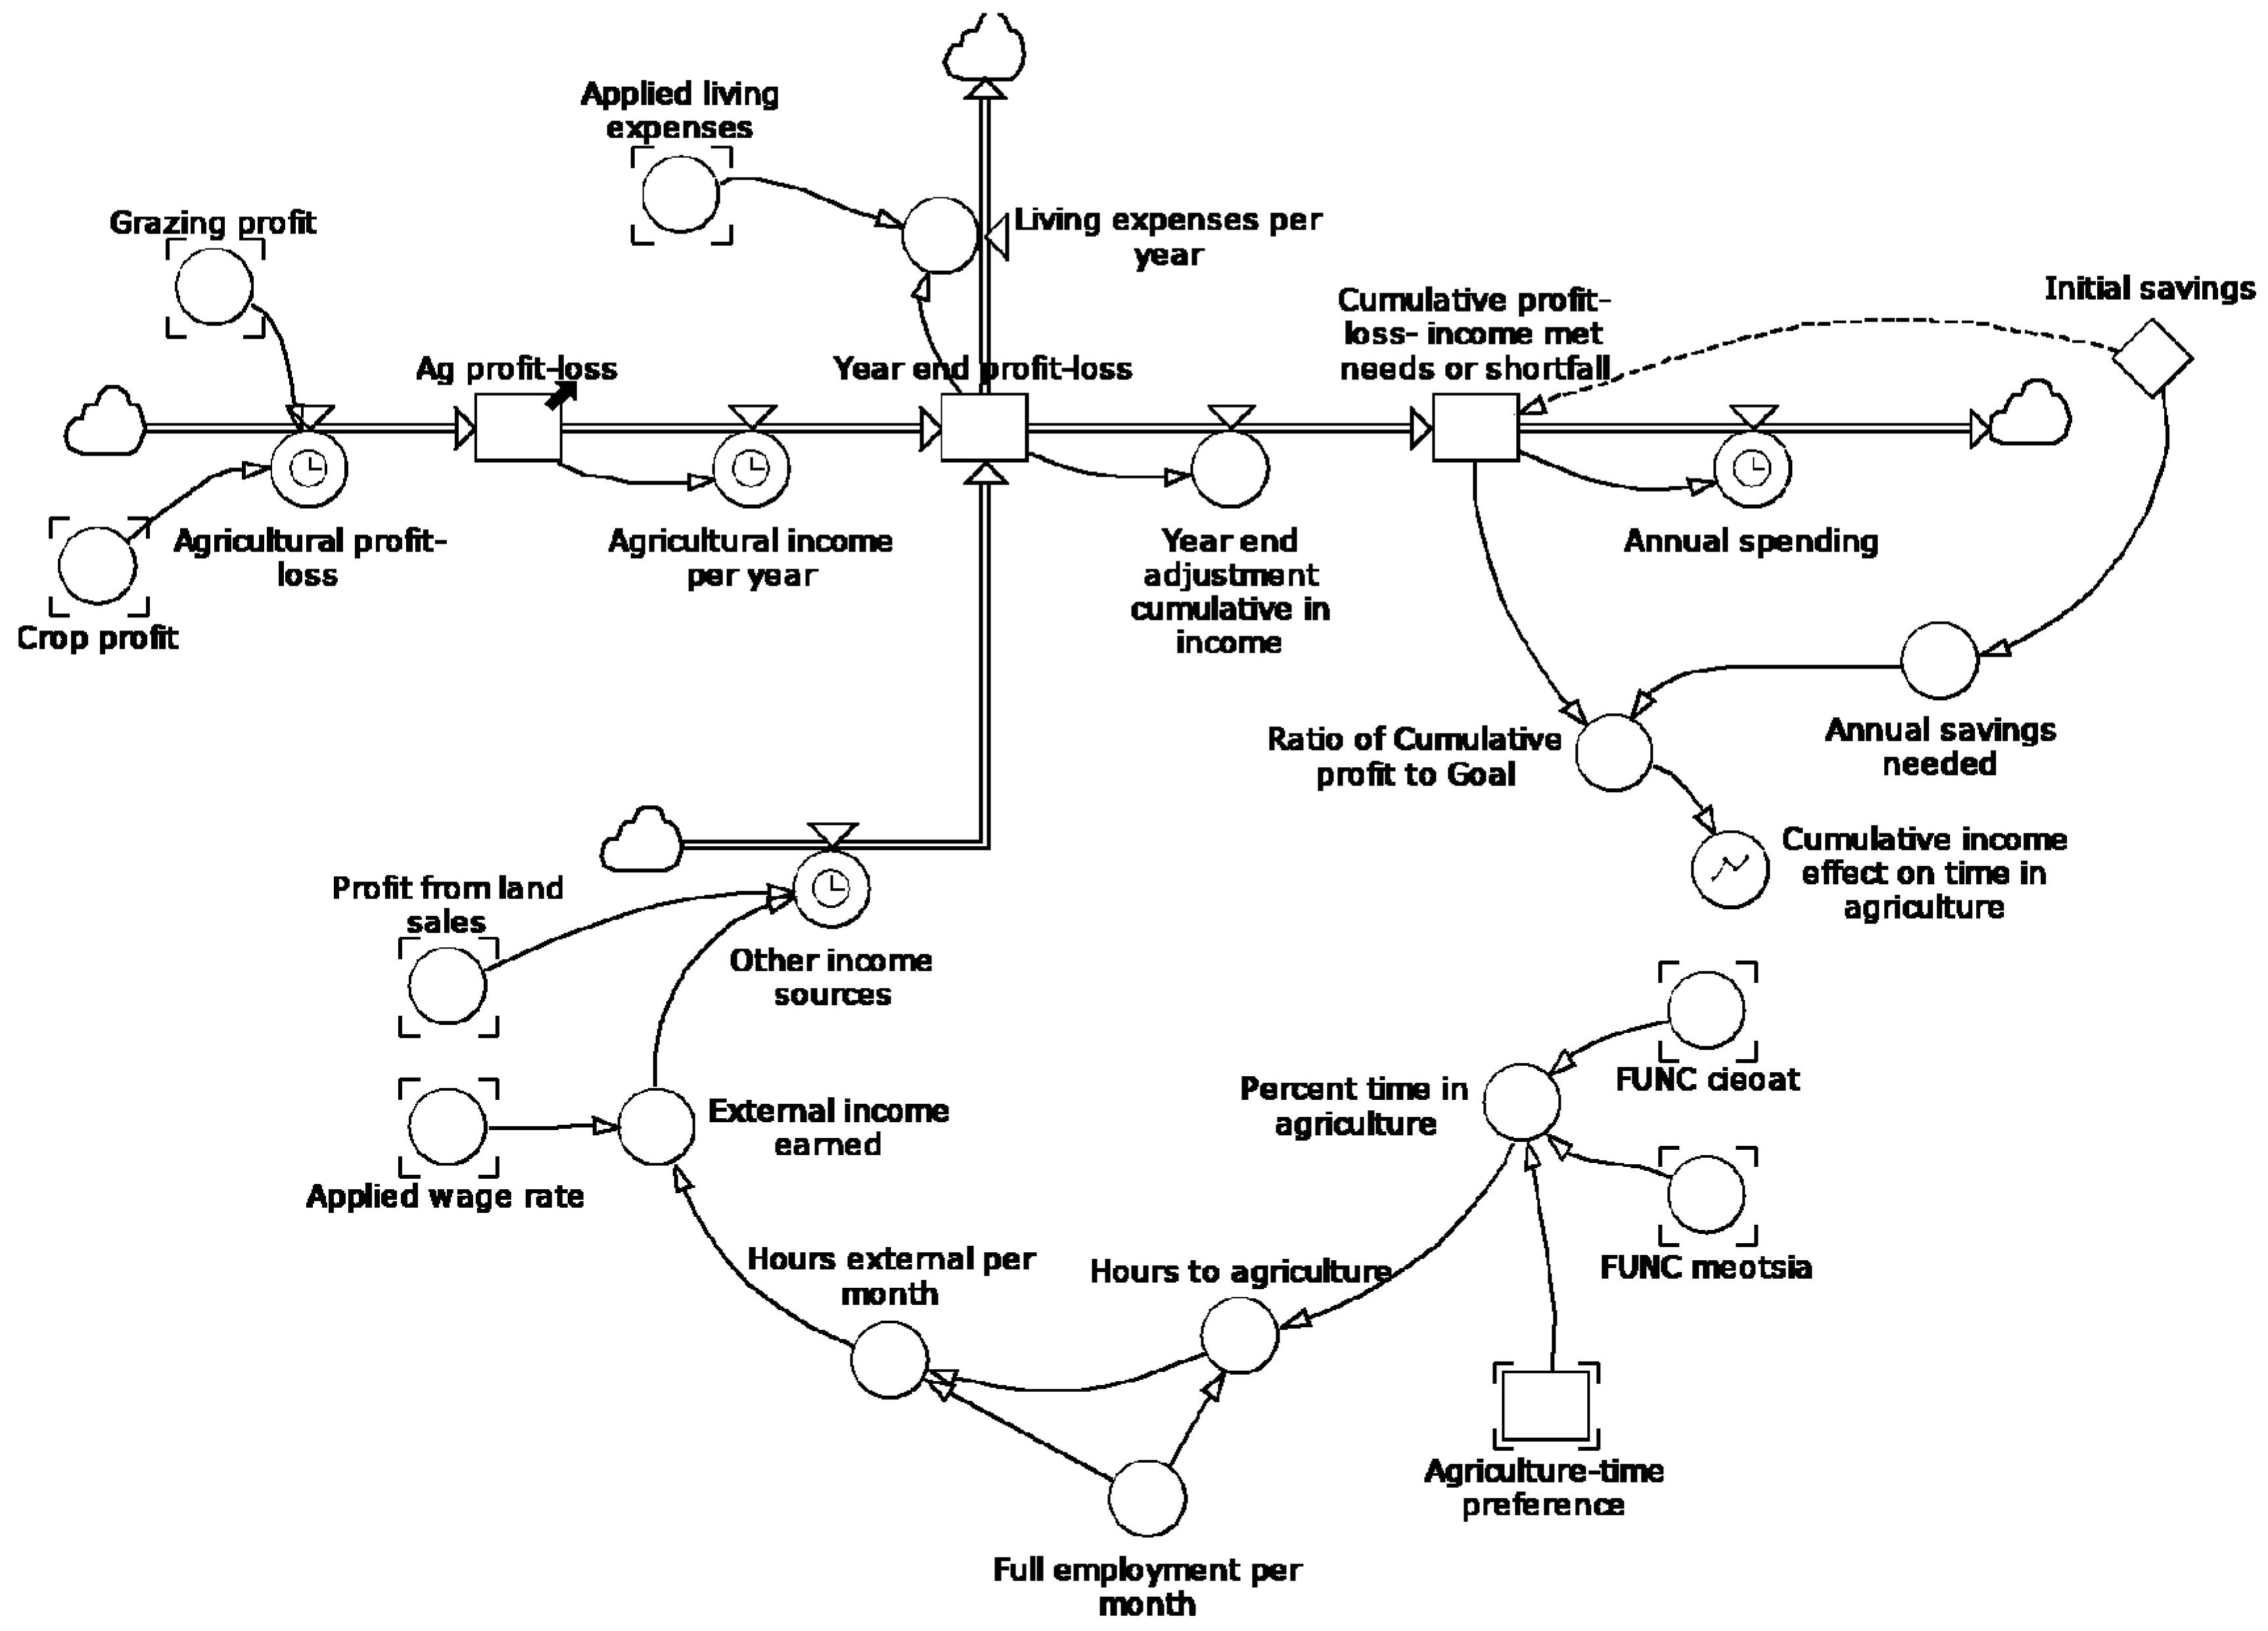
2.4.3. Economics and Time Management
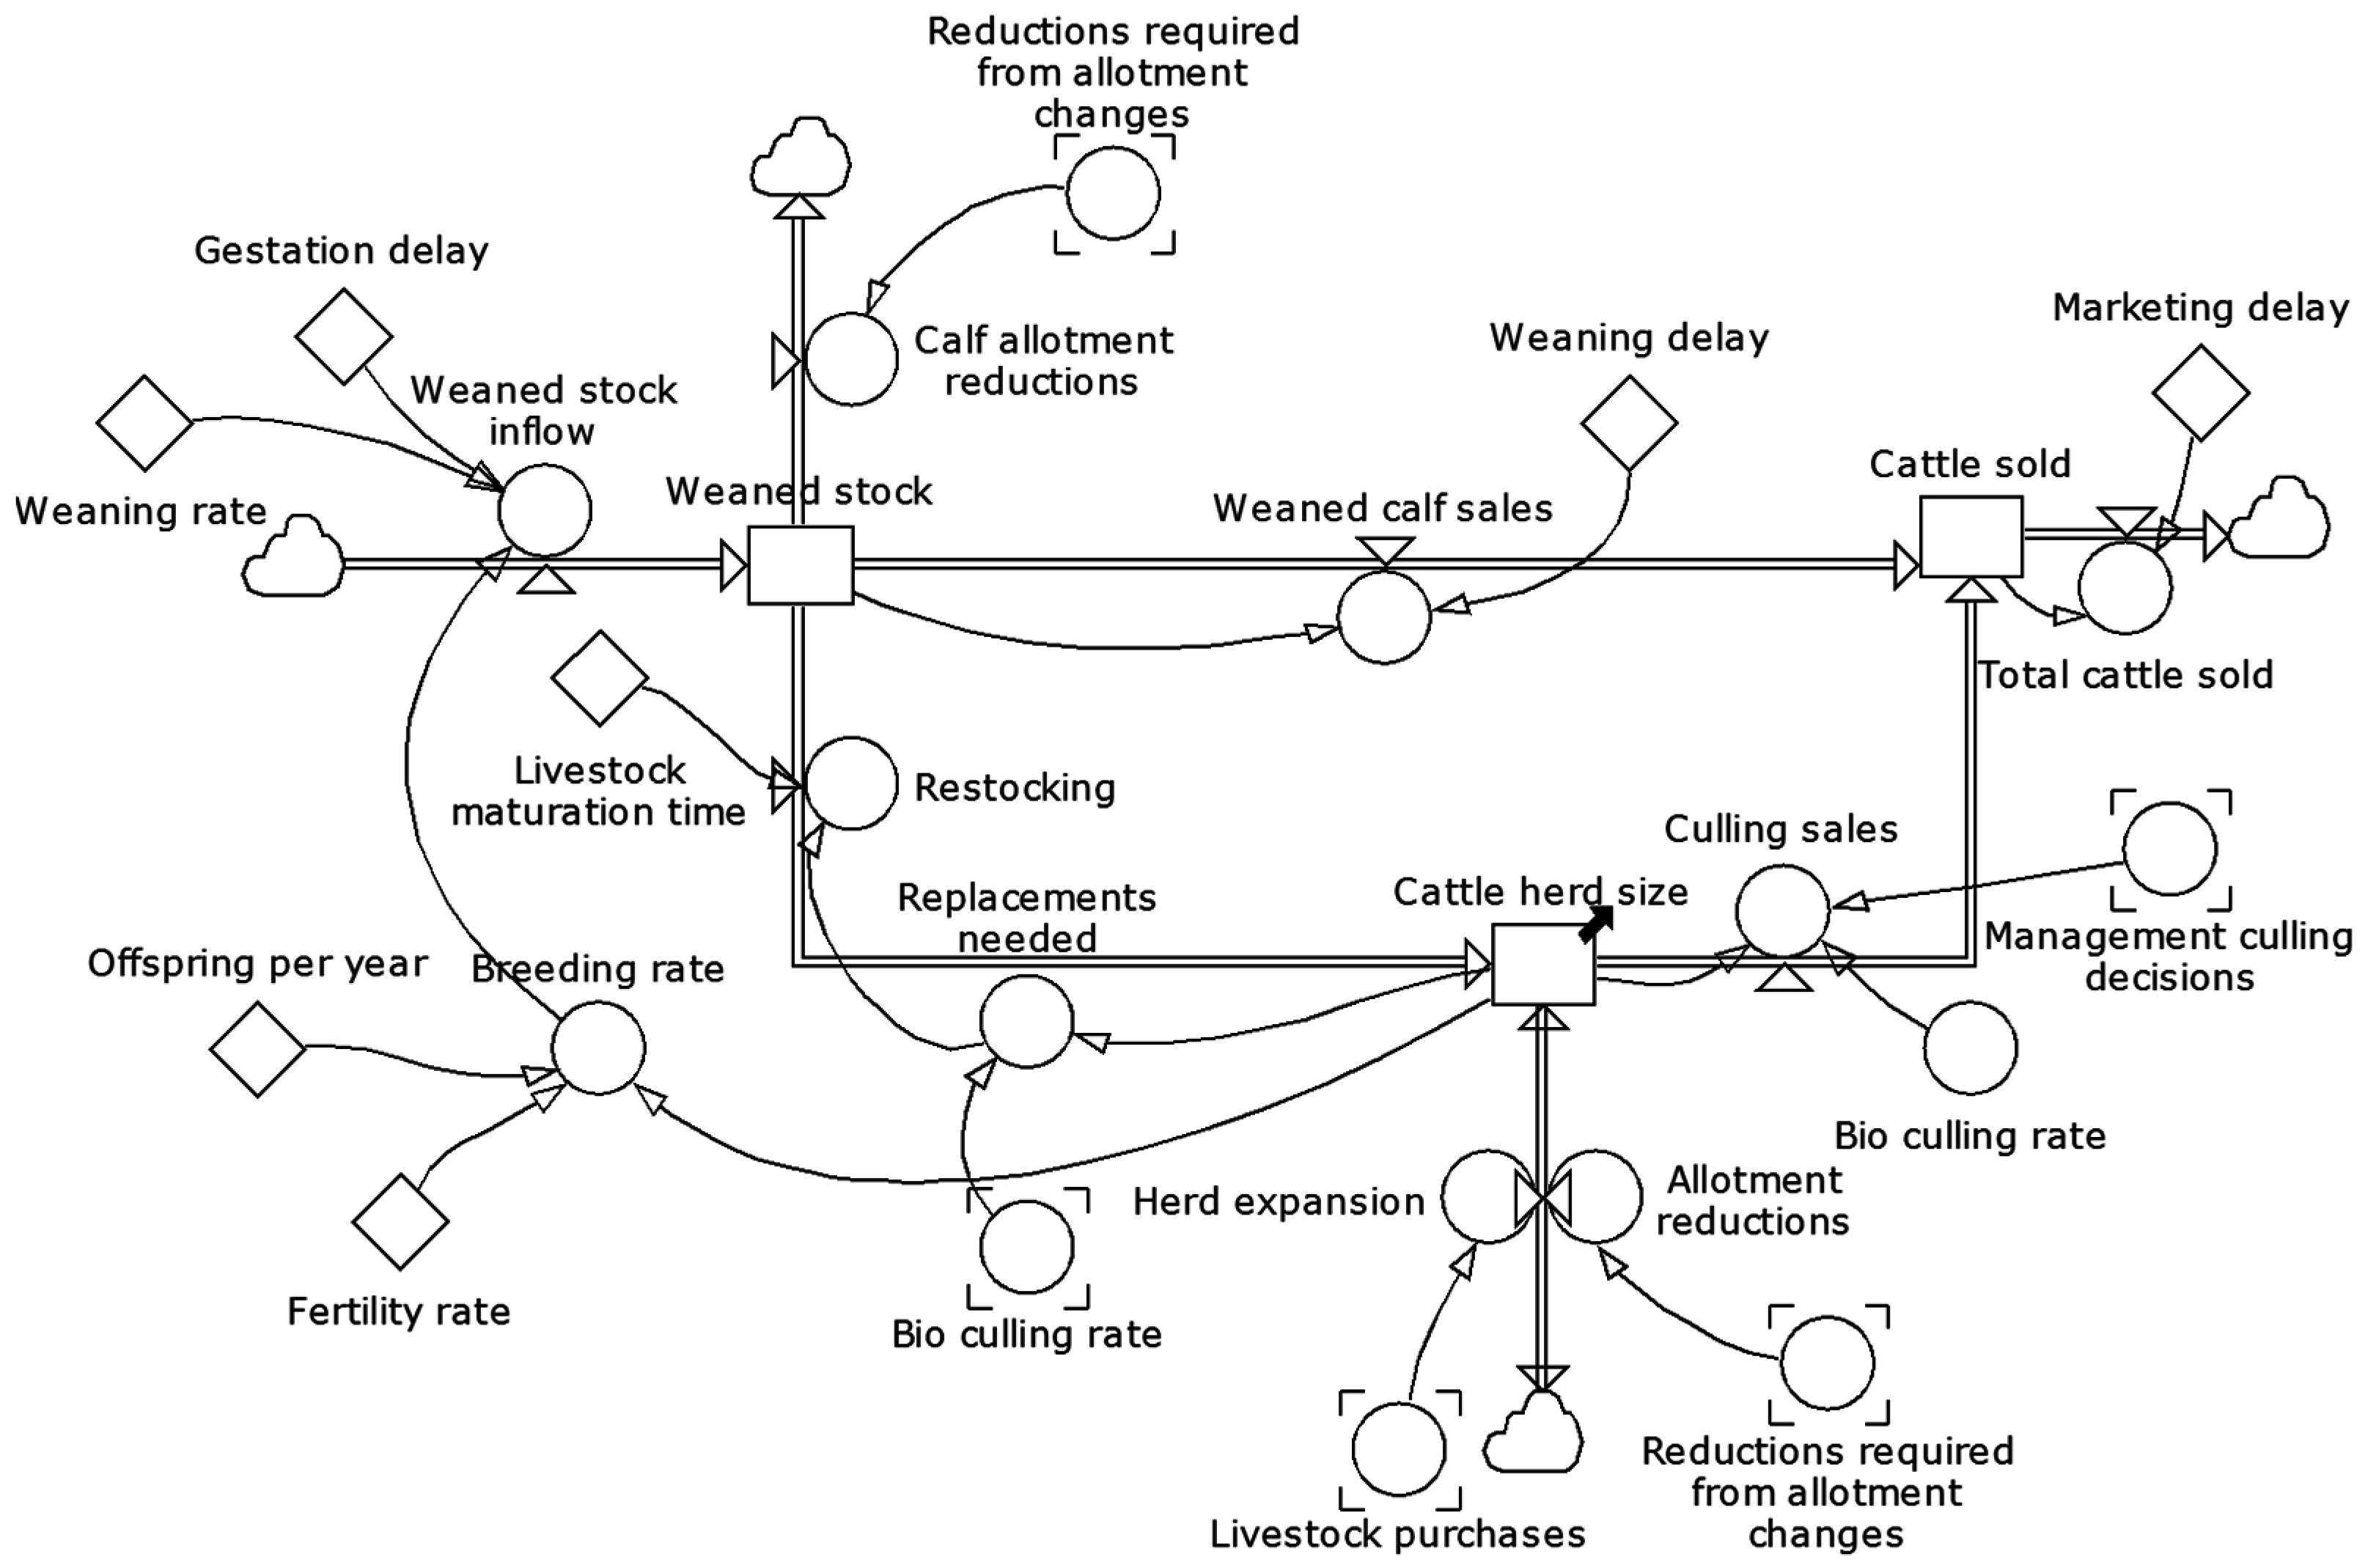
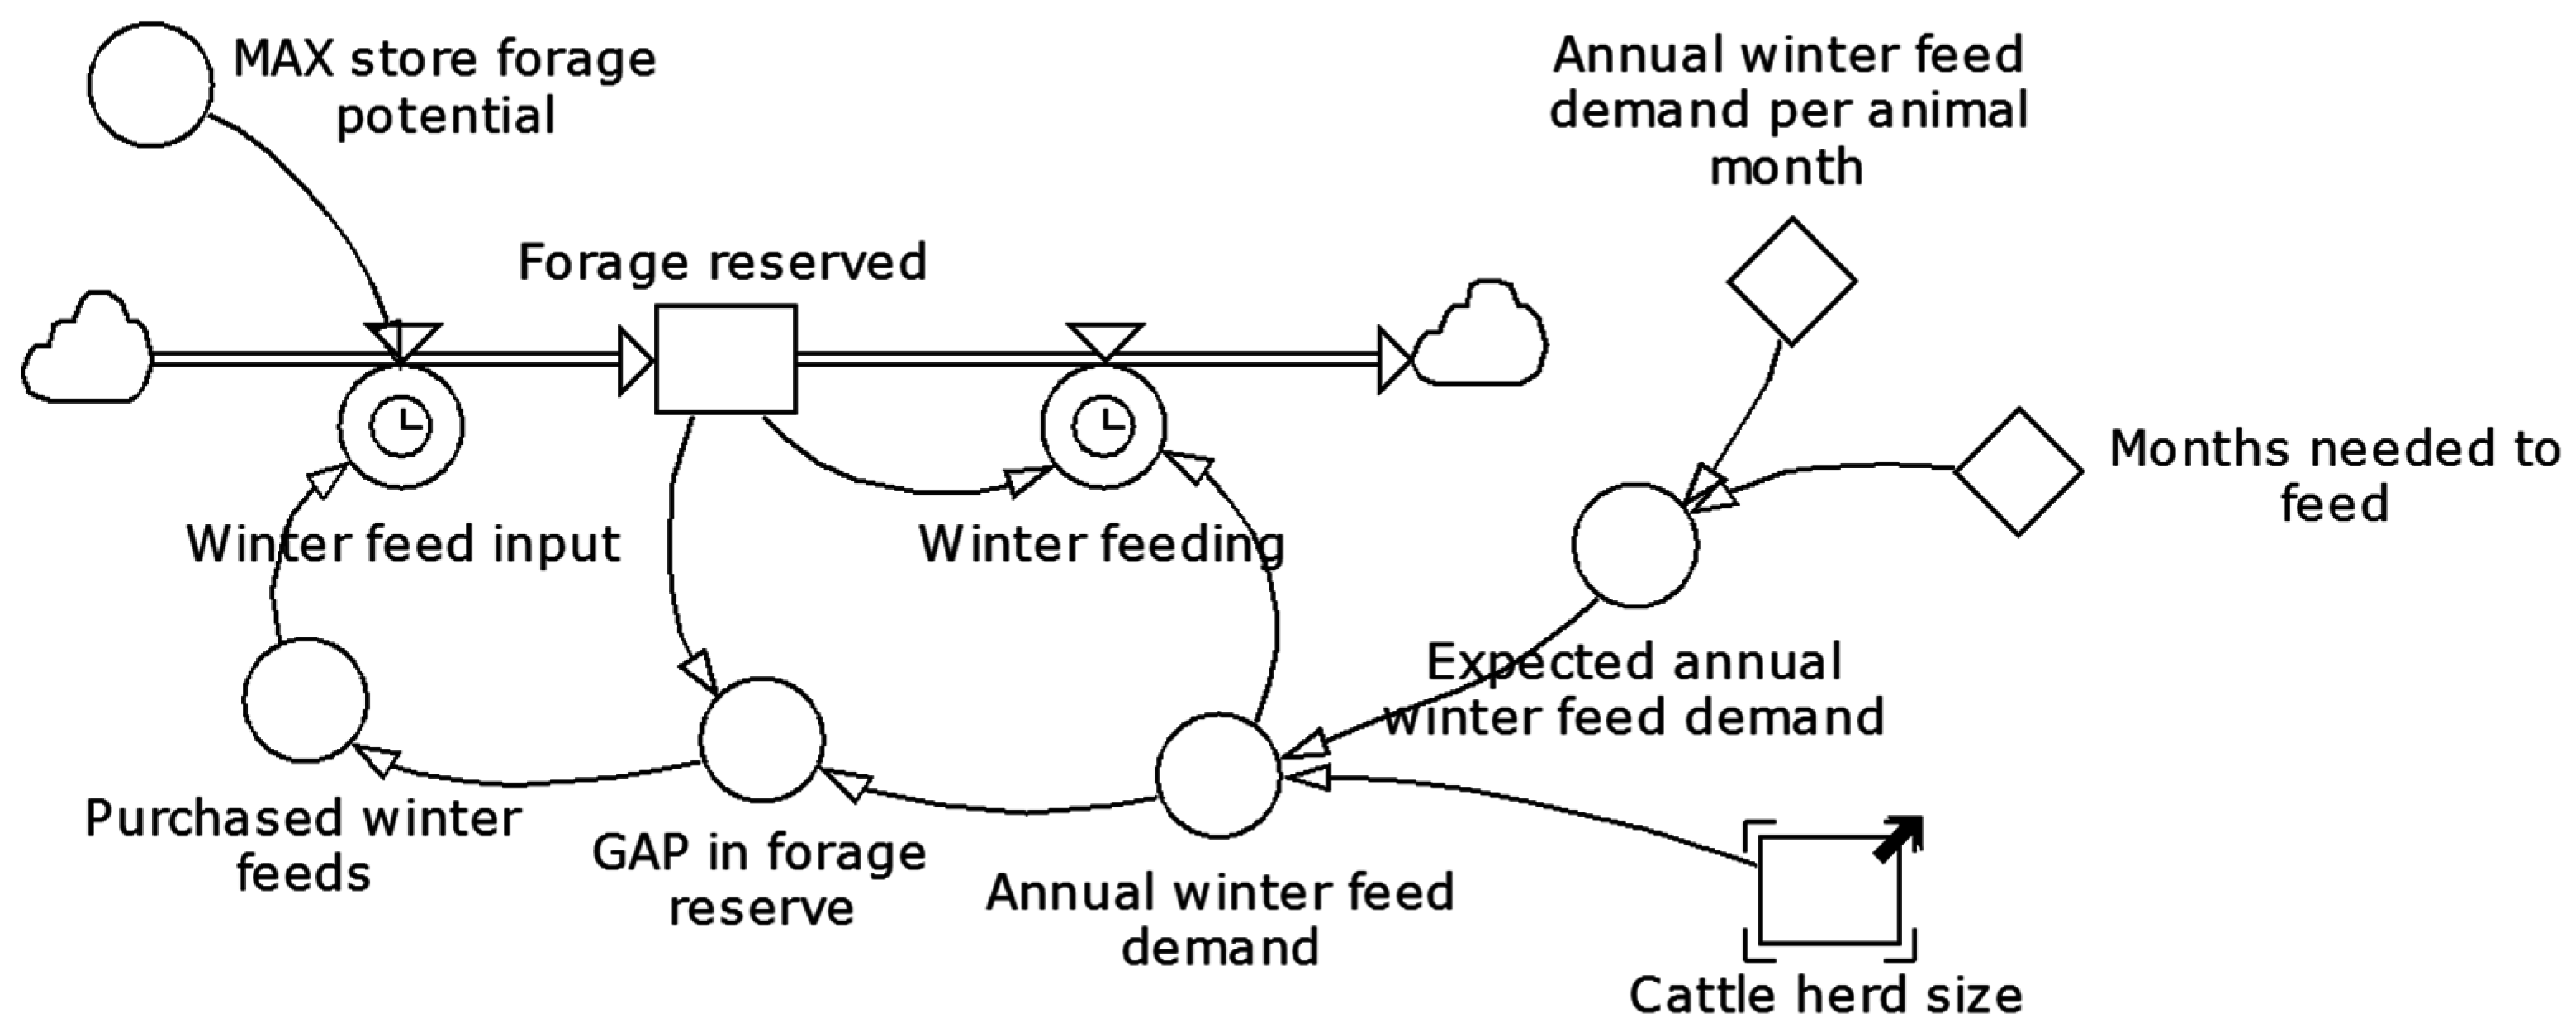
2.4.4. Farm and Ranch Activities
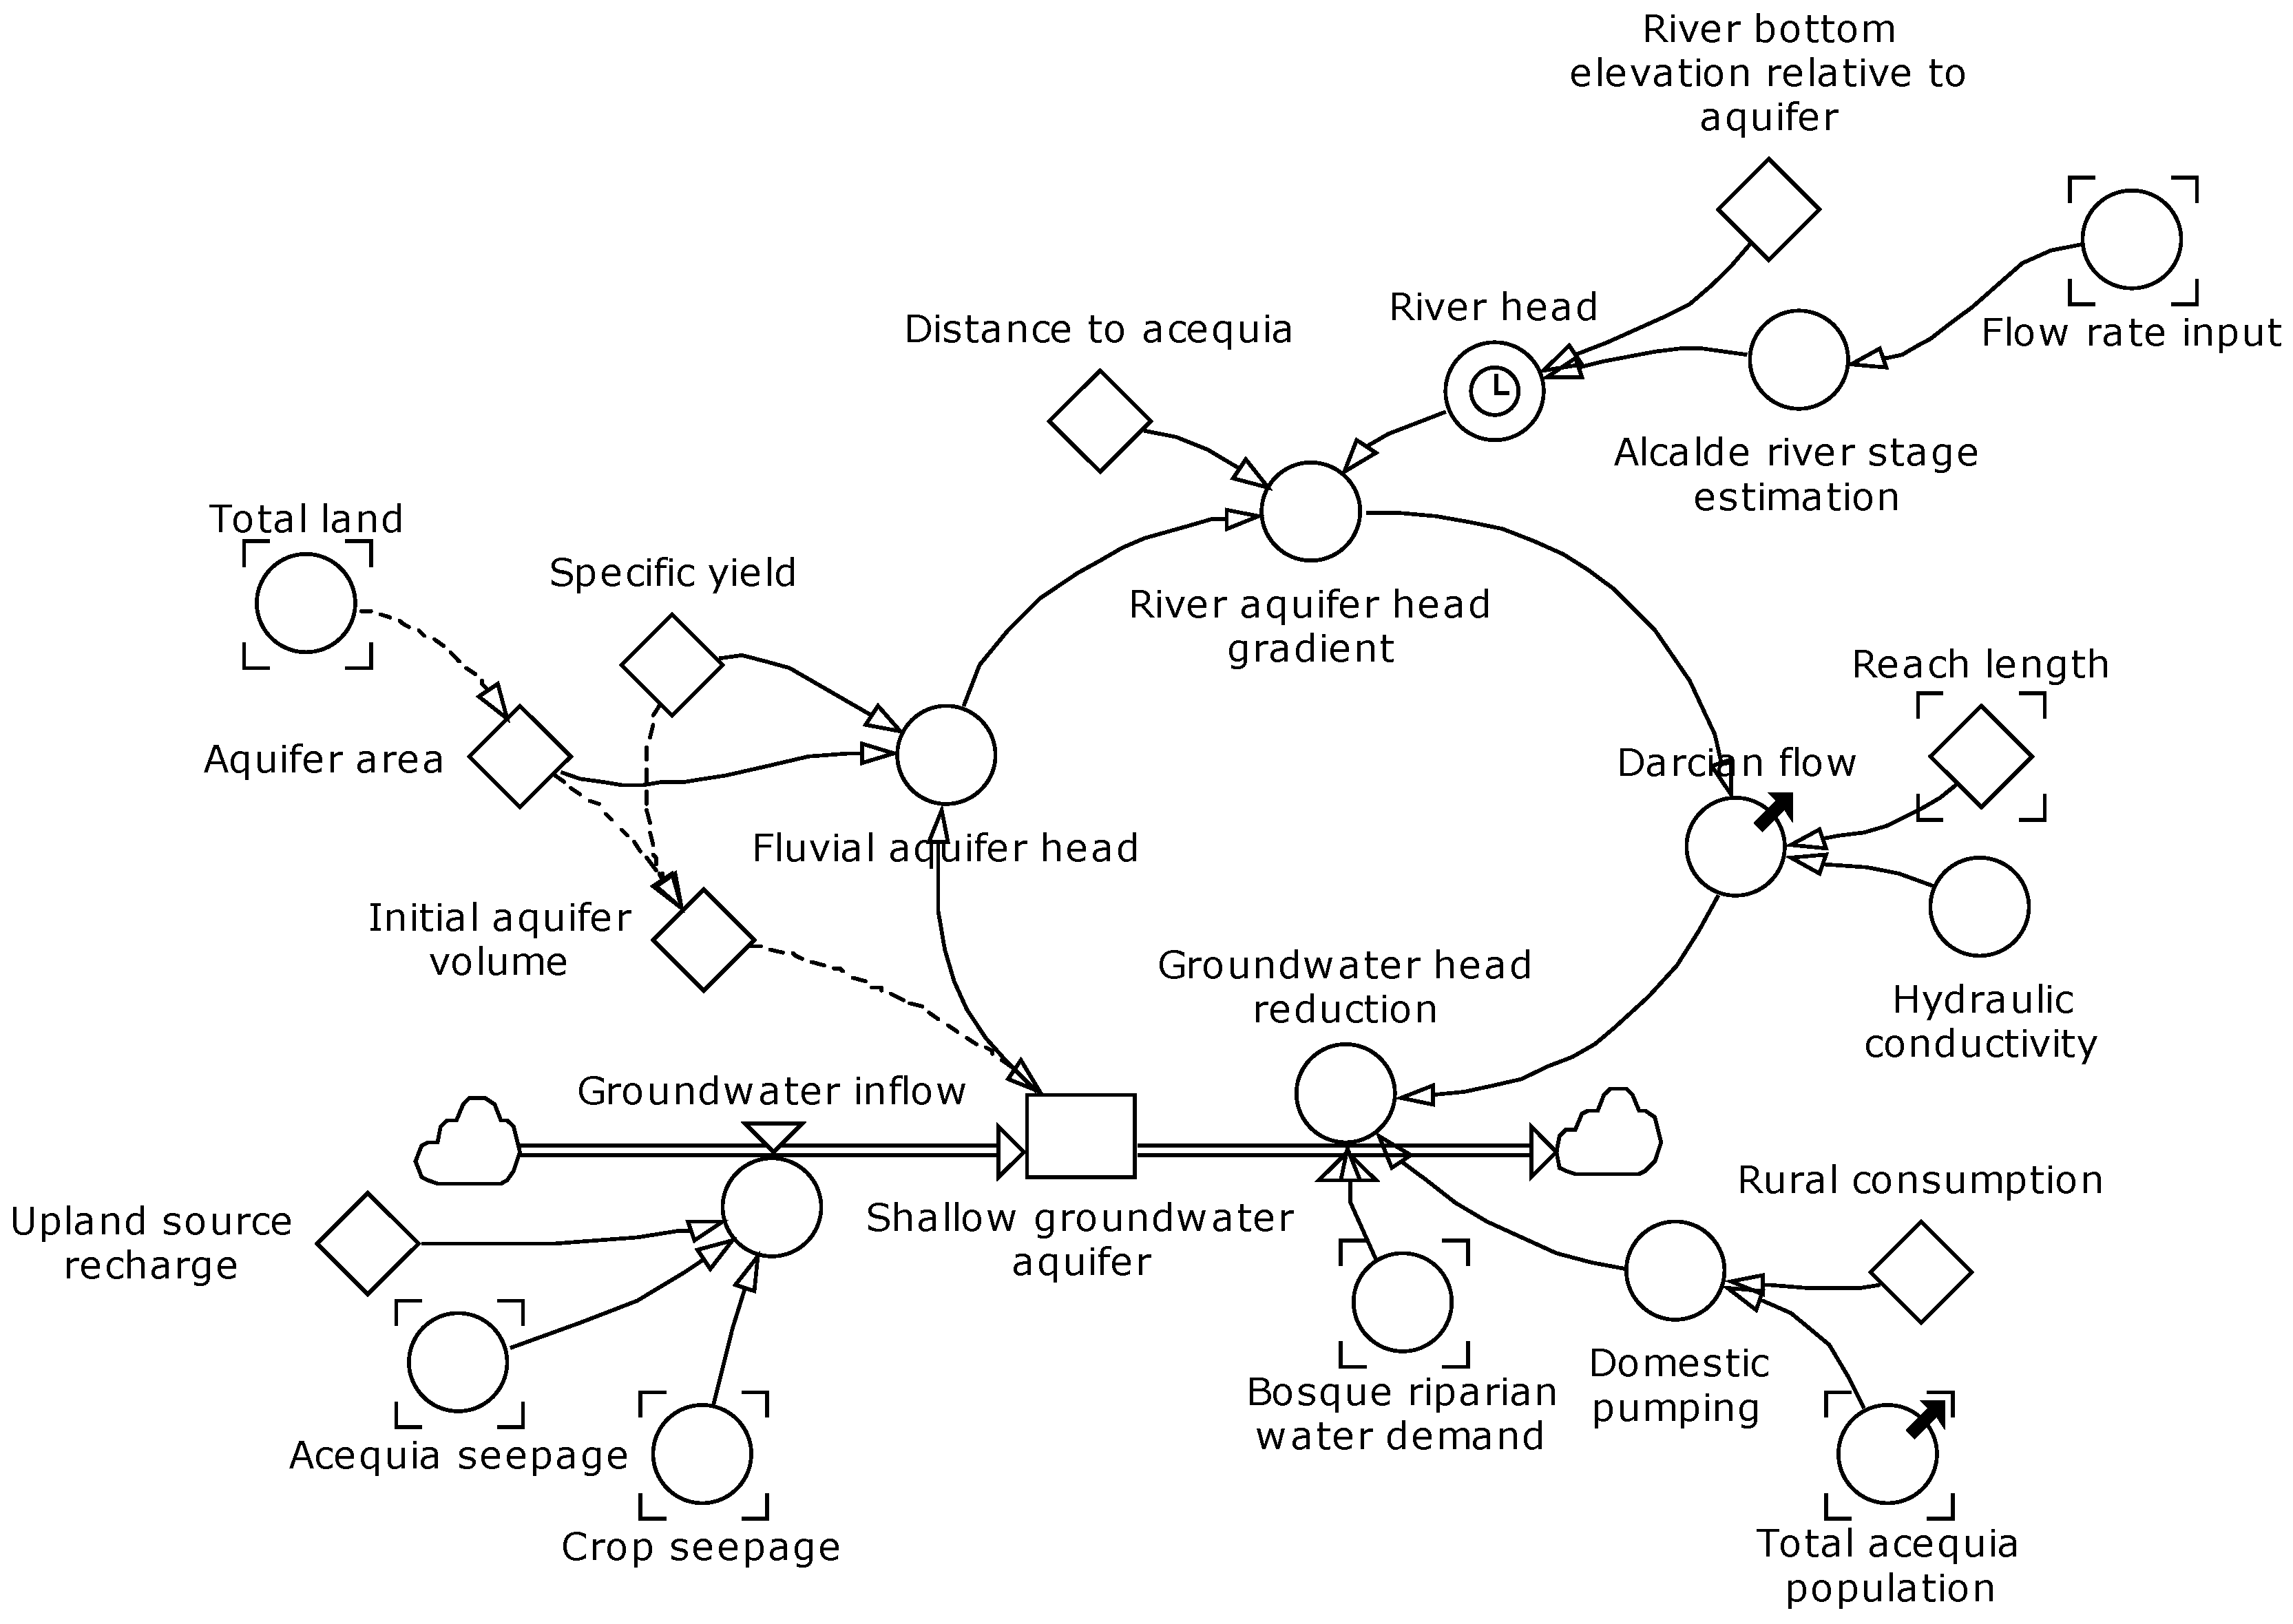
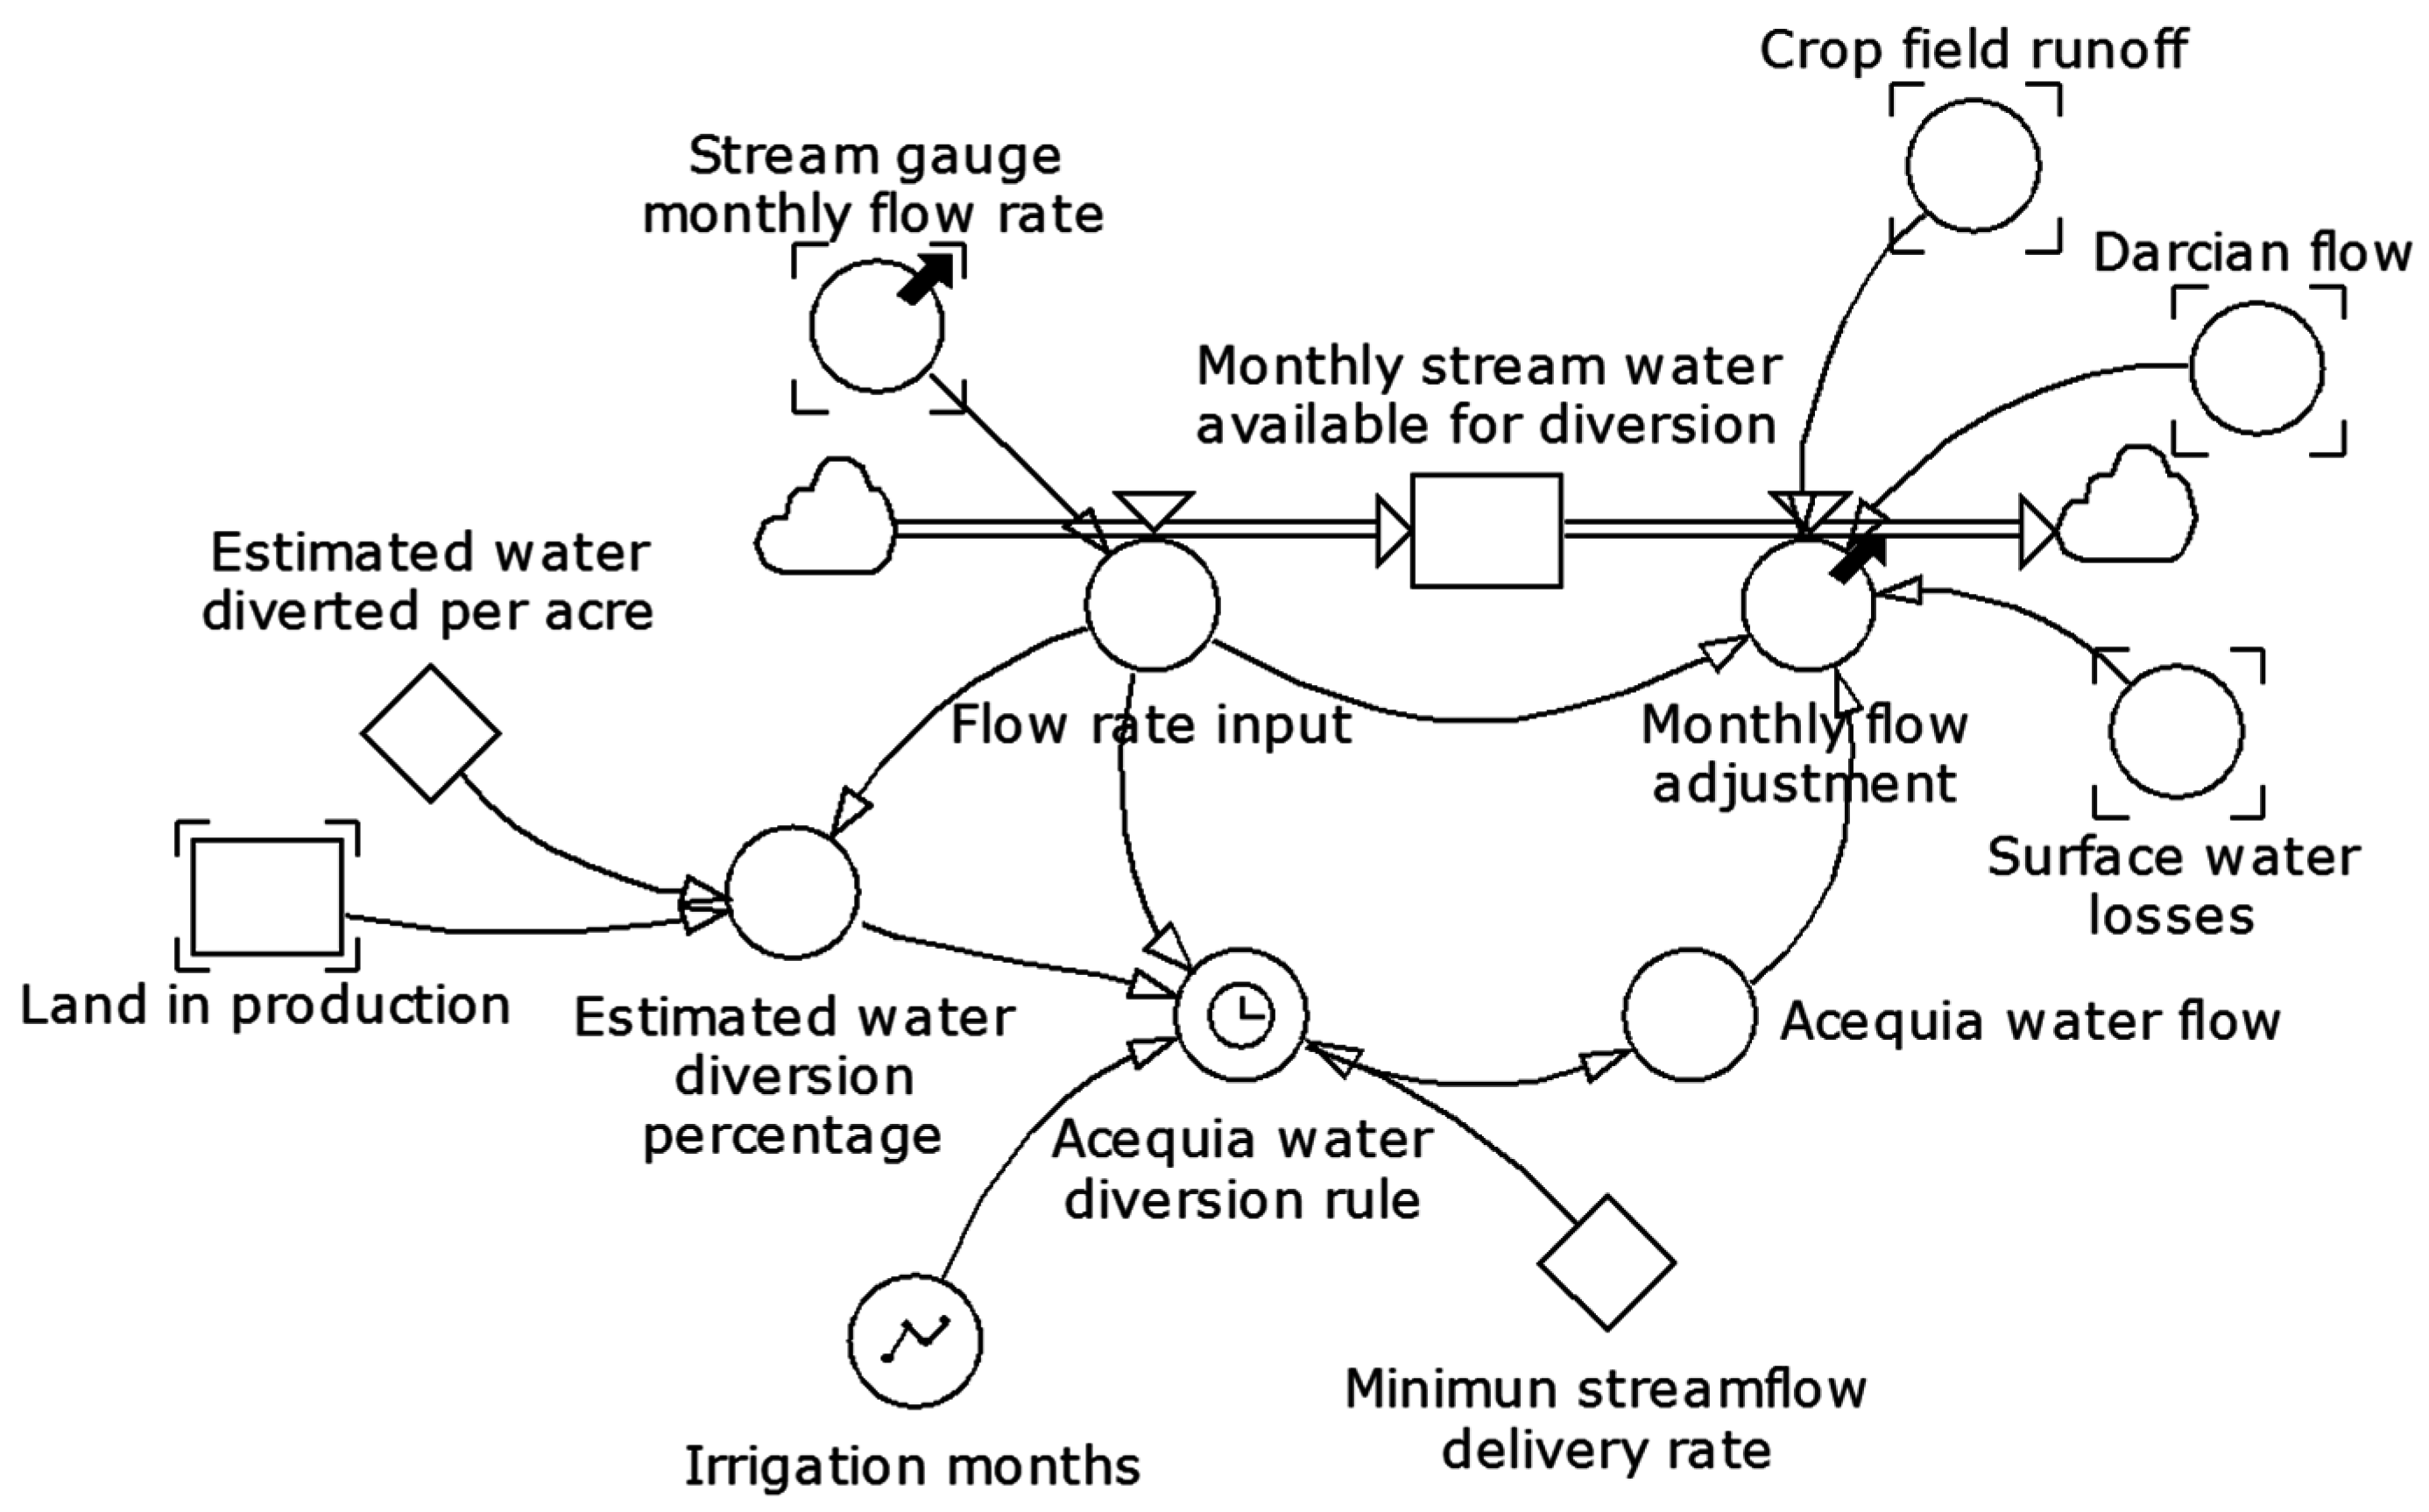
2.4.5. Acequia Hydrology
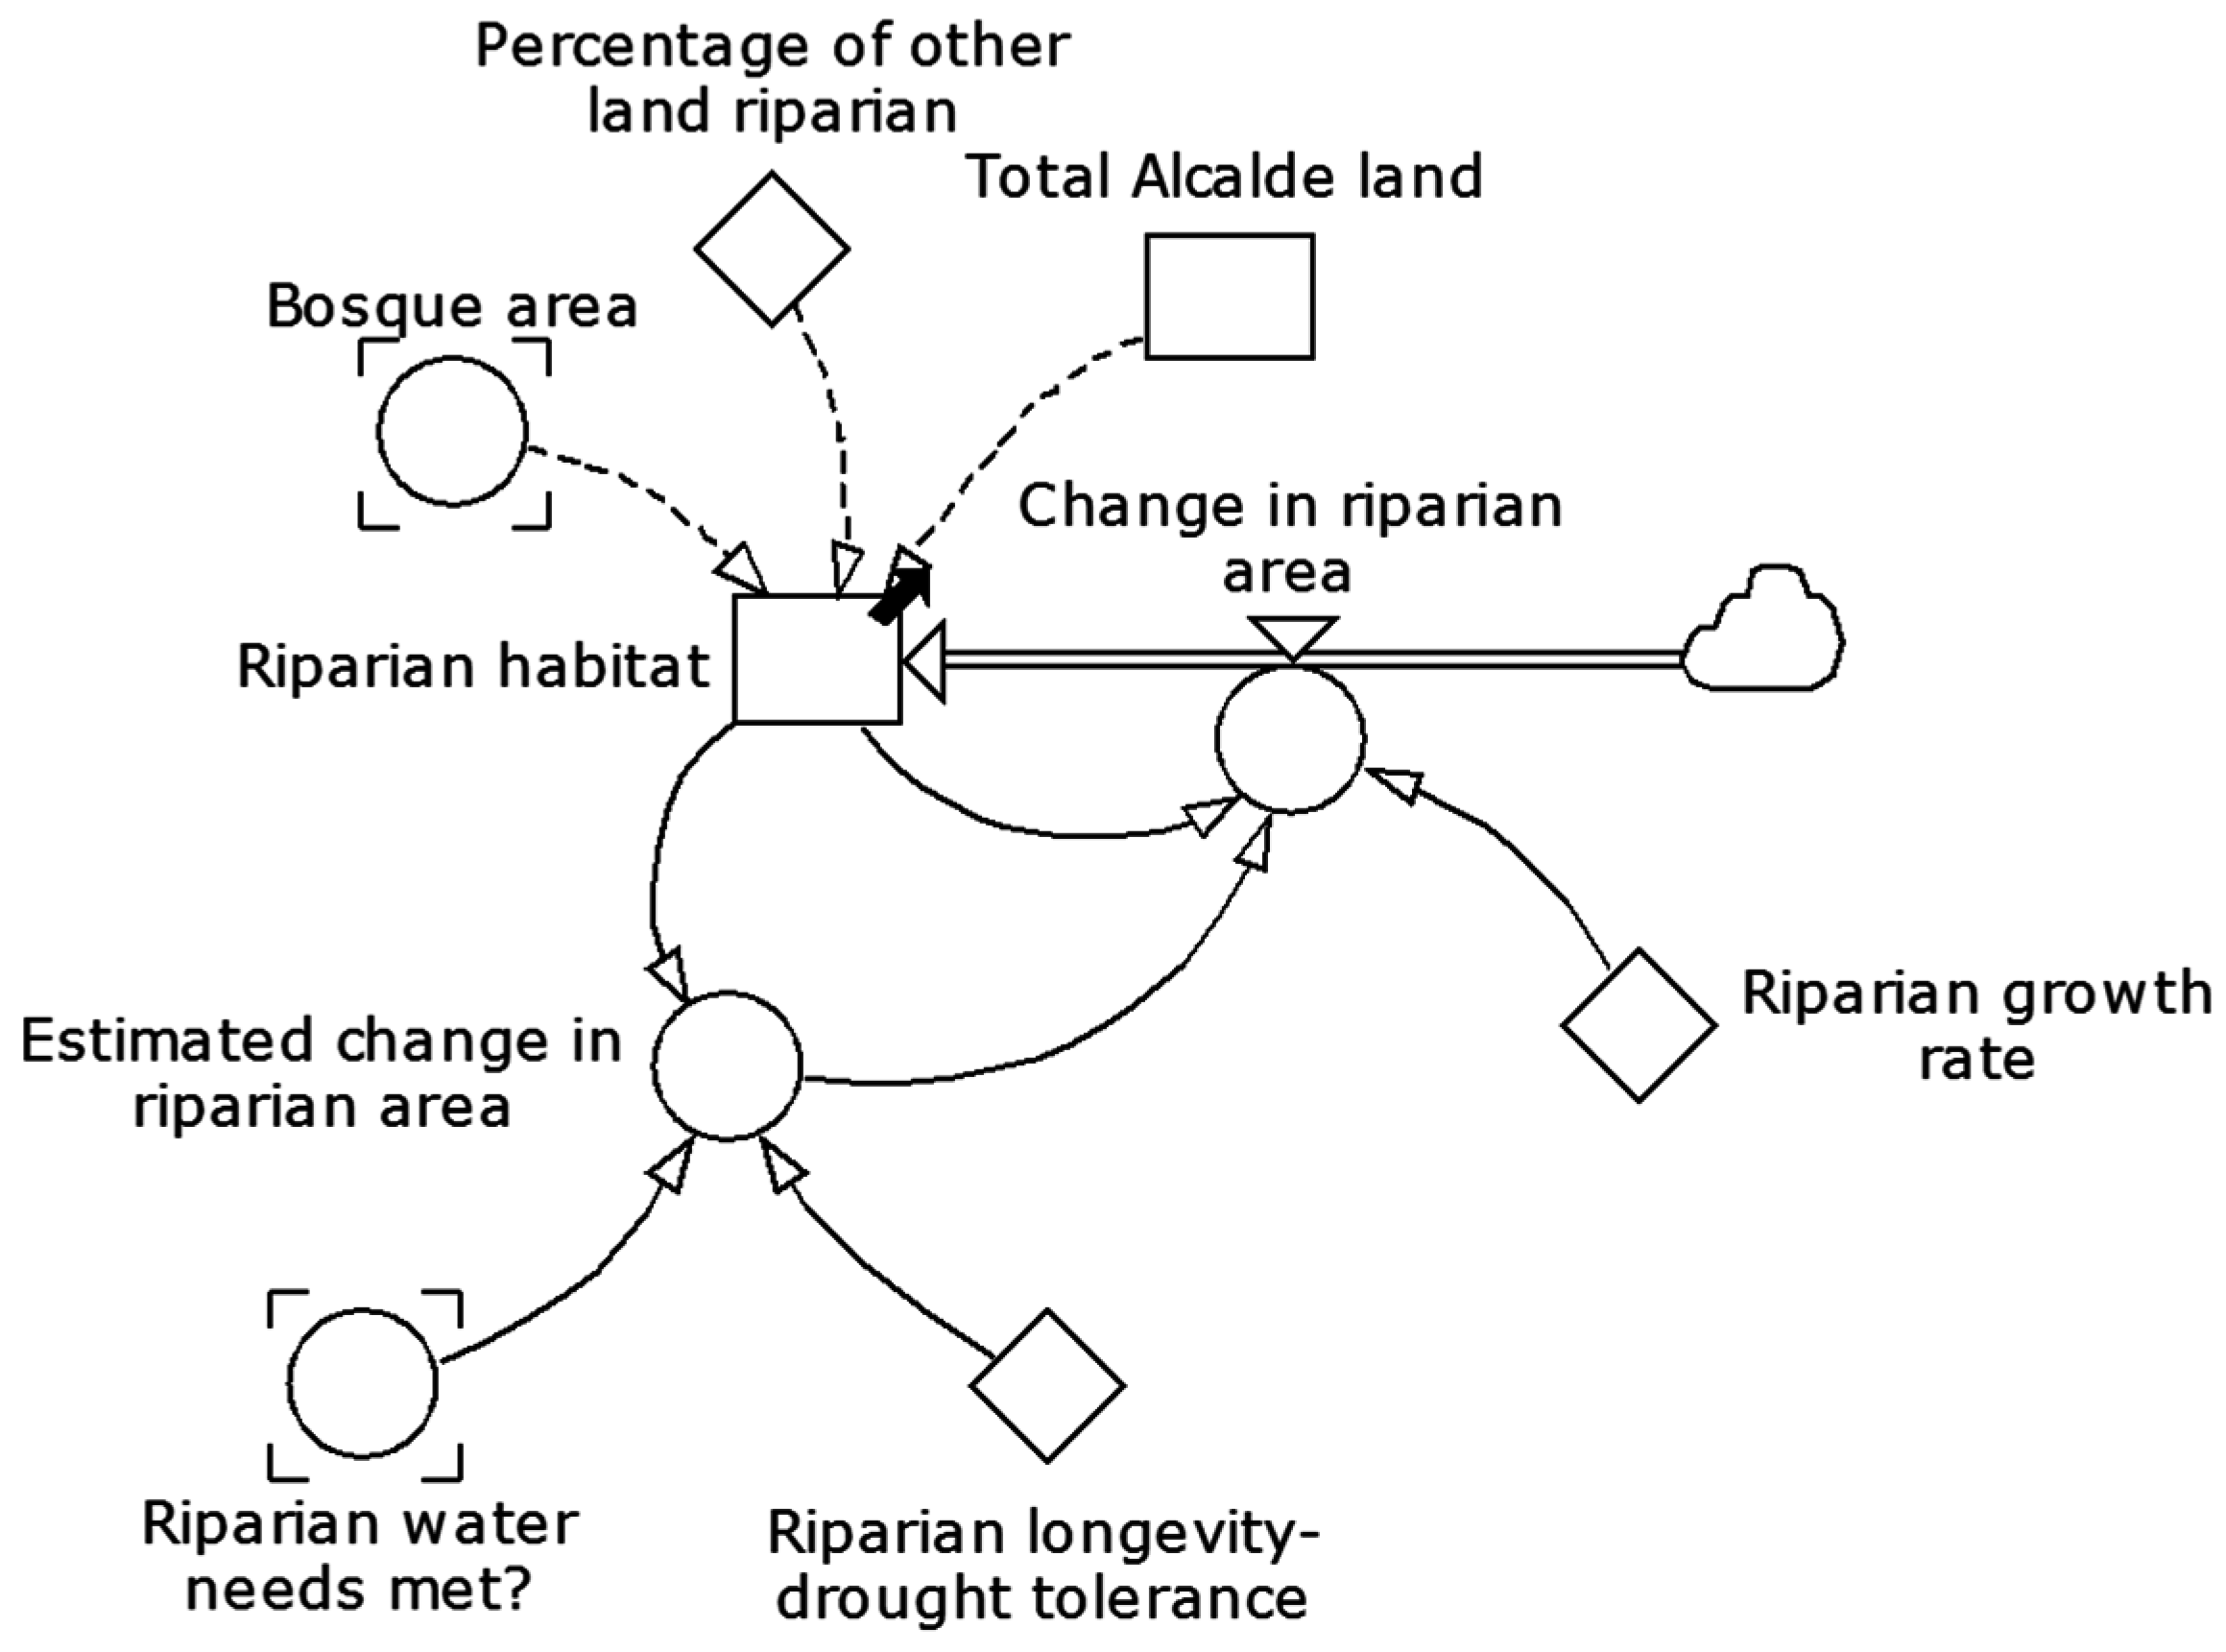
2.4.6. Ecosystem Health
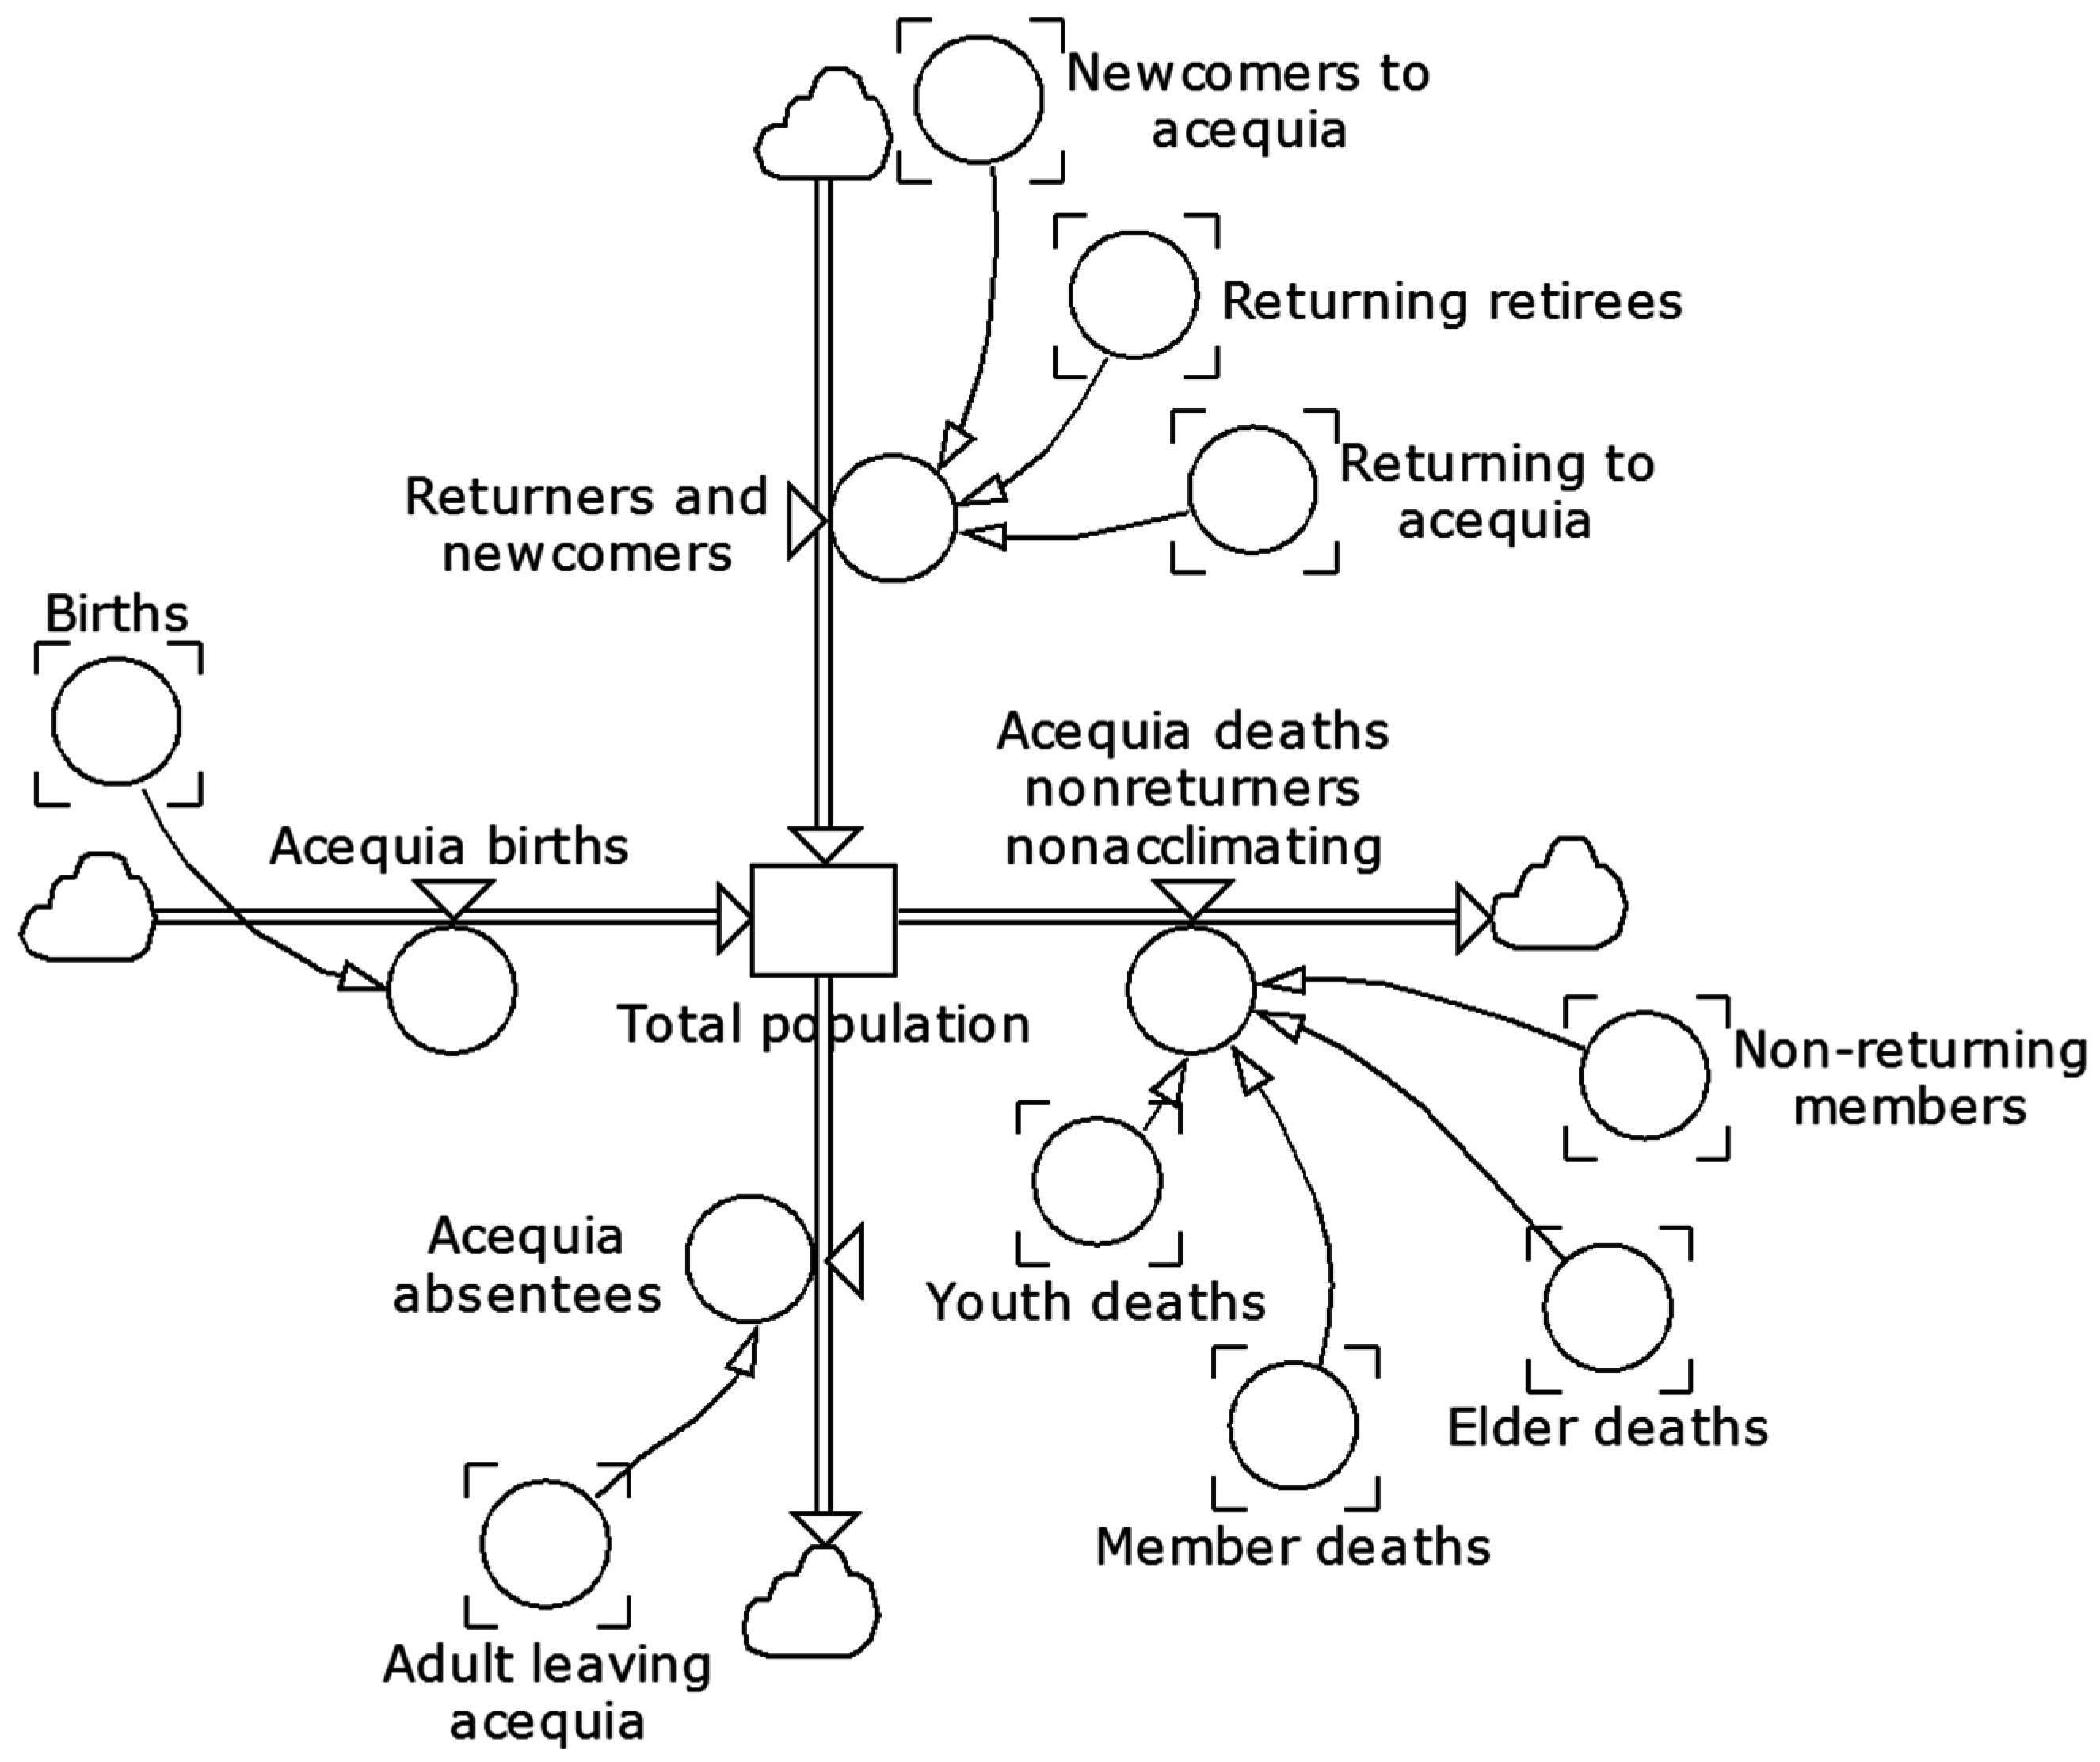
2.4.7. Acequia Community
2.4.8. Exogenous Model Inputs
2.5. Model Reference Modes, Calibration, and Evaluation Procedures
2.6. Sensitivity Analyses
3. Results and Discussion
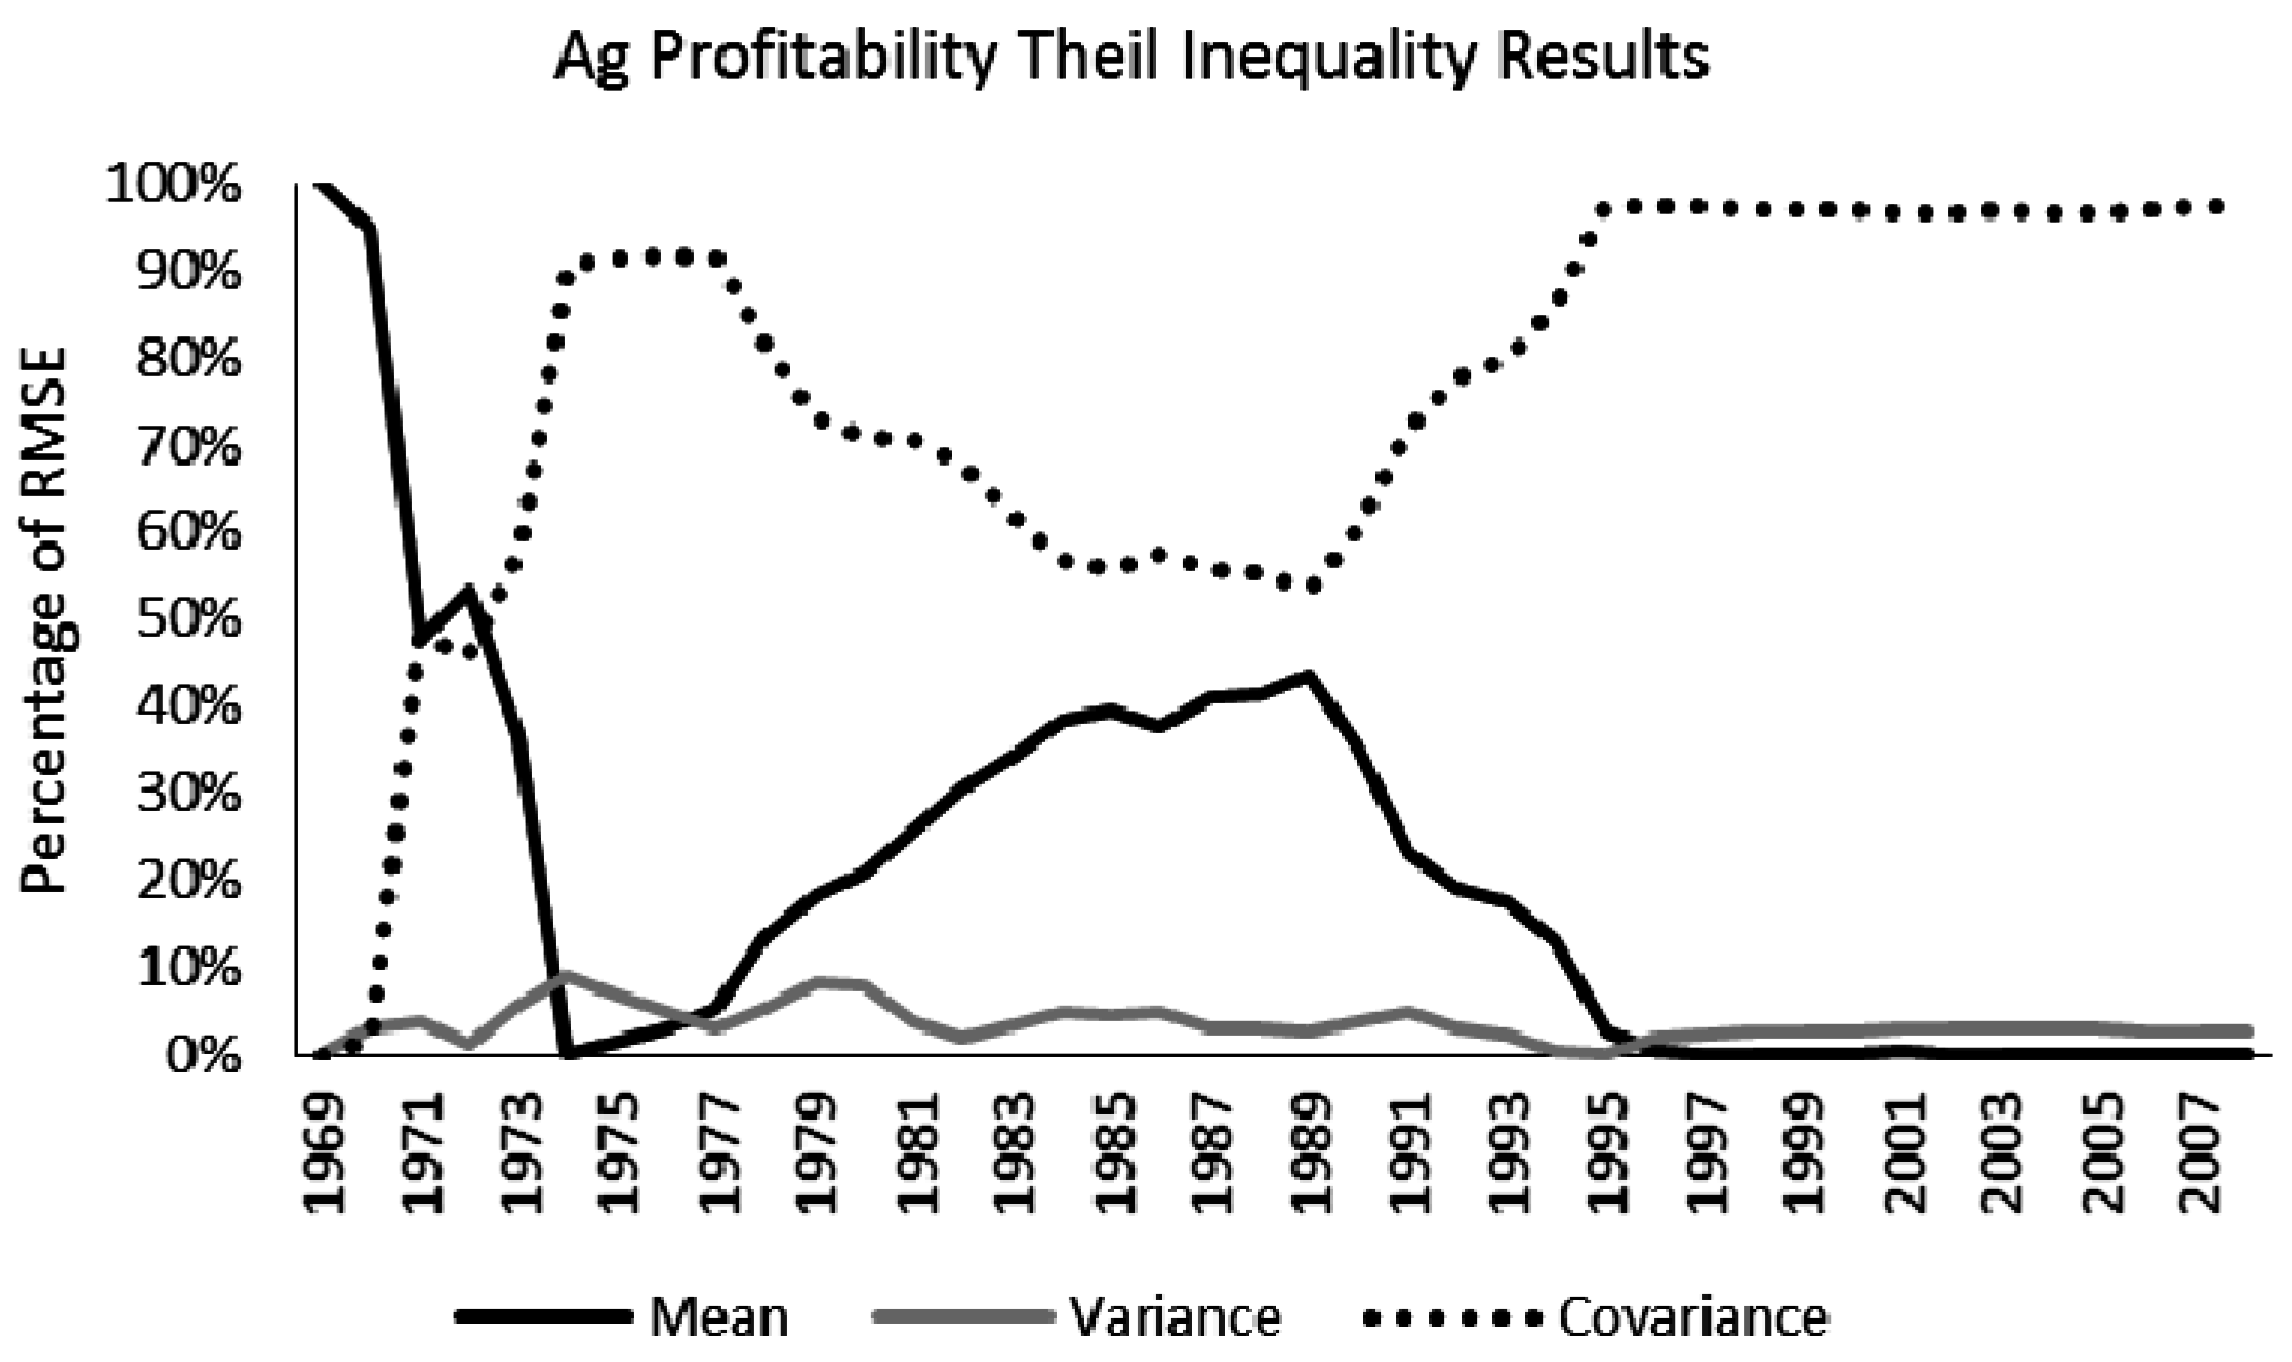
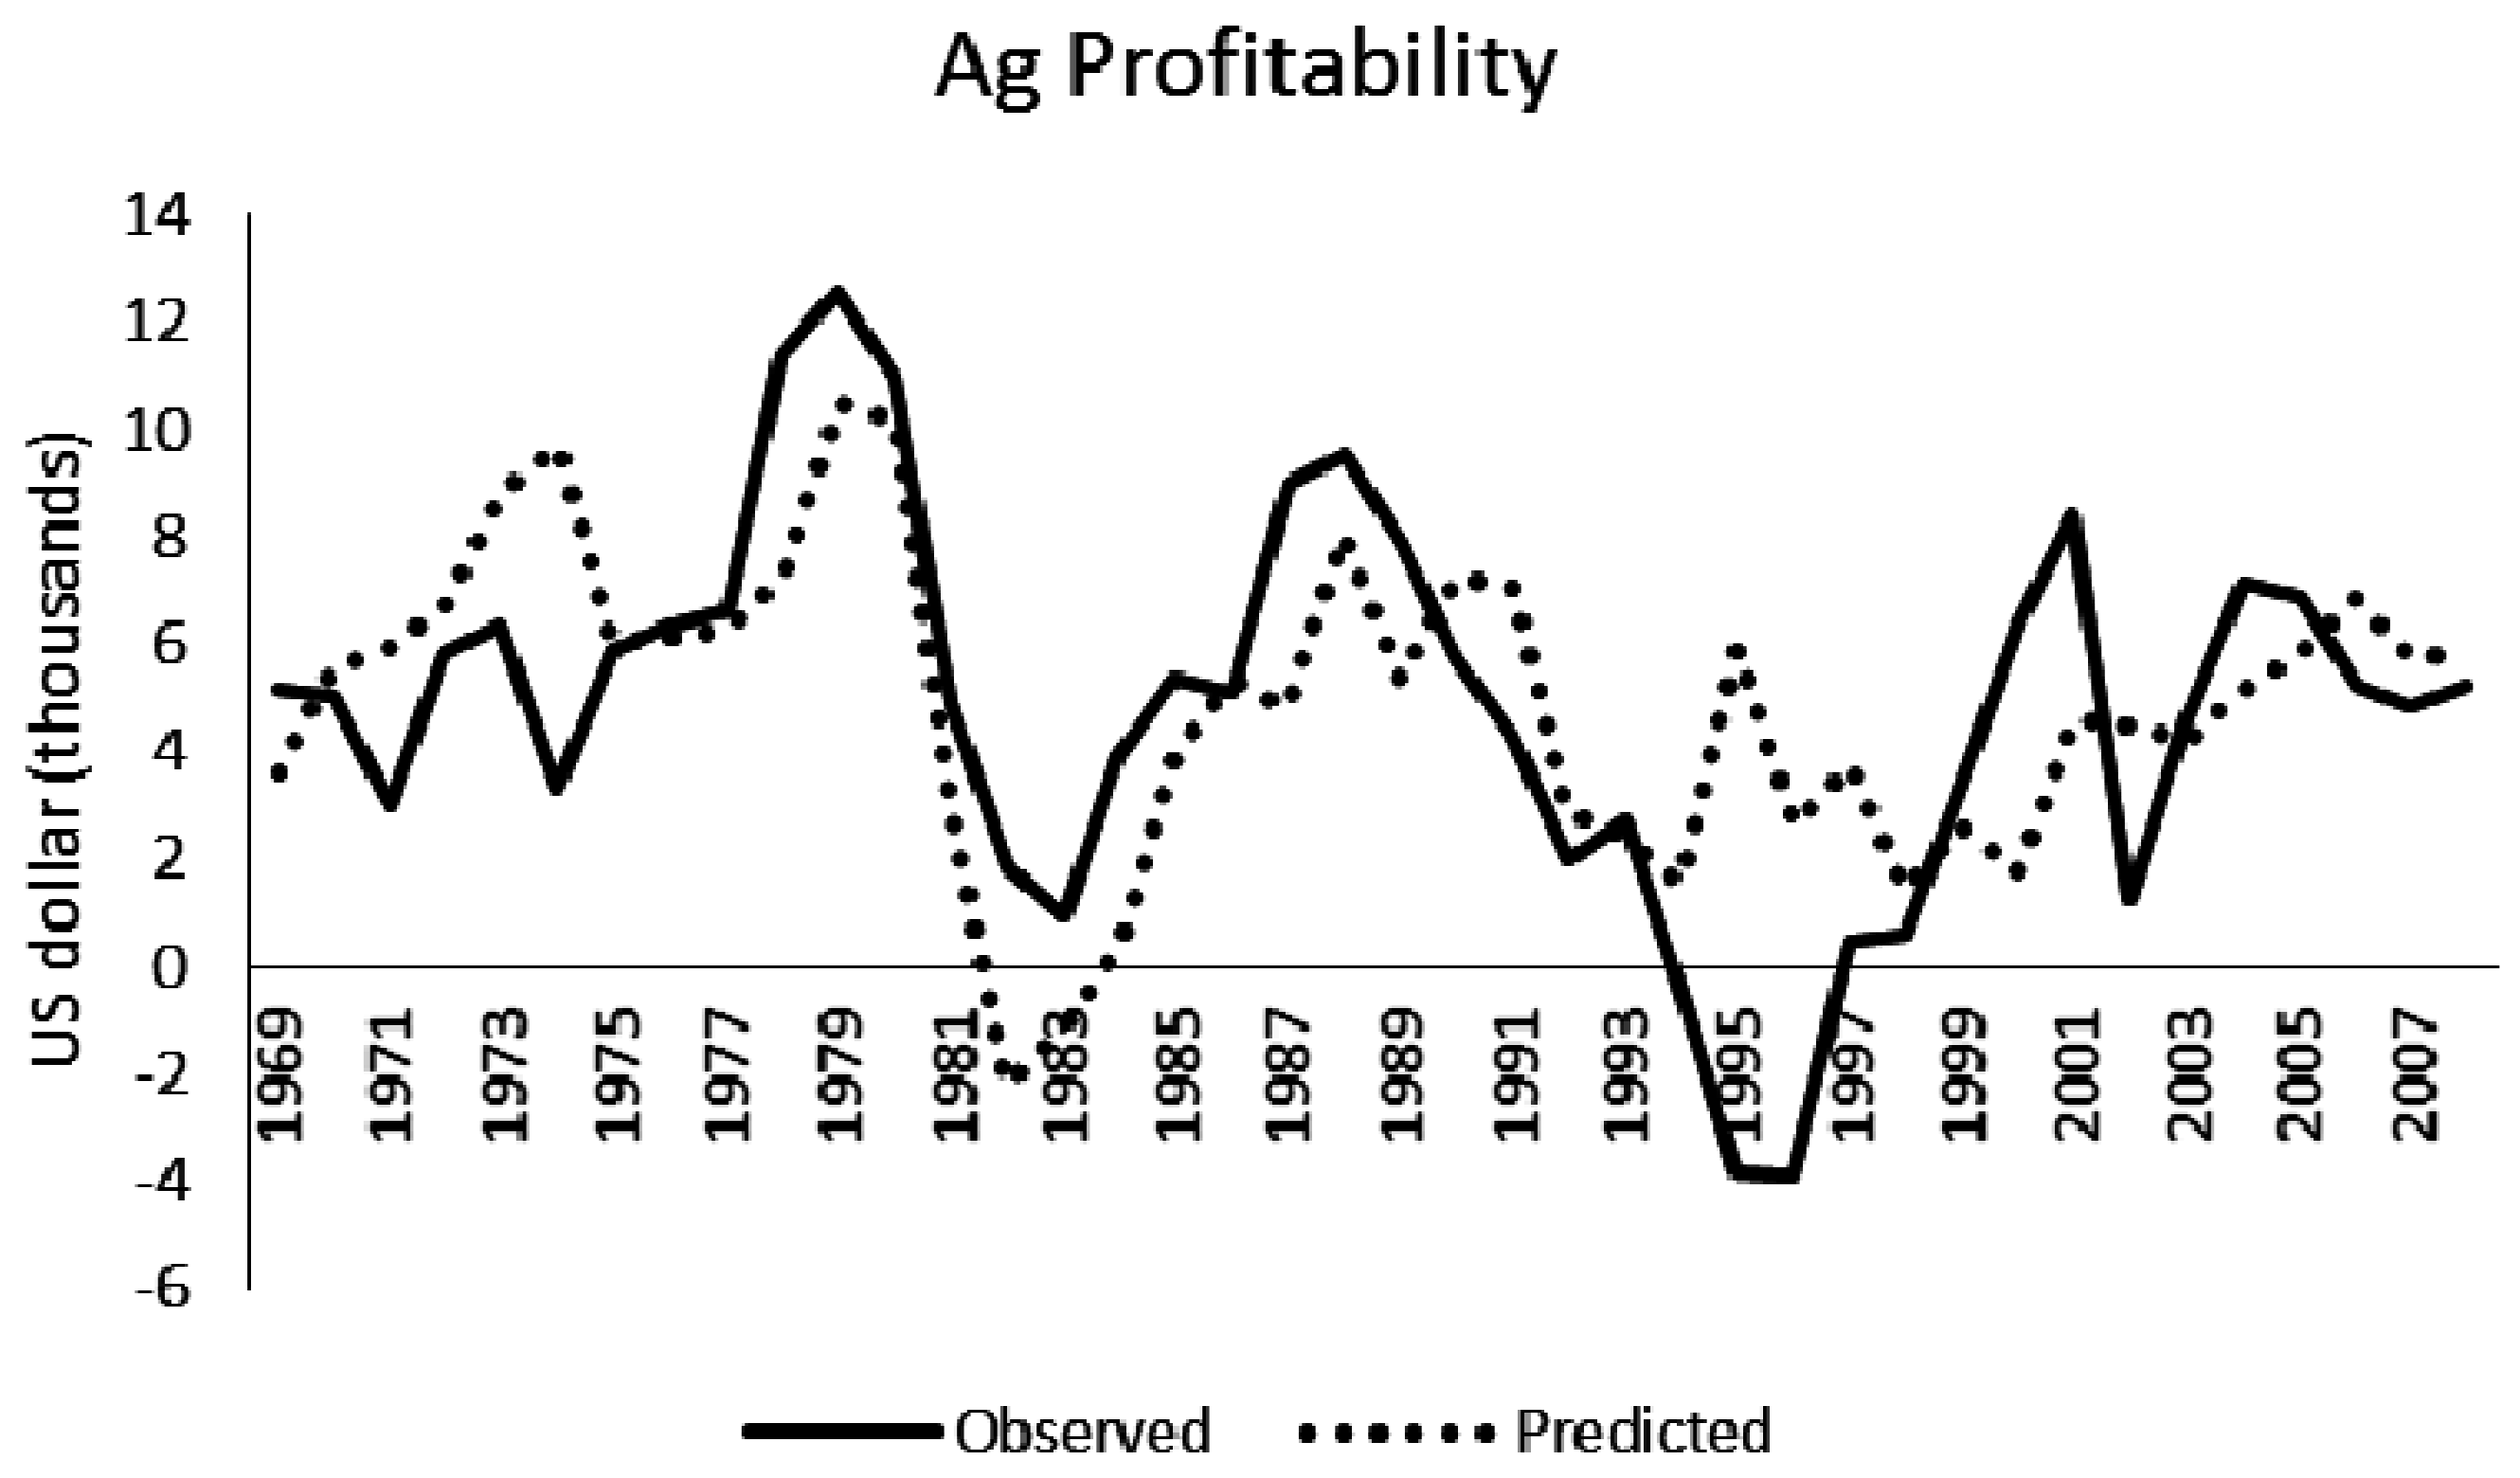
3.1. Calibration Analysis of Behavior Reproduction and Theil Inequality Tests
3.2. Sensitivity Analyses
3.3. Contributions to and Implications for Advancing Knowledge about Acequias
- A large number of socio-economic parameters showed only small numerical sensitivities in model outputs (Table 6). This is useful since many of the anecdotal leverage points identified by acequia researchers has hinged on socio-economic factors but with little confidence about which factors are expected to be more impactful than others. Our initial results give the first model-driven prioritization of socio-economic factors capable of changing behavior of multiple acequia components as well as identifies several gaps in available data (e.g., community demographic and employment effect on acequia participation; cumulative income effect on time spent in agriculture) that, if closed, would likely yield extremely valuable new qualitative insights and allow model refinement in the future.
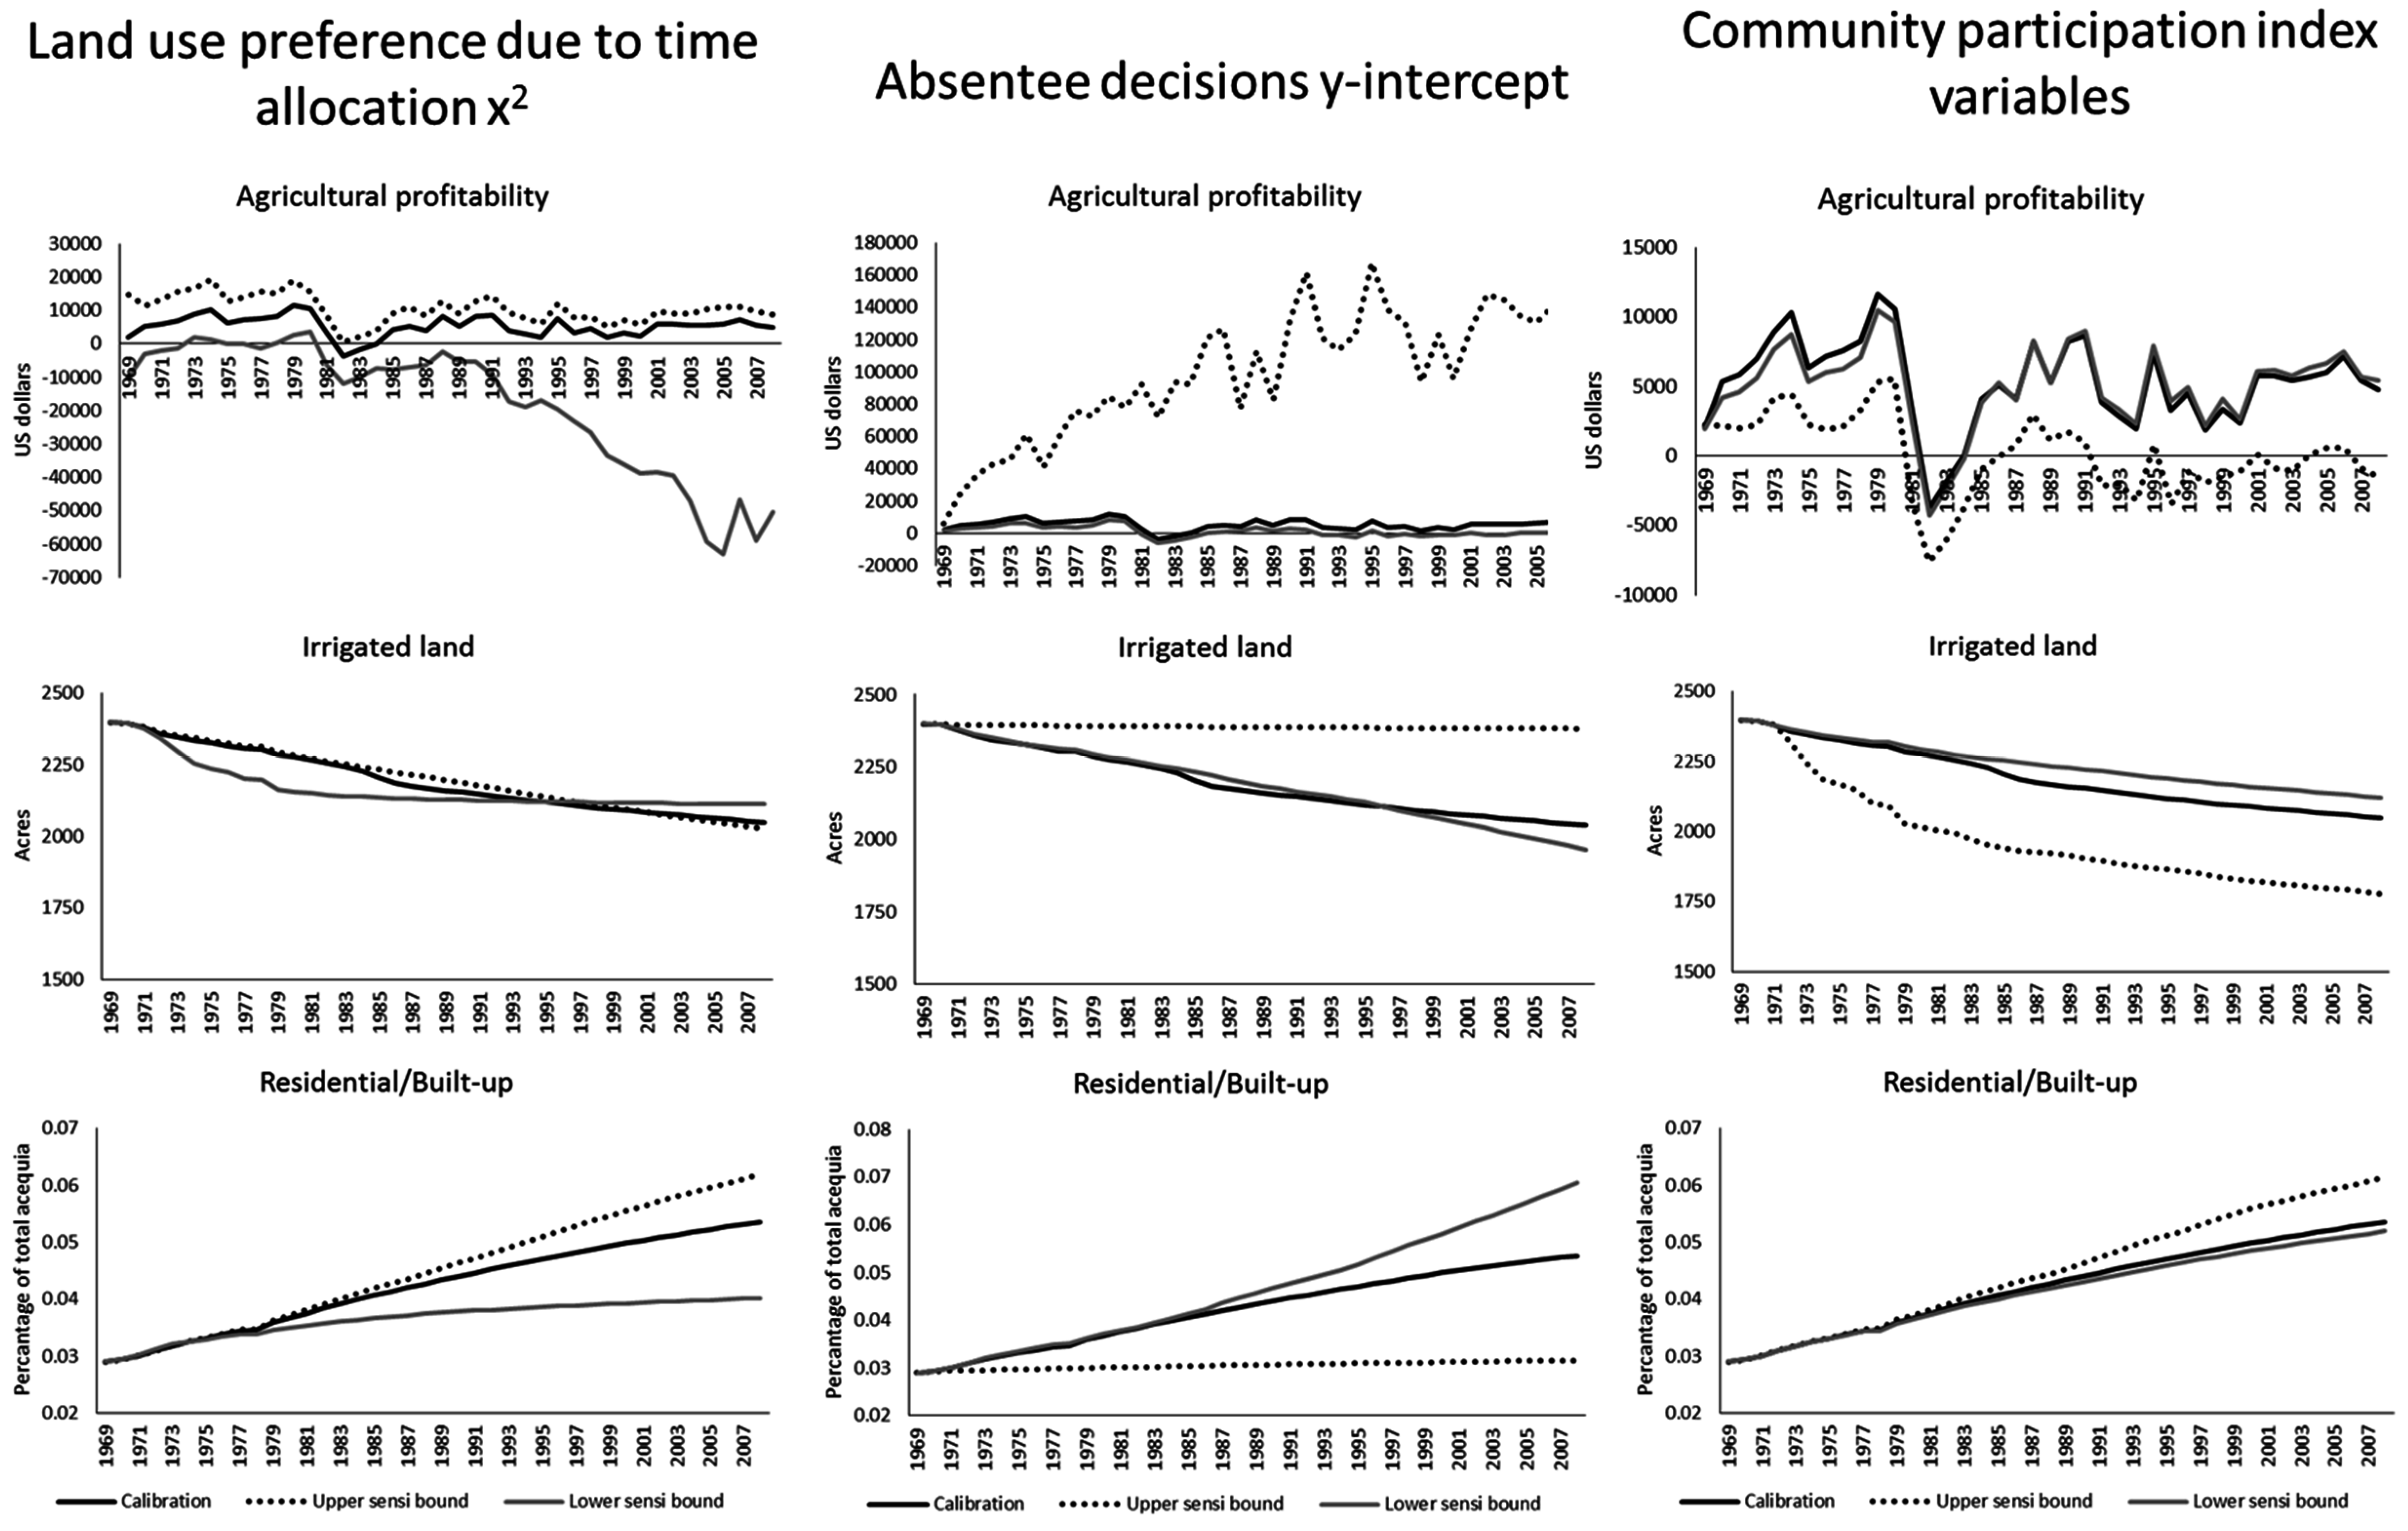
- Agricultural profitability and land uses (agricultural or residential/built-up) were strongly influenced by time management of irrigators (i.e., decisions to commute outside the acequia for work; a function of agricultural activities, land use preference, and acequia mutualism). As irrigators continue to struggle to maintain profitability, more time is spent away from the acequia, which shifts land use preferences and therefore agricultural revenue potential, which provided fewer incentives to maintain land in agriculture.
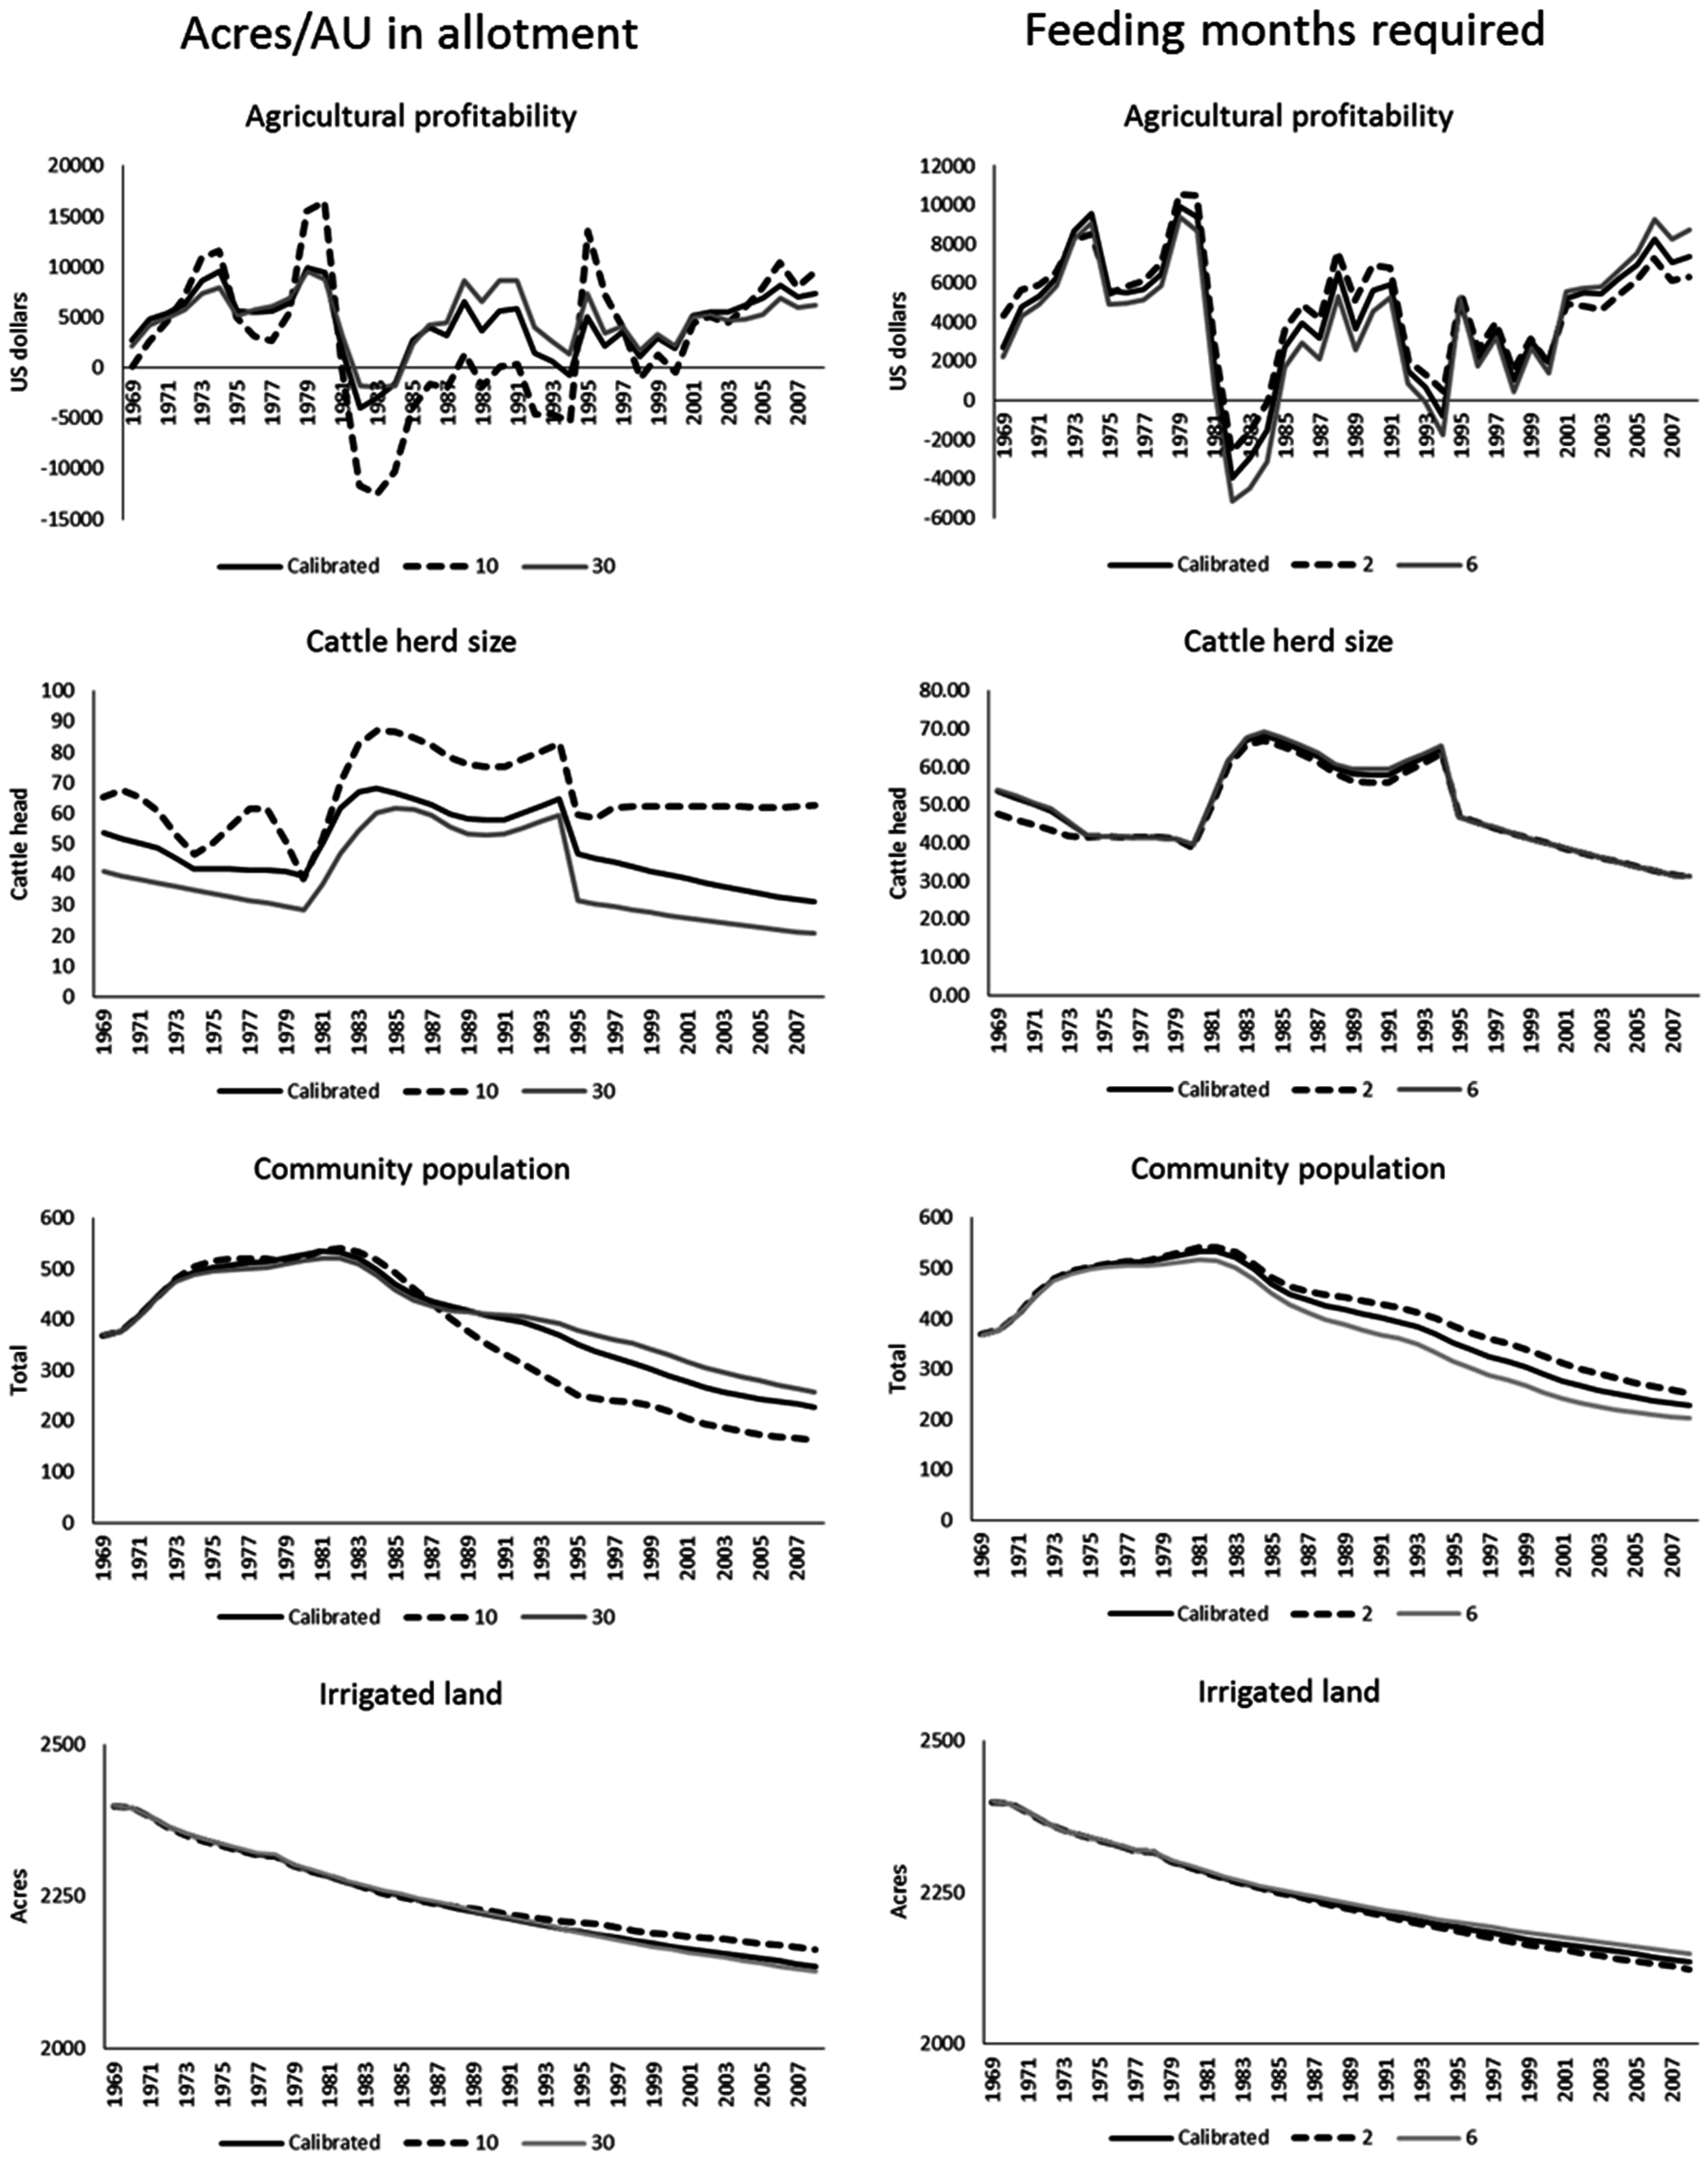
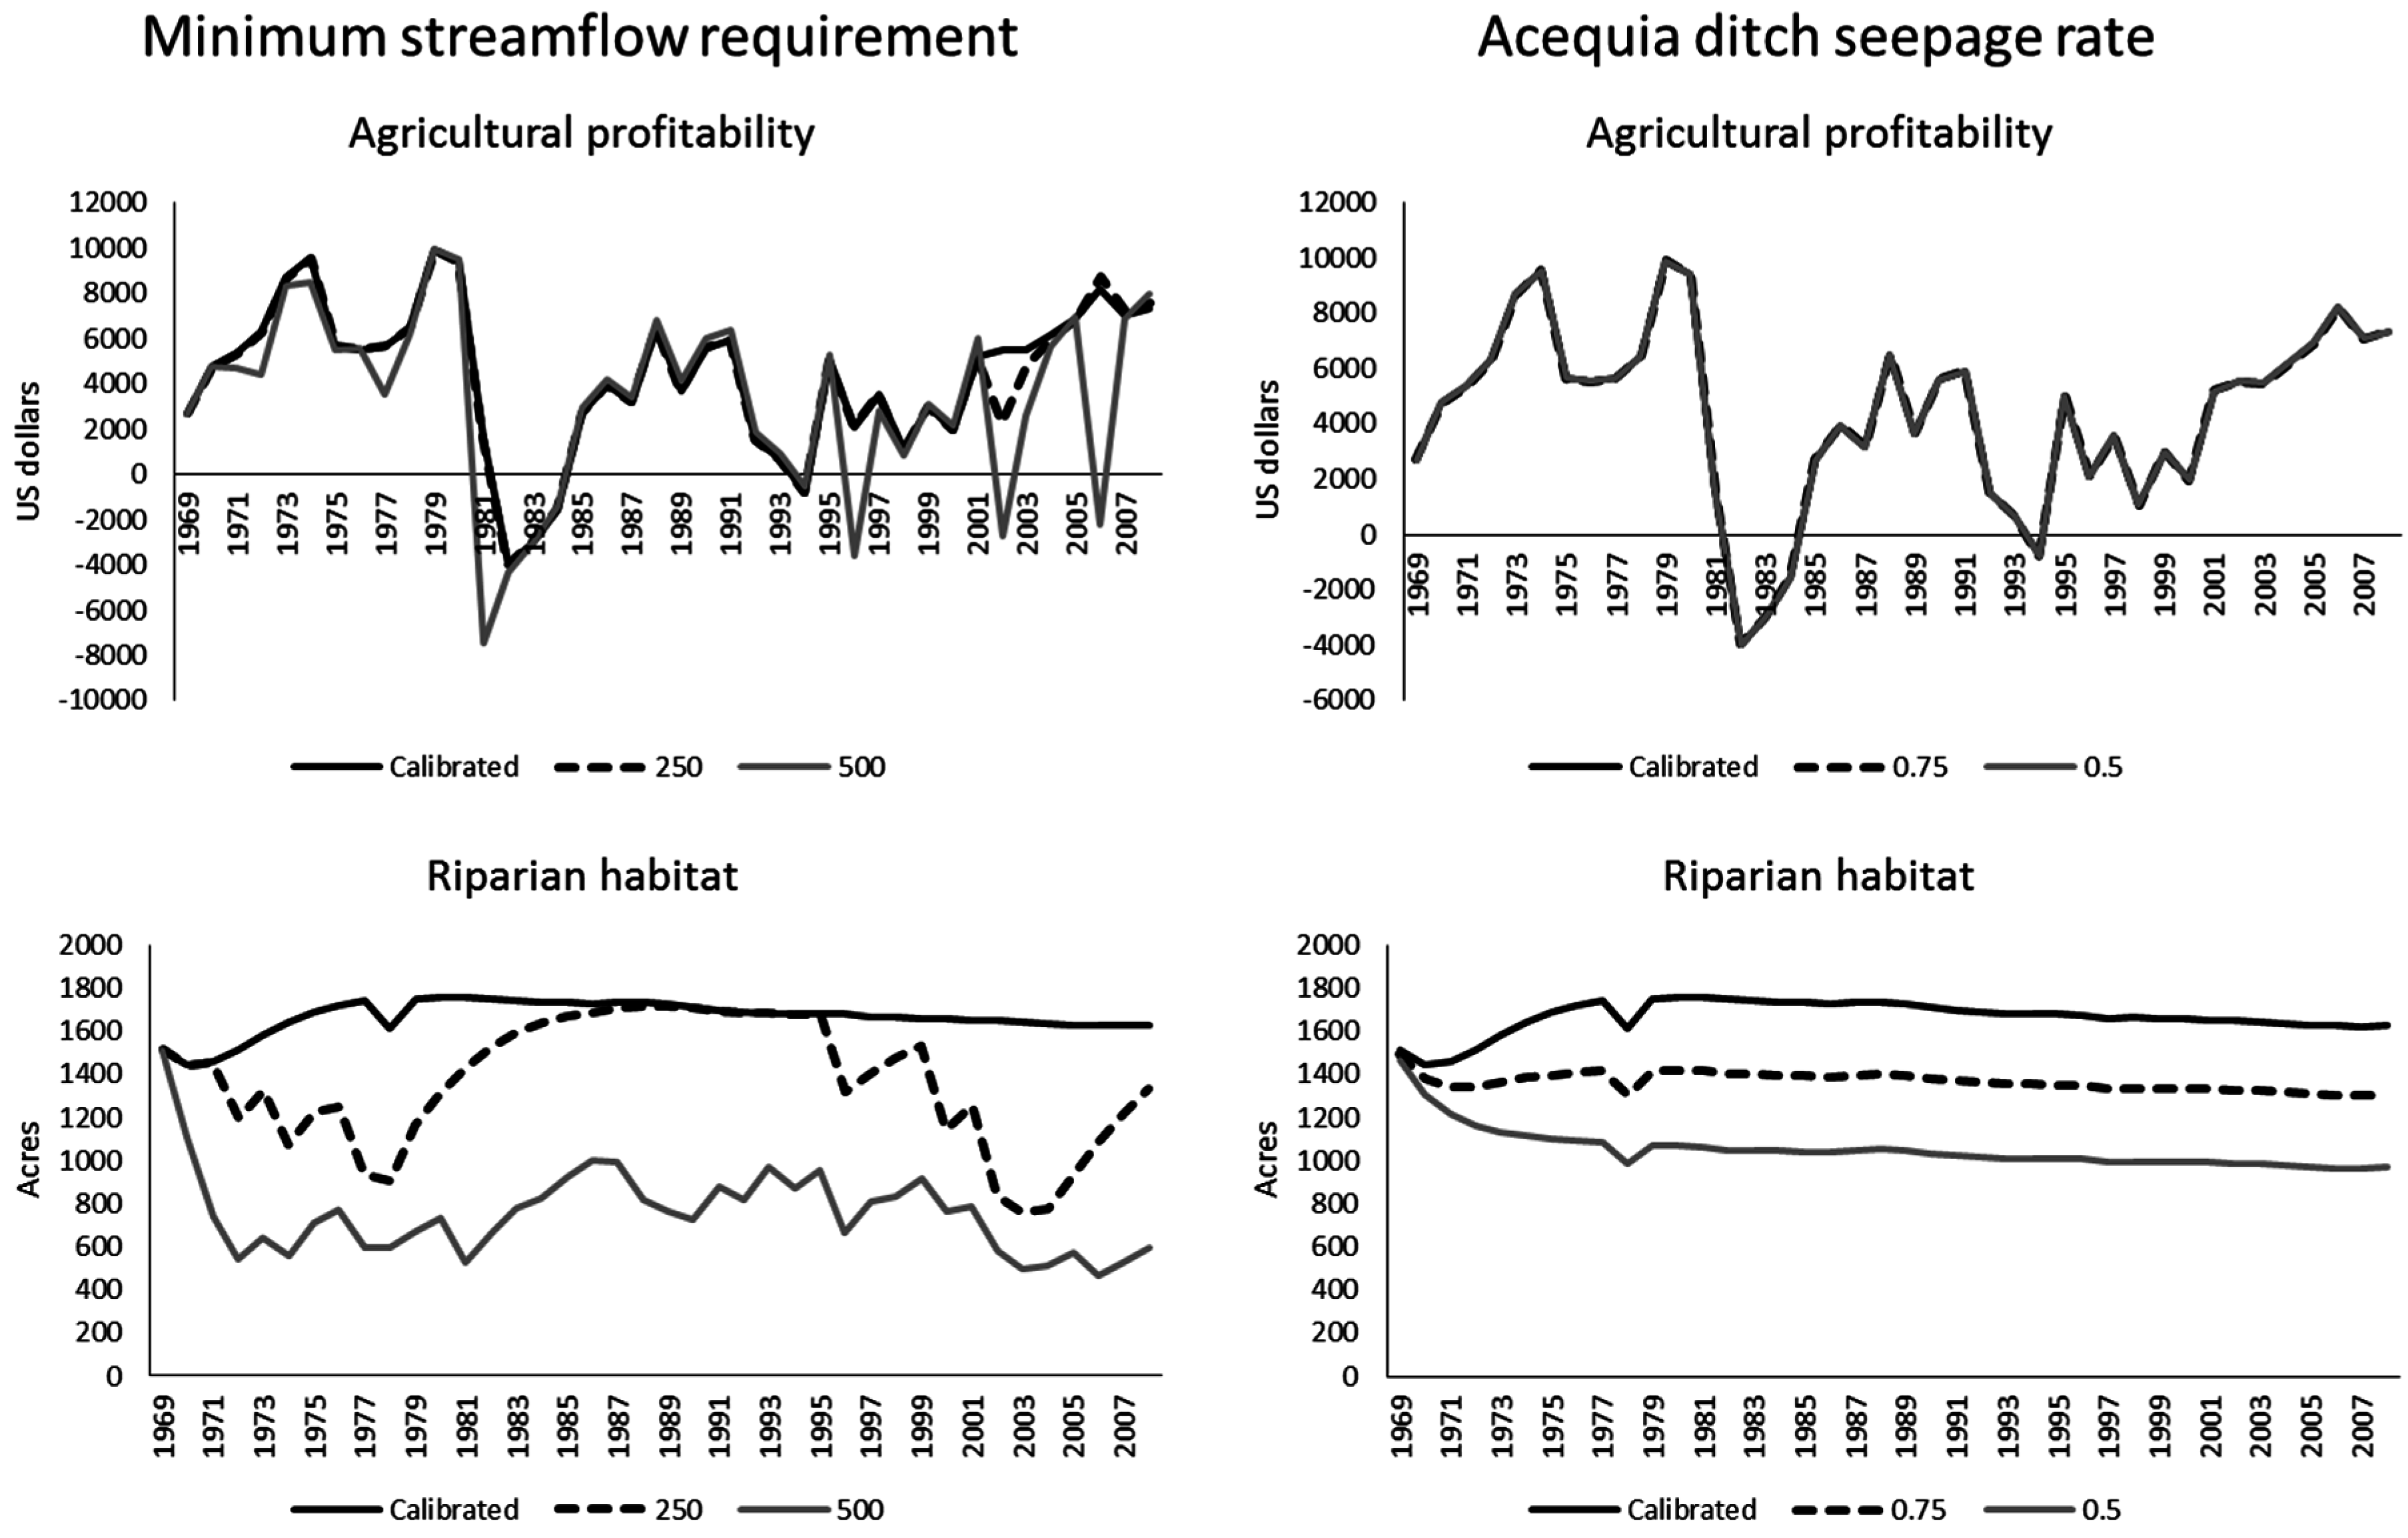
- Although fewer sensitive outputs were identified from the biophysical tests, those biophysical parameters that did cause sensitivities highlight key system linkages needed to understand potential impacts to acequias in the future. For example, changes in acres per animal unit, feed required per month, months needed to feed livestock, or minimum streamflow requirement created sensitivities in agricultural profitability, cattle herd size, community size, or residential land, each with similar pathways identified during socio-economic parameter tests, particularly cascading and reinforcing dynamics among agricultural profit (e.g., grazing parameters shifted cattle herd size → cattle herd size was linked to agricultural profit → agricultural profit feedbacks to herd expansion or culling decisions; community size was linked to community demographics and residential land → residential land was linked to irrigated land → irrigated land was linked agricultural profit → agricultural profit feedbacks to adjust time in agriculture and therefore irrigated land). Such physical leverage points (grazing area; water availability) have also been quantified in similar sociohydrology models (e.g., [20,21]).
- Although most data pertaining to irrigator time management, land use decisions, and acequia mutualism has remained qualitative in nature, the importance of these variables and their relationship to acequia mutualism has been stressed (e.g., [4,7,8]). Our model is the first quantitative, process based framework that corroborates those findings, while also identifying several key socio-economic processes that are likely the leading indicators of acequia resilience (community demographics, irrigator employment and time management, and farm size) and which to devote future research efforts.
- Therefore, the importance of community participation and acequia mutualism are critical for understanding the physical, social, and economic dynamics occurring within acequia communities (which corroborates similar applied sociohydrology models [18,19,20,21]). The linkages described and sensitivities identified highlight important areas of risk as well as leverage points that can effect change to the acequia community system (e.g., altering time spent in agriculture can effect change in acequia land use, community, hydrology, and mutualism), which should prove useful during future stakeholder outreach opportunities as well as modeling applications, including scenario testing to identify areas of resiliency and vulnerability of acequias from internal factors, climate change and urbanization.
4. Conclusions
Supplementary Materials
Acknowledgments
Author Contributions
Conflicts of Interest
References
- Ackerly, N.W. A Review of the Historic Significance and Management Recommendations for Preserving New Mexico’s Acequia Systems; Historic Preservation Division: Santa Fe, NM, USA, 1996. [Google Scholar]
- Mayagoitia, L.; Hurd, B.; Rivera, J.; Guldan, S. Rural Community Perspectives on Preparedness and Adaptation to Climate-Change and Demographic Pressure. J. Contemp. Water Res. Educ. 2012, 147, 49–62. [Google Scholar] [CrossRef]
- Fernald, A.; Tidwell, V.; Rivera, J.; Rodriguez, S.; Guldan, S.; Steele, C.; Ochoa, C.; Hurd, B.; Ortiz, M.; Boykin, K.; et al. Modeling Sustainability of Water, Environment, Livelihood, and Culture in Traditional Irrigation Communities and Their Linked Watersheds. Sustainability 2012, 4, 2998–3022. [Google Scholar] [CrossRef]
- Fernald, A.G.; Baker, T.T.; Guldan, S.J. Hydrologic, Riparian, and Agroecosystem Functions of Traditional Acequia Irrigation Systems. J. Sustain. Agric. 2007, 30, 147–171. [Google Scholar] [CrossRef]
- Fernald, A.G.; Yeliz Cevik, S.; Ochoa, C.G.; Tidwell, V.C.; Phillip King, J.; Guldan, S.J. River Hydrograph Retransmission Functions of Irrigated Valley Surface Water-Groundwater Interactions. J. Irrig. Drain. Eng. 2010, 136, 823–835. [Google Scholar] [CrossRef]
- Cox, M.; Ross, J.M. Robustness and vulnerability of community irrigation systems: The case of the Taos Valley acequias. J. Environ. Econ. Manag. 2011, 61, 254–266. [Google Scholar] [CrossRef]
- Rodrigeuz, S. Acequia: Water Sharing, Scarcity, and Place; School for Advanced Research Press: Santa Fe, NM, USA, 2006. [Google Scholar]
- Rivera, J.A. Acequia Culture: Water, Land, and Community in the Southwest; University of New Mexico Press: Albuquerque, NM, USA, 1998. [Google Scholar]
- Brierly, G.; Fryirs, K.; Vikrant, J. Landscape connectivity: the geographic basis of geomorphic applications. Area 2006, 38, 165–174. [Google Scholar] [CrossRef]
- US Bureau of Economic Analysis. Regional Economic Accounts, Tables CA25 and CA25N, Total Employment by Major SIC (NAICS) Industry. 2013. Available online: http://bea.gov/regional/downloadzip.cfm (accessed on 18 October 2013). [Google Scholar]
- US Bureau of Economic Analysis. Regional Economic Accounts, Table CA45, Farm Income and Expenses. 2013. Available online: http://bea.gov/regional/downloadzip.cfm (accessed on 18 October 2013). [Google Scholar]
- Sabie, R.; Cruz, J.J.; Turner, B.L.; Moreno, A.L.; Hewitt, L. Land use assessment of acequia irrigated valleys using multi-date aerial imagery. In Proceedings of the American Water Resources Association Annual Conference, Denver, CO, USA, 16–19 November 2015.
- Fernald, A.G.; Guldan, S.J. Surface Water-Groundwater Interactions between Irrigation Ditches, Alluvial Aquifers, and Streams. Rev. Fish. Sci. 2006, 14, 79–89. [Google Scholar] [CrossRef]
- Ochoa, C.G.; Fernald, A.G.; Guldan, S.J.; Shukla, M.K. Deep Percolation and Its Effects on Shallow Groundwater Level Rise Following Flood Irrigation. Trans. Am. Soc. Agric. Biol. Eng. 2007, 50, 73–81. [Google Scholar]
- Ochoa, C.G.; Fernald, A.G.; Guldan, S.J.; Shukla, M.J. Water Movement through a Shallow Vadose Zone: A Field Irrigation Experiment. Vadose Zone J. 2009, 8, 414–425. [Google Scholar] [CrossRef]
- Martinez-Fernandez, J.; Esteve-Selma, M.A.; Calvo-Sendin, J.F. Environmental and Socioeconomic Interactions in the Evolution of Traditional Lands: A Dynamic System Model. Hum. Ecol. 2000, 28, 279–299. [Google Scholar] [CrossRef]
- Morrison, R.R.; Stone, M.C. Investigating environmental flows for riparian vegetation recruitment using system dynamics modelling. River Res. Appl. 2015, 31, 485–496. [Google Scholar] [CrossRef]
- Elshafei, Y.; Sivapalan, M.; Tonts, M.; Hipsey, M.R. A prototype framework for models of sociohydrology: Identification of key feedback loops with application to two Australian casestudies. Hydrol. Earth Syst. Sci. 2014, 18, 2141–2166. [Google Scholar] [CrossRef]
- Van Emmerik, T.; Li, Z.; Sivapalan, M.; Pande, S.; Kandasamy, J.; Savenije, H.H.G.; Chanan, A.; Vigneswaran, S. Socio-hydrologic modeling to understand and mediate the competition for water between agriculture development and environmental health: Murrumbidgee River basin, Australia. Hydrol. Earth Syst. Sci. 2014, 18, 4239–4259. [Google Scholar] [CrossRef]
- Pande, S.; Savenije, H.H.G. A sociohydrological model for smallholder farmers in Maharashtra, India. Water Resour. Res. 2016, 52, 1923–1947. [Google Scholar] [CrossRef]
- Elshafei, Y.; Tonts, M.; Sivapalan, M.; Hipsey, M.R. Sensitivity of emergent sociohydrologic dynamics to internal system properties and external sociopolitical factors: Implications for water management. Water Resour. Res. 2016. [Google Scholar] [CrossRef]
- Weinberg, G.M. An Introduction to General Systems Thinking; Wiley-Interscience: New York, NY, USA, 1975. [Google Scholar]
- Jenerrette, G.D.; Barron-Gafford, G.A.; Guswa, A.J.; McDonnell, J.J.; Villegas, J.C. Organization of complexity in water limited ecohydrology. Ecohydrology 2012, 5, 184–199. [Google Scholar] [CrossRef]
- Sterman, J.D. Business Dynamics: Systems Thinking and Modeling for a Complex World; McGraw-Hill: New York, NY, USA, 2000. [Google Scholar]
- Tidwell, V.C.; Passell, H.D.; Conrad, S.H.; Thomas, R.P. System dynamics modeling for community-based water planning: Application to the Middle Rio Grande. Aquat. Sci. 2004, 66, 357–372. [Google Scholar] [CrossRef]
- Stave, K.A. A system dynamics model to facilitate public understanding of water management options in Las Vega, Nevada. J. Environ. Manag. 2003, 67, 303–313. [Google Scholar] [CrossRef]
- Khan, S.; Yufeng, L.; Ahmad, A. Analysing complex behaviour of hydrological systems through a system dynamics approach. Environ. Model. Softw. 2009, 24, 1363–1372. [Google Scholar] [CrossRef]
- Shanshan, D.; Lanhai, L.; Honggang, X. The system dynamics study of regional development of Manas Basin under the constraints of water resources. In Proceedings of the 2010 International Conference of the System Dynamics Society, Seoul, South Korea, 25–29 July 2010.
- Ewers, M.E. Combining Hydrology and Economics in a System Dynamics Approach: Modeling Water Resources for the San Juan Basin. In Proceedings of the 2005 International Conference of the System Dynamics Society, Boston, MA, USA, 17–21 July 2005.
- Nandalal, K.D.; Simonovic, S.P. Resolving conflicts in water sharing: a systemic approach. Water Resour. Res. 2003, 39, 1362. [Google Scholar] [CrossRef]
- Stave, K.A. Using system dynamics to improve public participation in environmental decisions. Syst. Dyn. Rev. 2002, 18, 139–167. [Google Scholar] [CrossRef]
- Winz, I.; Brierly, G.; Trowsdale, S. The Use of System Dynamics Simulation in Water Resources Management. Water Resour. Manag. 2009, 23, 1301–1323. [Google Scholar] [CrossRef]
- Van den Belt, M.J. Mediated Modeling—A System Dynamics Approach to Environmental Consensus Building; Island: Washington, DC, USA, 2004. [Google Scholar]
- Tidwell, V.C.; van den Brink, C. Cooperative Modeling: Linking Science, Communication, and Ground Water Planning. Ground Water 2008, 46, 174–182. [Google Scholar] [CrossRef] [PubMed]
- Deaton, M.L.; Winebrake, J.J. Dynamic Modeling of Environmental Systems; Springer Science + Business Media, Inc.: New York, NY, USA, 2000. [Google Scholar]
- Grant, W.E.; Pedersen, E.K.; Marin, S.L. Ecology & Natural Resource Management: Systems Analysis and Simulation; John Wiley & Sons: New York, NY, USA, 1997. [Google Scholar]
- Ford, A. Modeling the Environment; Island Press: Washington, DC, USA, 2009. [Google Scholar]
- Alexrk. USA New Mexico Location Map. Wikipedia, Creative Commons Distribution. 2009. Available online: https://upload.wikimedia.org/wikipedia/commons/thumb/1/10/USA_New_Mexico_location_map.svg/200px-USA_New_Mexico_location_map.svg.png (accessed on 31 August 2009).
- “Alcalde, NM” 36°5′13.54″ N and 106°3′40.14″ W. Google Earth, 2013. Available online: https://www.google.com/maps/place/36%C2%B005'13.5%22N+106%C2%B003'40.1%22W/@36.0870987,-106.0786595,4944m/data=!3m1!1e3!4m5!3m4!1s0x0:0x0!8m2!3d36.0870944!4d-106.06115 (accessed on 1 September 2015).
- New Mexico Acequia Association. Regional Acequia Associations. Available online: http://www.lasacequias.org/wp/wp-content/uploads/2013/10/regional_associations_8.5x11.pdf (accessed on 7 July 2016).
- Lane, D.C. Social theory and system dynamics practice. Eur. J. Oper. Res. 1999, 113, 501–527. [Google Scholar] [CrossRef]
- Oliva, R. Model calibration as a testing strategy for system dynamics models. Eur. J. Oper. Res. 2003, 151, 552–568. [Google Scholar] [CrossRef]
- Glover, C.R.; Foster, C.L.; Baker, R.D. Irrigated Pastures for New Mexico; Circular 494 New Mexico State Extension Service. 1997. Available online: http://cahe.nmsu.edu/pubs/_circulars/circ494.pdf (accessed on 29 November 2006).
- Steduto, P.; Hsiao, T.C.; Fereres, E.; Raes, D. Crop Yield Response to Water; Food and Agriculture Organization of the United Nations: Rome, Italy, 2012. [Google Scholar]
- Roach, J.D. Integrated Surface Water Groundwater Modeling in the Upper Rio Grande in Support of Scenario Analysis. Ph.D. Thesis, University of Arizona, Tucson, AZ, USA, 19 March 2007. [Google Scholar]
- Hargreaves, G.H. Moisture availability and crop production. Trans. ASAE 1975, 18, 980–984. [Google Scholar] [CrossRef]
- Hargreaves, G.H.; Allen, R.G. History and evaluation of Hargreaves evapotranspiration equation. J. Irrig. Drain. Eng. ASCE 2003, 129, 53–63. [Google Scholar] [CrossRef]
- Hargreaves, G.L.; Hargreaves, G.H.; Riley, J.P. Irrigation Water Requirements for Senegal River Basin. J. Irrig. Drain. Eng. ASCE 1985, 111, 265–275. [Google Scholar] [CrossRef]
- Sterman, J.D. Appropriate summary statistics for evaluating the historical fit of system dynamics models. Dynamica 1984, 10, 51–66. [Google Scholar]
- Oliva, R. A Vensim Module to Calculate Summary Statistics for Historical Fit. 1995. Available online: http://metasd.com/wp-content/uploads/2010/03/D4584theil.pdf (accessed on 10 October 2016).
- Tedeschi, L.O. Assessment of the adequacy of mathematical models. Agric. Syst. 2006, 89, 225–247. [Google Scholar] [CrossRef]
- Eker, S.; Slinger, J.; van Daalen, E.; Yücel, G. Sensitivity analysis of graphical functions. Syst. Dyn. Rev. 2014, 30, 186–205. [Google Scholar] [CrossRef]
- Pang, H.; Makarechian, M.; Basarab, J.A.; Berg, R.T. Structure of a dynamic simulation model for beef production systems. Can. J. Anim. Sci. 1999, 79, 409–417. [Google Scholar] [CrossRef]
- Kahn, H.E.; Lehrer, A.R. A dynamic model for the simulation of cattle herd production systems: Part 3—Reproductive performance of beef cows. Agric. Syst. 1984, 13, 143–159. [Google Scholar] [CrossRef]
- Tess, M.W.; Kolstad, B.W. Simulation of cow-calf production systems in a range environment: II model evaluation. J. Anim. Sci. 2000, 78, 1170–1180. [Google Scholar] [CrossRef] [PubMed]
- Turner, B.L.; Rhoades, R.D.; Tedeschi, L.O.; Hanagriff, R.D.; McCuistion, K.C.; Dunn, B.H. Analyzing ranch profitability from varying cow sales and heifer replacement rates for beef cow-calf production using system dynamics. Agric. Syst. 2013, 114, 6–14. [Google Scholar] [CrossRef]
- Turner, B.L.; Wuellner, M.; Nichols, T.; Gates, R.; Tedeschi, L.O.; Dunn, B.H. Development and Evaluation of a System Dynamics model for Investigating Agriculturally Driven Land Transformation in the North Central United States. Nat. Resour. Model. 2016, 29, 179–228. [Google Scholar] [CrossRef]
- Van Horn, R.L. Validation of simulation results. Manag. Sci. 1971, 17, 247–258. [Google Scholar] [CrossRef]
- Hamilton, M.A. Model validation: An annotated bibliography. Commun. Stat. Theory Methods 1991, 20, 2207–2266. [Google Scholar] [CrossRef]


| Population 1 | Combined Employment 2 and Wages | Alcalde, NM Features | |||||||
|---|---|---|---|---|---|---|---|---|---|
| Year | Taos | Rio Arriba | Services | Govt. 3 | Ag. 4 | Mean Wage Rate 5 | Residents 6 | Cultivated Land 7 | Residential Land 7 |
| 1930 | 14,394 | 21,381 | - | - | - | - | - | - | - |
| 1940 | 18,528 | 25,352 | - | - | - | - | - | - | - |
| 1950 | 17,146 | 24,997 | - | - | - | - | - | - | - |
| 1960 | 15,934 | 24,193 | - | - | - | - | - | - | - |
| 1970 | 17,516 | 25,170 | 5295 | 3542 | 693 | $5143.00 | 400 | 2406 | 184 |
| 1980 | 19,456 | 29,282 | 7939 | 4825 | 1471 | $10,116.50 | - | 2329 | 194 |
| 1990 | 23,118 | 34,365 | 12,558 | 5136 | 1690 | $14,593.50 | 317 | - | - |
| 2000 | 29,979 | 41,190 | 18,733 | 6908 | 1993 | $21,238.50 | 377 | 2080 | 305 |
| 2010 | 32,937 | 40,246 | 20,649 | 7540 | 2316 | $30,447.00 | 285 | 1902 | 361 |
| Crop | Water Production Function | Units of Measure |
|---|---|---|
| Alfalfa | y = 0.15 + 0.13 × ET | y = [metric tons/ha] ET = [cm] |
| Pasture Grass | y = −2206 + 289z | z = water applied [inches] y = dry matter [lbs/acre] |
| Corn | y = −7309 + 238.9 × ET | y = [kg/ha] ET = [cm] |
| Grains 1 | y = −2323 + 157 × ET | y = [metric tons/ha] ET = [cm] |
| Miscellaneous Vegetables 2 | y = −38.9 + 135 × ET | y = [metric tons/ha] ET = [cm] |
| Chile Peppers 3 | y = −7.54 + 0.3327z | y = [ton/ha] z = water applied [cm] |
| Apple orchard 4 | y = 35.8853 + 0.3905 × ET | y = [lbs/acre] ET = [cm] |
| Crop-Type | April | May | June | July | August | September | October | Total |
|---|---|---|---|---|---|---|---|---|
| Orchards | 4.5 | 4.5 | 4.5 | 4.5 | 4.5 | 4.5 | 4.5 | 31.5 |
| Non-orchard | 5.6 | 5.6 | 5.6 | 5.6 | 5.6 | 5.6 | 5.6 | 39.4 |
| Qualitative Parameters | Input Variable (x) | Analytic Equation | Description of Dynamics Captured | System Building Block |
|---|---|---|---|---|
| Absentee decisions | Agriculture-time preference | y = −0.377x3 + 0.991x2− 0.9214x + 0.2964 | Captures acequia members willing to commute or relocate based on the opportunity cost of labor. | Economics and Time Management |
| Community demographic effect on participation | Percentage of community likely participating | y = 4.3125x2− 4.171x + 1.012 | Captures influence of irrigators remaining in agriculture to maintaining mutualism or the impact newcomers have on lowering mutualism. | Acequia Mutualism |
| Cumulative income effect on time in agriculture | Ratio of Cumulative Profit to Goal | x<0 → 0 → y = 1.31x − 0.001 | Captures the dynamics that total income (farm and off-farm) has on irrigator’s resiliency to remain in agriculture under adverse economic conditions. | Economics and Time Management |
| Cumulative profit-loss effect on land sales | Ratio of Cumulative Profit to Goal | y = 0.0744x2− 0.1162x + 0.047 | Captures the long-term financial pressure to sell land in order to maintain quality of life. | Land Use |
| Effect of employment on participation | Percentage time outside acequia | y = −4.137x4 + 5.294x3− 0.34x2 + 0.152x | Captures the effect that increased time in off-farm jobs has on decreasing time spent on acequia activities. | Acequia Mutualism |
| Farm size effect on participation | Working farm size | y = −0.0024x3 + 0.051x2− 0.3629x + 0.91 | Captures the influence of farm size has on participation, since smaller farms likely need off-farm financial support and therefore irrigators have less time to participate. | Acequia Mutualism |
| Generational transfer effect on land sales | Transfer rate goal | y = −0.063x3 + 0.1203x2− 0.079x + 0.02 | Captures the effect that keeping land in the family has on reducing land sales. | Land Use |
| Herd reductions from reduced management | Percentage time in agriculture | y = −0.2367x3 + 1.558x2− 2.142x + 0.84 | Captures the effect that less time in agriculture has on the ability to maintain historical herd levels. | Farm and Ranch Activities |
| Homestead size effect of reducing urban expansion | Homestead size | y = 0.0006x3− 0.0137x2 + 0.194x | Captures the impact of previous land fragmentation on current newcomer rates, since smaller plot sizes reduces land development potential. | Acequia Community |
| Land use preference due to time allocation | Monthly hours (labor) in agriculture | y = 5 × 10−7x3– 1 × 10−4x2− 0.0009x + 0.9098 | Captures the type of agricultural enterprise preferred based on irrigators time allotment. Less time in agriculture prefers pasture grass, while more time allocates more to grains/vegetables and orchards. | Land Use |
| Mutualism effect on time spent in acequia area-valley | Acequia mutualism | y = x | Captures the impact that acequia community engagement has on an individual's allocation to time in agriculture, as the level of engagement of remaining community members has a positive effect of each other’s decision to work in the acequia. | Economics and Time Management |
| Ratio of wage income in agriculture to external jobs | Ag profit/Opportunity cost of Labor | X < 0 → y = 0.0129x + 0.099 → y = −0.008x4 + 0.1103x3− 0.5279x2 + 1.0099x + 0.1206 | Captures to opportunity costs of working off-farm jobs relative to what financial returns are likely to be made on-farm. More positive values place more preference on agriculture, more negative values less preference. | Economics and Time Management |
| Short term profitability effect on land sales | Ag profit/Land lease rate | y = 0.209x2− 0.2084x + 0.0498 | Captures the short-term economic pressure to sell land if ag profit does not meet the land’s required rate of return (the lease rate). | Land Use |
| Calibration Estimates | |||||
|---|---|---|---|---|---|
| Theil Inequality Values | |||||
| Variable | r2 | Mean Bias | Mean | Variance | Covariance |
| Ag Profit | 0.51 | 10.25% | 0.000 | 0.029 | 0.971 |
| Stream flow | 0.99 | 10.2% | 0.008 | 0.279 | 0.713 |
| Cattle herd size | 0.85 | 0.001% | 0.351 | 0.482 | 0.167 |
| Irrigated acreage | 0.96 | 3.30% | 0.225 | 0.457 | 0.318 |
| Residential land (%) | 0.98 | 0.29% | 0.343 | 0.343 | 0.314 |
| Riparian habitat | 0.75 | 3.10% | 0.225 | 0.500 | 0.275 |
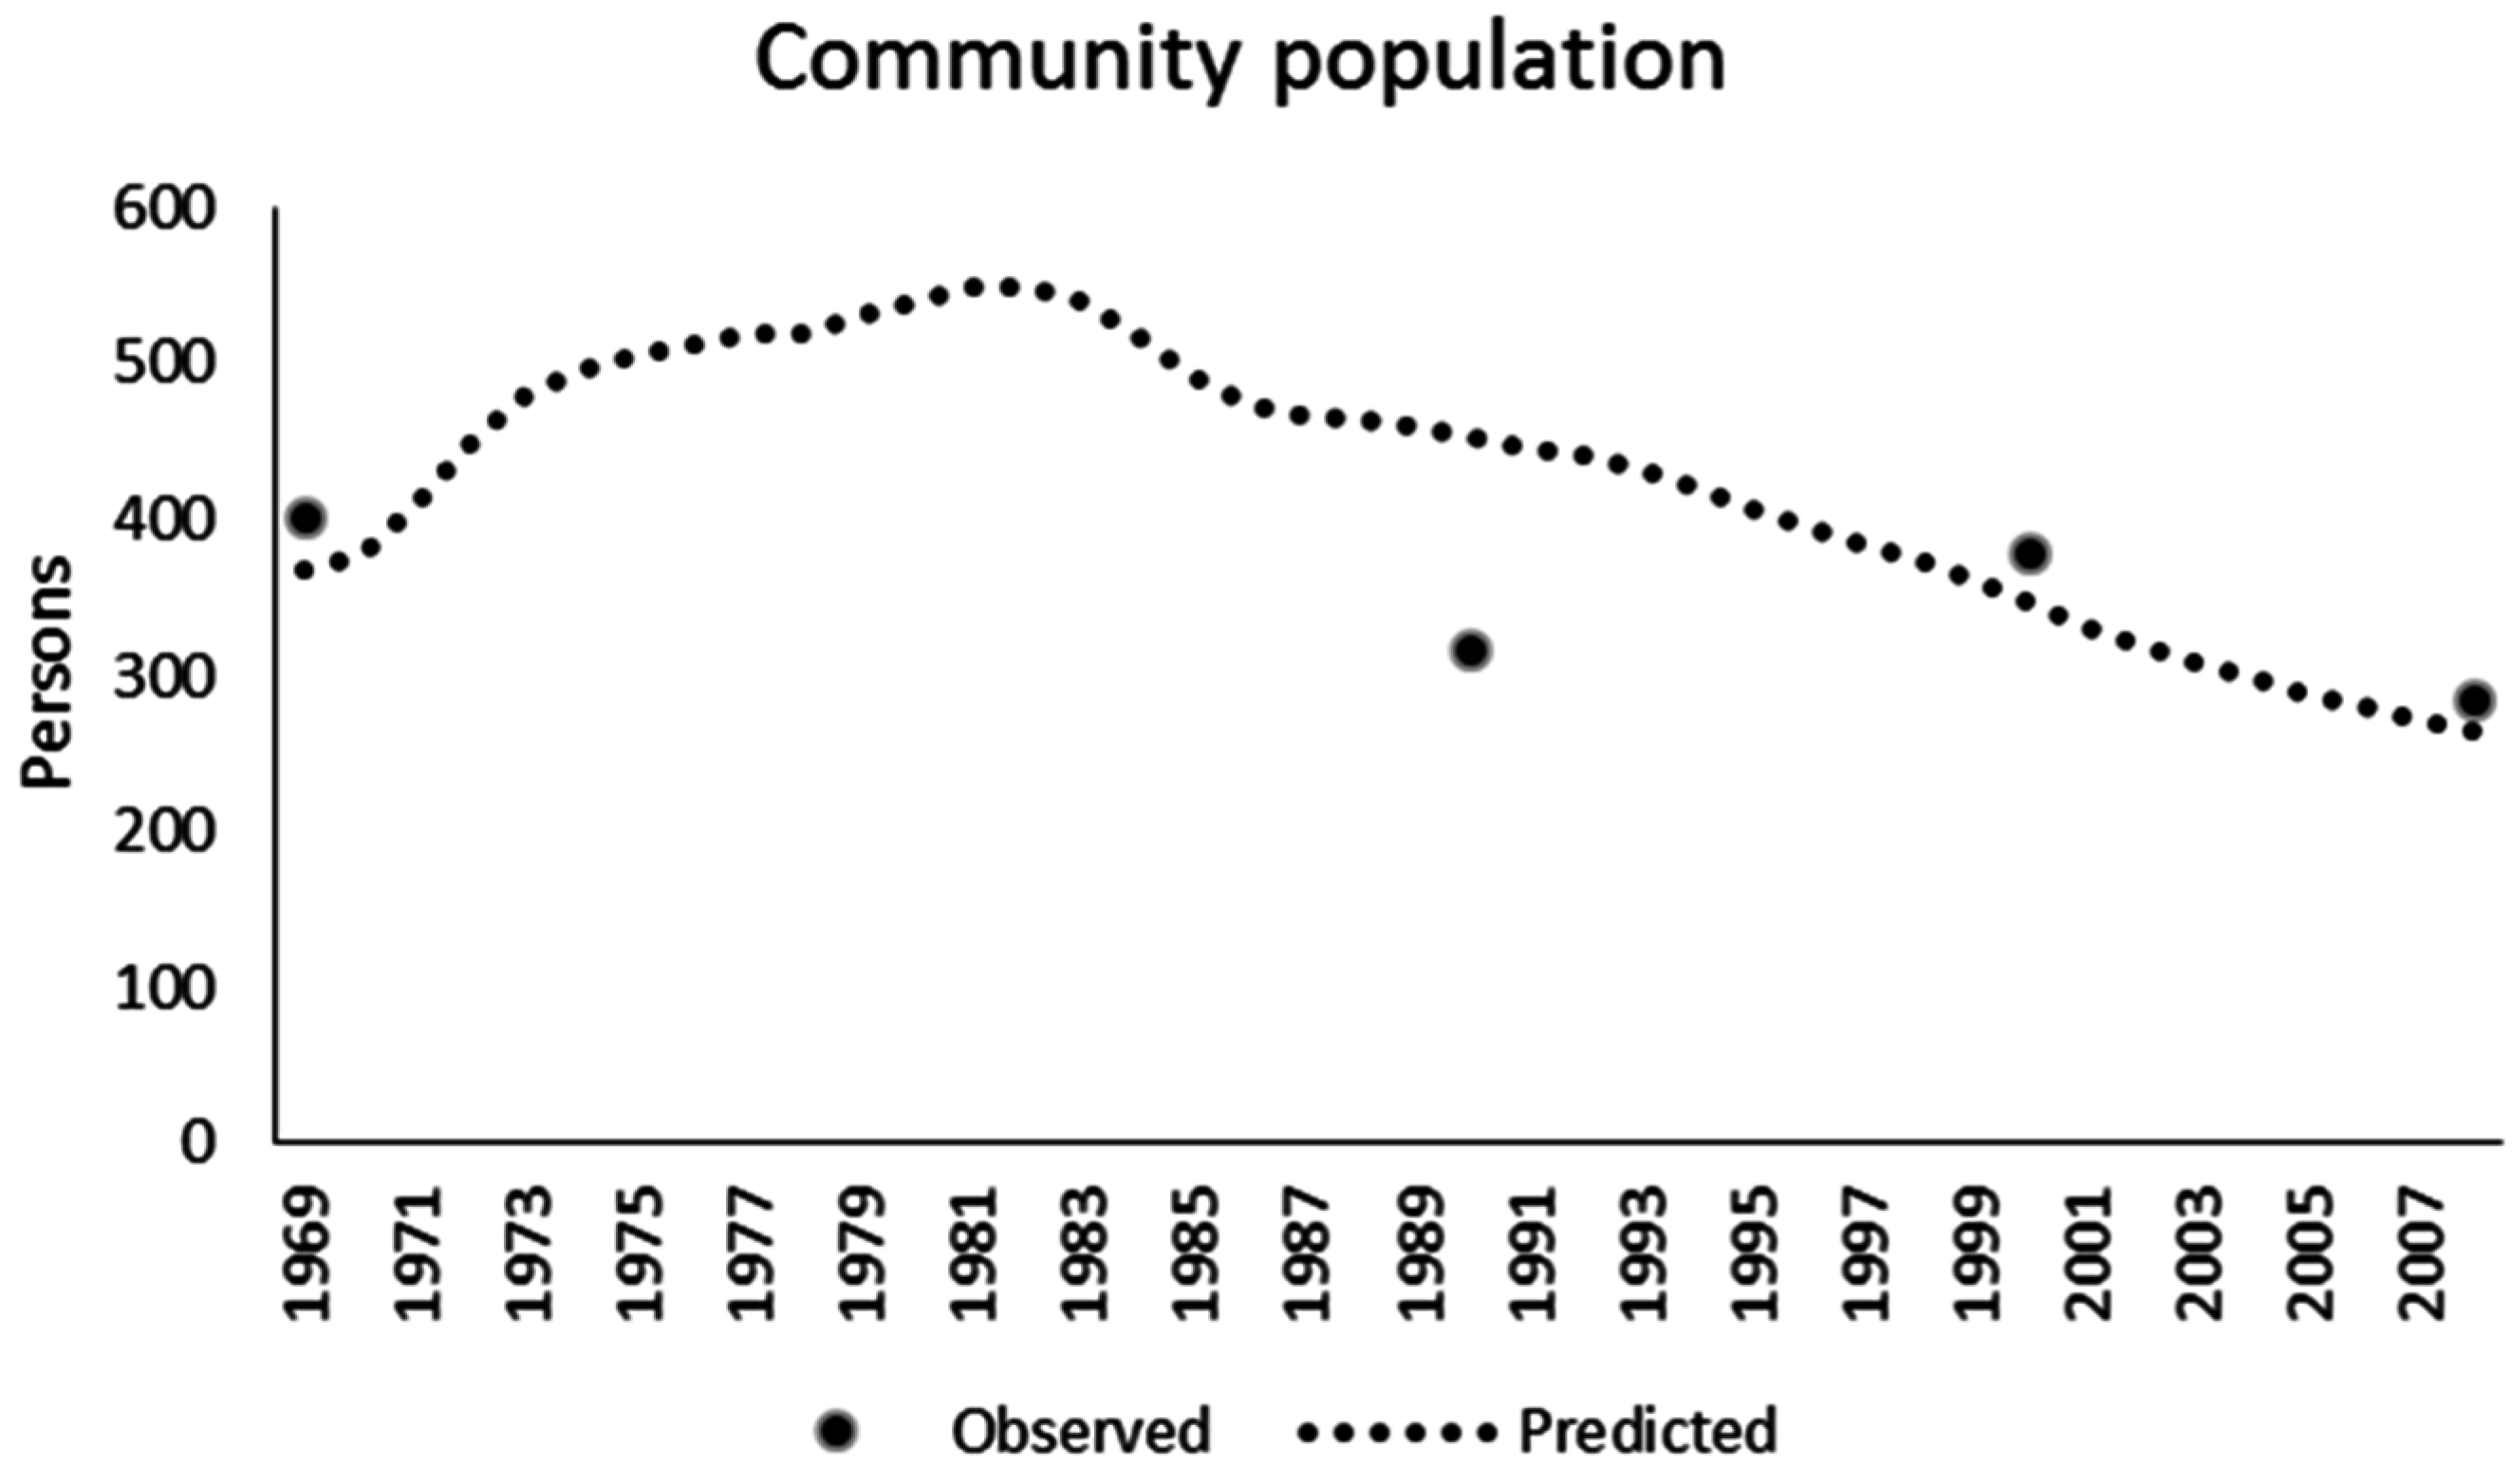
| Community pop. | 0.19 | 6.45% | - | - | - |
| Qualitative Parameters | Change in Effect (Calibrated) Variables | |||||
|---|---|---|---|---|---|---|
| Ag Profit | Stream Flow | Herd Size | Ag Land | Built Land | Riparian Habitat | |
| First screening elimination * | ||||||
| Generational transfer effect on land sales | No | No | No | No | No | No |
| Homestead size effect of reducing urban expansion | Yes | No | No | No | Yes | No |
| Short term profitability effect on land sales | No | No | No | No | No | No |
| Herd reductions from reduced management | No | No | No | No | No | No |
| Second screening elimination ** | ||||||
| Cumulative profit-loss effect on land sales | No | No | No | No | No | No |
| Mutualism effect on time spent in acequia area-valley | Yes | Yes | Yes | Yes | Yes | Yes |
| Ratio of wage income in agriculture to external jobs | Yes | Yes | Yes | Yes | Yes | Yes |
| Remaining variables of interest *** | ||||||
| Absentee decisions | Yes | No | No | No | Yes | No |
| Cumulative income effect on time in agriculture | Yes | Yes | Yes | Yes | Yes | Yes |
| Land use preference due to time allocation | Yes | No | No | No | Yes | Yes |
| Community participation variables # | ||||||
| Community demographic effect on participation | Yes | No | No | Yes | Yes | Yes |
| Effect of employment on participation | Yes | No | No | Yes | Yes | Yes |
| Farm size effect on participation | Yes | No | No | Yes | Yes | Yes |
| Variables Tested with Calibrated Parameter Values above and Adjusted Values Below, with Percent Difference from Calibration Mean. | |||||||||||
|---|---|---|---|---|---|---|---|---|---|---|---|
| Acres/AU = 20 | Feed/Month = 750 lb. | Months Feed Needed = 4 | Minimum Streamflow = 100 c.f.s. | Percentage Normal Acequia Seepage = 100% | |||||||
| Mean | 10 | 30 | 500 | 1000 | 2 | 6 | 250 | 500 | 75% | 50% | |
| Agricultural profitability | 4364 | 2710 * | 4742 | 4653 | 4042 | 4765 | 3932 * | 4281 | 3378 * | 4364 | 4364 |
| −46.8% | 8.3% | 6.4% | −7.7% | 8.8% | −10.4% | −1.9% | −25.5% | 0.0% | 0.0% | ||
| Herd size | 48 | 66 * | 38 * | 48 * | 49 * | 47 * | 49 * | 48 | 48 | 48 | 48 |
| 30.4% | −22.9% | −1.3% | 0.6% | −2.4% | 0.8% | 0.0% | 0.0% | 0.0% | 0.0% | ||
| Community population | 395 | 360 * | 405 | 408 | 382 | 414 | 373 | 395 | 380 | 395 | 395 |
| −9.3% | 2.4% | 3.2% | −3.5% | 4.5% | −5.8% | −0.2% | −4.0% | 0.0% | 0.0% | ||
| Irrigated land | 2243 | 2251 | 2242 | 2240 | 2246 | 2238 | 2249 | 2243 | 2247 | 2243 | 2243 |
| 0.4% | −0.1% | −0.1% | 0.2% | −0.2% | 0.3% | 0.0% | 0.2% | 0.0% | 0.0% | ||
| Residential land # | 0.04 | 0.04 * | 0.04 | 0.04 * | 0.04 * | 0.04 * | 0.04 * | 0.04 | 0.04 | 0.04 | 0.04 |
| −1.0% | 0.0% | 0.6% | −0.7% | 0.8% | −1.2% | 0.0% | −0.9% | 0.0% | 0.0% | ||
| Riparian habitat | 1666 | 1672 | 1665 | 1663 | 1668 | 1662 | 1669 | 1367 * | 756 * | 1367 * | 1053 * |
| 0.4% | 0.0% | −0.1% | 0.1% | −0.2% | 0.2% | −19.7% | −75.1% | −19.7% | −45.1% | ||
| Mutualism | 0.99 | 0.99 | 0.99 | 0.99 | 0.99 | 0.98 | 0.99 | 0.99 | 0.99 | 0.99 | 0.99 |
| −0.2% | 0.2% | −0.1% | −0.1% | −0.3% | 0.1% | 0.0% | −0.2% | 0.0% | 0.0% | ||
© 2016 by the authors; licensee MDPI, Basel, Switzerland. This article is an open access article distributed under the terms and conditions of the Creative Commons Attribution (CC-BY) license (http://creativecommons.org/licenses/by/4.0/).
Share and Cite
Turner, B.L.; Tidwell, V.; Fernald, A.; Rivera, J.A.; Rodriguez, S.; Guldan, S.; Ochoa, C.; Hurd, B.; Boykin, K.; Cibils, A. Modeling Acequia Irrigation Systems Using System Dynamics: Model Development, Evaluation, and Sensitivity Analyses to Investigate Effects of Socio-Economic and Biophysical Feedbacks. Sustainability 2016, 8, 1019. https://doi.org/10.3390/su8101019
Turner BL, Tidwell V, Fernald A, Rivera JA, Rodriguez S, Guldan S, Ochoa C, Hurd B, Boykin K, Cibils A. Modeling Acequia Irrigation Systems Using System Dynamics: Model Development, Evaluation, and Sensitivity Analyses to Investigate Effects of Socio-Economic and Biophysical Feedbacks. Sustainability. 2016; 8(10):1019. https://doi.org/10.3390/su8101019
Chicago/Turabian StyleTurner, Benjamin L., Vincent Tidwell, Alexander Fernald, José A. Rivera, Sylvia Rodriguez, Steven Guldan, Carlos Ochoa, Brian Hurd, Kenneth Boykin, and Andres Cibils. 2016. "Modeling Acequia Irrigation Systems Using System Dynamics: Model Development, Evaluation, and Sensitivity Analyses to Investigate Effects of Socio-Economic and Biophysical Feedbacks" Sustainability 8, no. 10: 1019. https://doi.org/10.3390/su8101019
APA StyleTurner, B. L., Tidwell, V., Fernald, A., Rivera, J. A., Rodriguez, S., Guldan, S., Ochoa, C., Hurd, B., Boykin, K., & Cibils, A. (2016). Modeling Acequia Irrigation Systems Using System Dynamics: Model Development, Evaluation, and Sensitivity Analyses to Investigate Effects of Socio-Economic and Biophysical Feedbacks. Sustainability, 8(10), 1019. https://doi.org/10.3390/su8101019