Article

Mapping Cross-Boundary Climate Change Vulnerability—Case Study of the Hualien and Taitung Area, Taiwan

1
The Third Division, Chung-Hua Institution for Economic Research, Taipei 106, Taiwan
2
Graduate Institute of Architecture and Urban Design, Chinese Culture University, Taipei 111, Taiwan
3
Department of Architecture, China University of Science and Technology, Taipei 115, Taiwan
*
Author to whom correspondence should be addressed.
Sustainability 2016, 8(1), 64; https://doi.org/10.3390/su8010064
Submission received: 20 October 2015 / Revised: 21 December 2015 / Accepted: 31 December 2015 / Published: 11 January 2016

Abstract

:
This study uses biophysical vulnerability and social vulnerability data from Taiwan’s National Science and Technology Center for Disaster Reduction (NCDR) to assess the vulnerable areas in Hualien County and Taitung County (Hualien-Taitung Area). The most vulnerable townships are Yanping and Chenggong townships in Taitung County, and the least vulnerable townships are Fuli, Jian, Yuli, Shoufeng and Fenglin townships in Hualien County. The severity of potential impacts to townships in Taitung County is greater than that to townships in Hualien County. In the context of climate change, the Hualien-Taitung Area must develop policies that prioritize policies and strategies for hotspot townships. Furthermore, the Hualien-Taitung Area should integrate long-term cross-boundary policies and strategies to lobby for increased funding from the central government. Moreover, cross-boundary resource integration and regional adaptation strategies should be merged to help the Hualien-Taitung Area move toward sustainability.

1. Introduction

Climate change is significantly increasing the incidence of extreme weather events globally. Not only will global warming cause uncertainty, it will also impact our daily lives differently [1,2,3,4]. To minimize these impacts, the United Nations proposed two major strategies: mitigation and adaptation [4,5]. The mitigation strategy uses a variety of methods to reduce the amount of greenhouse gases (GHGs) emitted into the atmosphere. The adaptation strategy, on the other hand, deploys a variety of methods to adapt to climate change, including adjusting lifestyles, and taking advantage of climate change-related opportunities and adapting to changes in environments.
Due to its geography, topography, geology, and climatic factors, earthquakes and typhoons occur frequently in Taiwan. Potential areas for natural hazards (landslides and floods) are spread throughout the island (National Development Council, NDC) [6]. As administrative boundaries rarely encircle a natural disaster, local governments must develop cross-boundary strategies to guard against and respond to future disasters. Due to the rapid economic growth, much of the available lands in Taiwan have been overdeveloped. Coupled with the biophysical realities of an island state, the overdevelopment has resulted in development extending to mountains, rivers, and the sea. In recent years, impacts caused by the global climate change have become more severe [7]. Appropriate responses to the climate change impacts, keeping in mind the limited resources, and maintaining a stable balance of natural ecosystems will ensure the security of Taiwanese people and help move toward sustainable development.
The objectives of the vulnerability assessment are mostly related to the risk identification, the understanding of the factors of vulnerability [8]. Currently, risk assessment information for Taiwan is lacking, and a complete assessment requires long-term observations and research. However, the impacts of climate change on its environment in the short-term only focus on such disasters as landslides and floods. The impacts of these disasters on society can be analyzed through the perspectives of prevention and relief management. Therefore, quantitative data for biophysical and social vulnerability, obtained from Taiwan’s National Science and Technology Center for Disaster Reduction (NCDR), are used to assess vulnerability to climate change as a basic background analysis for cross-boundary adaptation.
There are 22 municipalities and counties facing severe resource competition due to limited resources in Taiwan. Cross-boundary governance can avoid wasteful or inefficient use of precious resources. Therefore, in order to move toward a sustainable society and cope with unprecedented climate change impacts, cross-boundary adaptation policies are needed.
This study provides a case study in Hualien-Taitung Area in Taiwan to cope with climate change impacts. Hualien County and Taitung County (Hualien-Taitung Area) are neighboring counties located on Taiwan’s east coast. Due to many geographic disadvantages, these two counties cannot collaborate to develop a sustainable region, often resulting in resource competition and misallocation. This study assesses the potential environmental impacts of climate change in the Hualien-Taitung Area. Vulnerability data from the NCDR were adopted to explore climate change vulnerable areas and to identify high vulnerable areas as adaptation hotspots by using Geographic Information System (GIS). This study assesses and identifies possible areas to be impacted by climate changes in the Hualien-Taitung Area. Furthermore, this study proposes spatial adaptation strategies from a cross-border governance perspective to help local governments to increase resilience and to move toward sustainable development.
The remainder of this paper is organized as follows. Section 2 reviews climate change literature, including vulnerability, adaptation policies, spatial governance and cross-boundary governance. Section 3 provides an overview of the environment in these two counties, including their regional administration boundaries and terrain environment. Section 4 assesses vulnerability. Section 5 presents study results, and the vulnerability profile of each township through GIS mapping. Section 6 gives conclusions and recommendations.

2. Literature Review

2.1. Environmental Change and Vulnerability

The IPCC’s Fifth Assessment Report (AR5) stated that human interference is very likely the main reason for global warming (95% confidence level) [9]. Climate change poses serious risks for humankind and natural systems. Climate change risks can be assessed in terms of vulnerability, hazards and exposure [4]. Risk for negative effects related to climate change can be reduced through risk management. Risk management includes adaptation and mitigation decisions or strategies for future generations, the economy, and the environment. The goal of risk management is to create resilient and suitable tools for adapting to climate change. At the same time when assessing vulnerability and climate risks, the limits of adaptation and climate resilience approaches and transformation roles are addressed. In short, among various climate change concepts, vulnerability, adaptation and resilience are key attributes, and they have been critical concepts in relation to climate change and disaster-related issues [1,10,11,12].
Vulnerability and resilience assessments increase public awareness of the environmental effects of natural disasters caused by environmental pressures and human action, and the capacity of the state to respond to reconstruction after disasters. This information is important when increasing sustainability. The key requirement for contemporary urban planners is to understand both vulnerability and resilience [11,12,13]. However, many cities worldwide are expected to work toward a “resilient city”, in an effort to decrease the adverse impacts of climate change [13,14]. The Fifth Assessment Report by the IPCC in 2014 defines resilience as “the capacity of social, economic, and environmental systems to cope with a hazardous event or trend or disturbance, responding or reorganizing in ways that maintain their essential function, identity, and structure, while also maintaining the capacity for adaptation, learning, and transformation” [4]. Resilience, as a concept, “can be applied to any community and any type of disturbance: natural, man-made, or a combination of the two” [14]. Thus, resilience can be considered in relation to individuals/households, communities, urban centers and regions [5,15].
Early vulnerability studies mainly focused on disaster impacts and environmental sensitivities. Due to increased frequency and severity of climate change and environmental disasters in recent years, traditional environmental impact studies have gradually transformed into vulnerability and resilience (i.e., adaptability) studies [1]. That is, recent studies have focused on methods of assessing the capacity of a society to continue operations after it has been impacted by disasters, and its capacity to recover after the impact [5,12,15,16,17].
Instead of focusing on disaster-induced damage and loss, recent vulnerability studies have explored fundamental causes [18]. Vulnerability studies can improve our understanding of people and places are at risk and can identify situations that reduce the capacity of people to respond to environmental threats [19]. This information can then be used to develop strategies that inform adaptation governance. Although domestic and international studies apply different definitions of vulnerability, the two main streams are “biophysical vulnerability” to natural disasters and “social vulnerability” due to socio-economic factors [12,16,20,21].
The core of social vulnerability is social system status before a disaster occurs [1,12]. Social vulnerability, a universal standard, is applied when managing disasters and climate change in certain regions [22]. It is related to the specific context of a certain area. The reasons of causing vulnerability in a certain area or community may be different from the reasons for another area or community. Vulnerability is also dynamic, because it will change according to the change of biophysical and socio-economic attributes [20]. Moreover, a more comprehensive and integrated interpretation of the vulnerability concept can be depicted as a function of three inter-related elements: exposure, sensitivity and adaptable capacity [1,17,20,23].
Vulnerability assessment frameworks are based on multiple conceptual models, and how the factors in the models interact to influence vulnerability [20]. The risk-hazard models often applied in environmental impact assessments [24]. However, the conventional models have less social structure assessment. On the other hand, social vulnerability assessments focus on socio-political geographical factors of vulnerability that influence the interactions of human and natural systems when encounter stress [8]. To apply vulnerability to a more comprehensive environmental planning, Lee [12] used GIS data at the township level and overlaid biophysical vulnerability and social vulnerability to examine integrated vulnerability in Chiayi, Taiwan. Jabareen [17] proposed a new conceptual framework for assessing city plans based on the idea of sustainability and planning countering climate change and applied this framework to assess the recent master plan for the city of New York: PlaNYC 2030.

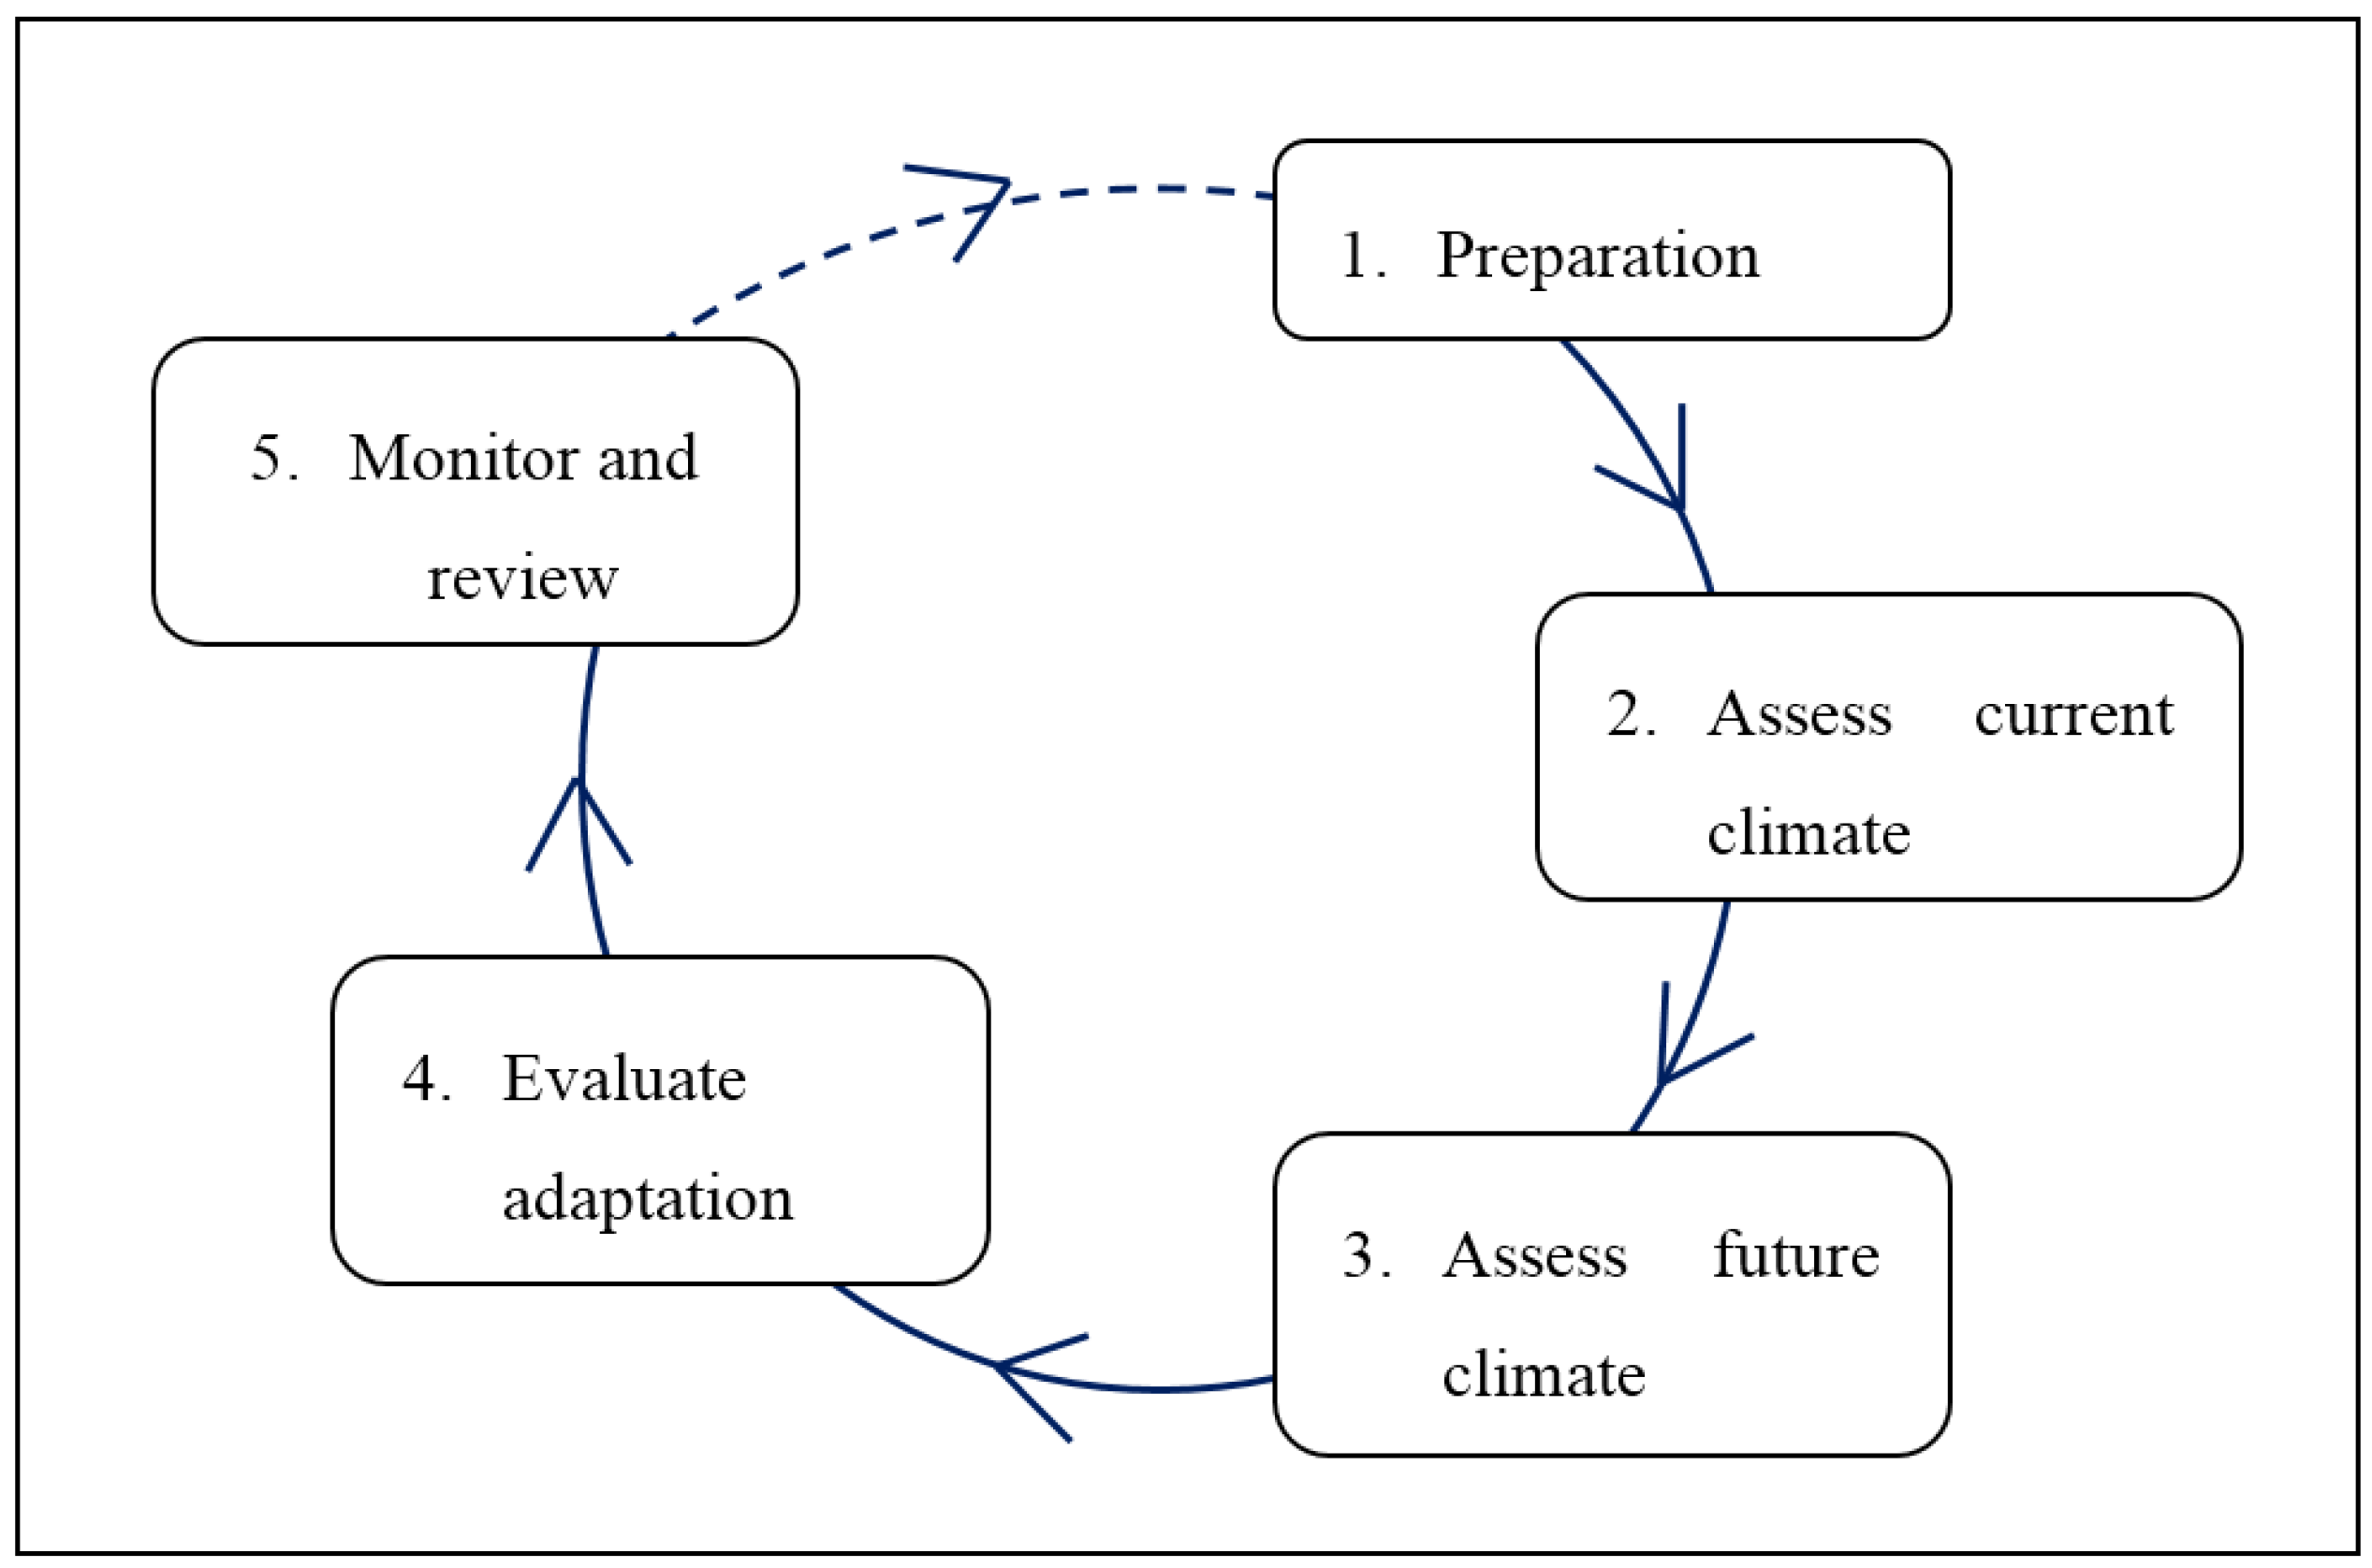
2.2. Adaptation Strategy

As UNEP [25] defined vulnerability as the degree of sensitivity, IPCC [4] indicated that vulnerability does not entirely depend on sensitivity. Vulnerability encompasses a variety of concepts and elements including sensitivity; the adaptation capabilities of a system under climate change should also be considered. Adaptation may occur automatically or can be produced through policy, and may be defined as the current state of climate change after accounting for adjustments in process and structure.
The development of a local adaptation strategy platform should have three stages as a basis for vulnerability and risk assessment: (1) describe the characteristics of climate change unique to the city under study; (2) identify the most vulnerable indicators in the city (i.e., people, places and regions); and (3) assess the city’s adaptation capacity in response to climate change [26].
Because the effects of climate change are uncertain and dynamic, local vulnerability must be assessed before developing adaptation strategies at the local level, and response strategies must be targeted at the causes of vulnerability. In Japan, for example, adaptation strategies are divided into technical, political and socio-economic, and strategies in these three areas must be assessed before adaptation policies are developed [27].

2.2.1. Adaptation Strategies in Taiwan

To establish adequate national adaptation capacity, reduce social vulnerability, and integrate operational mechanisms as the basis for implementing policy frameworks and plans, Taiwan’s NDC invited ministry representatives, experts, scholars, Non Governmental Organizations (NGOs), and industry representatives to work on a “Plan to Promote Climate Change Adaptation Policy Framework and Action Plan” in 2010. Special committee meetings, validation team meetings, regional seminars, and national climate change conferences were held to solicit opinions from the public. As a result, the Adaptation Strategy to Climate change in Taiwan was published in 2012 [28].
In addition to analyzing Taiwan’s status under climate change and providing future estimations of impacts, its adaptation strategy also accounts for its unique environment and history. The strategy has eight areas of adaptation: disasters; life-supporting infrastructure; water resources; land use; coastal areas; energy supply and industries; agricultural production and biodiversity; and health. The strategy also contains responsive adaptation strategies and mechanisms and measures that support the related actions.
Taiwan’s local governments have examined the degree of vulnerability to climate change impacts in their areas, and have combined local environmental characteristics and financial conditions to plan for local adaptation projects. To implement local adaptation projects, the NDC has issued its Planning Guidelines for Local Climate Change Adaptation Planning [29]. These guidelines suggest that local vulnerability should be assessed before local adaptation policies are developed.
In 2013, Taiwan’s NDC invited relevant ministers, experts, scholars, and NGO and industry representatives to investigate and plan Taiwan’s policy framework and action plans. The action plans, formulated for the eight areas of adaptation, were combined into the National Climate Change Adaptation Action Plan (2013–2017) [6]. This plan uses research results for current climate change trends in Taiwan to assess vulnerability and impact. The Action Plan has 64 action plans for implementation. This study uses these eight areas as a basis for adaptation strategies for climate change.

2.2.2. Cross-Boundary Spatial Governance and Climate Change
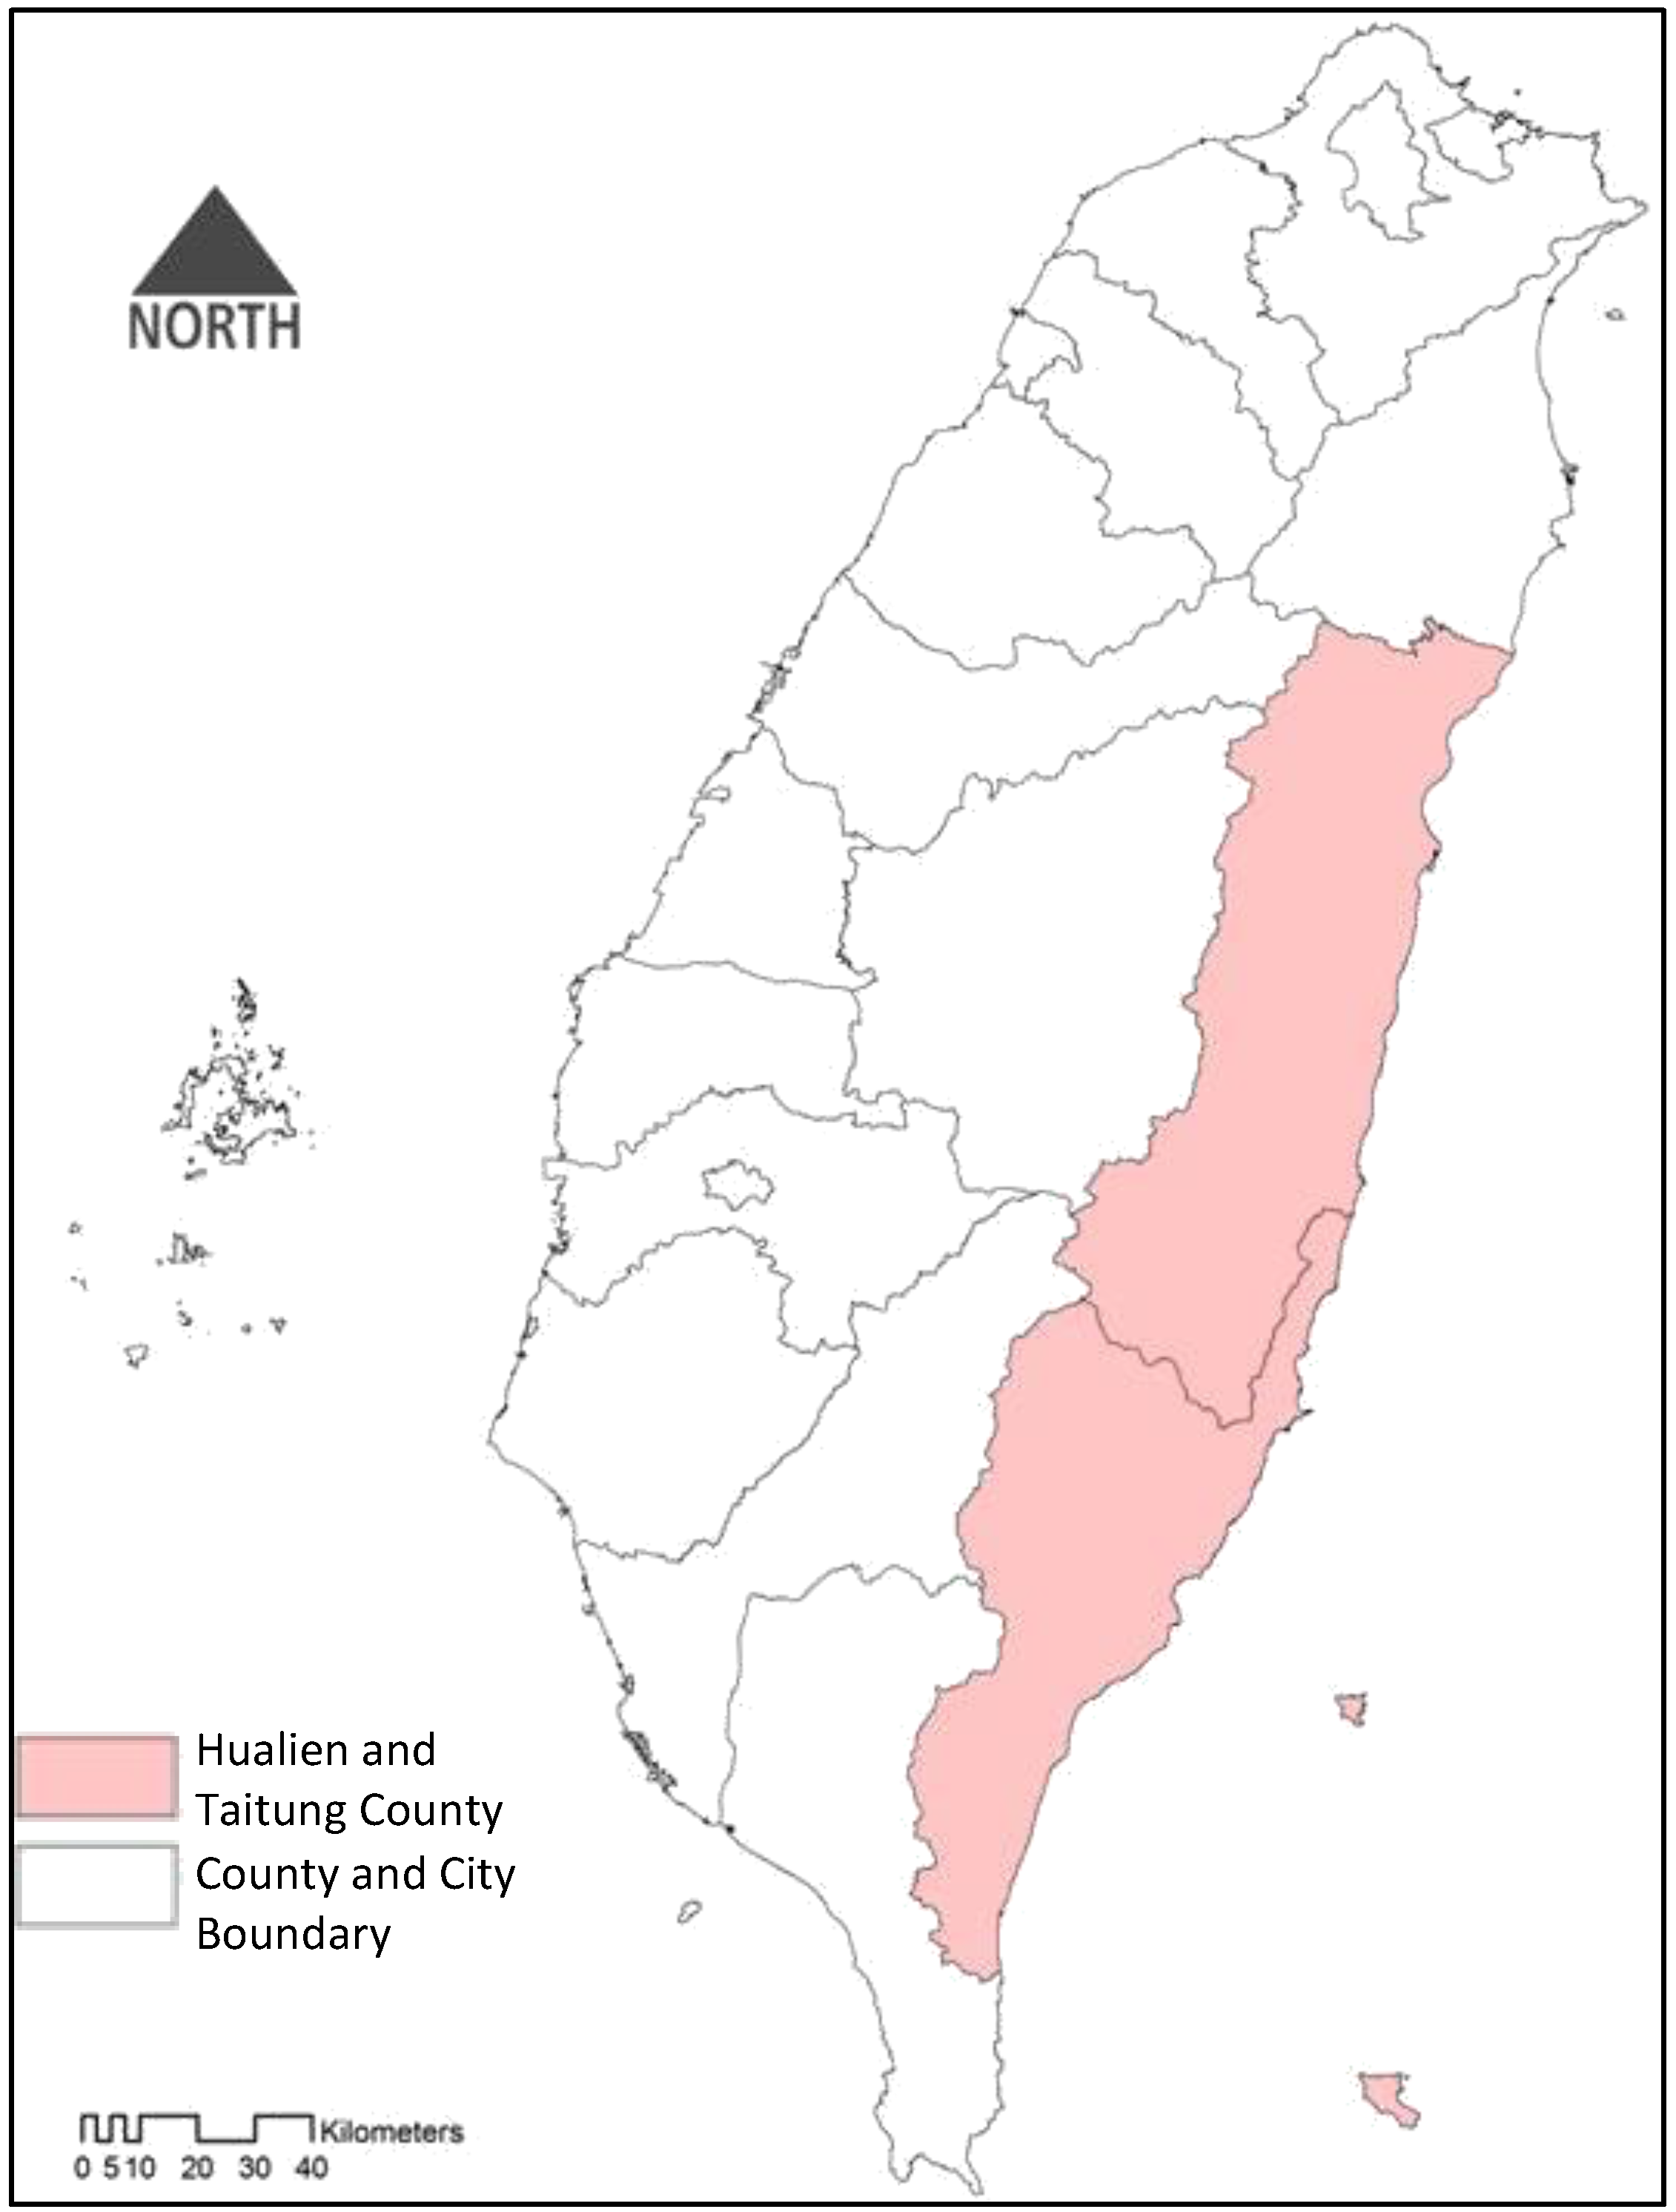
Many floods and other disasters have occurred in recent years. As Taiwan is an island, rising sea levels will become a challenge. The Netherlands, for example, has as much as 60% of its land below sea level. In 2007, The Netherlands was the first country to develop a National Adaptation Strategy, which asserts that the country must use adaptation strategies in spatial planning. The Netherlands adopted the Make Space for Climate policy to direct its future and designed urban spaces that mitigate the adverse effects of climate change [30]. According to The Netherland’s National Programme for Spatial Adaptation to Climate Change, spatial planning strategies are implemented through regional governance bodies [31]. Under this model, geographic space is divided into a number of predetermined boundaries [32]. However, to cope with climate change and increase resistance to its negative effects, existing spatial planning should be abandoned. New spatial planning boundaries should be created according to environmental characteristics or similar changes brought about by climate change.
According to the Adaptation Policy Framework for Climate Change of the United Nations Environment Programme, vulnerability and risk analysis are important tools when formulating adaptation strategies. The Adaptation Wizard web platform by the UK Climate Impacts Programme (UKCIP) also indicates that decision-making processes include vulnerability assessments, which utilize the following five steps: Preparation—defining the problem; assessing current vulnerability; assessing future vulnerability; defining/evaluating adaptation options; monitoring and reviewing (Figure 1) [33].
As mentioned, urban development often spans existing administrative boundaries; therefore, with limited resources, local governments should reduce competition among regions to prevent the poor or redundant use of national resources and poor fiscal performance [34]. Cross-boundary cooperation and integration of local forces can assist in achieving sustainable development [11,35]. Urban climate policies requires “internal network building and coordination every bit as delicate and contested as the external relationships between state, community, and private sector actors that are the focus of traditional studies of governance” [36]. However, current administrative divisions typically resulted in small cities and counties, and fragmented local government structures in Taiwan. The Strategic Plan for National Spatial Development advocates cross-administrative boundary cooperation and development [37].
Figure 1. Framework for the development of cross-regional climate change adaptation strategies. Source: [33].
Sustainability 08 00064 g001
In response to the crosscutting nature of adaptation, there are more attentions on what local governments can do to integrate adaptation planning and action into the established functions of local government agencies [38]. To integrate the cross-boundary adaptation policies, the needs of more and better scientific data as long as providing support for the processes of data transformed into knowledge and action are important [36].
As the economic, social and technological structures of urban and rural areas have changed in Taiwan, city and county governments must enhance spatial competition and increase their spatial scale. Restated, regional cooperation and cross boundary researches will be the trend for future spatial development.

3. Study Area

Due to the geography in Hualien County and Taitung County, they are very vulnerable to typhoons. These regions also receive more rainfalls than other regions in Taiwan during typhoons. Additionally, these two counties are located where the Eurasian continental plate and Philippine Sea plate contact, such that earthquakes are common, frequently causing orogenic movement, collapses, and landslides. Because of their inherent vulnerabilities and sensitivities, disaster risk management must be strengthened. The Hualien and Taitung counties lack overall plans, and although their cultures and economies are closely related, they rarely cooperate [39]. When faced with the complexities of climate change, cross-departmental and cross-regional cooperation is necessary for efficient resource utilization.
Hualien County, the largest county in Taiwan, accounts for one-eighth of the country’s total land area. Hualien County mainly consists of mountains, rivers and plains. The mountainous territory, comprised of both the Central Mountain Range and Coastal Mountain Range, occupies about 87% of its total area. Furthermore, the Hualien and Taitung Valley Plain between the mountain ranges only accounts for 7% of the land area.
The terrain in Taitung County generally slopes from the Central Mountain Range toward the Pacific Ocean. The entire territory has many mountains, and has a long north-to-south and narrow east-to-west land formation. The mountainous regions are formed by the Coastal Mountain Range in the east and the Central Mountain Range in the west. The Taitung Valley Plain sits between the two ranges, and the narrow coastal terrace lies between the Coastal Mountain Range and the Pacific Ocean. Terrain conditions indicate that the suitable area for urban development is rather limited. Low, gentle sloping lands are mainly distributed in the valley plain.
The administrative areas in Hualien and Taitung counties are close to each other. Because of the long, narrow shape of the territory (Figure 2), a densely packed area cannot be established, and competition often occurs for industrial land. However, as they both face the same climate change pressures, the natural landscape, cultural, and marine resources of Hualien and Taitung counties also need to be protected to achieve sustainable development.
Figure 2. Map of Hualien and Taitung counties.
Sustainability 08 00064 g002

4. Research Method

In order to assess vulnerability to help local governments identify critical regions for climate change adaptation planning and action, this study performed overlay analyses of physical vulnerability and social vulnerability using GIS data at the township level. This study used data from the NCDR to assess vulnerability. Based on this initial assessment, this study suggests climate change action plans. The analysis was also carried out using information from different peer-reviewed scientific studies and gray literature such as reports, theses, dissertations and media sources [40,41]. Valuable information was also collected through three local and national workshops and seminars. Regional workshops and conferences were also sources. There were totally 11 regional workshops and conferences held in Hualien and Taitung, included five local government meetings, six workshops with both local authorities and research institutions, local meteorological stations, rural and urban administrative bodies and NGOs in both counties. The information was used to assess and document the biophysical and social vulnerabilities of both counties to climate change impacts and specially coping strategies.

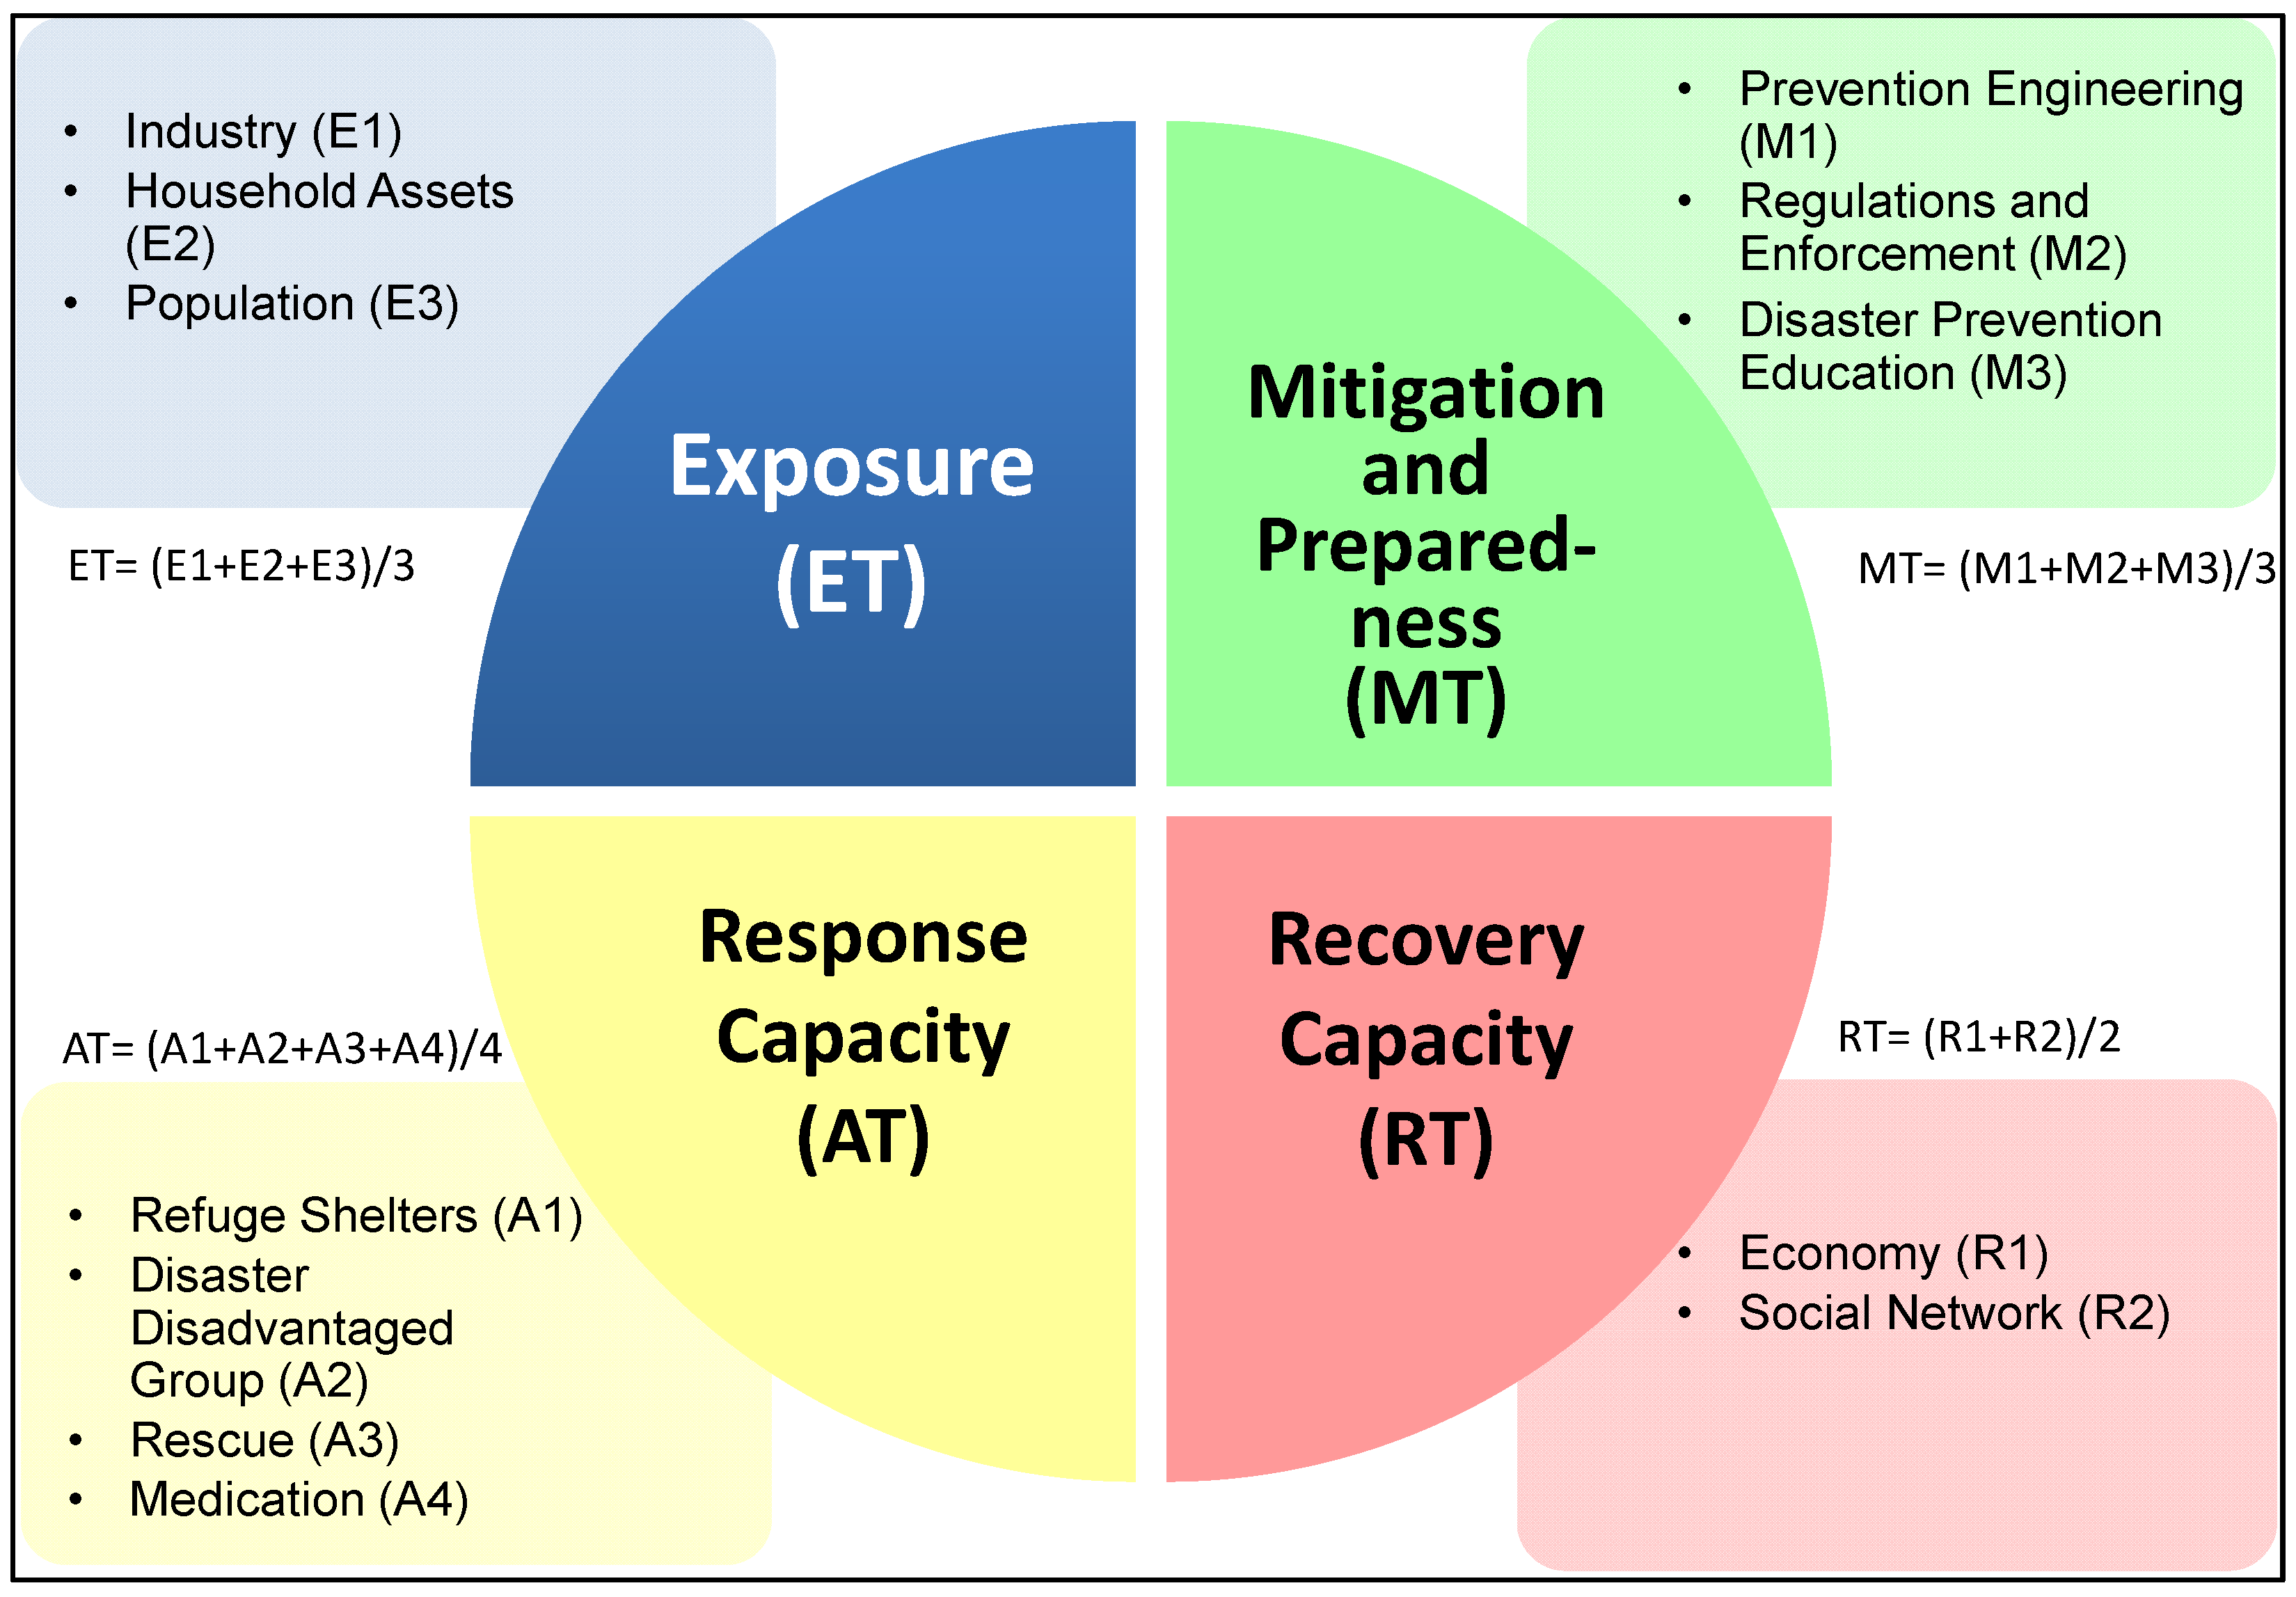
4.1. Biophysical Vulnerability Index

The NCDR data included figures and maps of areas vulnerable to several indicators. In this study, seven indicators that are related to climate change were selected to assess biophysical vulnerability, including landslides, falling rocks, daily rainfall and flooding, debris slides, rock slides, tsunamis, and the dip slope distribution. The GIS map overlap method was used to calculate the ratio of each biophysically vulnerable area to the total city/township area. Due to the fact that there could be more than one potential disaster in townships, by adding up all disaster potential areas and multiplying each number by 1/7 (7 indicates), the results can exhibit the severity of vulnerability. The spatial vulnerability formula is as below:
n i : Area of biophysical vulnerability
n i = n i × 1 7 × %

4.2. Social Vulnerability Index

Social vulnerability, assessed using 2014 statistics, the most recent provided by the NCDR, was divided into four dimensions: degree of exposure, mitigation and preparedness, response capacity and recovery capacity. Exposure factors were: (1) industry; (2) household assets; and (3) population. Disaster mitigation factors were (1) prevention engineering; (2) regulations and enforcement; and (3) disaster prevention education. Response capacity factors were (1) refuge shelter; (2) disaster disadvantaged; (3) rescue; and (4) health care. Recovery capacity factors were (1) economy and (2) social network (Figure 3). Different factors were also comprised of different variables (Table 1).
Social vulnerability was calculated according to the NCDR’s method, which sums and averages each factor under each social vulnerability dimension. However, the value for the “industry” factor, under the exposure dimension, was too large, causing highly productive townships to have a high degree of vulnerability. This study corrected for the exposure dimension. Two variables were in the industry factor: the total products from the agriculture, forestry, and fishing industries and the total products from the industrial and commercial industries. Because these two variables belong to different industrial sectors, adverse impacts can be easily reduced. Therefore, there was no need for additional average weighting calculations. These two factors were corrected and consequently had the same weights with the other two factors (household assets and population).
x ¯ = x 1 + x 2 + + x m m
where x ¯ is each factor in the second layer of social vulnerability, and x m is the value of each element in the third layer.
y ¯ = y 1 + y 2 + + y n n
where y ¯ is the factor value of the first level of social vulnerability, and y n is the value of each factor in the second layer.
Figure 3. Four main dimensions of social vulnerability. Source: [42].
Sustainability 08 00064 g003
Table 1. Definition of social vulnerability factors. Source: [42].
Layer 1 (Dimension)Layer 2 (Factor)Layer 3 (Variable)
Degree of ExposureIndustryTotal product from the agriculture, forestry, and fishing industries
Total product from the industrial and commercial industries
Household assetHousehold and building value
PopulationHouseholds protected from mudslides by the Water Conservation Bureau (Actual number of occupants)
Household population
Mitigation response Prevention engineeringRate of shock-proof from Taiwan Earthquake Loss Estimation System (TELES) construction data
Quantity of engineering for watershed conservation and flood prevention
Regulations and enforcementRate of hillside overuse
Visit and interview results
Disaster prevention educationNumber of mudslide prevention drills
Response CapacityRefuge shelterNumber of country roads connected to main roads
Occupancy rate
Disaster disadvantagedNumber of elderly people living alone
Number of handicapped people
Number of welfare organizations for old people
RescueNumber of organizations for handicapped people
Number of fire fighters (including volunteer fire fighters)
Health CareNumber of disaster relief vehicles, ambulances and lifeboats
Area of service for each hospital
Number of medical people
Number of hospital beds
Recovery capacityEconomicsNumber of low-income households
Rate of recovery time
Typhoon and flood insurance rates
Earthquake insurance rate for housing
Grants and other sources of revenue income assistance
Social networkRatio of social welfare budget to people

5. Results

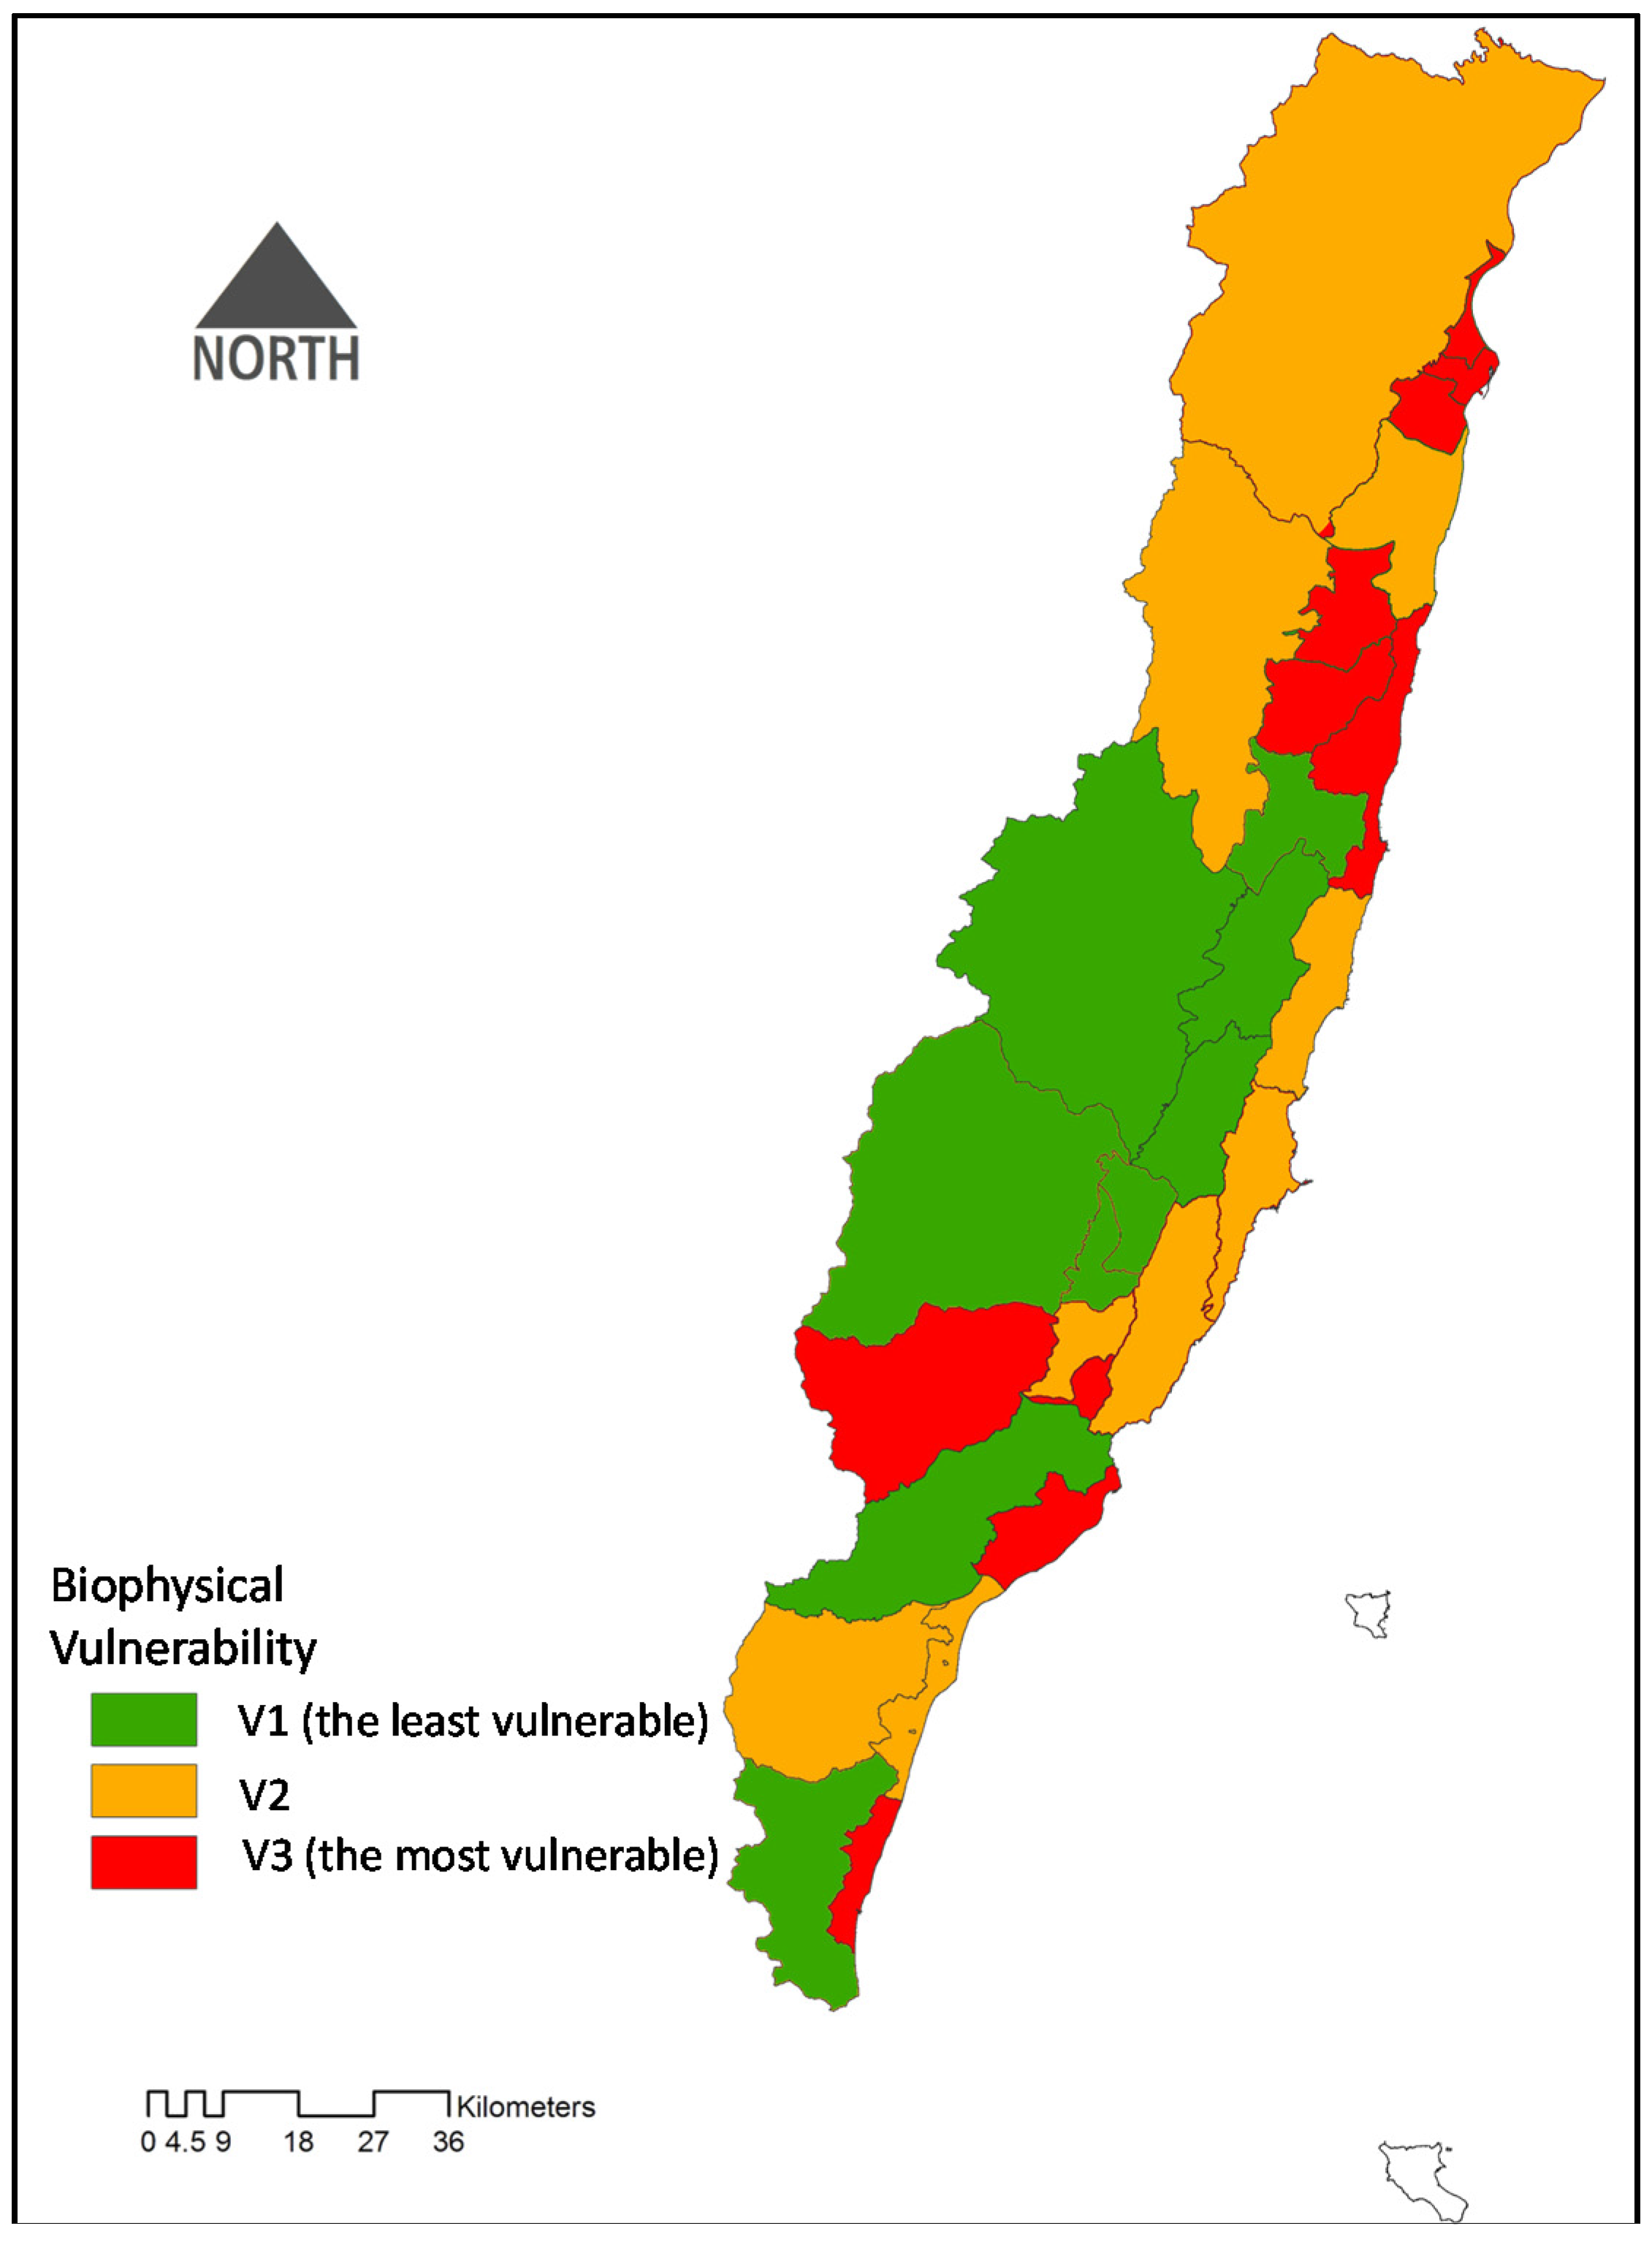
5.1. Biophysical Vulnerability

Table 2 lists the biophysical vulnerability factor for each township in Hualien and Taitung counties. Townships with the greatest biophysical vulnerability were Hualien, Xinchen, Guanfu, Ji’an, Fenglin, and Fengbin in Hualien County and Taitung, Dawu, and Yanping in Taitung County. This study used three degrees for vulnerability: V1 (the least vulnerable) to V3 (the most vulnerable). Moreover, the GIS technique to overlay these maps was applied to create a map of biophysical vulnerability in Hualien and Taitung counties (Figure 4).
Figure 4. Biophysical vulnerability in Hualien and Taitung counties.
Sustainability 08 00064 g004
Table 2. Biophysical vulnerability factor for each township in Hualien and Taitung counties.
CountyTownshipDebris Slide %Rock Slide %Landslide %Falling Rocks %Dip Slope %Rainfall (600mm/24hr) Flooding %Tsunami %Spatial Weights %
Taitung CountyChangbin1.91%0.12%0.03%1.82%1.33%0.13%1.02%0.91%
Haiduan4.42%0.15%0.06%0.24%0.29%--0.74%
Chishang0.85%0.42%0.03%0.02%-4.12%-0.78%
Chenggong2.18%0.00%0.18%0.86%1.25%0.14%2.62%1.03%
Guanshan0.53%0.27%0.47%0.00%-2.96%-0.60%
Donghe3.06%0.04%0.21%0.39%2.40%-0.60%0.96%
Luye2.78%0.40%0.15%-1.45%2.50%-1.04%
Yanping6.01%-0.02%1.16%0.39%0.07%-1.09%
Beinan2.15%-0.25%0.47%0.33%0.15%0.10%0.49%
Taitung0.02%-0.08%0.00%-10.35%5.66%2.30%
Taimali0.20%-0.41%0.04%1.38%3.59%0.91%0.93%
Ludao-------0.00%
Jinfeng4.64%0.01%0.03%0.45%0.37%0.14%-0.81%
Daren3.18%0.06%0.07%0.08%0.81%0.55%0.15%0.70%
Dawu0.93%-1.05%0.11%0.97%3.40%1.31%1.11%
Lanyu-------0.00%
Hualien CountyXiulin4.11%0.09%0.09%2.18%0.84%-0.07%1.05%
Xincheng0.00%-0.02%--9.46%1.42%1.56%
Hualien--0.16%--17.25%9.46%3.84%
Ji’an0.03%-0.27%0.01%-5.47%2.21%1.14%
Shoufeng0.51%0.01%0.11%0.15%0.45%4.96%0.39%0.94%
Wanrong3.81%0.01%0.04%1.31%0.97%--0.88%
Fenglin0.08%0.02%0.25%0.00%0.18%7.38%-1.13%
Fengbin3.07%0.08%0.18%0.37%2.95%-1.20%1.12%
Guangfu0.96%-0.48%0.05%2.40%5.74%-1.37%
Zhuoxi2.99%0.01%0.05%0.09%0.22%--0.48%
Ruisui1.38%0.14%0.17%0.15%3.19%0.31%-0.76%
Yuli1.20%0.22%0.26%0.15%0.39%0.50%-0.39%
Fuli1.16%0.00%0.09%0.70%0.15%--0.30%

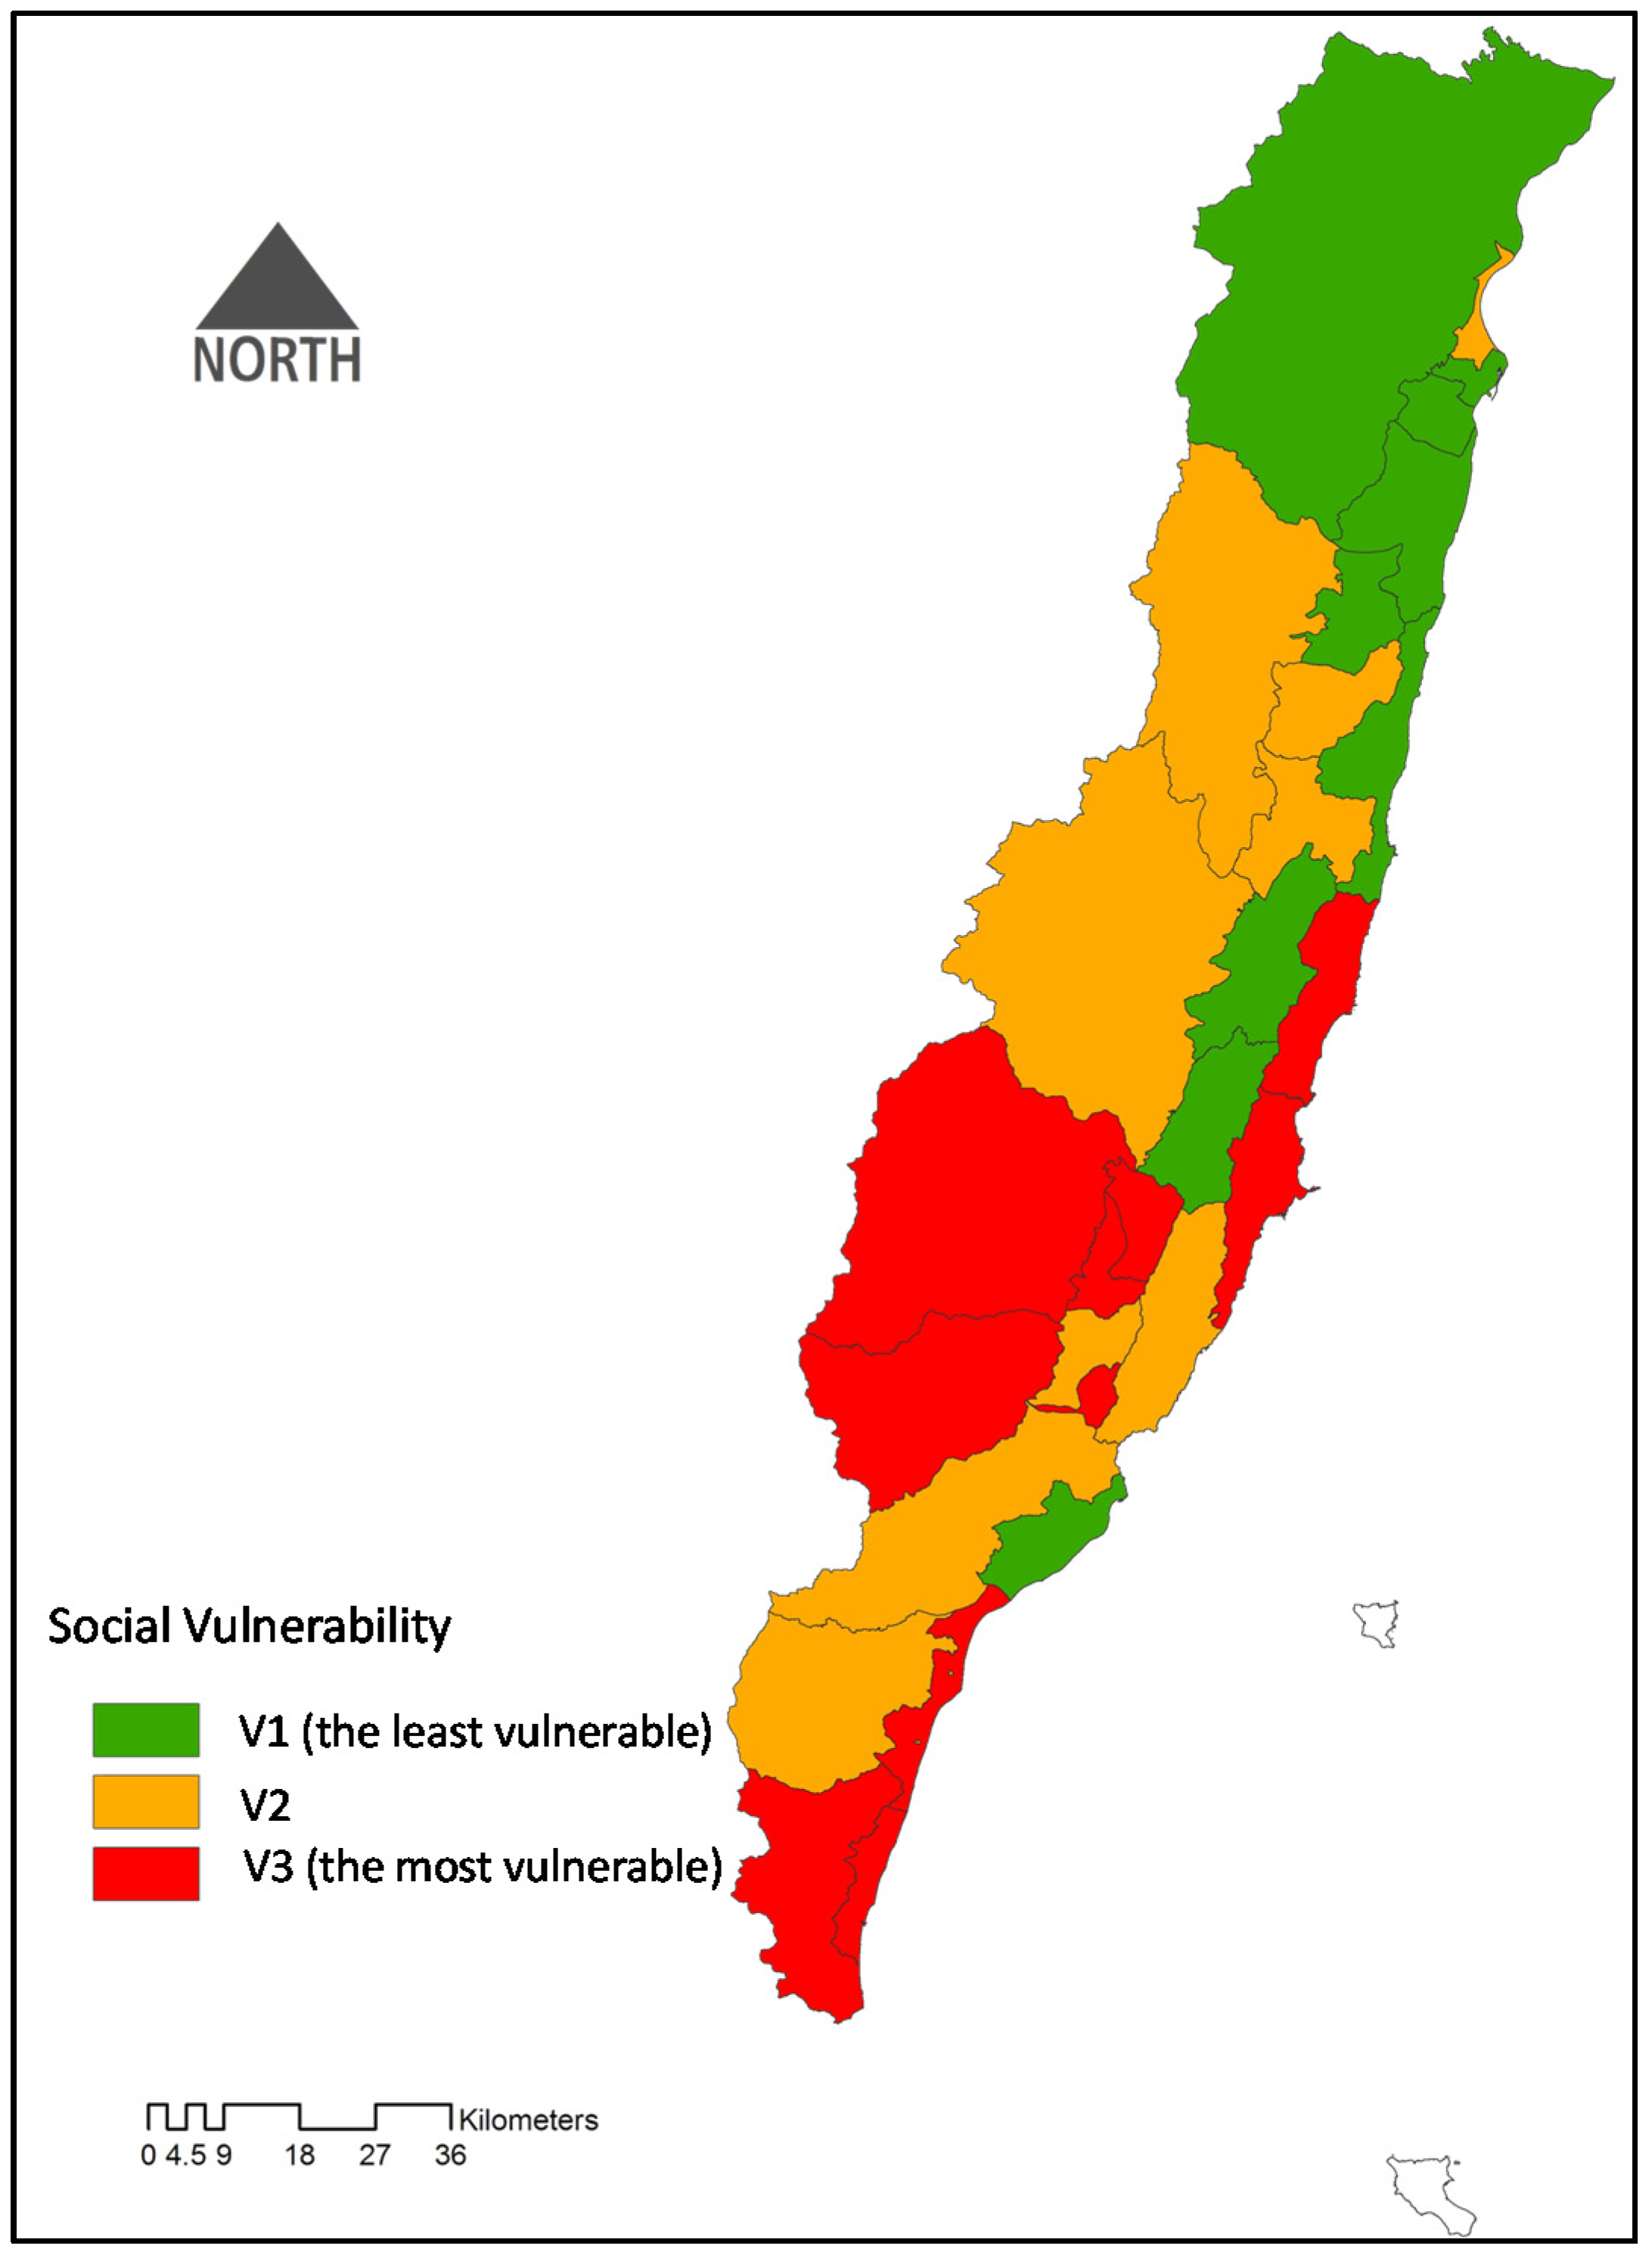
5.2. Social Vulnerability

The townships with the highest total score for social vulnerability were Yanping, Changbin, Taimali, Daren, Guanshan, Chishang, Chenggong, Haiduan and Dawu in Taitung County. Similarly, social vulnerability was rated using three degree of vulnerability: V1 (least vulnerable) to V3 (most vulnerable). Furthermore, based on the GIS technique, V1–V3 vulnerability data were used to investigate the social vulnerability distribution on the map (Figure 5) using spatial analysis. The regions with the highest levels of social vulnerability were mainly distributed in townships in Taitung County.
Figure 5. Social vulnerability ratings for Hualien and Taitung counties.
Sustainability 08 00064 g005

5.3. Synthesized Analysis of Biophysical and Social Vulnerability

Nine categories were defined through cross-comparisons of biophysical and social vulnerabilities: Low-Low, Low-Medium, Low-High, Medium-Low, Medium-Medium, Medium-High, High-Low, High-Medium, High-High (see Table 3). Furthermore, V1 was the lowest total vulnerability and V5 was the highest total vulnerability. Townships with the highest synthesized vulnerability (V5) were Yanping and Dawu in Taitung County. Townships with the second highest synthesized vulnerability (V4) were Chenggong, Taimali, Changbin in Taitung County, and Xincheng and Guangfu in Hualien County. Townships with the third highest synthesized vulnerability (V3) were Taitung, Daren, Chishang, Guanshan, Haiduan, Luye, Donghe, Jinfeng in Taitung County, and Hualien, Wanrong, Ji’an, Fenglin, and Fengbin in Hualien County. Townships with the fourth highest synthesized vulnerability (V2) were Beinan in Taitung County, and Ruisui, Zhuoxi, Xiulin, and Shoufeng in Hualien County. Townships with the lowest synthesized vulnerability (V1) were Yuli and Fuli in Hualien County (Figure 6).
Table 3. Synthesized assessment of biophysical and social vulnerability.
VulnerabilitySocial Vulnerability
LowMediumHigh
Biophysical VulnerabilityLowV1V2V3
Yuli, Fuli in Hualien CountyRuisui, Zhuoxi in Hualien County; Beinan in Taitung CountyDaren, Chishang, Guanshan, Haiduan in Taitung County
MediumV2V3V4
Xiulin, Shoufeng in Hualien CountyWanrong in Hualien County; Luye, Donghe, Jinfeng in Taitung County;Chenggong, Taimali, Changbin Taitung County
HighV3V4V5
Hualien, Ji’an, Fenglin, Fengbin in Hualien County; Taitung in Taitung CountyXincheng, Guangfu in Hualien CountyYanping, Dawu in Taitung County
Note: Synthesized vulnerability: V5 > V4 > V3 > V2 > V1
Figure 6. Synthesized vulnerability in the Hualien and Taitung counties.
Sustainability 08 00064 g006
Figure 6 shows a map of classified synthesized vulnerability. The townships most easily impacted by environmental change are concentrated in the coastal areas in Hualien and Taitung counties. For example, Yanping and Dawu in Taitung County have high biophysical and social vulnerability. These townships have high potential for negative climate change impacts, and have low mitigation, response and recovery capacities, and need attention first. Conversely, Yuli and Fuli in Hualien County are townships with relatively low biophysical and social vulnerability. These townships have low potential for negative climate change impacts, and have high mitigation, response and recovery capacities. For cross-boundary cooperation to cope with climate changes, niche industries should be promoted for regional economies of scale, and both counties should integrate their long-term strategies, and develop new adaptation strategies to secure funding from the central government. Moreover, common adaptation hotspots in the Hualien and Taitung counties should be priorities for adaptation strategies.

5.4. Combining Vulnerability and Key Issues to Develop Local Hotspot Adaptation Strategies and Action Plans

Appropriate adaptation strategies were formulated using data from questionnaires filled out by local authorities, and from in-depth interviews, focus-group discussions and gray literature. Combined with the GIS analysis of synthesized vulnerability, different adaptation strategies and action plans were proposed for each township in the two counties. These strategies and action plans provide a basis for local governments to examine whether the adaptation programs can effectively reduce vulnerability. According to the eight fields (disasters, infrastructure, water resources, land use, coastal zones, energy supply and industry, agricultural production and biodiversity, and health) in the Adaptation Strategy to Climate Change in Taiwan, this study sums the outcomes of review examples on cross-boundary adaptation plans. Table 4 presents a summary of the climate change adaptation action plan.
Table 4. Key fields for cross-boundary climate change adaptation.
Adaptation FieldCross-Boundary Adaptation StrategyType
Disaster1. Strengthen cross-boundary disaster response systemsA
2. Monitor and change the location of a disaster and respond to itC
Infrastructure1. Strengthen the backup, recovery, and emergency response plans for life-supporting facilities in neighboring townshipsB
2. Assess whether transportation routes in coastal regions in the Hualien and Taitung counties are secure against coastal erosion threats, and develop response measuresB
Agricultural Production and Biodiversity1. Strengthen the allocation of agricultural resources between the two countiesB
2. Monitor cross-border biodiversityB
Land Use1. Strengthen water conservation and disaster-prevention facilitiesB
2. Adjust regional land uses according to disaster monitoring resultsB
Coastal zones1. Monitor coastal regions in Hualien and TaitungB
2. Review and improve the protection capacity of coastal facilitiesA
3. Strengthen natural ecological restoration and conservation in coastal regionsA
Health1. Strengthen the monitoring of mosquitoes and impact assessmentB
2. Strengthen epidemic prevention and notification mechanismsA
Energy Supply and Industry1. Cross-county plan for responses to power outagesC
Water Resource1. Acquire information for the total amount of water in resources in Hualien and Taitung, and predict drought possibilitiesC
2. Acquire information for the total number of water resources, and manage and adjust methods of agricultural productionB
3. Catchment monitoring planC
4. Implement catchment environmental protection and ecological conservation measuresA
Based on vulnerability assessment results, cross-boundary adaptation strategies were copped throughout gray literature review, 11 local and national workshops, seminars and meetings. During the meetings, these adaptation strategies were suggested to be implemented by different local authorities. Moreover, the adaptation strategies should be firstly implemented at the most vulnerable areas that were identified in this study. Disaster field includes two items; the life-support infrastructure adaptation strategy includes two items; the agricultural production and biodiversity adaptation strategy includes two items; the land use adaptation strategy includes two items; the coast adaptation strategy includes three items; the health adaptation strategy includes two items; the energy supply and industry field adaptation strategy includes one item; and the water resource adaptation strategy includes four items. In total, 18 items in cross-boundary climate change adaptation strategies were developed. From information collected through the workshops and seminars, this study divided action plans into three categories: action plans that can be immediately implemented (Type A); action plans that require study before implementation (Type B), and action plans that require changes in laws and regulations before implementation (Type C). In which, Type A action plans are required by both counties to develop detailed action strategies for the next 10 years. In addition, all strategies (Type A, B and C) are suggested to be reviewed every year by local authorities, specialists and NGOs; and should be revised and updated every four years.

6. Conclusions

Global climate change is in progress [4]. In the future, if cities and communities can identify regions with high vulnerability and implement adaptations, then the impacts of climate change may be reduced [1,20]. The synthesized vulnerability method in this study can be used to identify key regions that require adaptation action plans. Conclusions are given as follows.
Vulnerability assessments can combine Taiwan’s Strategic Plan for National Spatial Development and its National Regional Plan. Assessments should inform Taiwan’s cross-boundary governance. To facilitate future adaptation strategies, county or city jurisdictions cannot guard their boundaries; rather, cross-boundary methods can reflect local characteristics and needs [35].
This study identified that the areas with the highest degree of vulnerability in Hualien and Taitung counties; these areas are concentrated on the coastal areas. These areas are also home to townships, such as Yanping and Dawu townships in Taitung County, that are easily affected by adverse climate change impacts. If the government invests resources needed for climate change adaptation actions, these townships should be top priorities [1,16]. Moreover, we suggest that the implementation of climate change adaptation plans be carried out in townships with the highest degree of vulnerability.
Based on synthesized vulnerability analyses, this study proposed eight climate change adaptation fields and 18 strategies. These strategies can be a reference for cross-boundary climate change decisions in Hualien and Taitung counties. Because this study used synthesized vulnerability assessments, it does not fully consider all facets of vulnerability related to climate change. We suggest that integrating a climate risk assessment system will divide Taiwan into different zones, and climate change vulnerability should then be assessed.
When townships implement cross-border climate change adaptation plans, climate change education should be carried out. Because climate change involves many fields, vulnerability can integrate different dimensions of adaptation, which will allow people to easily understand local vulnerability. This will further enhance public awareness about the climate change crisis, and makes it easy for local governments to promote cross-boundary resource allocations.
Building adaptive capacity both increases resilience and reduces vulnerability to many hazards [1,5]. Broad responses to climate change in Taiwan, such as those aimed at synthesized biophysical and social vulnerability and climate change action plans seem to be open to participation and contributions from numerous stakeholders on various geographical scales. In 2012, Taiwan set its national adaptation policy. Since then, cities, counties and municipalities had drafted action plans to adapt locally to climate changes. However, no cross-boundary county-based adaptation policies, plans or actions have been proposed. We assert that building a resilient society requires top-down policy guidelines from the central government, bottom-up local government empowerment and the participation of communities. In the near future, the focus should be on helping communities develop strategies and action plans that will guide their adaptation strategies, and further, implement them. This way a resilient society can be realized.

Acknowledgments

The authors would like to thank the Ministry of Science and Technology of the Republic of China, Taiwan, for financially supporting this research under Contract No. NSC102-2410-H-170-005-SS2.

Author Contributions

Yung-Jaan Lee conceived and designed the study. Shih-Chien Lin and Chiao-Chi Chen carried out the action research, and collected and analyzed the data. Yung-Jaan Lee drafted and approved the manuscript. All authors gave their approval of the version submitted for publication.

Conflicts of Interest

The authors declare no conflict of interest.

References

  1. Ahsan, M.N.; Takeuchi, K. The dynamics among poverty, vulnerability, and resilience: Evidence from coastal Bangladesh. Nat. Hazards. 2015. [Google Scholar] [CrossRef]
  2. Andersson-Sköld, Y.; Thorsson, S.; Rayner, D.; Lindberg, F.; Janhall, S.; Jonsson, A.; Moback, U.; Bergman, R.; Granberg, M. An integrated method for assessing climate-related risks and adaptation alternatives in urban areas. Clim. Risk Manag. 2015, 7, 31–50. [Google Scholar] [CrossRef]
  3. Archer, D.; Almansi, F.; DiGregorio, M.; Roberts, D.; Sharma, D.; Syam, D. Moving towards inclusive urban adaptation: Approaches to integrating community-based adaptation to climate change at city and national scale. Clim. Dev. 2014, 6, 345–356. [Google Scholar]
  4. Intergovernmental Panel on Climate Change (IPCC). Summary for Policymakers. Available online: http://epic.awi.de/37531/1/WG2AR5_SPM_FINAL-2.pdf (accessed on 4 January 2016).
  5. Lee, Y.-J. Climate adaptation planning in coastal areas of Chiayi County, Taiwan. In Proceedings of the International Conference on Energy, Environmental & Sustainable Ecosystem Development (EESED 2015), Kunming, China, 21–23 August 2015.
  6. National Disaster Council (NDC). National Climate Change Adaptation Action Plan 2013–2017; NDC: Taipei, Taiwan, 2014. (In Chinese) [Google Scholar]
  7. Hsu, H.-H.; Chou, C.; Wu, Y.-C.; Lu, M.-M.; Chen, C.-T.; Chen, Y.-M. Climate Change in Taiwan: Scientific Report 2011 (Summary); National Science Council: Taipei, Taiwan, 2011. [Google Scholar]
  8. Preston, B.L.; Yuen, E.J.; Warburton, R.M. Putting vulnerability to climate change on the map: A review of approaches, benefits and risks. Sustain. Sci. 2011, 6, 177–202. [Google Scholar]
  9. Intergovernmental Panel on Climate Change (IPCC). Climate Change 2013: The Physical Science Basis; Cambridge University Press: Cambridge, UK; New York, NY, USA, 2013. [Google Scholar]
  10. Jabareen, Y. The Risk City: Cities Countering Climate Change: Emerging Planning Theories and Practices around the World; Springer International Publishers: New York, NY, USA, 2015. [Google Scholar]
  11. Jabareen, Y. Planning the resilient city: Concepts and strategies for coping with climate change and environmental risk. Cities 2013, 31, 220–229. [Google Scholar]
  12. Lee, Y.-J. Social vulnerability indicators as a sustainable planning tool. Environ. Impact Assess. Rev. 2014, 44, v31–v42. [Google Scholar] [CrossRef]
  13. Khailania, D.K.; Pererab, R. Mainstreaming disaster resilience attributes in local development plans for the adaptation to climate change induced flooding: A study based on the local plan of Shah Alam City, Malaysia. Land Use Policy 2013, 30, 615–627. [Google Scholar]
  14. Jha, A.K.; Miner, T.W.; Stanton-Geddes, Z. Building Urban Resilience: Principles, Tools, and Practice. Directions in Development; World Bank: Washington, DC, USA, 2013. [Google Scholar]
  15. Kelman, I.; Gaillard, J.C.; Mercer, J. Climate change’s role in disaster risk reduction’s future: Beyond vulnerability and resilience. Int. J. Disaster Risk Sci. 2015, 6, 21–27. [Google Scholar] [CrossRef]
  16. Bennett, N.J.; Dearden, P.; Peredo, A.M. Vulnerability to multiple stressors in coastal communities: A study of the Andaman coast of Thailand. Clim. Dev. 2014. [Google Scholar] [CrossRef]
  17. Jabareen, Y. An assessment framework for cities coping with climate change: The case of New York City and its PlaNYC 2030. Sustainability 2014, 6, 5898–5919. [Google Scholar]
  18. Menoni, S.; Molinari, D.; Parker, D.; Balio, F.; Tapsell, S. Assessing multifaceted vulnerability and resilience in order to design risk–mitigation strategies. Nat. Hazards 2012, 64, 2057–2082. [Google Scholar] [CrossRef]
  19. Vogel, C.; Moser, S.C.; Kasperson, R.E.; Dabelko, G.D. Linking vulnerability, adaptation, and resilience science to practice: Pathways, players, and partnerships. Glob. Environ. Chang. 2007, 17, 349–364. [Google Scholar] [CrossRef]
  20. Aretano, R.; Semeraro, T.; Petrosillo, I.; de Marco, A.; Pasimeni, M.R.; Zurlini, G. Mapping ecological vulnerability to fire for effective conservation management of natural protected areas. Ecol. Model. 2015, 295, 163–175. [Google Scholar] [CrossRef]
  21. Sajjad, H; Jain, P. Assessment of socio-economic vulnerabilities among urban migrants in South-East Delhi, India. J. Stud. Soc. Sci. 2014, 7, 65–81. [Google Scholar]
  22. Khan, S. Vulnerability assessments and their planning implications: A case study of the Hutt Valley, New Zealand. Nat. Hazards. 2012, 64, 1587–1607. [Google Scholar] [CrossRef]
  23. Marshall, N.A.; Marshall, P.A.; Tamelander, J.; Obura, D.; Malleret-King, D.; Cinner, J.E. A Framework for Social Adaptation to Climate Change: Sustaining Tropical Coastal Communities and Industries; International Union for Conservation of Nature (IUCN): Washington, DC, USA, 2010. [Google Scholar]
  24. Burton, I.; Kates, R.W.; White, G.F. The Environment as Hazard; Oxford University Press: Oxford, UK, 1978. [Google Scholar]
  25. Bizikova, L.; Habtezion, Z.; Bellali, J.; Diakhit, M.M.; Pintér, L. Vulnerability and Climate Change Impact Assessments for Adaptation. Available online: http://www.unep.org/ieacp/files/pdf/ClimateChange_Manual_Final.pdf (accessed on 4 January 2016).
  26. Rosenzweig, C.; Solecki, W.D.; Hammer, S.A.; Mehrohtra, E. Climate Change and Cities First Assessment Report of the Urban Climate Change Research Network; Urban Climate Change Research Network Center for Climate Systems Research Earth Institute: Columbia University, New York, NY, USA, 2011. [Google Scholar]
  27. Japan Ministry of the Environment. Report of Influence of Global Warming/Adaptation Research Committee, Ministry of Environment; Japan Ministry of the Environment, Adaptation Research Committee: Tokyo, Japan, 2008.
  28. National Disaster Council (NDC). Adaptation Strategy to Climate Change in Taiwan; NDC: Taipei, Taiwan, 2012. (In Chinese) [Google Scholar]
  29. National Disaster Council (NDC). Planning Guidelines for the Adaptation Plan to Climate Change for the Local Governments in Taiwan; NDC: Taipei, Taiwan, 2012. (In Chinese) [Google Scholar]
  30. Swart, R.; Biesbroek, R.; Binnerup, S.; Carter, T.R.; Cowan, C.; Henrichs, T.; Loquen, S.; Mela, H.; Morecroft, M.; Reese, M.; et al. Europe Adapts to Climate Change: Comparing National Adaptation Strategies; PEER Report No. 1; Partnership for European Environmental Research: Helsinki, Finland, 2009. [Google Scholar]
  31. Ministry of Housing, Spatial Planning and the Environment, Ministry of Transport, Public Works and Water Management, Ministry of Agriculture, Nature and Food Quality, Ministry of Economic Affairs. National Programme for Spatial Adaptation to Climate Change. Available online: http://www.climatechangesspatialplanning.nl/gfx_content/documents/documentation/National_Adaptation_Strategy_The_Netherlands.pdf (accessed on 4 January 2016).
  32. Allmendinger, P.; Haughton, G. Spatial planning, devolution, and new planning spaces. Environ. Plan. C 2010, 28, 803–818. [Google Scholar] [CrossRef]
  33. UNDP. Adaptation Policy Frameworks for Climate Change (APF); Cambridge University Press: Cambridge, UK, 2004. [Google Scholar]
  34. Liu, M.-D.; Xu, Y.-Z. Cross-boundary Cooperation Model and Case Analysis of Local Governments - Comparison between Taiwan and Germany. Public Adm. Rep. 2011, 41, 37–72. (In Chinese) [Google Scholar]
  35. Jabareen, Y. Sustainable urban forms: Their typologies, models, and concepts. J. Plan. Educ. Res. 2006, 26, 38–52. [Google Scholar] [CrossRef]
  36. Aylett, A. Institutionalizing the urban governance of climate change adaptation: Results of an international survey. Urban Clim. 2015, 14, 4–16. [Google Scholar] [CrossRef]
  37. National Disaster Council (NDC). Strategic Plan for National Spatial Development; NDC: Taipei, Taiwan, 2010. (In Chinese) [Google Scholar]
  38. Carmin, J.; Anguelovski, I.; Roberts, D. Urban climate adaptation in the global south: Planning in an emerging policy domain. J. Plan. Educ. Res. 2012, 32, 18–32. [Google Scholar] [CrossRef]
  39. National Disaster Council (NDC). Sustainable Development Strategic Plan for Hualien and Taitung Areas; NDC: Taipei, Taiwan, 2012. (In Chinese) [Google Scholar]
  40. Dewan, T.H. Societal impacts and vulnerability to floods in Bangladesh and Nepal. Weather Clim. Extrem. 2015, 7, 36–42. [Google Scholar] [CrossRef]
  41. Schöpfel, J.; Farace, D.J. Grey literature. In Encyclopedia of library and information sciences, 3rd ed.; Bates, M.J., Maack, M.N., Eds.; CRC Press: Boca Raton, FL, USA, 2010; pp. 2029–2039. [Google Scholar]
  42. The National Science and Technology Center for Disaster Reduction (NCDR). Disaster potential map. Available online: http://www.ey.gov.tw/en/Dictionary_Content.aspx?n=A240F8389D824425&sms=D8F3EB15472D7847&s=60D0017E5CD0B6E4 (accessed on 21 December 2015).

