
Describing Long-Term Electricity Demand Scenarios in the Telecommunications Industry: A Case Study of Japan

 ,
, 
Abstract
:1. Introduction
2. Current Trends and Problems in the Telecommunications Industry
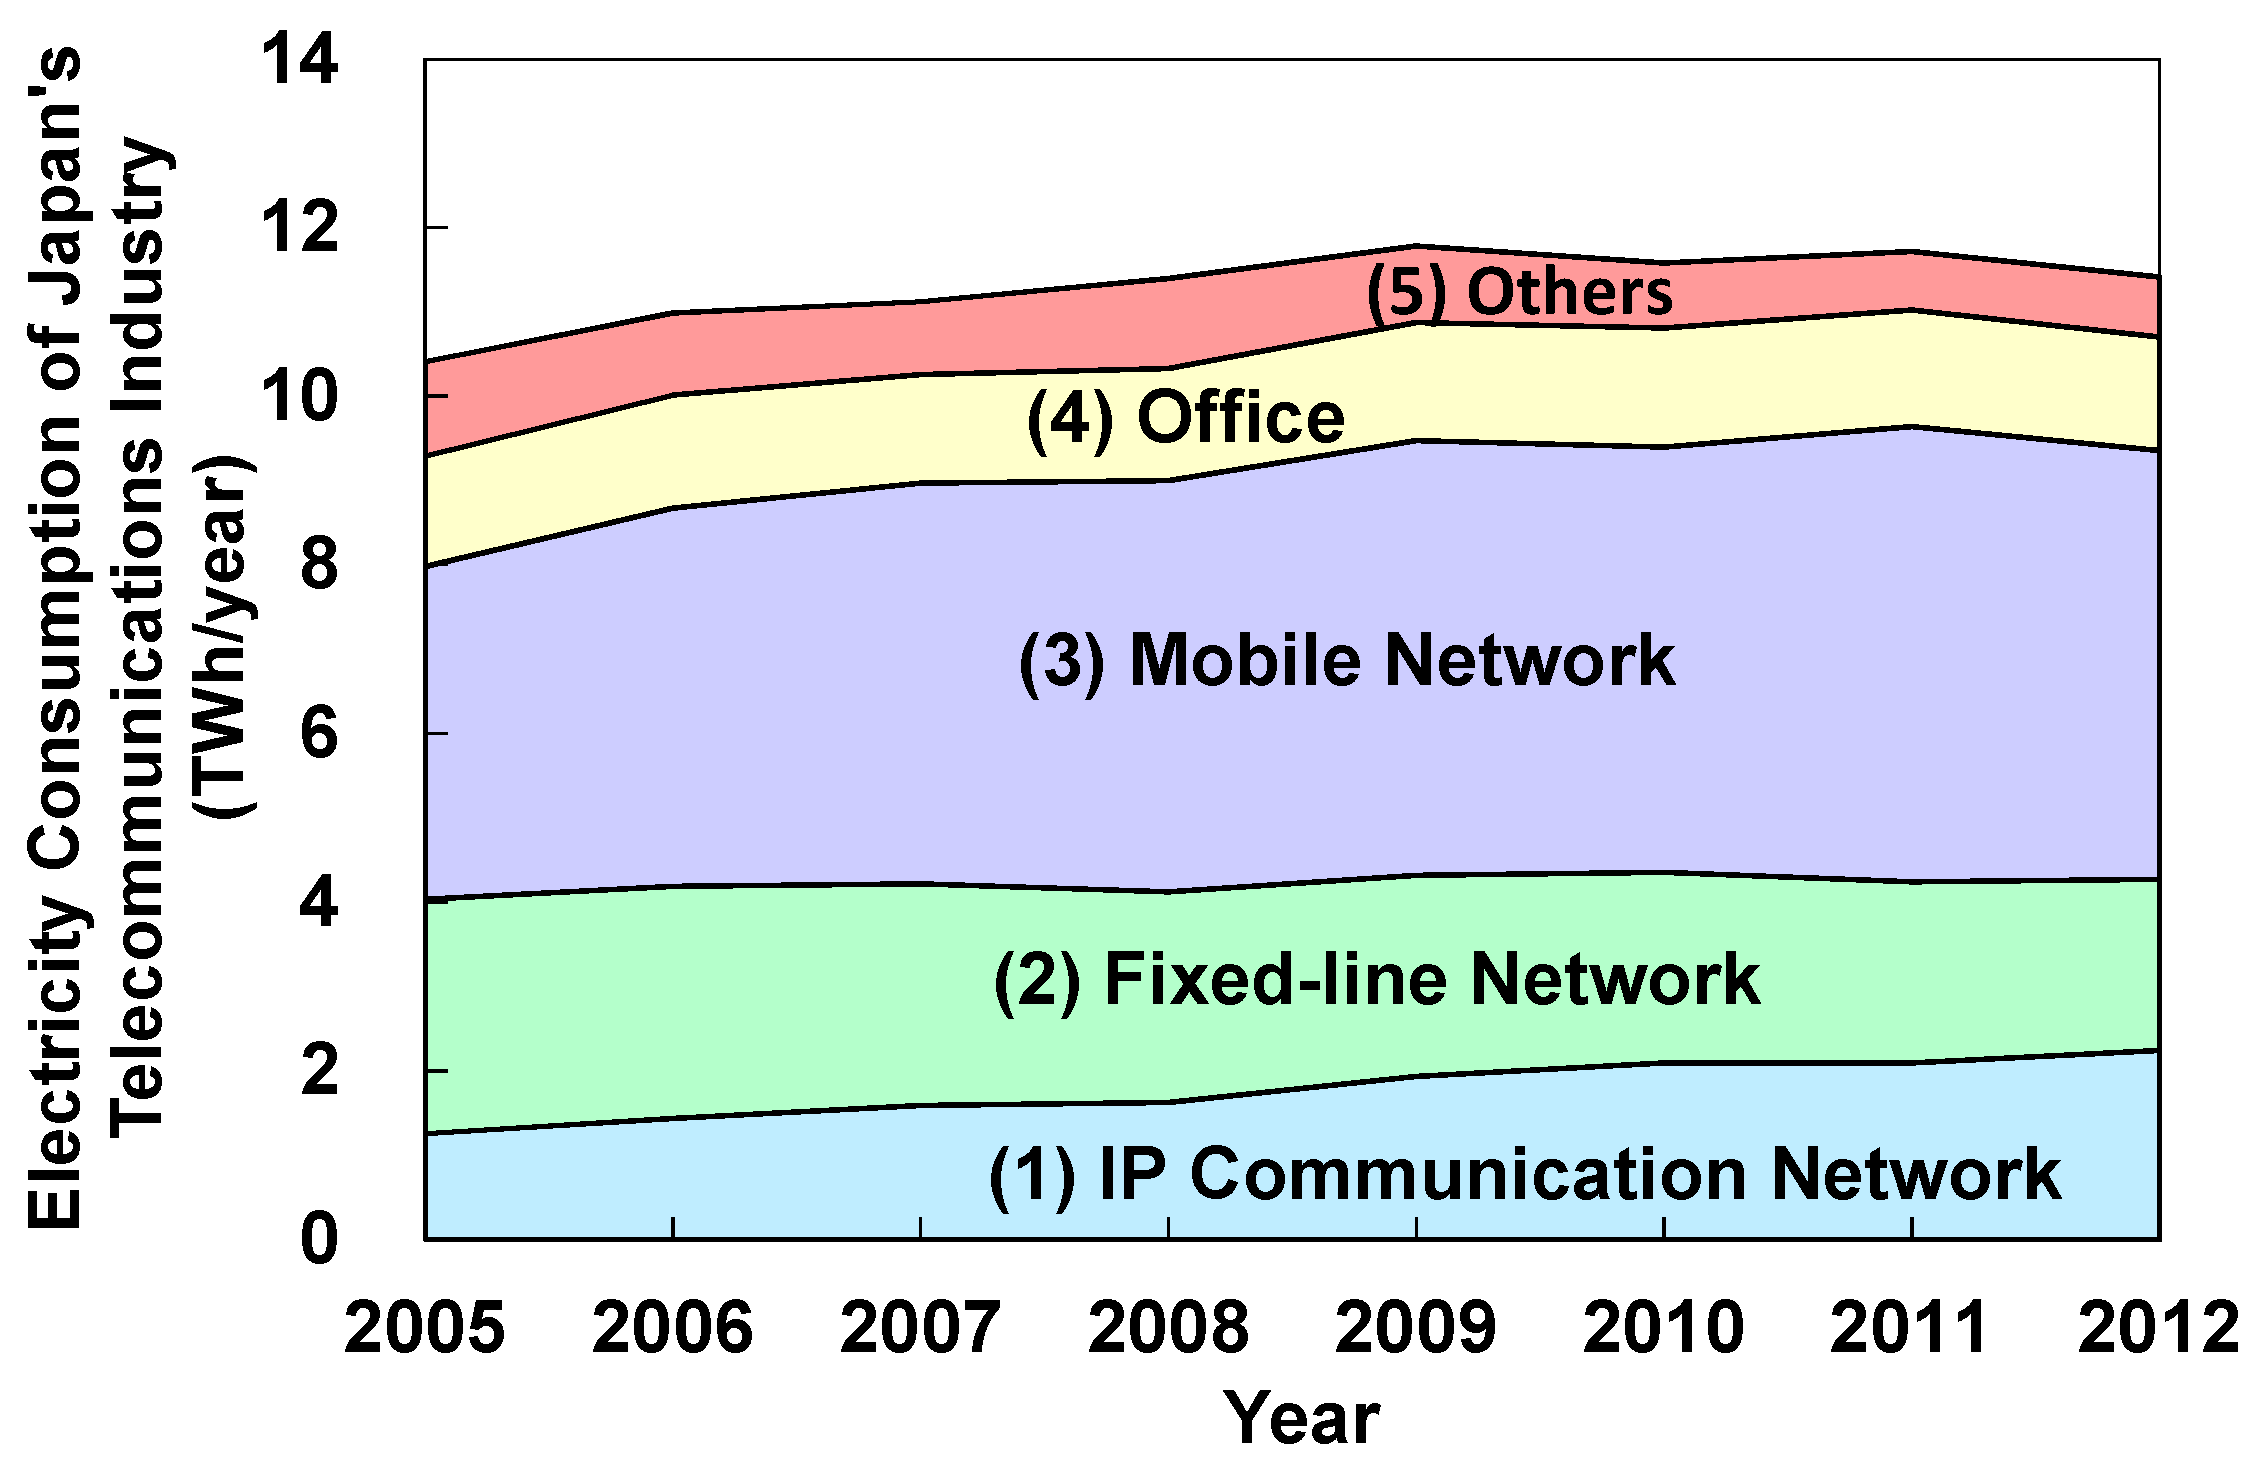
2.1. Current Trends and Outlook of Electricity Consumption in the Telecommunications Industry


| Category | Provided Services | Constituent Equipment |
|---|---|---|
| (1) IP (Internet Protocol) communication network |
|
|
| (2) Fixed-line network |
|
|
| (3) Mobile network |
|
|
| (4) Office |
|
|
| (5) Others |
|
|
2.2. Related Work and Problems
3. Methodology for Describing Electricity Demand Scenarios in the Telecommunications Industry
3.1. Approach
- (1)
- Developing the electricity demand model for telecommunications industry (EDMoTI) to estimate the future electricity consumption of communication buildings;
- (2)
- Formalizing a process to describe electricity demand scenarios in the telecommunications industry using EDMoTI based on a scenario planning method [20].

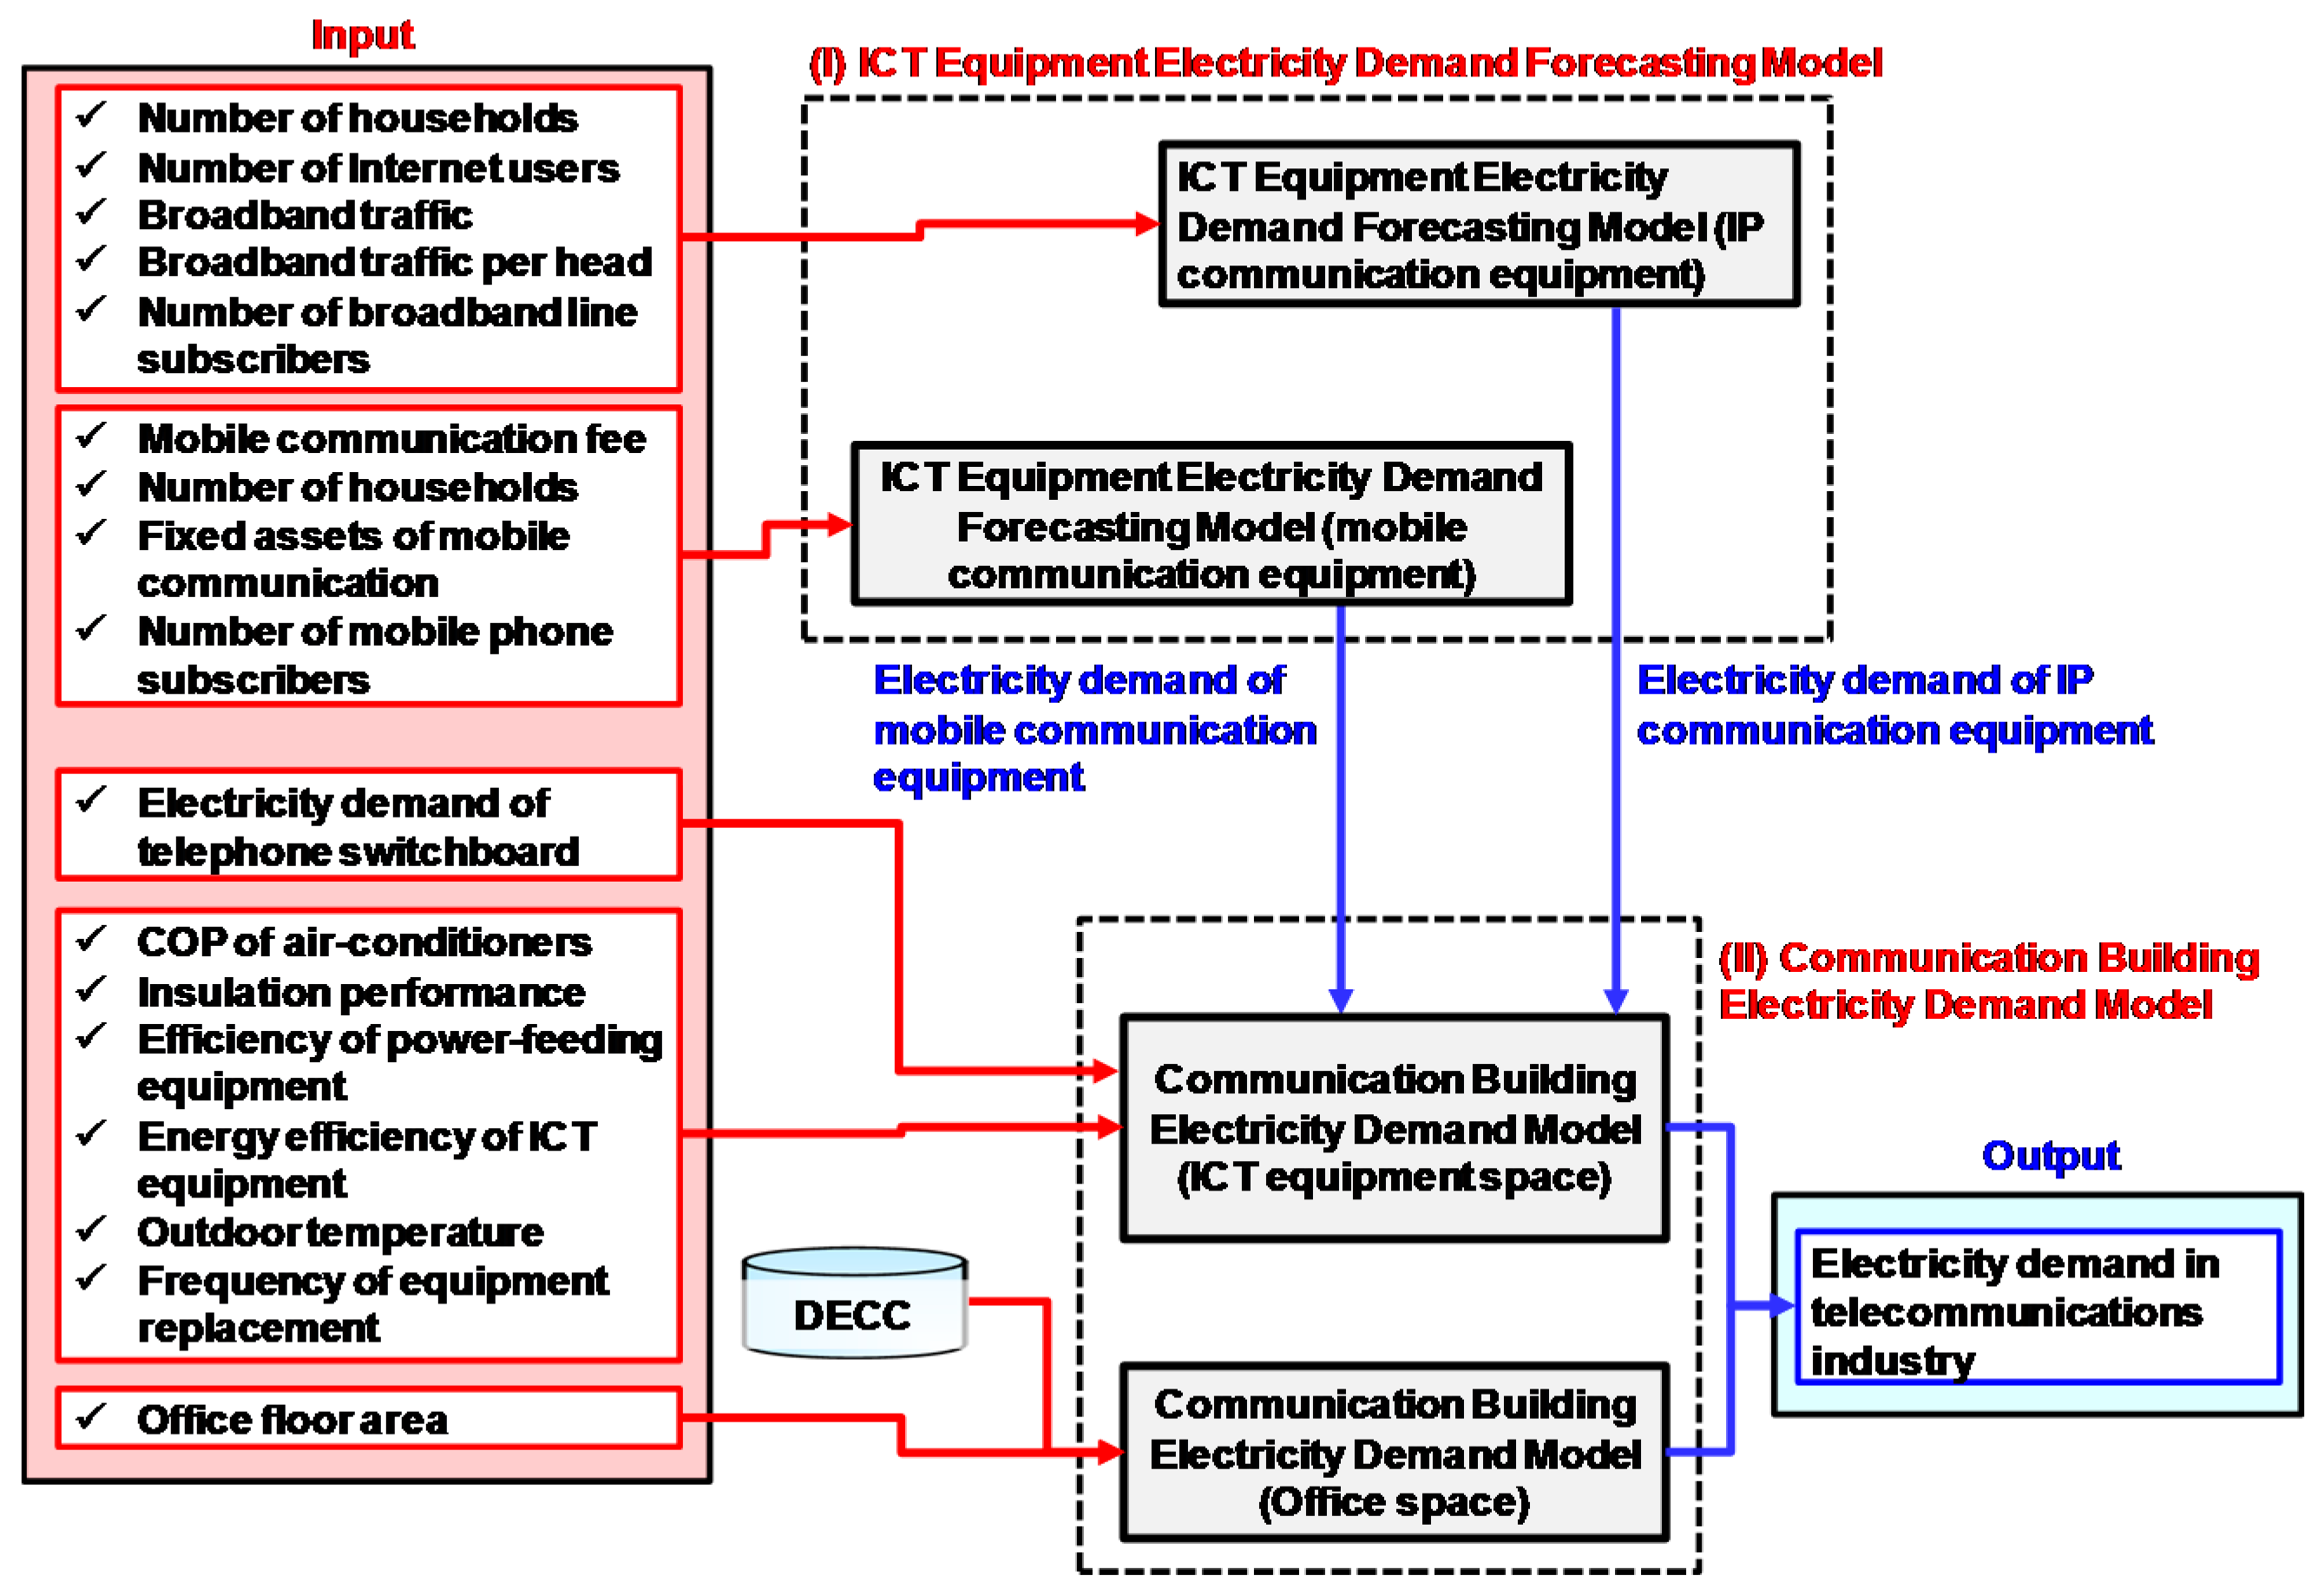
3.2. Electricity Demand Model for Telecommunications Industry

3.2.1. ICT Equipment Electricity Demand Forecasting Model
3.2.2. Communication Building Electricity Demand Model
- Calculating the electricity consumption of ICT equipment space:
- Calculating the electricity consumption of office space:
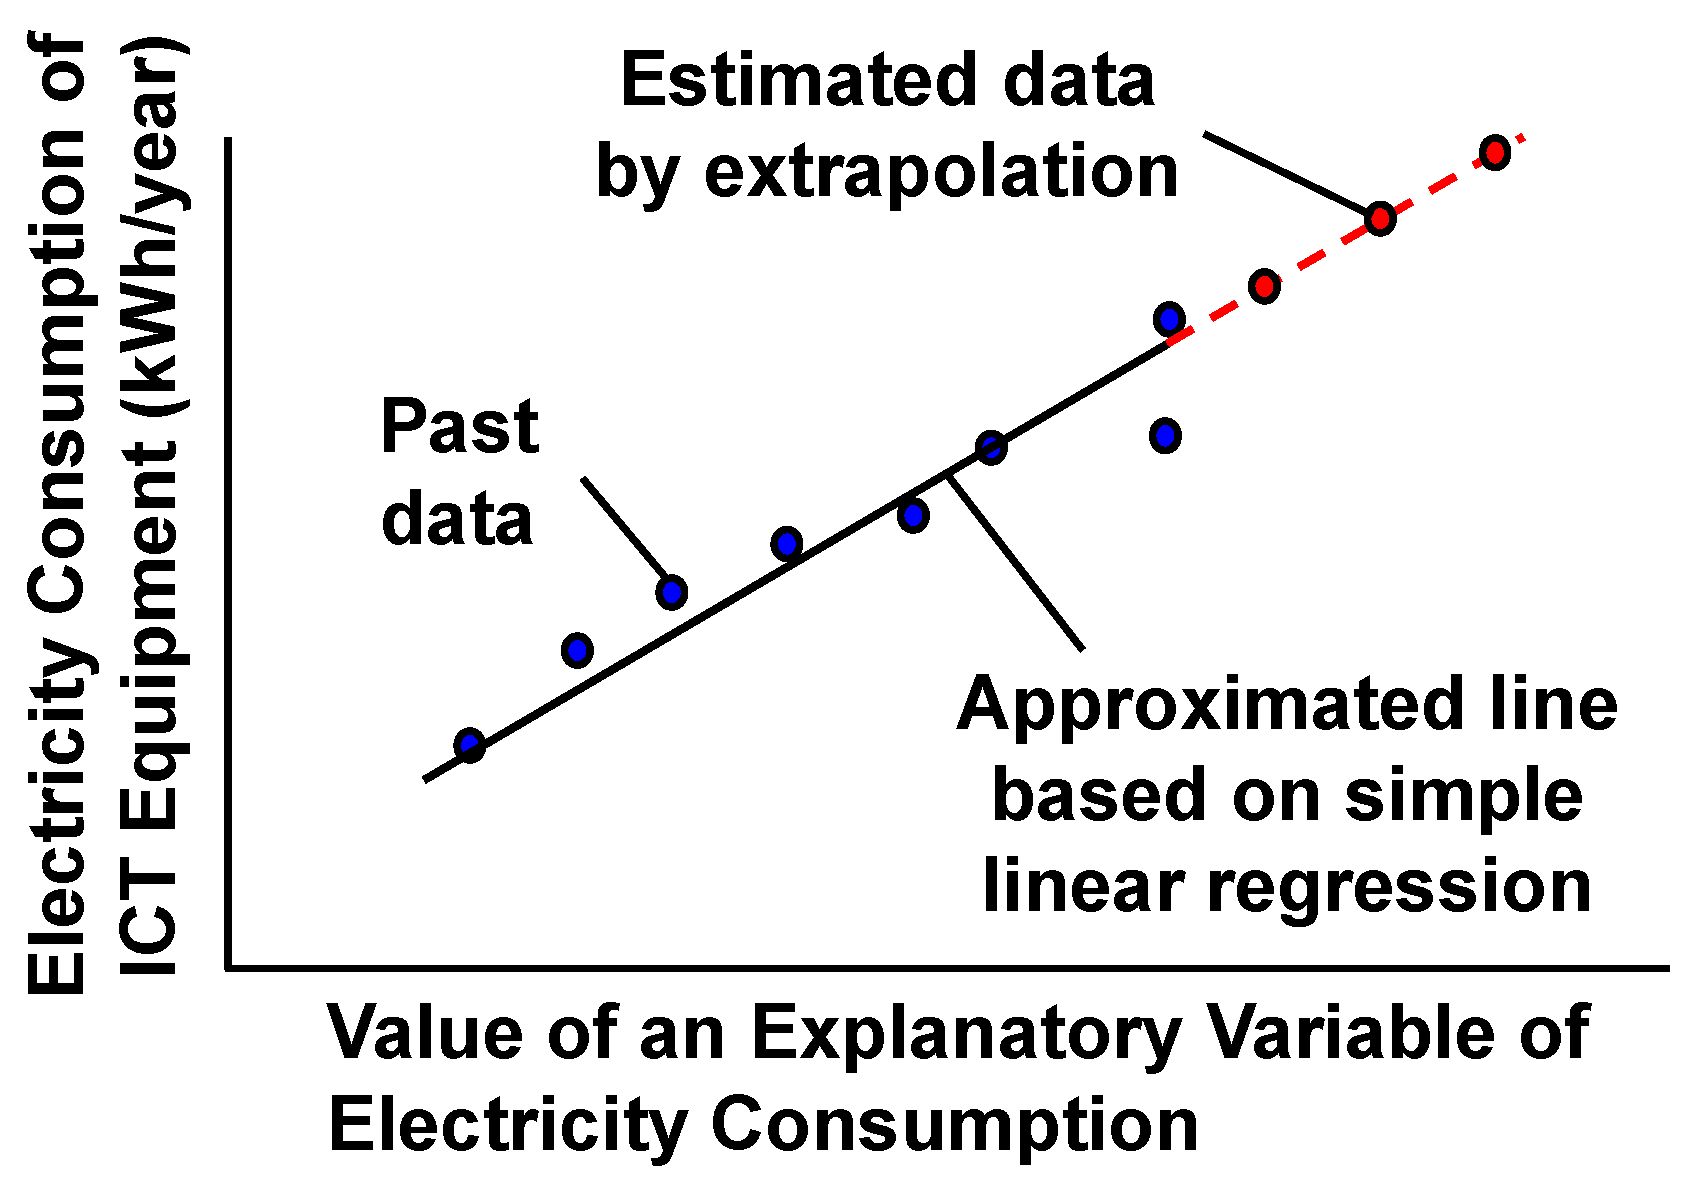
3.3. Deriving the Formula of the ICT Equipment Electricity Demand Forecasting Model in the Japanese Context
| Explanatory Variables | R2 | Coefficient | ||
|---|---|---|---|---|
| A | B | |||
| IP communication equipment | ||||
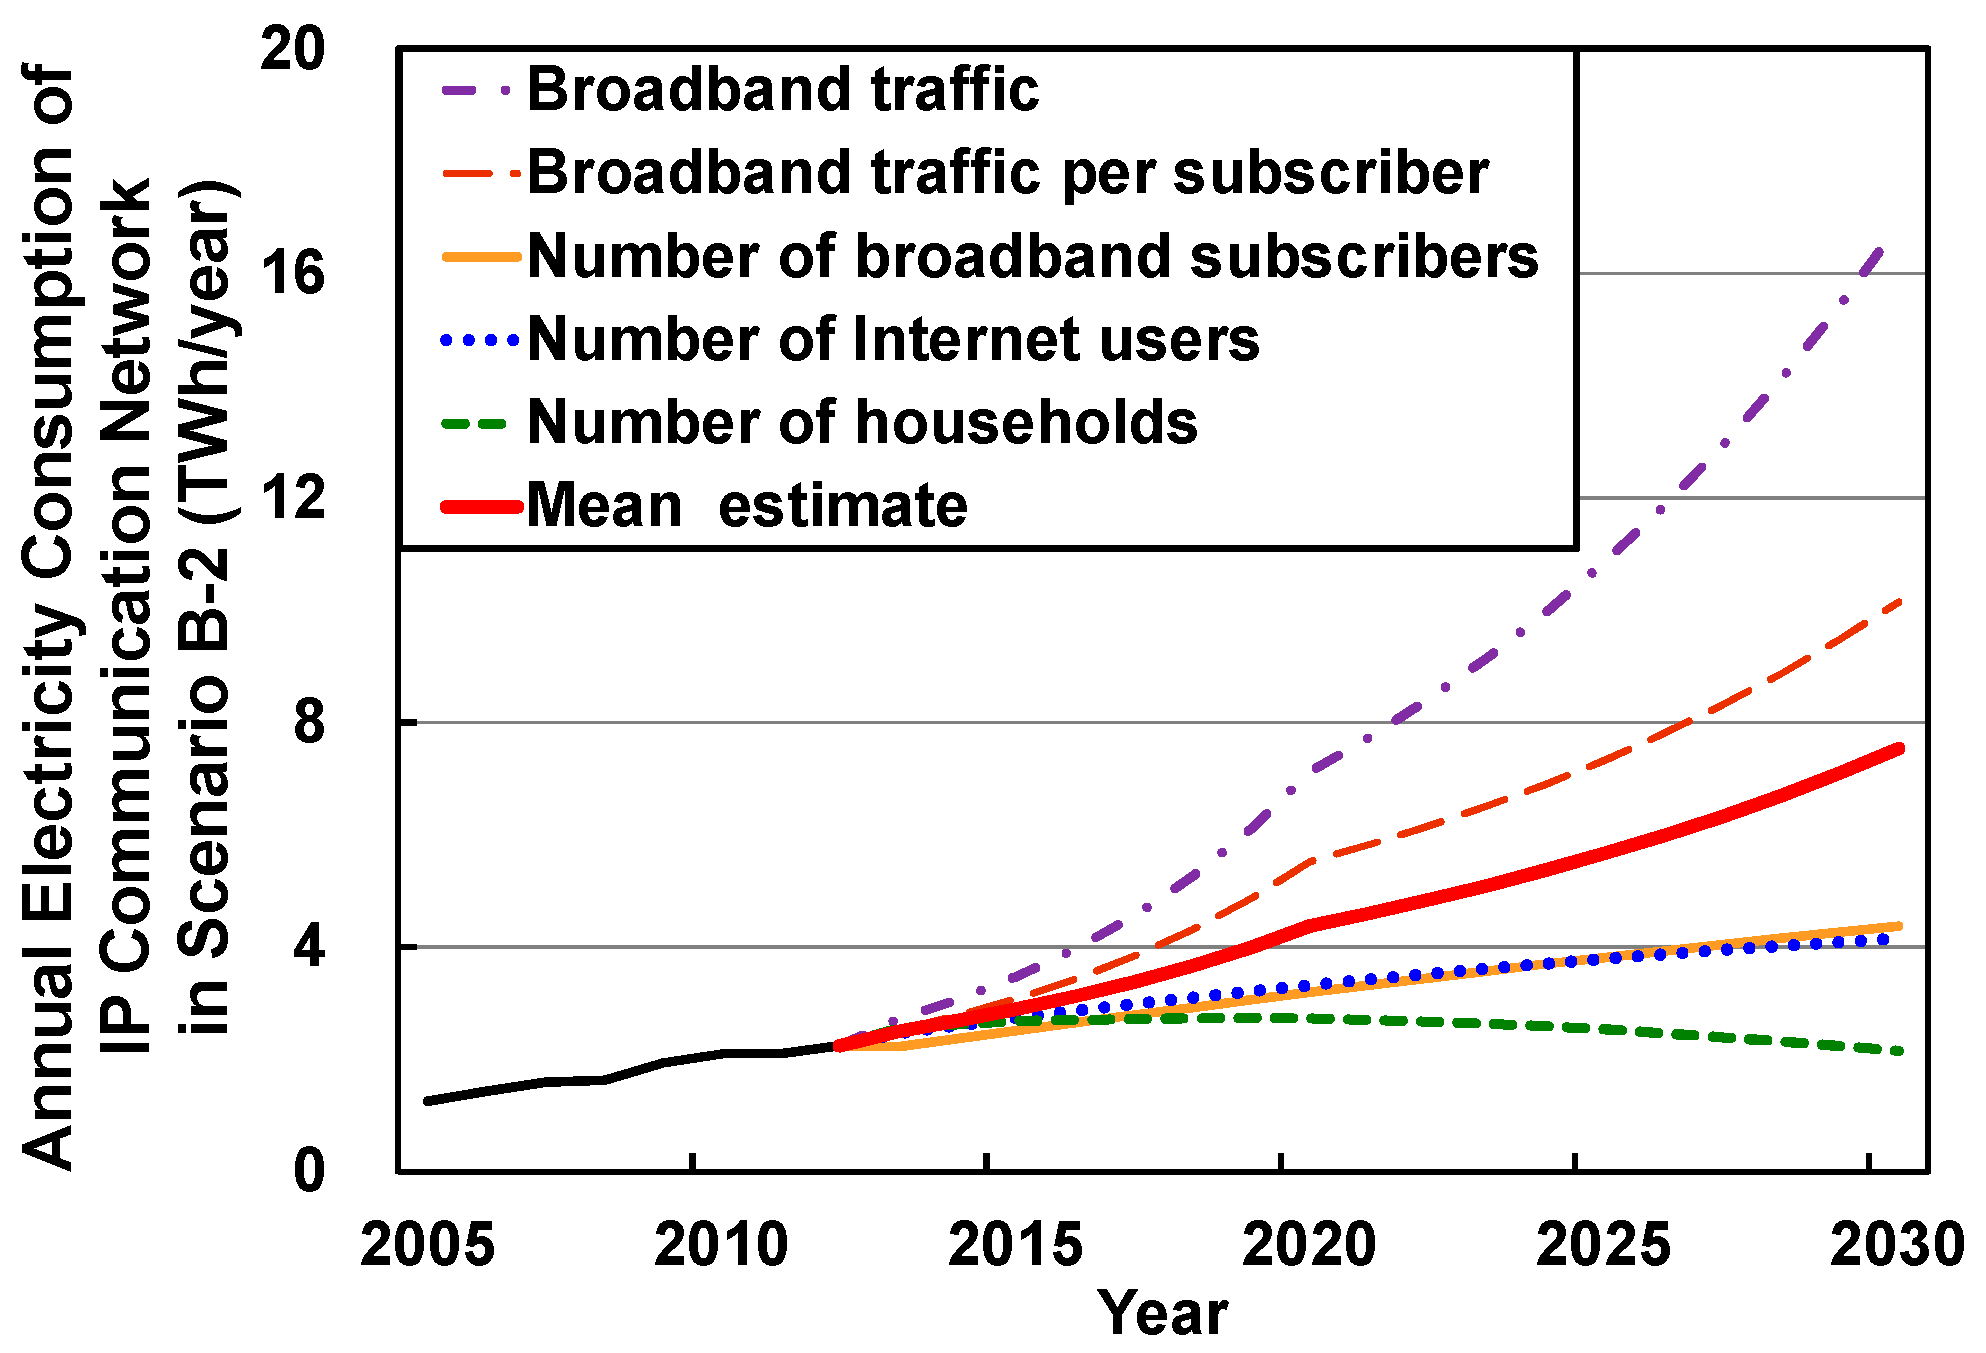
| 1 | Number of national households (thousand) | 0.976 | 1.8 × 10⁻⁴ | −8.0 |
| 2 | Number of broadband subscribers (thousand) | 0.971 | 3.8 × 10⁻⁵ | −0.22 |
| 3 | Number of Internet users (thousand) | 0.964 | 5.1 × 10⁻⁵ | −3.6 |
| 4 | Broadband traffic (Gbps) | 0.962 | 4.1 × 10⁻⁴ | 0.56 |
| 5 | Broadband traffic per subscriber (bps/subscriber) | 0.955 | 1.7 × 10⁻⁵ | 0.37 |
| Mobile communication equipment | ||||
| 1 | Mobile communication fee (JPY/household/year) | 0.912 | 4.5 × 10⁻⁵ | −0.78 |
| 2 | Fixed assets of mobile communication (billion JPY) | 0.846 | 4.6 × 10⁻⁴ | 1.8 |
| 3 | Number of national households (thousand) | 0.771 | 1.8 × 10⁻⁴ | −6.5 |
| 4 | Number of mobile phone subscribers (thousand) | 0.760 | 1.7 × 10⁻⁵ | 0.93 |
3.4. Procedure for Undertaking Scenario Analysis of Electricity Consumption
- Problem setting: The scenario designers explicitly define the objective of scenario analysis being undertaken (i.e., what should be achieved using the scenario analysis?) and a region and time horizon of interest.
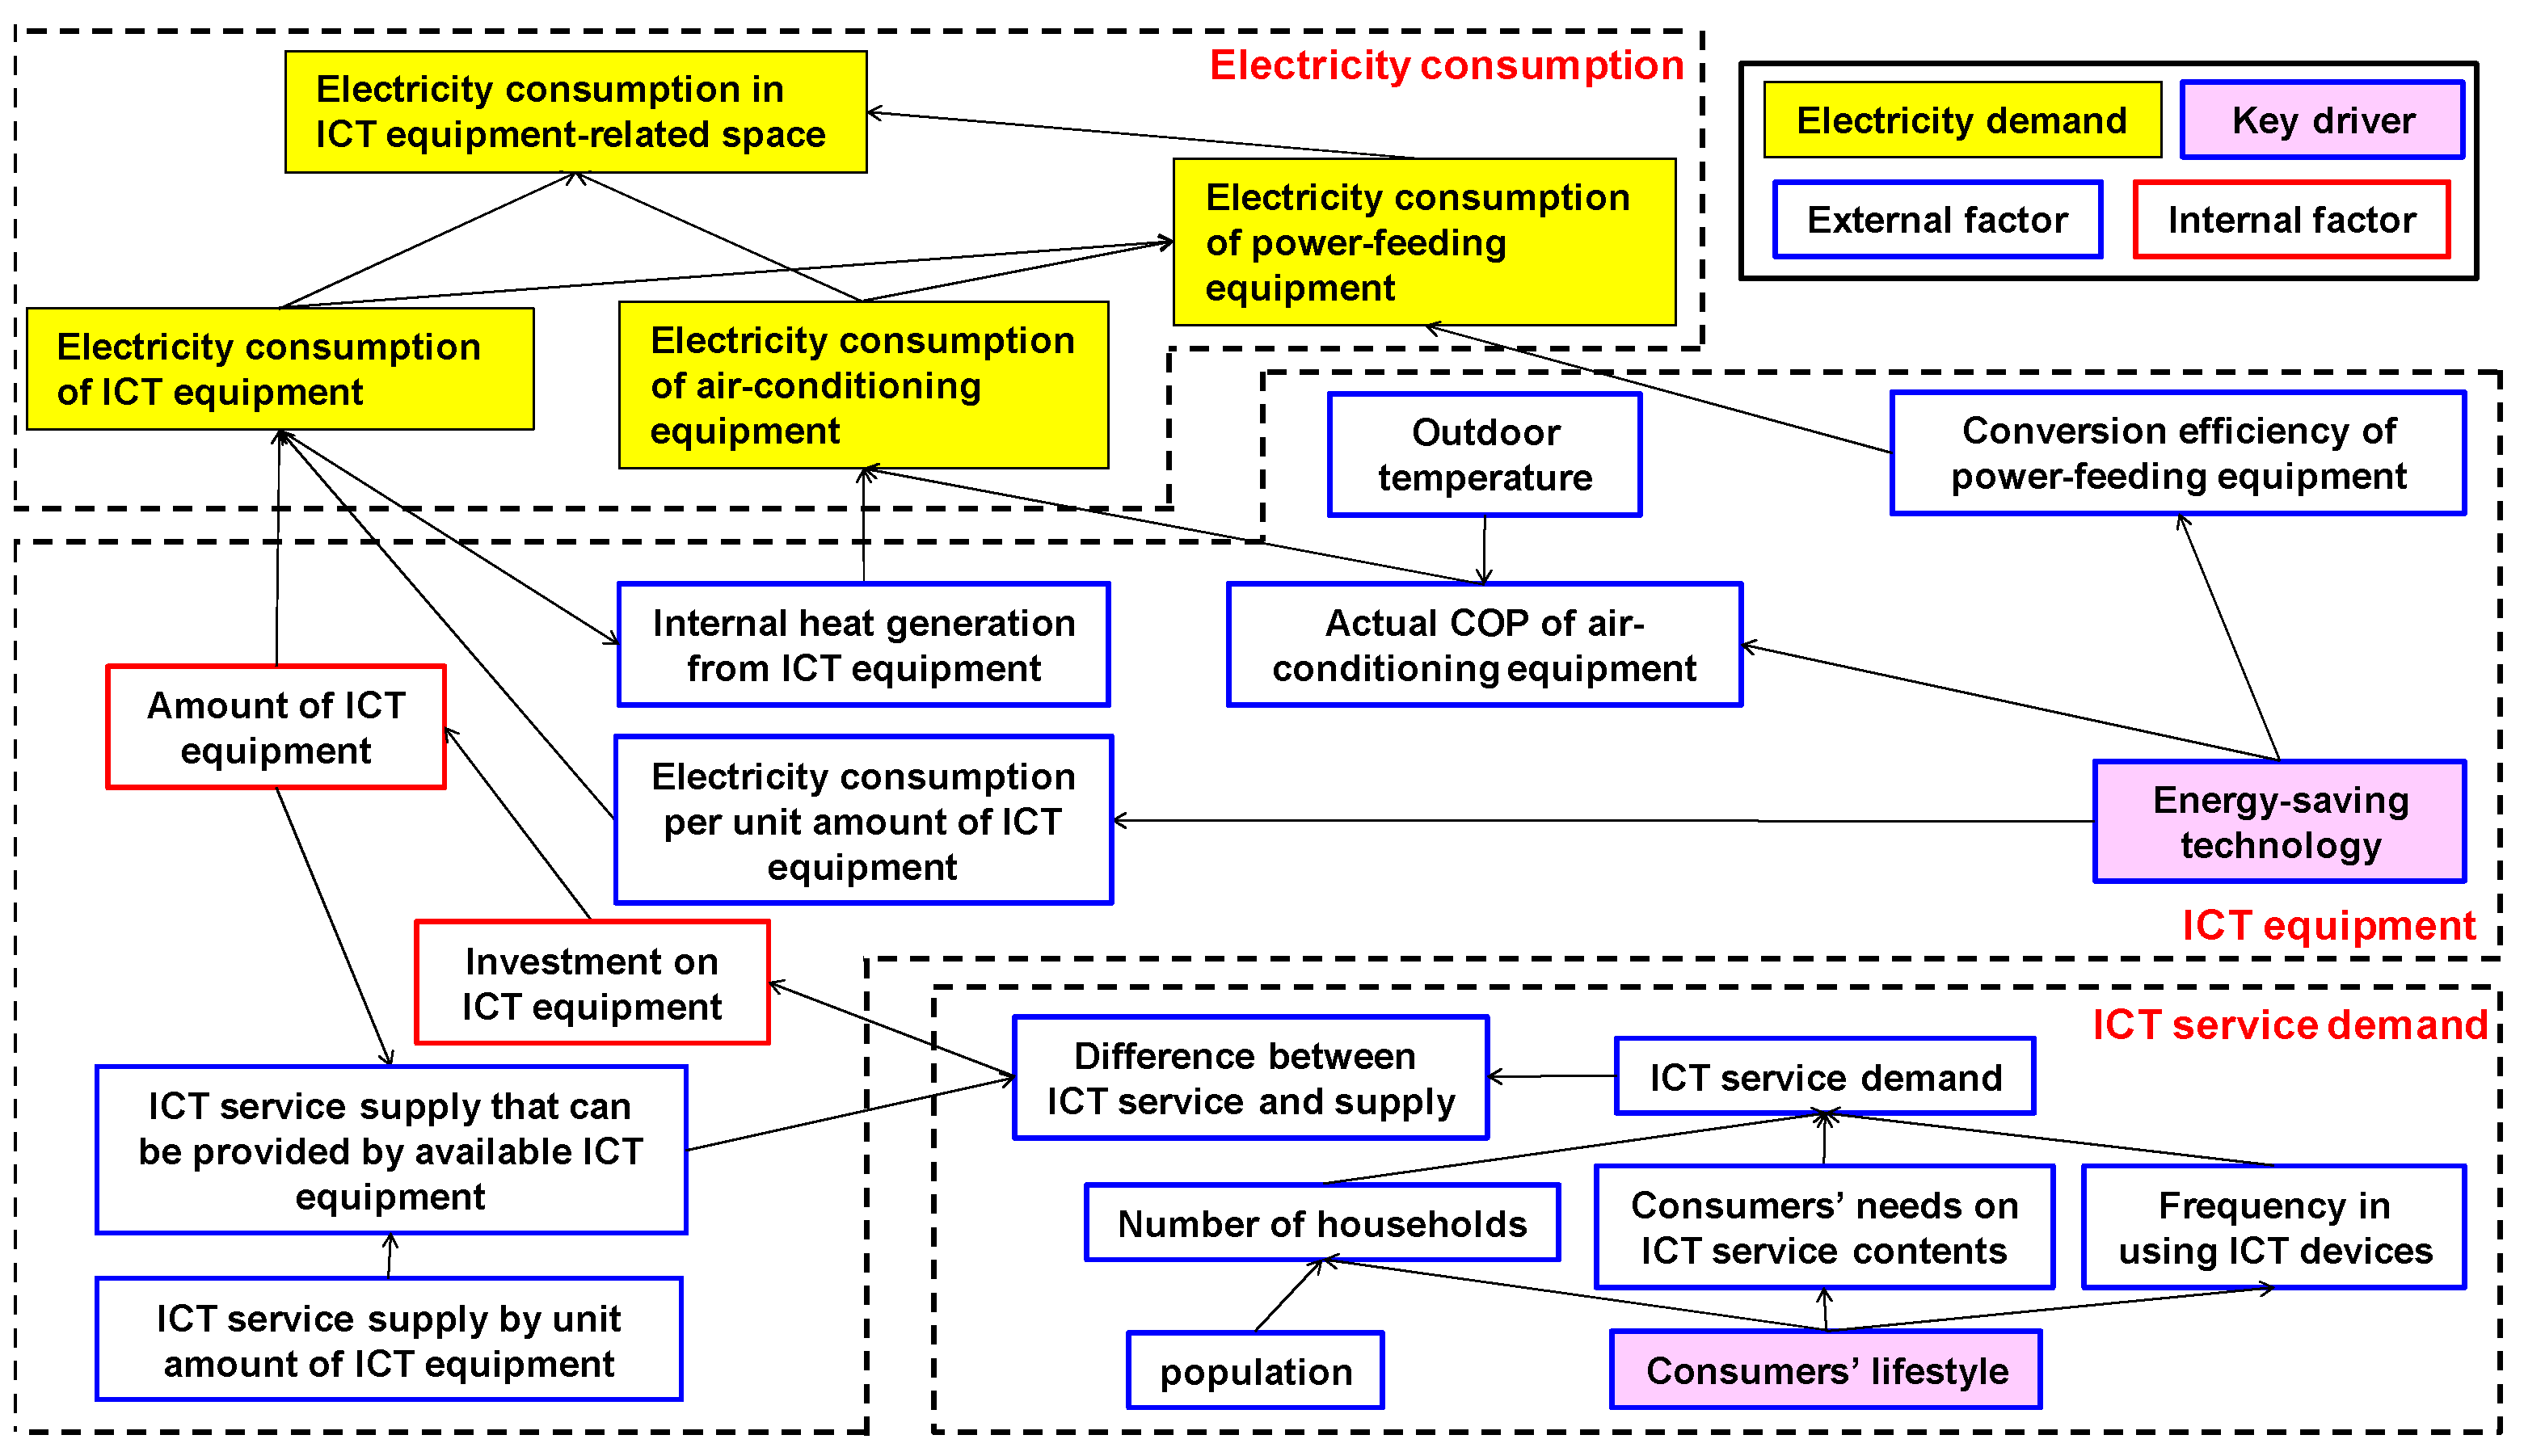
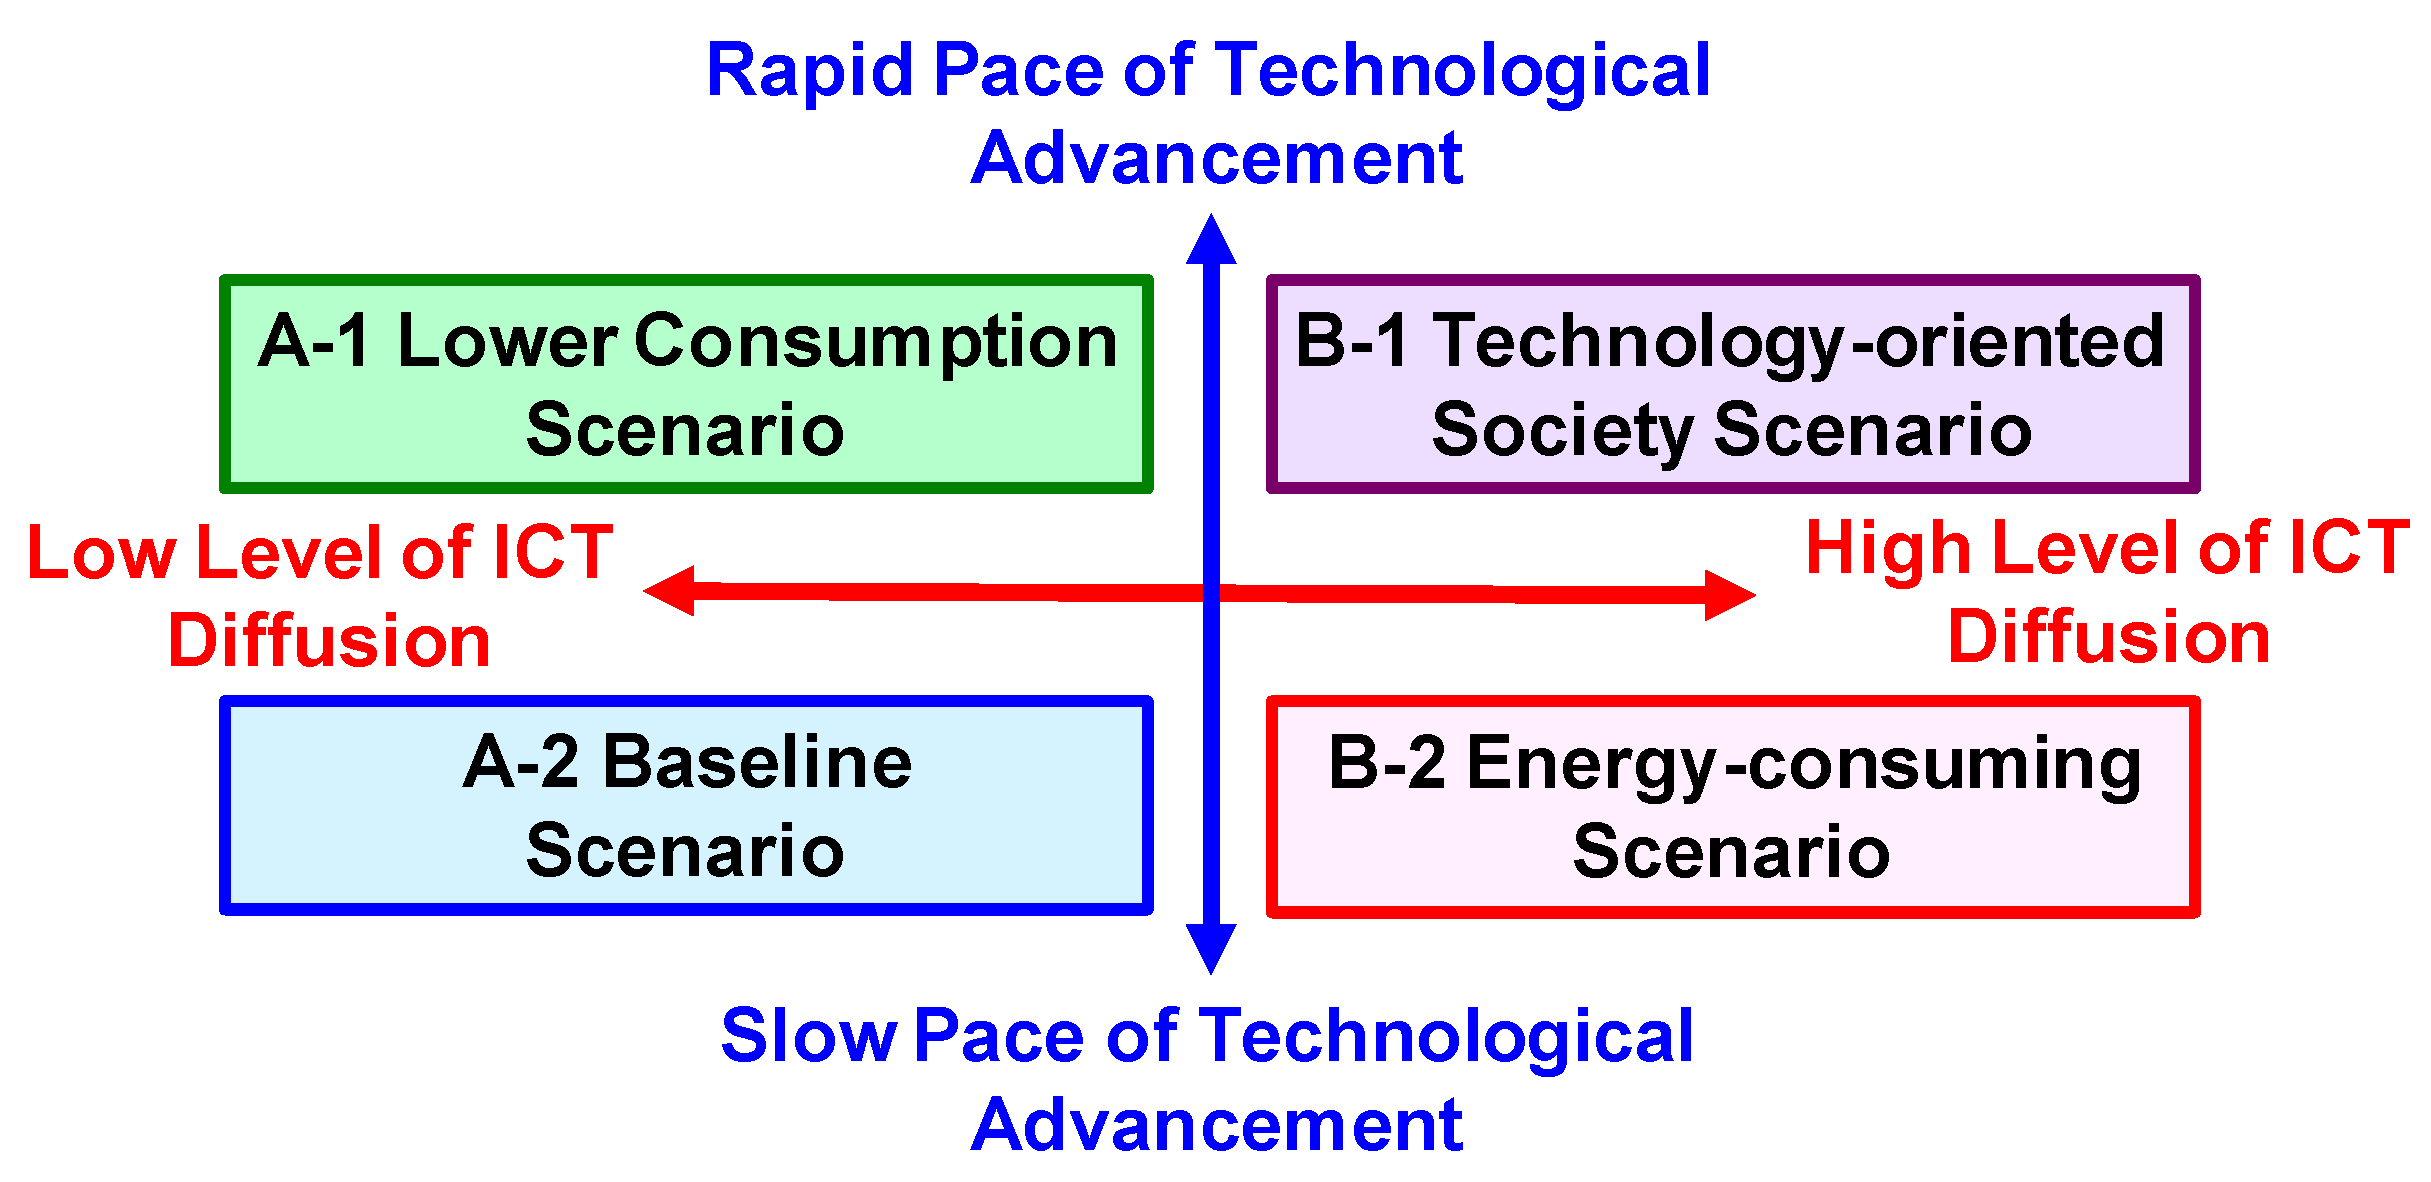
- Extracting key drivers: The scenario designers extract key drivers to delineate a scenario structure. The scenario designers organize a workshop in constructing a causal network in order to understand the relationship between external and internal factors of electricity consumption in the telecommunications industry by utilizing a brainstorming technique (e.g., PEST (political, economic, social and technological) analysis [27] and the KJ method [28]). Based on the causal network, the two-axis method [20] is applied to generate four contrasting scenarios by placing a major factor influencing electricity consumption (i.e., key driver) on each of two axes. The two key drivers chosen should be “high impact, high uncertainty”, to ensure that the four quadrants defined by their intersection are clearly differentiated.
- Describing scenario storylines: The scenario designers set each of the four quadrants as a sub-scenario, in which the scenario designers define the scenario titles and describe/narrate the storylines of each sub-scenario.
- Describing sub-scenarios with EDMoTI: The scenario designers detail the storylines of the four sub-scenarios. In this step, each sub-scenario is quantified to estimate future electricity consumption. More concretely, in each sub-scenario, the scenario designers assume the values of the input parameters in Figure 3 to be consistent with the storyline described in Step 3. Then, the scenario designers estimate the future electricity consumption of IP/mobile communication equipment using Model (I), followed by estimating a whole communication building using Model (II).
4. Case Study: Describing Electricity Demand Scenarios in Japan’s Telecommunications Industry
4.1. Problem Setting
4.2. Extracting Key Drivers

4.3. Describing Scenario Storylines
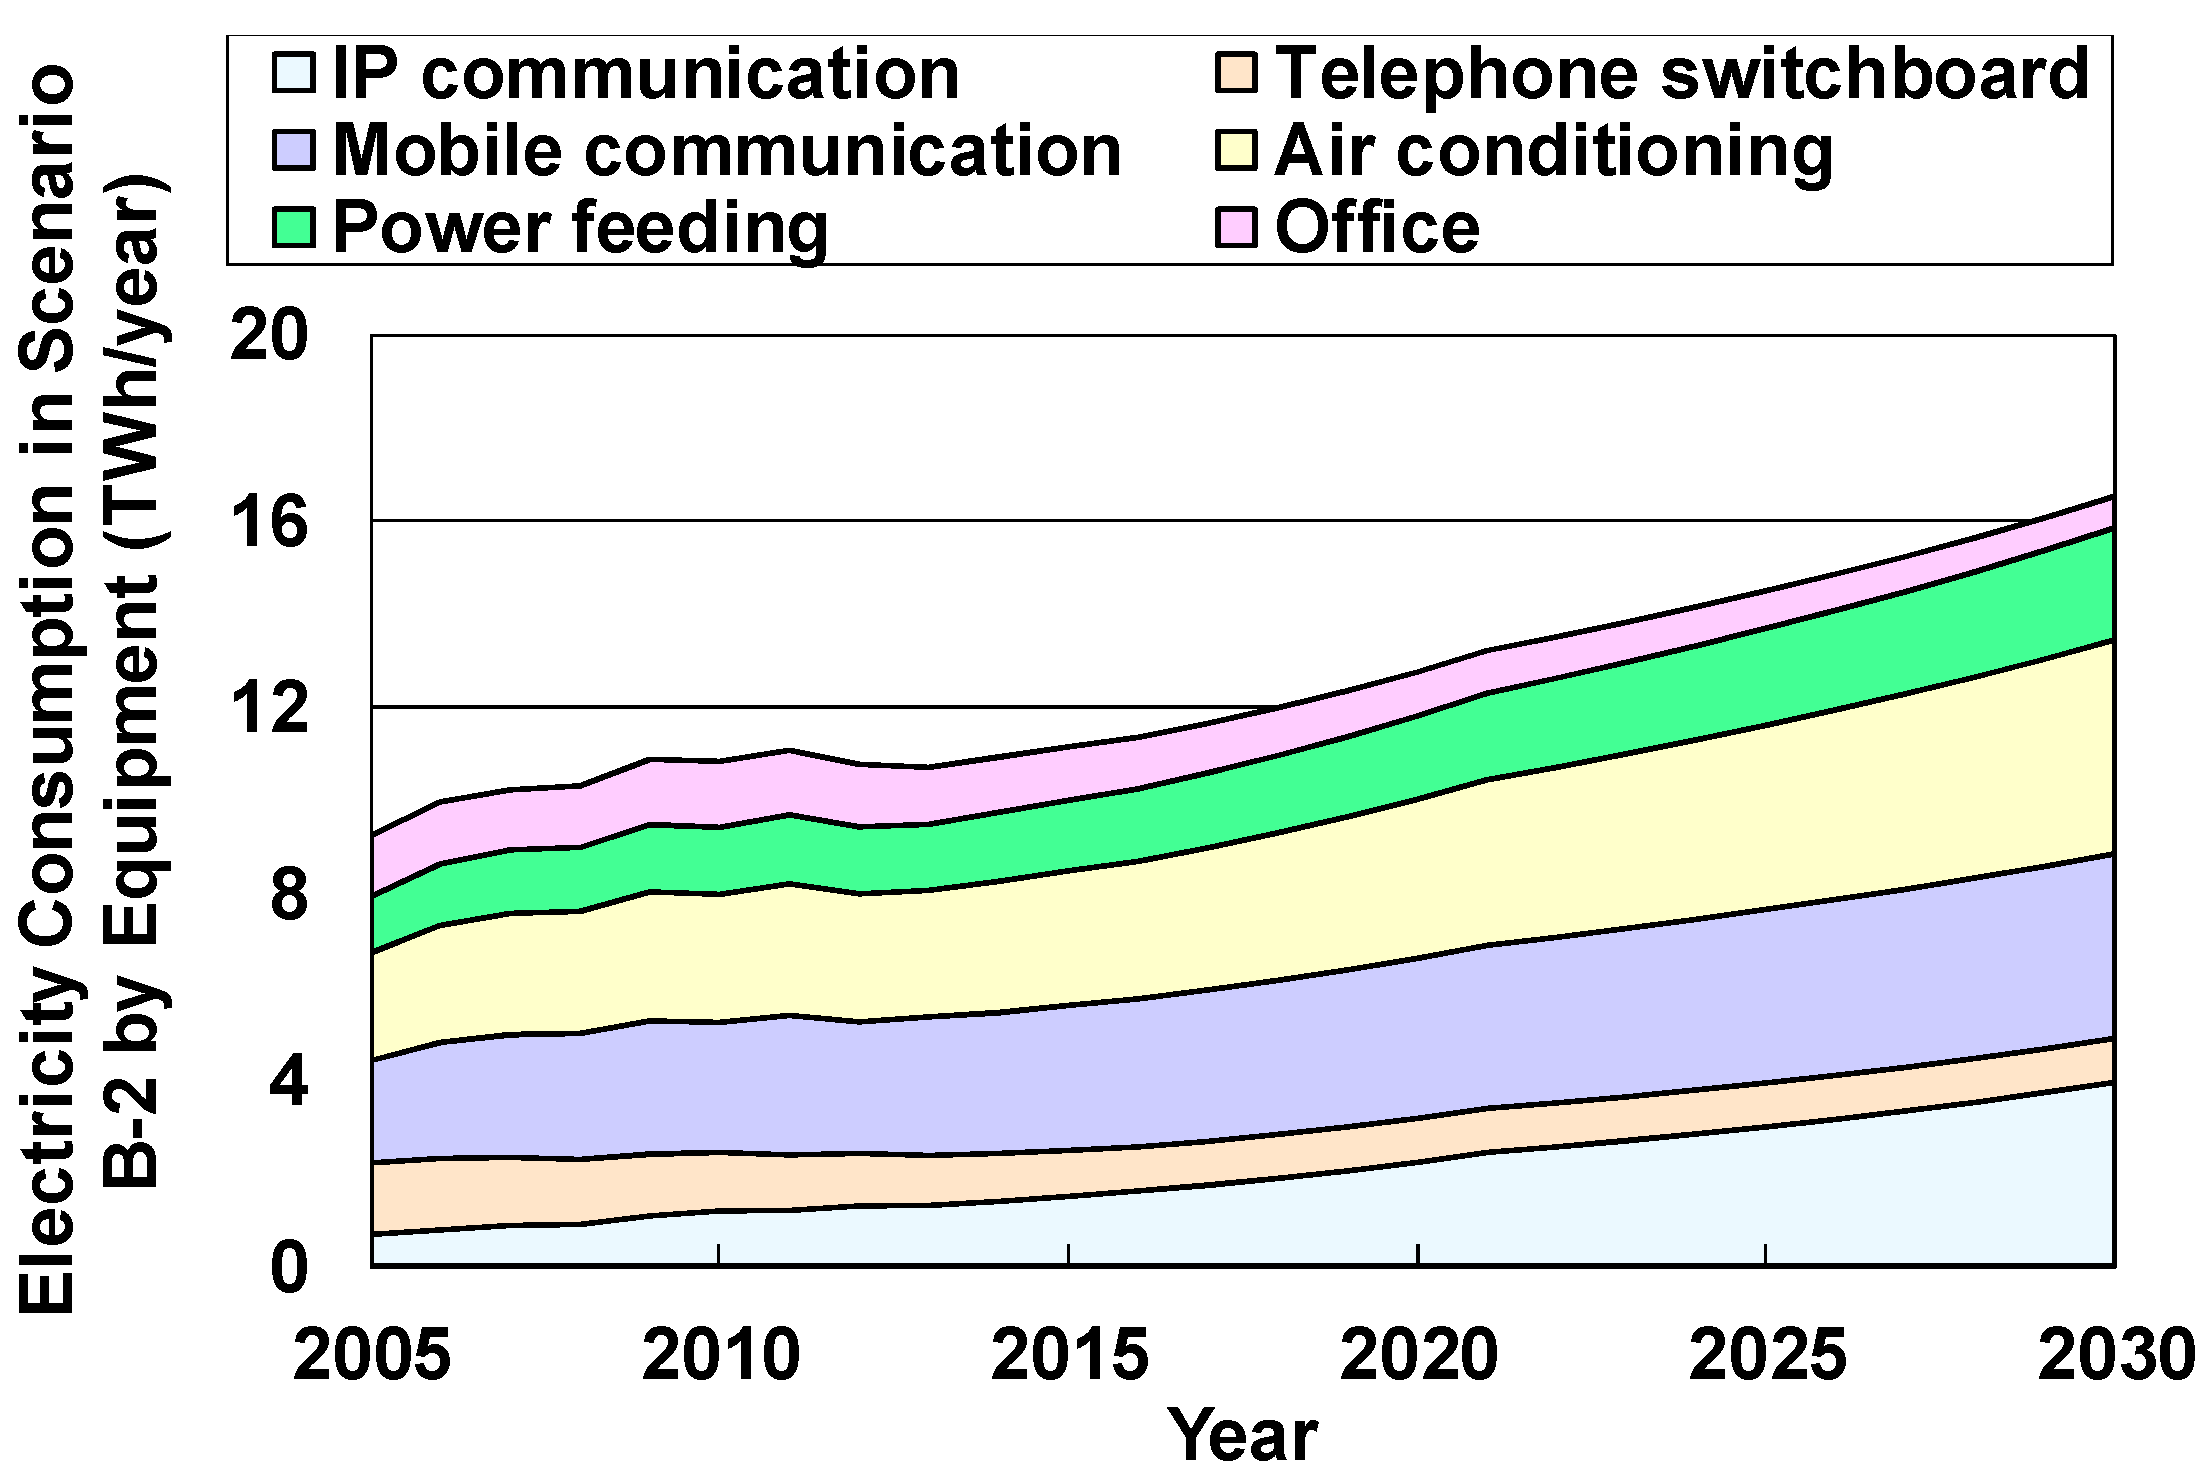
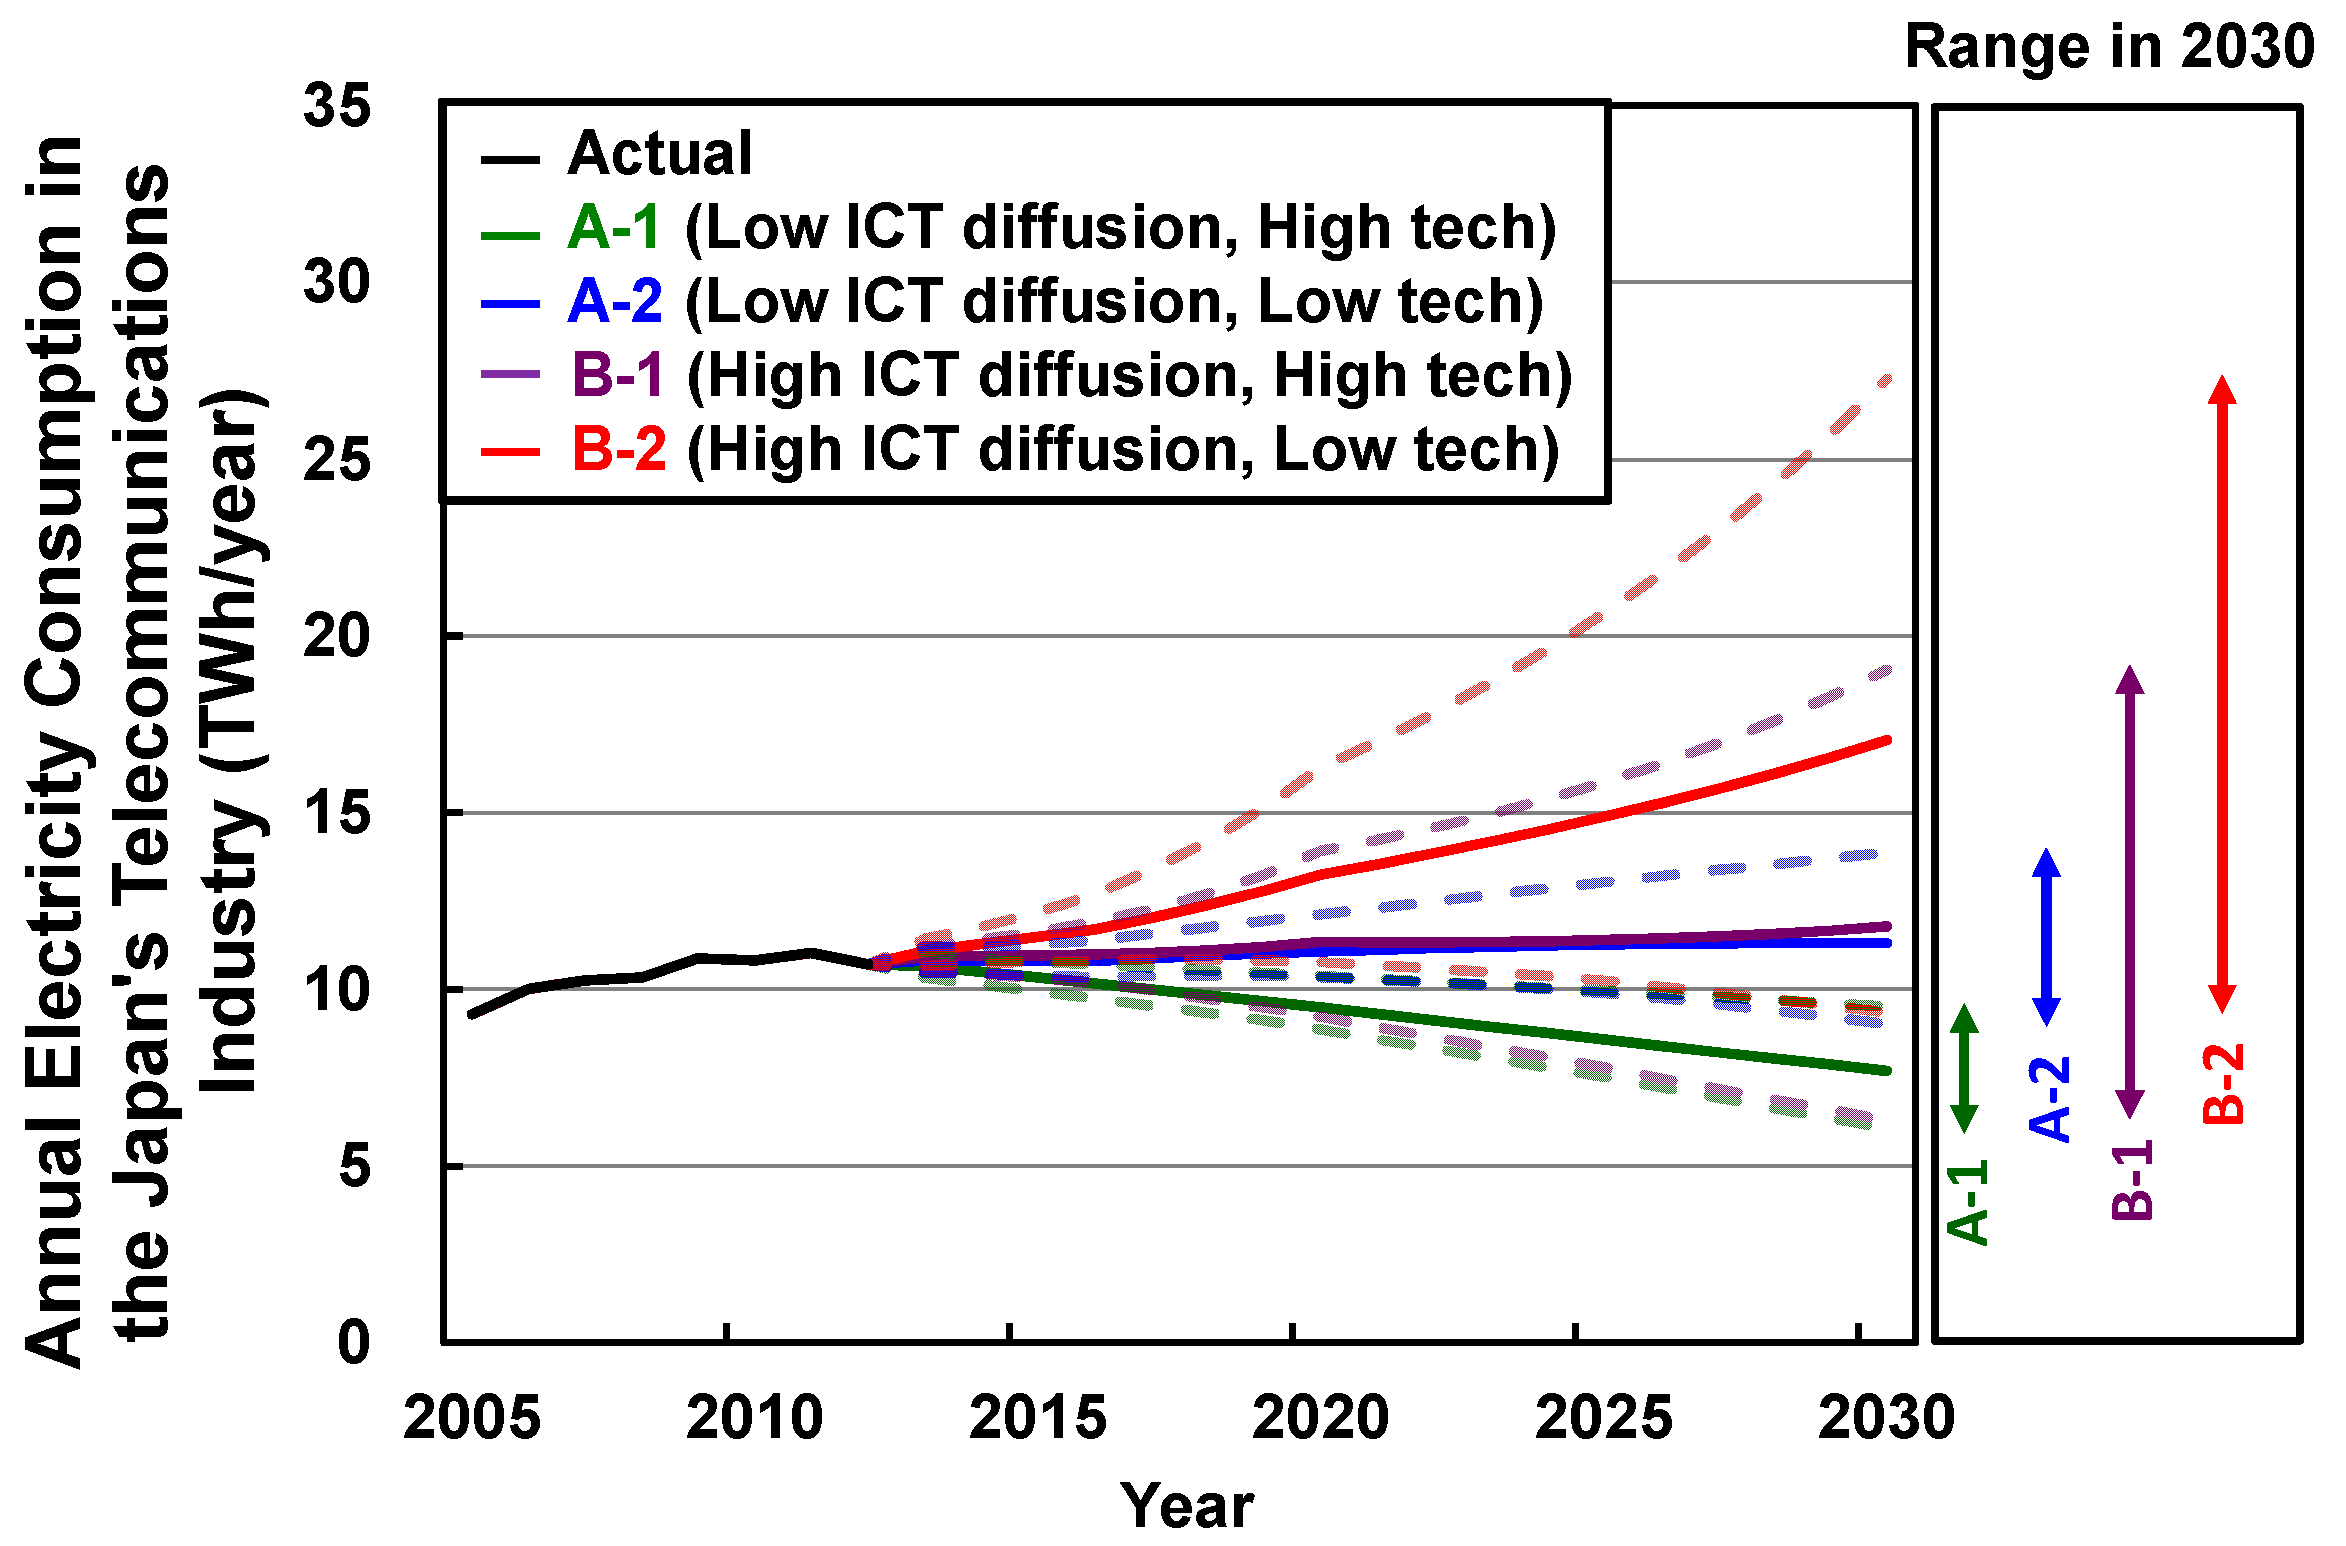
4.4. Describing Sub-Scenarios with Simulations of Electricity Consumption
- The number of households in Japan was assumed to decrease to 51,231 thousand in 2030 from 52,854 thousand in 2012 [24];
- The COP of air-conditioning equipment was assumed to be 2.57 in 2012 when the outdoor temperature is 35 °C and the load factor is 100%, respectively [30];
- The monthly electricity consumption data of a set of communication buildings, in the period of April 2012–March 2013, were used to represent the Japanese telecommunications industry. These data were analyzed in our previous study [6]. Here, the buildings were located in the eastern area of Japan. Based on these buildings, the distribution of the floor areas of ICT equipment and office spaces was assumed. Also, the outdoor temperature of each building was set according to which prefecture the building was located;
- Average monthly outdoor temperatures of prefectural capitals [31] were used to assume outdoor temperature, while indoor temperatures of all communication buildings were set at 24 °C;
- The electricity consumption of the telephone switchboard was assumed to gradually decline because of the replacement of old equipment with newer and more energy-efficient ones.
| Parameter | Value | Remarks | |
|---|---|---|---|
| 2012 | 2030 | ||
| Number of households (thousands) | 52,854 | 51,231 | The number of households was assumed to decrease according to [24]. |
| Average yearly electricity consumption per office floor area (kWh/m2/year) | 132 | 65.8 (A-2, B-2) 52.6 (A-1, B-1) | The data in 2012 were calculated using the floor areas of a set of the communication buildings [6] and the average electricity consumption of office buildings provided by DECC [22]. The data in 2030 were assumed by referring to external literature [32]. |
| Office floor area (thousand m2) | 1,020 | The office floor area to 2030 was assumed the same across the entire period [10,11,12]. | |
| Broadband traffic (Gbps) | 1905 | 10,110 (A-1, A-2) 50,710 (B-1, B-2) | The broadband traffic in 2030 was assumed by linearly extrapolating past data (2005–2012) for A-1 and A-2, while increasing as projected in [8] for B-1 and B-2. |
| Energy efficiency improvement of ICT equipment in 2030 compared to business-as-usual | n/a | 1 (A-2, B-2) 0.87 (A-1, B-1) | The energy efficiency of ICT equipment in A-2 and B-2 was assumed to improve on a business-as-usual basis from 2012, while that in A-1 and B-1 was improved more by referring to [33]. The ICT equipment being considered here was IP and mobile communication equipment. |
| Electricity consumption of telephone switchboards in Japan (TWh/year) | 1.125 | 0.944 (A-2, B-2) 0.510 (A-1, B-1) | The electricity consumption of telephone switchboards in 2030 in A-2 and B-2 was the case in which all of the switchboards were replaced with the state-of-the-art equipment available as of 2012 [10,11,12]. In A-1 and B-1, on the other hand, continuous improvement in the energy efficiency of switchboard was assumed from 2012–2030. The replacement period was 9 years, as designated by law. |
| Conversion efficiency of power-feeding equipment | 82% | 82% (A-2, B-2) 88% (A-1, B-1) | The conversion efficiency of power-feeding equipment in A-2 and B-2 was assumed constant from 2012 [10,11,12], while continuous improvement was assumed in A-1 and B-1 [34]. |
| Average COP improvement of air-conditioning equipment compared to the 2012 level | 1 | 1 (A-2, B-2) 1.45 (A-1, B-1) | The COP in 2030 in A-1 and B-1 was assumed as the state-of-the-art performance available as of 2012 [30], while that in A-2 and B-2 was the same in 2012. The replacement period was 12 years, as designated by law. |
| Heat transmission coefficient of communication buildings U(i) (W/(K∙m2)) | 0.39 (wall) 0.42 (roof) | The data were assumed with reference to [35]. | |

| No | Parameter | Sensitivity to 10% Change in Each Parameter | |
|---|---|---|---|
| Electricity Consumption in 2030 (TWh/year) | Difference Divided by Reference (%) | ||
| Reference (Scenario B-2) | 17.0 | - | |
| 1 | Energy efficiency of IP communication equipment | 16.3 | 4.7% |
| 2 | Energy efficiency of mobile communication equipment | 16.3 | 4.5% |
| 3 | COP of air-conditioning system | 16.6 | 2.4% |
| 4 | Broadband traffic | 16.7 | 2.0% |
| 5 | Conversion efficiency of power-feeding equipment | 16.8 | 1.5% |
5. Discussions
6. Conclusions
Acknowledgments
Author Contributions
Conflicts of Interest
Appendix
| Variables | R2 | Coefficient | ||
|---|---|---|---|---|
| A | B | |||
| IP communication equipment | ||||
| 1 | Investment in fixed-line network (billion JPY/year) | 0.397 | −2.3 × 10⁻³ | 3.3 |
| 2 | Value of fixed assets of fixed-line network (billion JPY) | 0.389 | −2.0 × 10⁻³ | 3.6 |
| 3 | Personal computer ownership rate (%) | 0.105 | −1.8 | 2.4 |
| 4 | GDP per capita (USD/capita in 2011, purchasing power parity (PPP)) | 0.000 | 5.6 × 10⁻⁶ | 0.80 |
| Mobile communication equipment | ||||
| 1 | Length of mobile phone calls (second/subscriber/day) | 0.551 | 5.5 × 10⁻³ | 3.9 |
| 2 | Mobile traffic per subscriber (bps/subscriber) | 0.307 | 1.5 × 10² | 2.6 |
| 3 | Mobile traffic (Gbps) | 0.290 | 1.1 × 10³ | 2.6 |
| 4 | Number of mobile phone base stations (thousand) | 0.090 | −7.4 × 10⁸ | 3.1 |
| 5 | GDP per capita (USD/capita in 2011, PPP) | 0.000 | 4.8 × 10⁷ | 2.7 |
References
- European Union. The Contribution of ICT to Energy Efficiency: Local and Regional Initiatives; Publications Office of the European Union: Luxembourg, 2011. [Google Scholar]
- Organisation for Economic Co-operation and Development (OECD). ICTs, the environment and climate change. Available online: http://www.oecd.org/sti/ict/green-ict (accessed on 28 September 2015).
- Organisation for Economic Co-operation and Development (OECD). Towards green ICT strategies: assessing policies and programmes on ICT and the environment, 2009. Available online: http://www.oecd.org/sti/ieconomy/44001912.pdf (accessed on 28 September 2015).
- Global e-Sustainability Initiative (GeSI) and the Boston Consulting Group, Inc. GeSI SMARTer 2020: The Role of ICT in Driving a Sustainable Future, 2012. Available online: http://gesi.org/portfolio/report/72 (accessed on 25 December 2015).
- Schlomann, B.; Eichhammer, W.; Stobbe, L. Energy saving potential of information and communication technology. Int. J. Decis. Support Syst. 2015, 1, 152–163. [Google Scholar] [CrossRef]
- Hara, M.; Sakurai, A.; Oka, H.; Tanaka, Y.; Yamaguchi, Y.; Kishita, Y.; Umeda, Y.; Shimoda, Y. Analysis modeling for electricity consumption of communication buildings. In Proceedings of the 9th International Symposium on Environmentally Conscious Design and Inverse Manufacturing: EcoDesign 2015, Tokyo International Forum, Tokyo, Japan, 2–4 December 2015; pp. 537–543.
- Ministry of Internal Affairs and Communications of Japan, Information and communication white paper 2012–2014. Available online: http://www.soumu.go.jp/johotsusintokei/whitepaper/index.html (accessed on 28 September 2015).
- Cisco Systems, Inc. Visual networking index (VNI) forecast and methodology 2014–2019. Available online: http://investor.cisco.com/files/doc_downloads/report_2014/white_paper_c11-481360.pdf (accessed on 28 September 2015).
- GreenTouch, ICT industry combats climate change. Available online: http://www.greentouch.org/?page=how-the-ict-industries-can-help-the-world-combat-climate-change (accessed on 28 September 2015).
- NTT Group, CSR Reports, 2006–2012. Available online: http://www.ntt.co.jp/csr_e/index.html (accessed on 16 October 2015).
- KDDI, CSR Reports, 2006–2012. Available online: http://www.kddi.com/english/corporate/csr/ (accessed on 16 October 2015).
- SoftBank Group, CSR Reports, 2006–2012. Available online: http://www.softbank.jp/en/corp/csr/ (accessed on 16 October 2015).
- Lubritto, C.; Petraglia, Å.; Vetromile, C.; Curcuruto, S.; Logorelli, M.; Marsico, G.; D’Onofrio, A. Energy and environmental aspects of mobile communication systems. Energy 2011, 36, 1109–1114. [Google Scholar] [CrossRef]
- Malmodin, J.; Moberg, Å.; Lundén, D.; Finnveden, G.; Lövehagen, N. Greenhouse gas emissions and operational electricity use in the ICT and entertainment & media sectors. J. Ind. Ecol. 2014, 14, 770–790. [Google Scholar]
- Malmodin, J.; Lundén, D.; Moberg, A.; Andersson, G.; Nilsson, M. Life cycle assessment of ICT: Carbon footprint and operational electricity use from the operator, national, and subscriber perspective in Sweden. J. Ind. Ecol. 2014, 18, 829–845. [Google Scholar] [CrossRef]
- Nielsen, R.H.; Mihovska, A.; Madsen, O.B.; Prasad, R. Energy-Efficient Deployment through Optimizations in the Planning of ICT Networks; Prasad, R., Ohmori, S., Simunic, D., Eds.; Towards Green ICT, River Publishers: Aalborg, Denmark, 2010; pp. 117–129. [Google Scholar]
- Jorguseski, L.; Litjens, R.; Oostveen, J.; Zhang, H. Energy Saving in Wireless Access Networks; Prasad, R., Ohmori, S., Simunic, D., Eds.; Towards Green ICT, River Publishers: Aalborg, Denmark, 2010; pp. 157–184. [Google Scholar]
- Koomey, J. Estimating total power consumption by servers in the U.S. and the world, Lawrence Berkeley National Laboratory and Stanford University, Stanford, 2007. Available online: http://enterprise.amd.com/Downloads/svrpwrusecompletefinal.pdf (accessed on 28 September 2015).
- Kuroda, K.; Kishita, Y.; Umeda, Y.; Yamaguchi, Y.; Shimoda, Y.; Hara, M.; Oka, H.; Nakamura, J. Scenario analysis of the electricity consumption in the Japanese information and communications sector toward green of ICT. In Proceedings of the CARE Innovation 2014, Schönbrunn Palace Conference Centre, Vienna, Austria, 17–20 November 2014.
- Foresight Horizon Scanning Centre. Scenario Planning: Guidance Note; The Government Office for Science: London, UK, 2009.
- Wada, H.; Kishita, Y.; Mizuno, Y.; Hirosaki, M.; Fukushige, S.; Umeda, Y. Proposal of a design support method for sustainability scenarios - 1st Report: designing forecasting scenarios. In Proceedings of the 18th CIRP International Conference on Life Cycle Engineering 2011, Braunschweig, Germany, 2–4 May 2011; pp. 189–194.
- Japan Sustainable Building Consortium. Database for energy consumption of commercial building (DECC), 2013. Available online: http://www.jsbc.or.jp/decc_english/index.html (accessed on 28 September 2015).
- Ministry of Internal Affairs and Communications of Japan, Publication of quarterly data on market share and number of subscribers telecommunications services. Available online: http://www.soumu.go.jp/menu_news/s-news/01kiban04_02000046.html (accessed on 28 September 2015).
- National Institute of Population and Social Security Research, Population & household projection. Available online: http://www.ipss.go.jp/site-ad/index_english/population-e.html (accessed on 28 September 2015).
- World Bank. World development indicators. Available online: http://datacatalog.worldbank.org/ (accessed on 28 September 2015).
- Telecommunications Carriers Association, Subscribes of mobile phones and PHS. Available online: http://www.tca.or.jp/database/index_archive.html (accessed on 28 September 2015).
- Healey, N.M. The transition economies of central and eastern Europe: A political, economic, social and technological analysis. Columbia J. World Bus. 1994, 29, 62–70. [Google Scholar] [CrossRef]
- Kawakita, J. The Hill Magars and Their Neighbors: Hill Peoples Surrounding the Ganges Plain; Tokai University Press: Tokyo, Japan, 1974. [Google Scholar]
- Anderson, J.M.; Kalra, N.; Stanley, K.D.; Sorensen, P.; Samaras, C.; Oluwatola, O.A. Autonomous Vehicle Technology: A Guide for Policymakers; RAND Corporation: Santa Monica, CA, USA, 2014; Available online: http://www.rand.org/pubs/research_reports/RR443-1.html (accessed on 25 December 2015).
- NTT Facilities. News release on 15th September 2010. Available online: https://www.ntt-f.co.jp/news/heisei22/h22–0915.html (accessed on 28 September 2015).
- Japan Meteorological Agency. Climate of Japan, 2015. Available online: http://www.data.jma.go.jp/obd/stats/data/en/index.html (accessed on 28 September 2015).
- WWW Japan, Proposal of energy scenarios toward a low-carbon society. Available online: https://www.wwf.or.jp/activities/upfiles/110721EnergyScenario01_Ver.pdf (accessed on 28 September 2015). (In Japanese)
- NTT Data Institute of Management Consulting, Inc. Report on fundamental development of Japanese digital economy and community: Survey of energy efficiency of IT equipment, 2013. Available online: http://www.meti.go.jp/meti_lib/report/2013fy/E002741.pdf (accessed on 28 September 2015). (In Japanese)
- NTT West Japan. Activities toward green ICT in NTT West Japan. NTT Tech. J. 2009, 21, 58–61. (In Japanese) [Google Scholar]
- Yamaguchi, Y.; Shimoda, Y.; Kitano, T. Reduction potential of operation carbon dioxide emission of Nakanoshima business/cultural area as a model for low-carbon districts in warm climates. Build. Environ. 2013, 59, 187–202. [Google Scholar] [CrossRef]
© 2016 by the authors; licensee MDPI, Basel, Switzerland. This article is an open access article distributed under the terms and conditions of the Creative Commons by Attribution (CC-BY) license (http://creativecommons.org/licenses/by/4.0/).
Share and Cite
Kishita, Y.; Yamaguchi, Y.; Umeda, Y.; Shimoda, Y.; Hara, M.; Sakurai, A.; Oka, H.; Tanaka, Y. Describing Long-Term Electricity Demand Scenarios in the Telecommunications Industry: A Case Study of Japan. Sustainability 2016, 8, 52. https://doi.org/10.3390/su8010052
Kishita Y, Yamaguchi Y, Umeda Y, Shimoda Y, Hara M, Sakurai A, Oka H, Tanaka Y. Describing Long-Term Electricity Demand Scenarios in the Telecommunications Industry: A Case Study of Japan. Sustainability. 2016; 8(1):52. https://doi.org/10.3390/su8010052
Chicago/Turabian StyleKishita, Yusuke, Yohei Yamaguchi, Yasushi Umeda, Yoshiyuki Shimoda, Minako Hara, Atsushi Sakurai, Hiroki Oka, and Yuriko Tanaka. 2016. "Describing Long-Term Electricity Demand Scenarios in the Telecommunications Industry: A Case Study of Japan" Sustainability 8, no. 1: 52. https://doi.org/10.3390/su8010052
APA StyleKishita, Y., Yamaguchi, Y., Umeda, Y., Shimoda, Y., Hara, M., Sakurai, A., Oka, H., & Tanaka, Y. (2016). Describing Long-Term Electricity Demand Scenarios in the Telecommunications Industry: A Case Study of Japan. Sustainability, 8(1), 52. https://doi.org/10.3390/su8010052