Article

The Evolution of River–Lake and Urban Compound Systems: A Case Study in Wuhan, China

1
College of Water Conservancy and Hydropower Engineering, Hohai University, 1 Xikang Road, Nanjing 210098, China
2
School of East Asian Studies, University of Sheffield, 6-8 Shearwood Road, Sheffield S10 2TD, UK
3
College of Harbour, Coastal and Offshore Engineering, Hohai University, 1 Xikang Road, Nanjing 210098, China
*
Author to whom correspondence should be addressed.
Sustainability 2016, 8(1), 15; https://doi.org/10.3390/su8010015
Submission received: 23 September 2015 / Revised: 16 December 2015 / Accepted: 17 December 2015 / Published: 23 December 2015

Abstract

:
The process of urbanization takes up a lot of wetlands, profoundly changing the natural connection of surrounding river–lake systems, all the while causing serious damage to the environment of connected catchments. Urban systems and river–lake systems are not isolated and static, there is a relation between them which is constantly changing. Based on the idea of system research, the urban system is simplified into four subsystems: environment, infrastructure, social, and economic. These four components interact together, influencing the river–lake system to form a compound system. This paper aims to reflect the features and evolution laws of the compound system, by building a Collaborative Development Model to study the changing of the compound system in Wuhan, China over a 10-year period. The results show that by implementing the Donghu Lake Ecological River Network Engineering Project, the damaged river–lake system in Wuhan showed some improvement. However, in order to improve the sustainability of the compound system in Wuhan, the status of the river–lake system, social system and environment system, which are still comparatively substandard, should be constantly improved. The Collaborative Development Model could also be used in other cities and regions, to provide the basis for sustainable development.

1. Introduction

River–lake systems and their connections both affect and change the rise of human civilization, the progress of society, and economic development [1]. The large-scale exploitation of water and soil resources and the building of infrastructure both constantly alter the driving force behind river–lake system development, as well as the hydraulic connection of the river network and the environment of rivers [2,3,4,5].
With the expansion of cities comes the increase in population, thus placing greater pressure on water resources. It is often difficult for the structure of a natural river–lake system to meet the requirements of sustainable development, in terms of flood control safety [6], economic safety [7], security of the water supply [8], and ecological security [9]. By adopting engineering measures, the establishment of a new hydraulic connection between rivers, lakes and wetlands optimizes the drainage pattern of river networks, thus becoming an important way to solve these problems [10]. The implementation of these projects has a profound impact on, and is bound to, the evolution of the river–lake and urban systems [11].
Previously, studies have mostly focused on natural rivers and their watersheds or basins, but now people are focusing more of their attention on studying the relationship between river–lake systems and human activities. The land use type influences the integrity of river–lake systems [12]. The Riverstrahler model reveals that, over a period of fifty years, the change in the Seine river–lake system had a connection with human activities [13]. River–lake systems are affected by urbanization and are forced to adjust to the urbanization process at the same time [14]. The urban development of a region has an influence on the hydrology and sediment process of a river, changing its configuration. Due to the differences in regional characteristics, the impact of urbanization on river–lake systems can vary immensely. In order for a river–lake system to adapt to the impact of an urban system, several decades must pass before the adaptation process is complete [15]. Biogeochemical cycles of urban watershed continuums and the functions of watershed ecosystems are linked with land use and urban infrastructure, and these elements are continuously changing in terms of space and time [16,17]. In the economic, social, and environmental conditions in which the background of rapid development is set, building an eWater model for integrated planning and management of river–lake systems is a new method for solving the conflicts between river–lake and urban systems [18]. The physics, chemistry, ecology and land utilization of the lake catchment area all have important influence on the water quality of the river–lake system and these factors are used to determine the size of the waterfront buffer in the process of environment planning and management thereof [19].
River–lake systems are components which dependent on a city and its environment, infrastructure, social and economic subsystems. The connection between them is not a one-way causal relationship, but a complicated dynamic process under the influence of multiple factors. This paper will study their relationship through building a Collaborative Development Model, by regarding river–lake systems and environment, infrastructure, social, and economic subsystems, which belong to the urban system, as connected systems. Through their internal contributing factors they each form their own distinctive qualities, and under the action of external forces coupling each other, the systems form a compound system which is constantly evolving. The values of development degree (Dn), comprehensive development degree (D), coupling degree (C), and coordination degree (S) are used to represent the following characteristics: the internal state of the development level of each system, the comprehensive development level of the compound system, the coupling between the systems, and the sustainable status of the compound system, respectively. At the same time, this paper uses the Collaborative Development Model to analyse the evolution of the compound system from 2005 to 2014 in Wuhan, China.

2. Methods

2.1. River–Lake and Urban Compound System

Among the processes involved in running an urban system, there is a close connection between the four environment, infrastructure, social and economic subsystems, and the river–lake system. Within this connection, the five components depend on one another and evolve together. They have continuously interacted with each other to form a compound system, which develops in a coordinated way.

2.2. Basic Indicators of the Compound System

Based on the three principles of systematicness, hierarchy and regional characteristics, indicators have been chosen which can reflect the characteristics of the five systems and which have a connection with the river–lake system, in order to build an evaluation index system (Table 1) as the basis for calculation and judgement.
Table 1. Evaluation index system.
SystemIndicatorIndicator Type
River–lake systemQuantity of channelsefficiency
Quantity of lakes and reservoirsefficiency
River network density (km/km2)efficiency
Environment subsystemTotal volume of water resource (100 million m3)efficiency
Groundwater usage (10,000 m3/year)cost
Eco-environmental water consumption rate (%)efficiency
Sewage treatment rate (%)efficiency
Wetland coverage rate (%)efficiency
Infrastructure subsystemNumber of large and medium bridgescost
Length of drainage pipelines (km)efficiency
Length of sewage pipelines (km)efficiency
Social subsystemWaterfront landscape satisfaction (%)efficiency
Water resources per capita (m3/people)efficiency
Urbanization rate (%)cost
Economic subsystemPer capita GDP (Yuan)efficiency
GDP output per unit water (10,000 Yuan/m3)efficiency
Investment in wastewater treatment (10,000 Yuan)efficiency
Notes: (1) The lengths of the rivers in this study are greater than 5 km, and the lake areas are more than 0.05 km2; (2) In order to calculate Waterfront landscape satisfaction, every year from 2005 to 2014, 30 randomly-selected communities were given 60 copies of a questionnaire. Each year, the resulting 1800 questionnaires were then used to find out the Waterfront landscape satisfaction.

2.3. Indicator Normalization

There are two categories of indicators in this system. With regards to the cost indicator, the smaller its values are, the better, and where the efficiency indicator is concerned, the bigger its values are the better (Table 1). The respective standardization of these indicators is calculated using the following Formulas (1) and (2). After the process of standardization, all indicator values have the range [0,1]:
x i 1 = r max r i r max r min
x i 2 = r i r min r max r min
where x i is the standardized indicator, x i 1 and x i 2 represents the cost indicator and the efficiency indicator, respectively; r i is the raw indicator value, and r min , r max are the actual values of the lower and upper limits of the raw data, respectively.

2.4. Collaborative Development Model
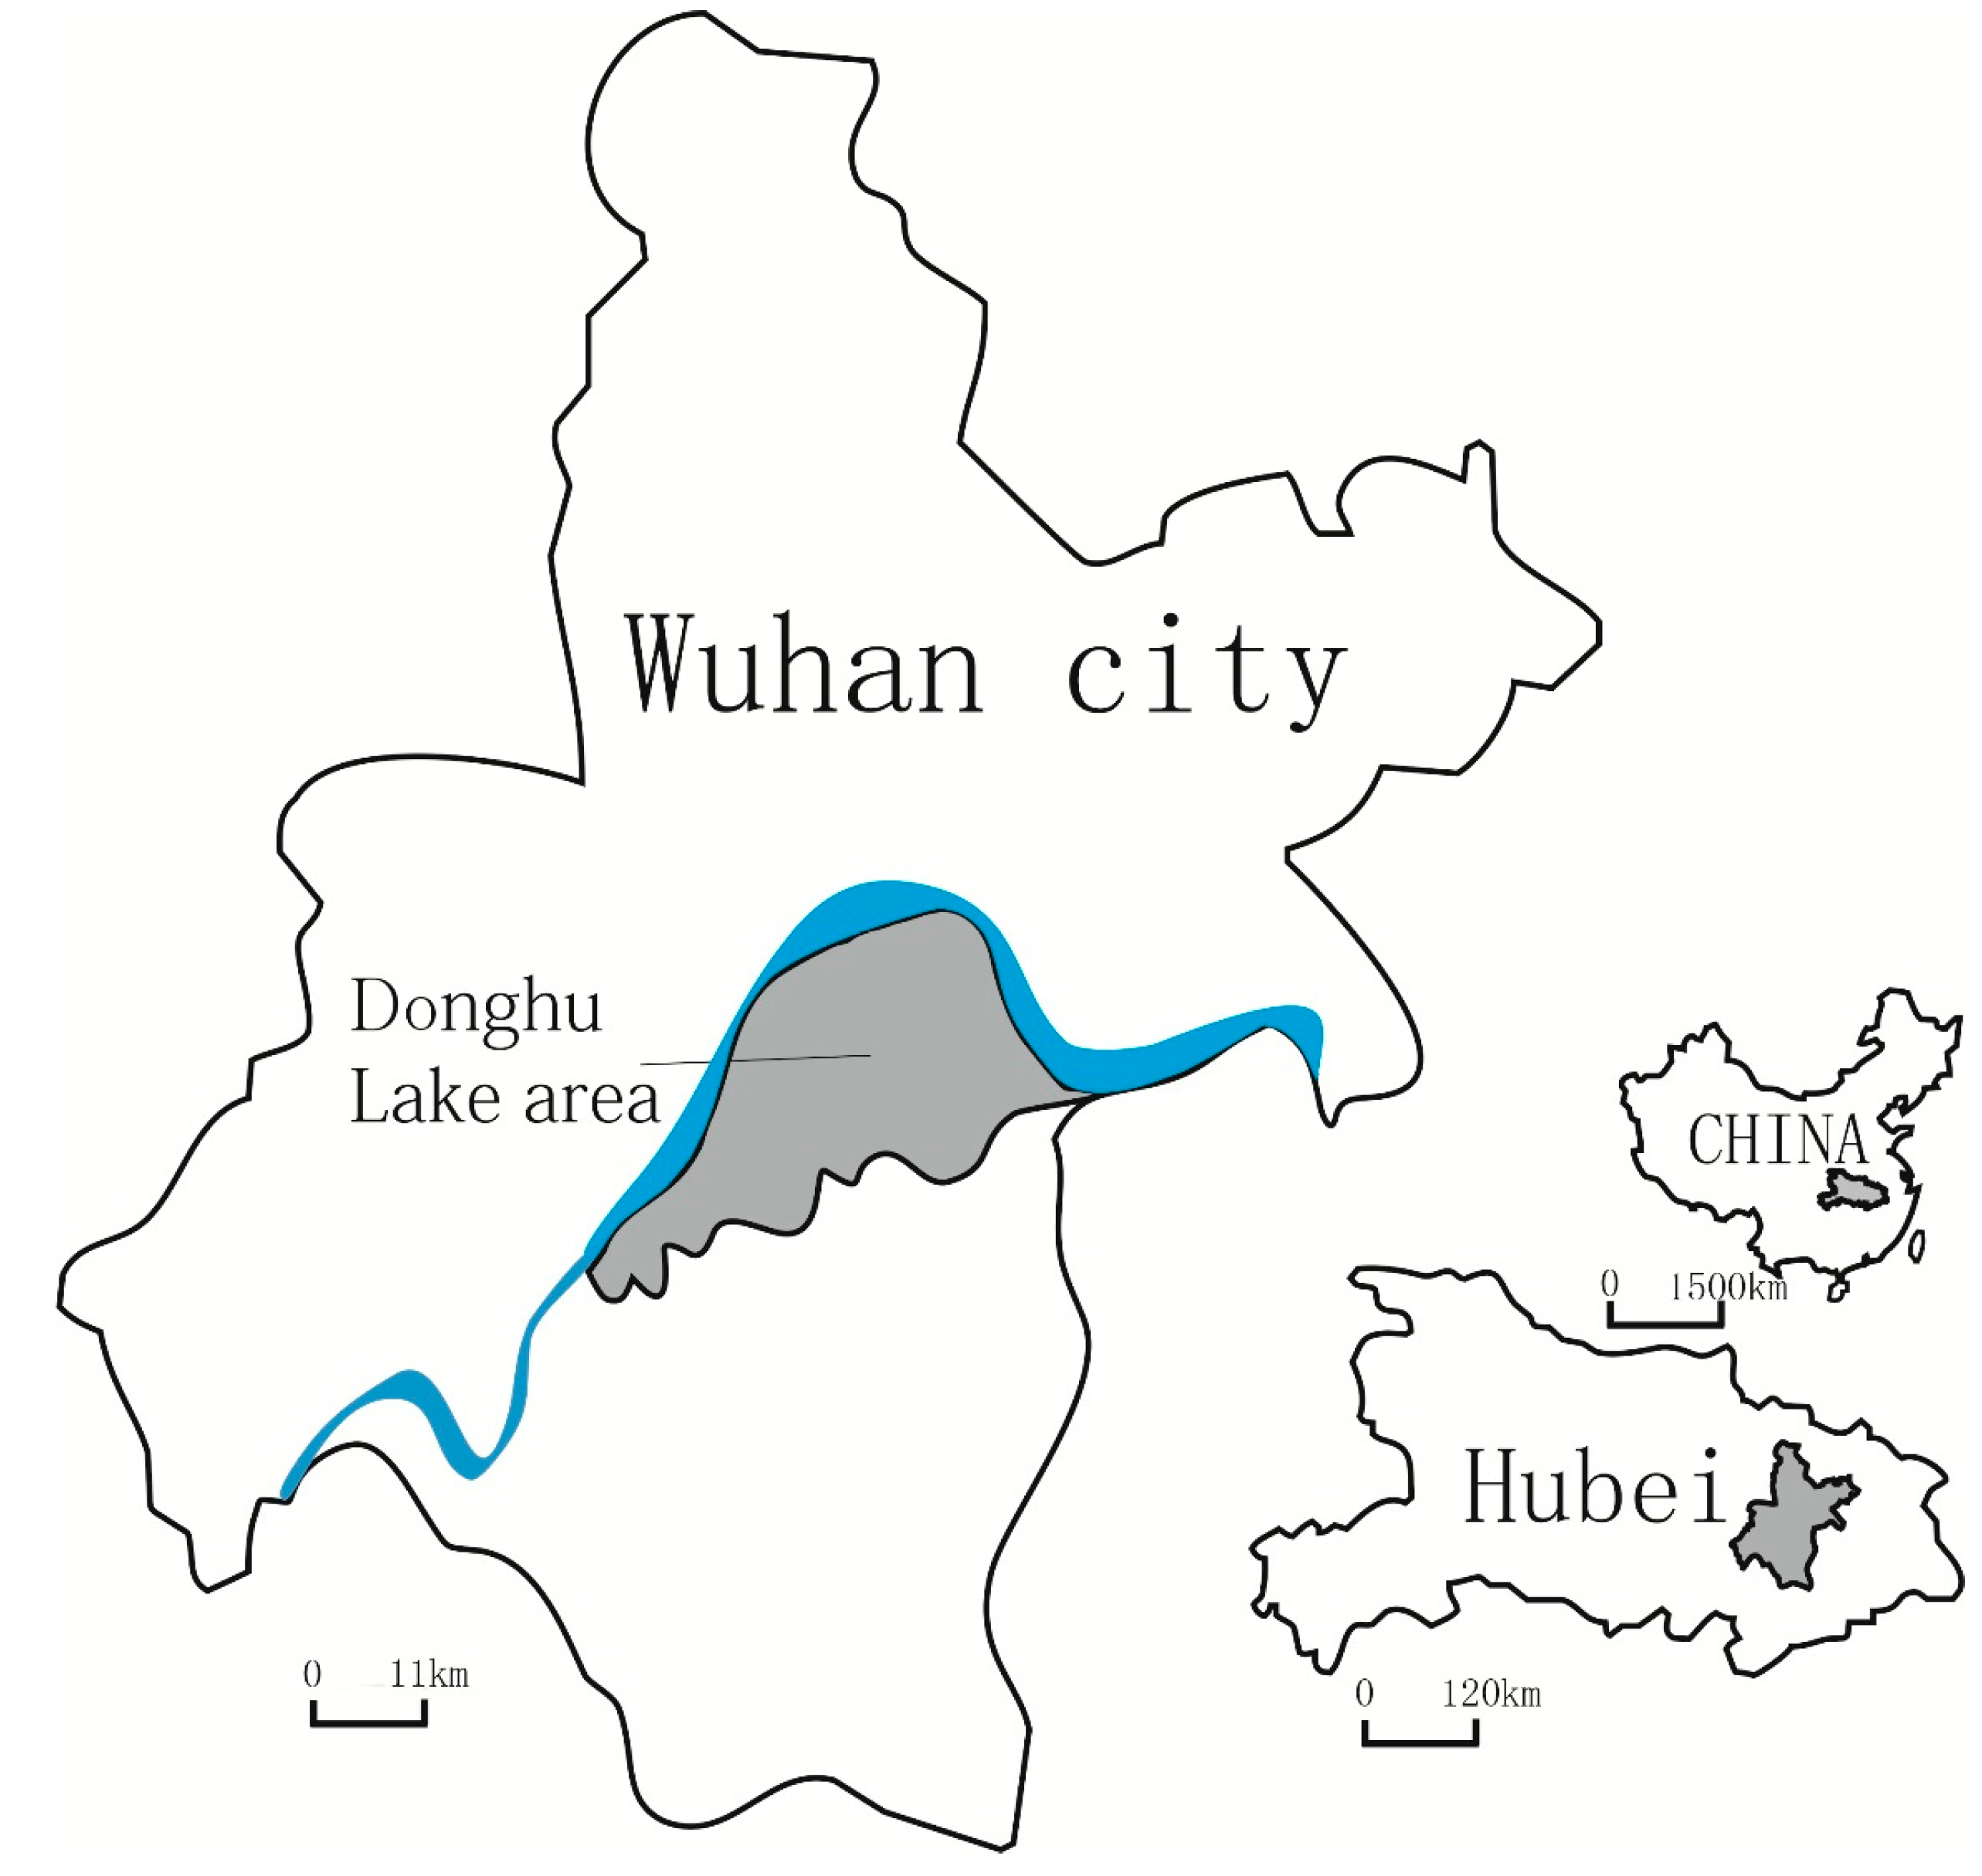
The manner and extent of development of each system has different characteristics. Dn reflects the situation of their development under the effect of relevant factors. Dn is calculated by the Formula (3):
D n = f n ( x ) = i = 1 m a i x i
where a i is the indicator weights, and i = 1 m a i = 1 , m is the number of indicators in each system, n = 1, 2, 3, 4, 5 represents the river–lake system, environment, infrastructure, social, and economic subsystems, respectively.
We use D to represent the development situation of the compound system under the interaction of all the systems. Formula (4) is used to calculate D:
D = n = 1 5 b n f n ( x )
where bn is the weight of the development degree of each system when calculating D.
During the process where the five systems change, they are affected by external factors. The systems are also aided and impeded by internal factors. C represents the feedback situation between the systems during this process. When the value of C is lower, this shows that their respective levels of development are very different. When the value of C is higher, this shows that the levels of development are very similar. C is calculated by the Formula (5):
C = 2 · j = 2 5 c j f 1 ( x ) · f j ( x ) f 1 ( x ) + f j ( x )
where c j represents the weight of cohesion between the river–lake system and the four subsystems when calculating the coupling degree. j = 2,3,4,5 represents the corresponding cohesion between the river–lake system and the four subsystems, respectively.
The compound system is formed by the five systems. The function of the compound system depends on two elements: the development of the five individual systems and the coupling status of the close connection between the systems. S reflects the sustainable status of the compound system which has connection with the two above factors. S is calculated by the Formula (6):
S = C · D
Using the Analytic Network Process (ANP), the weights in the above formulas are calculated [20].

2.5. Case Study

Wuhan (Figure 1), the capital of Hubei province in China, is located in the center of the country, where the Yangtze and Hanshui rivers converge. Wuhan has a water area of 2217.6 square kilometres, has wetland coverage of 26.10%, and has a water area per capita of 114,000 square metres, making it the city with the highest per capita possession of surface water in the world. Amongst the megacities of the world, Wuhan is also the most abundant in water resources and is the largest freshwater centre in China.
Figure 1. Location map of Wuhan and Donghu lake area.
Sustainability 08 00015 g001
The Donghu Lake area is located in the south of the Yangtze River, with the river surrounding it to the north, east, and west [21]. Due to urban construction and the building of river dykes, the lake area is now greatly reduced and the water exchange between the lake and the river has gradually become blocked. Launched in 2009 with the aim of resolving the existing problems in this region, the Donghu Lake Ecological Water Network Engineering Project aimed to, playing the role of Yangtze River and lakes in water regulation and storage, direct water from the Yangtze River into lakes of the Donghu Lake area, and replacement the water in lakes by clean rain water, then build ecological wetland networks which connect the local lakes such as the East Lake, Sand Lake, and North Lake with Yangtze River to improve the water flow and to improve the self-purification ability of the rivers and lakes, thereby repairing the ecological environment and promoting the development of Wuhan.

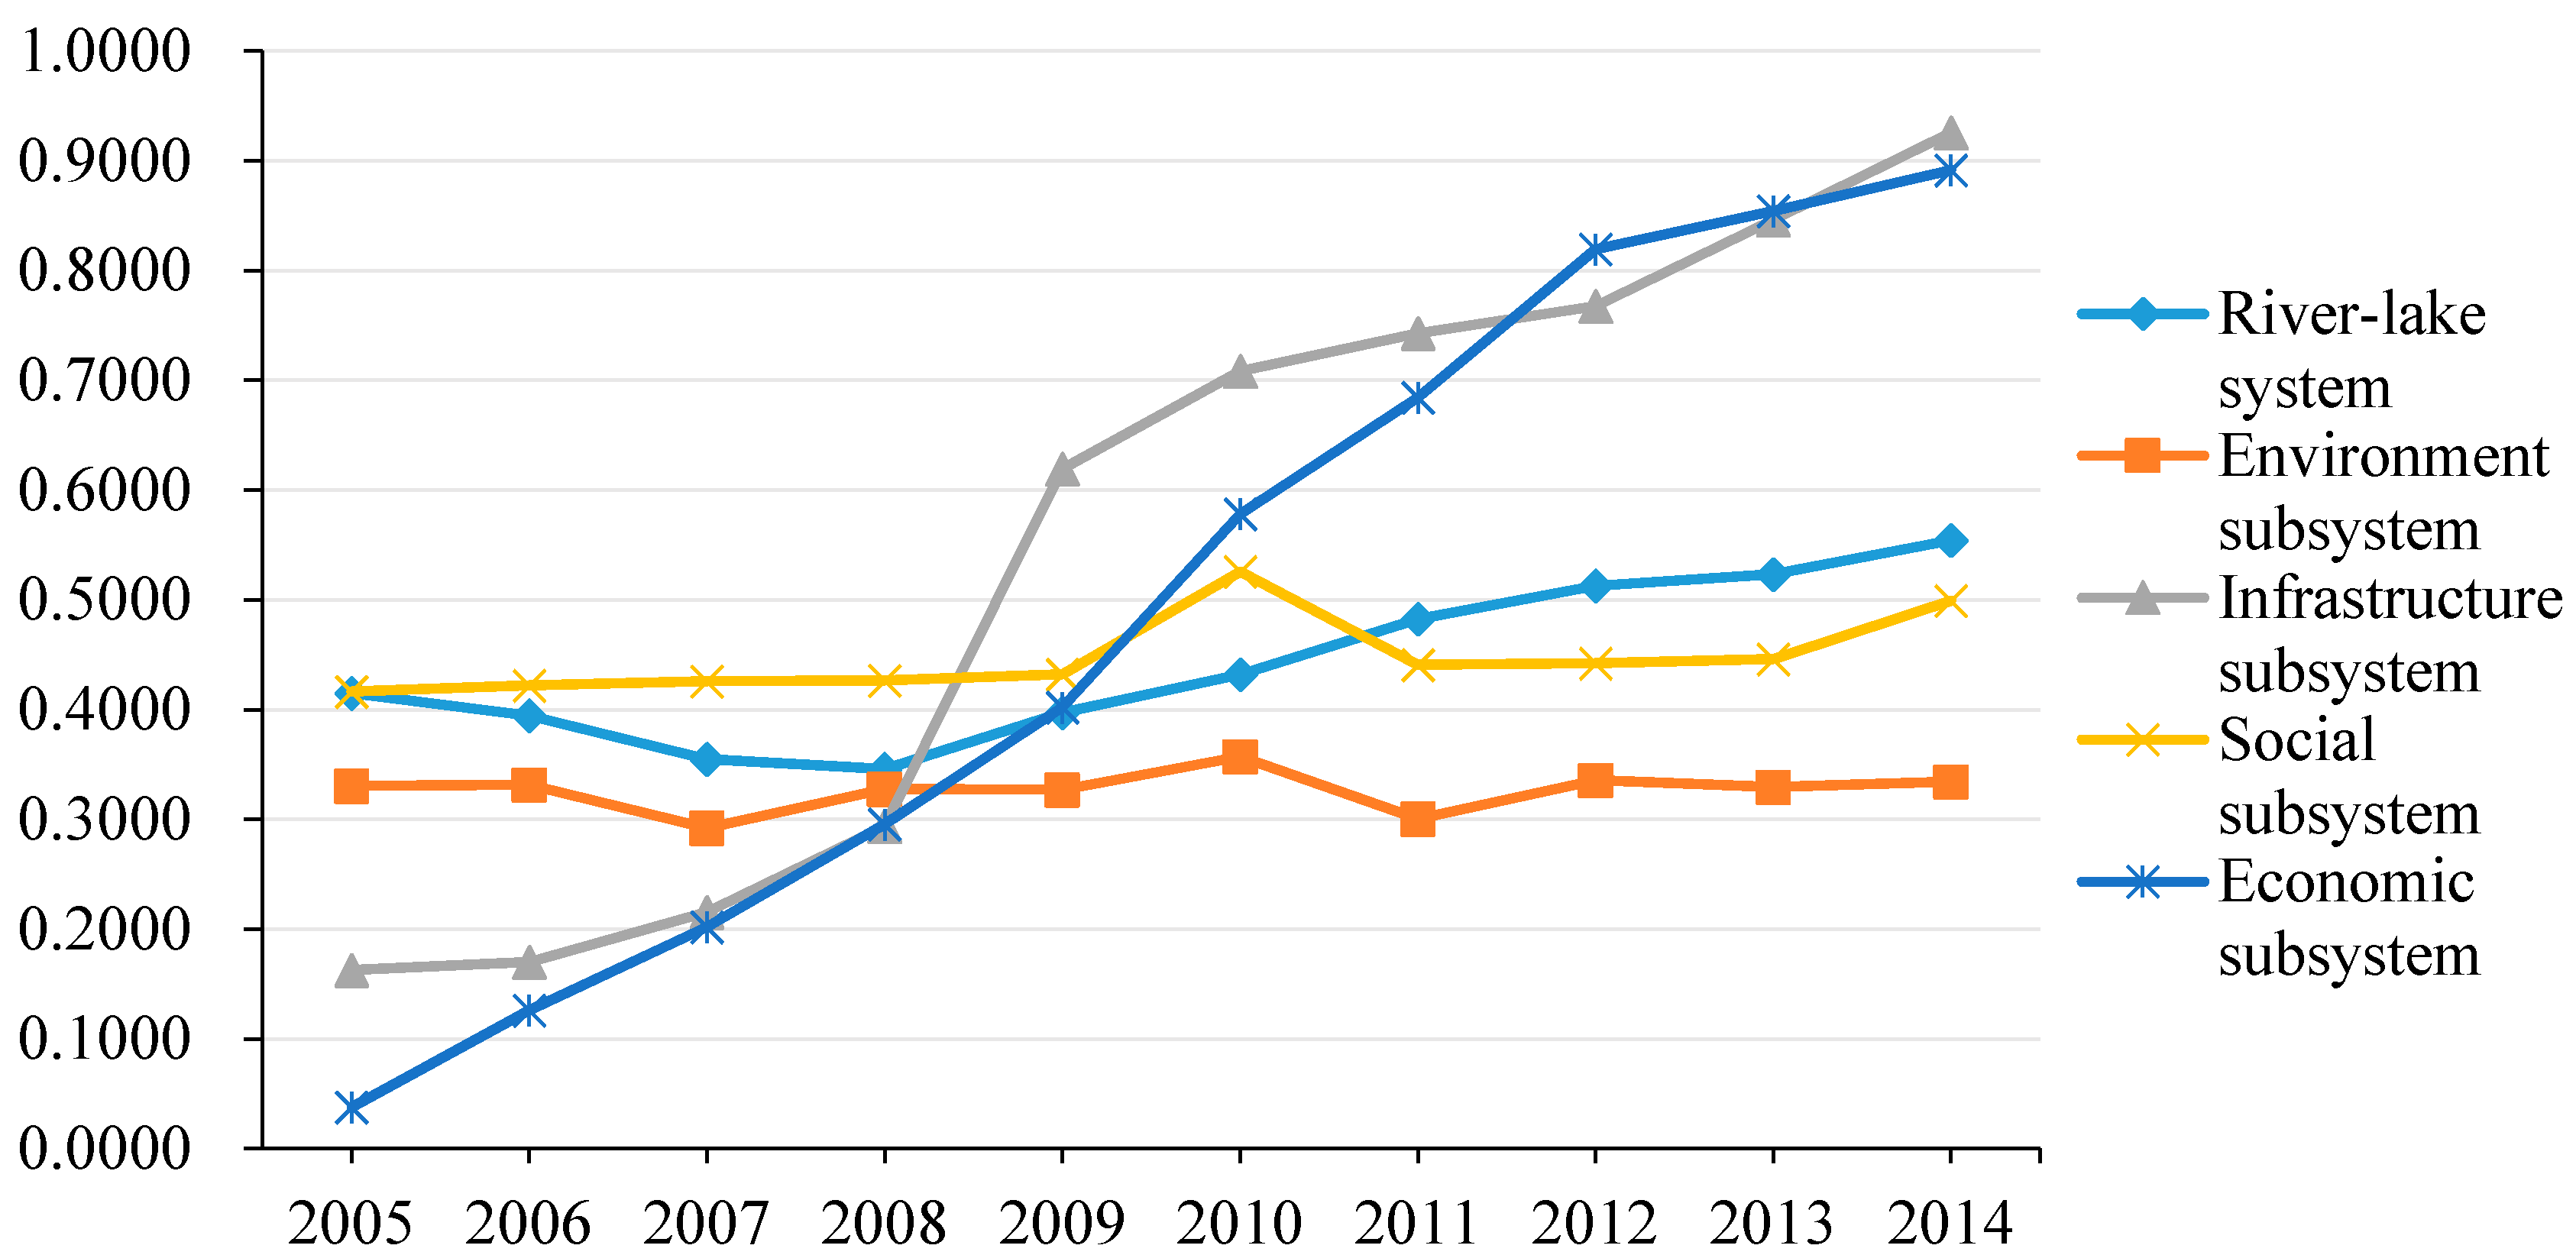
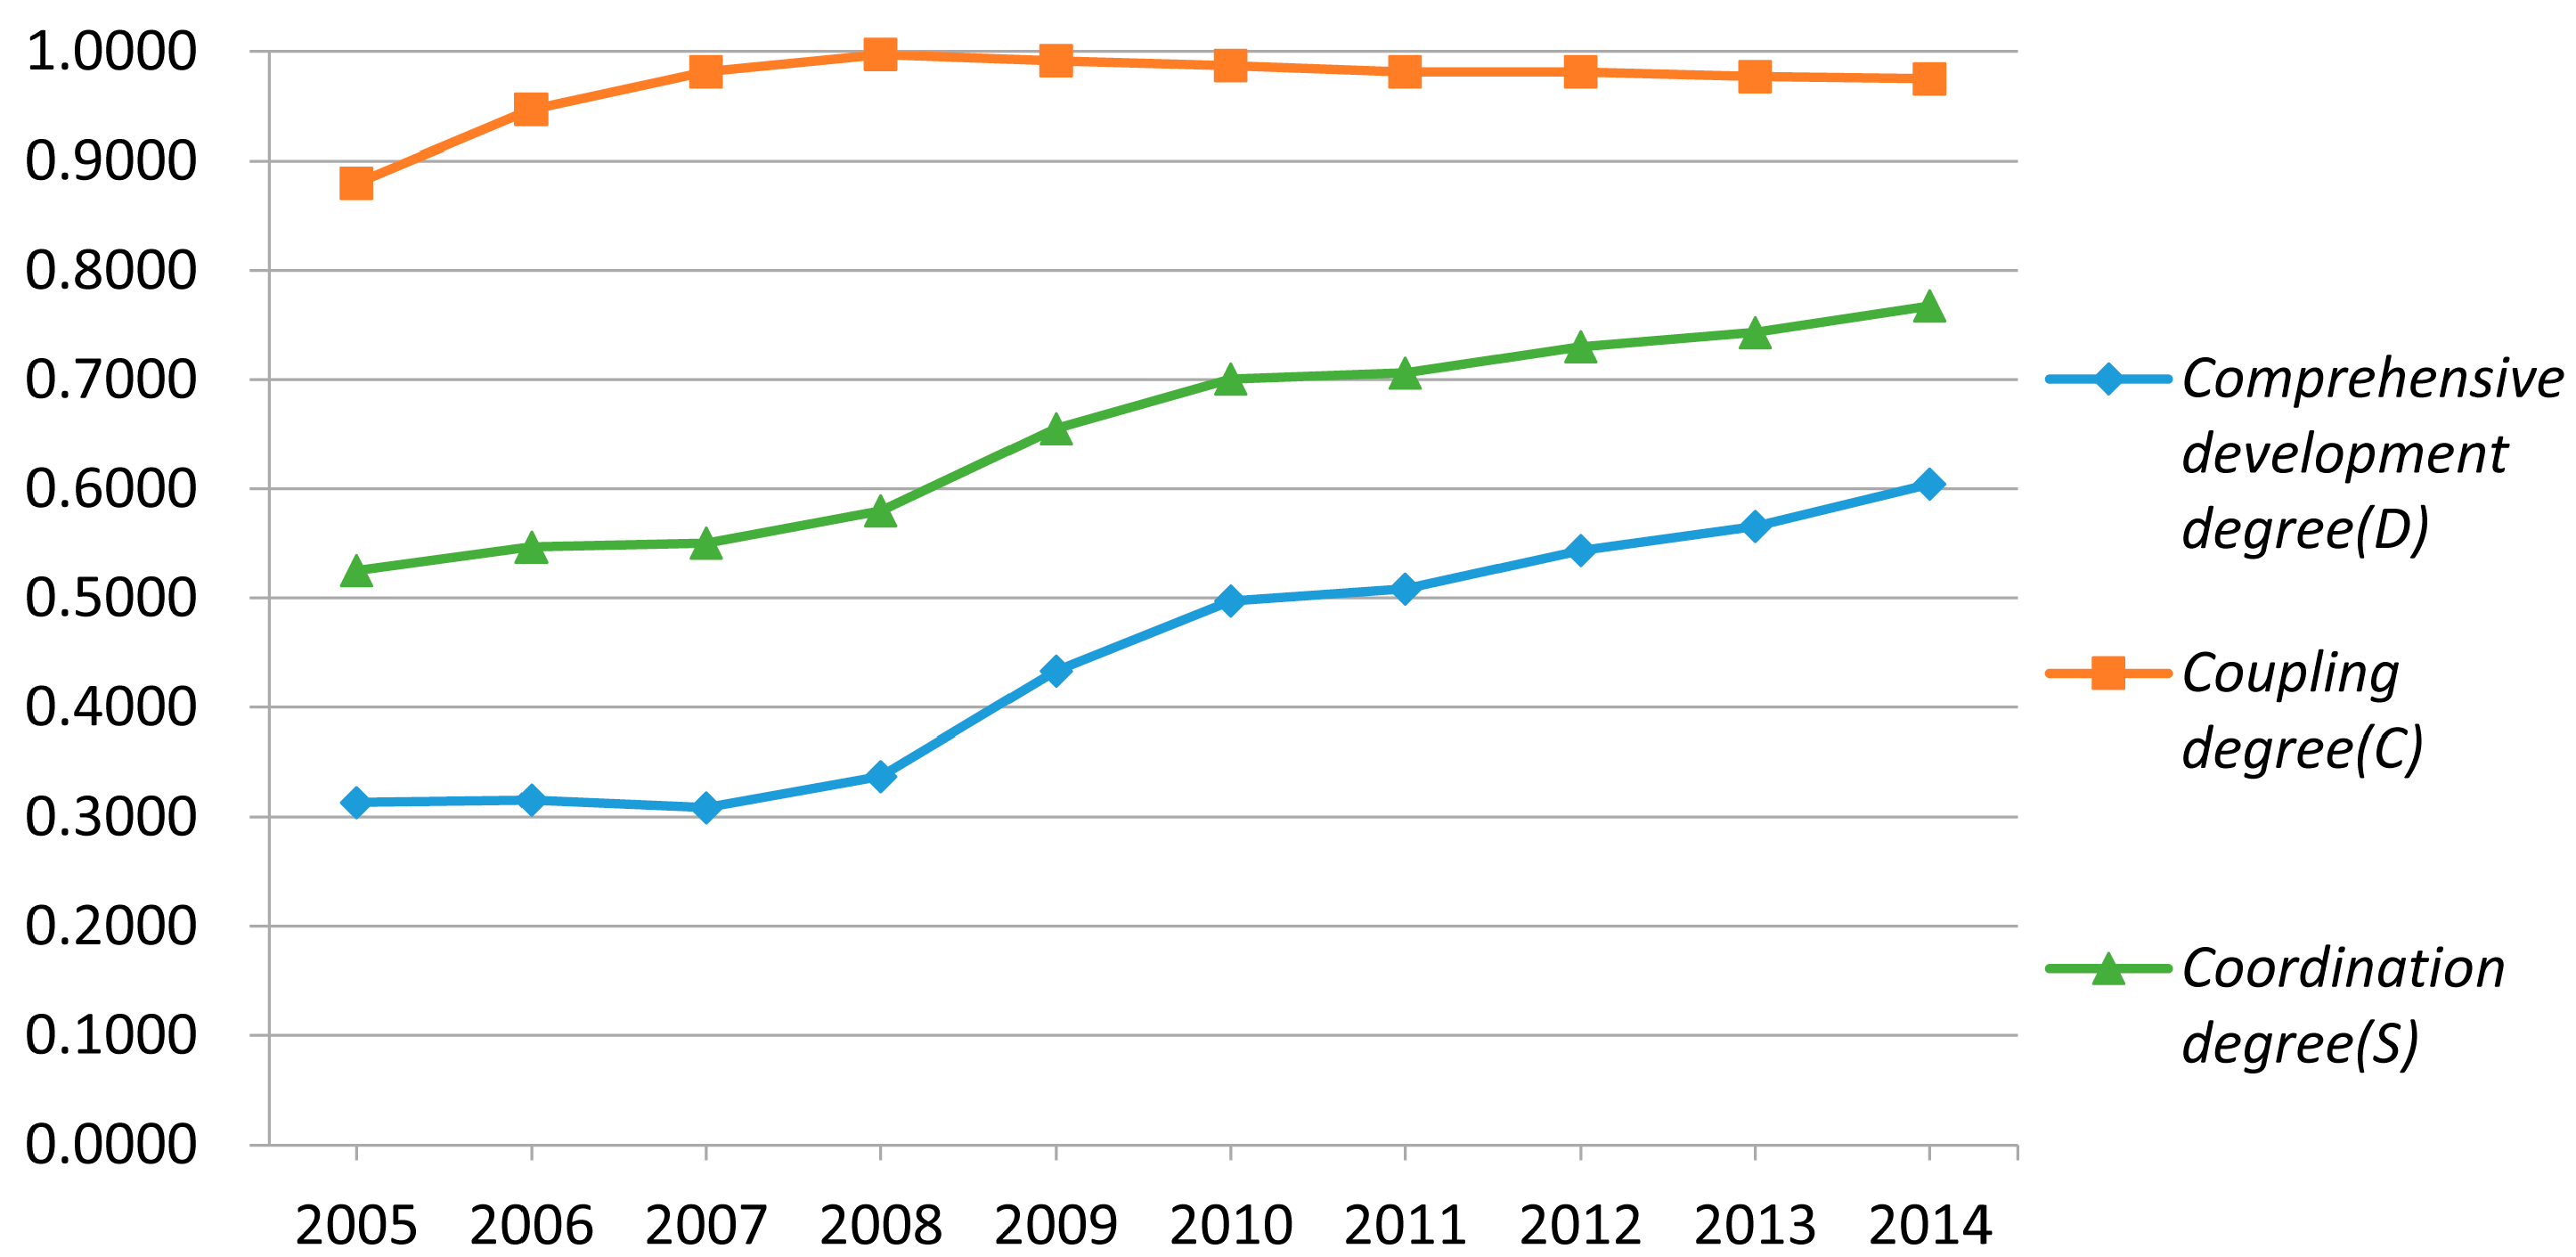
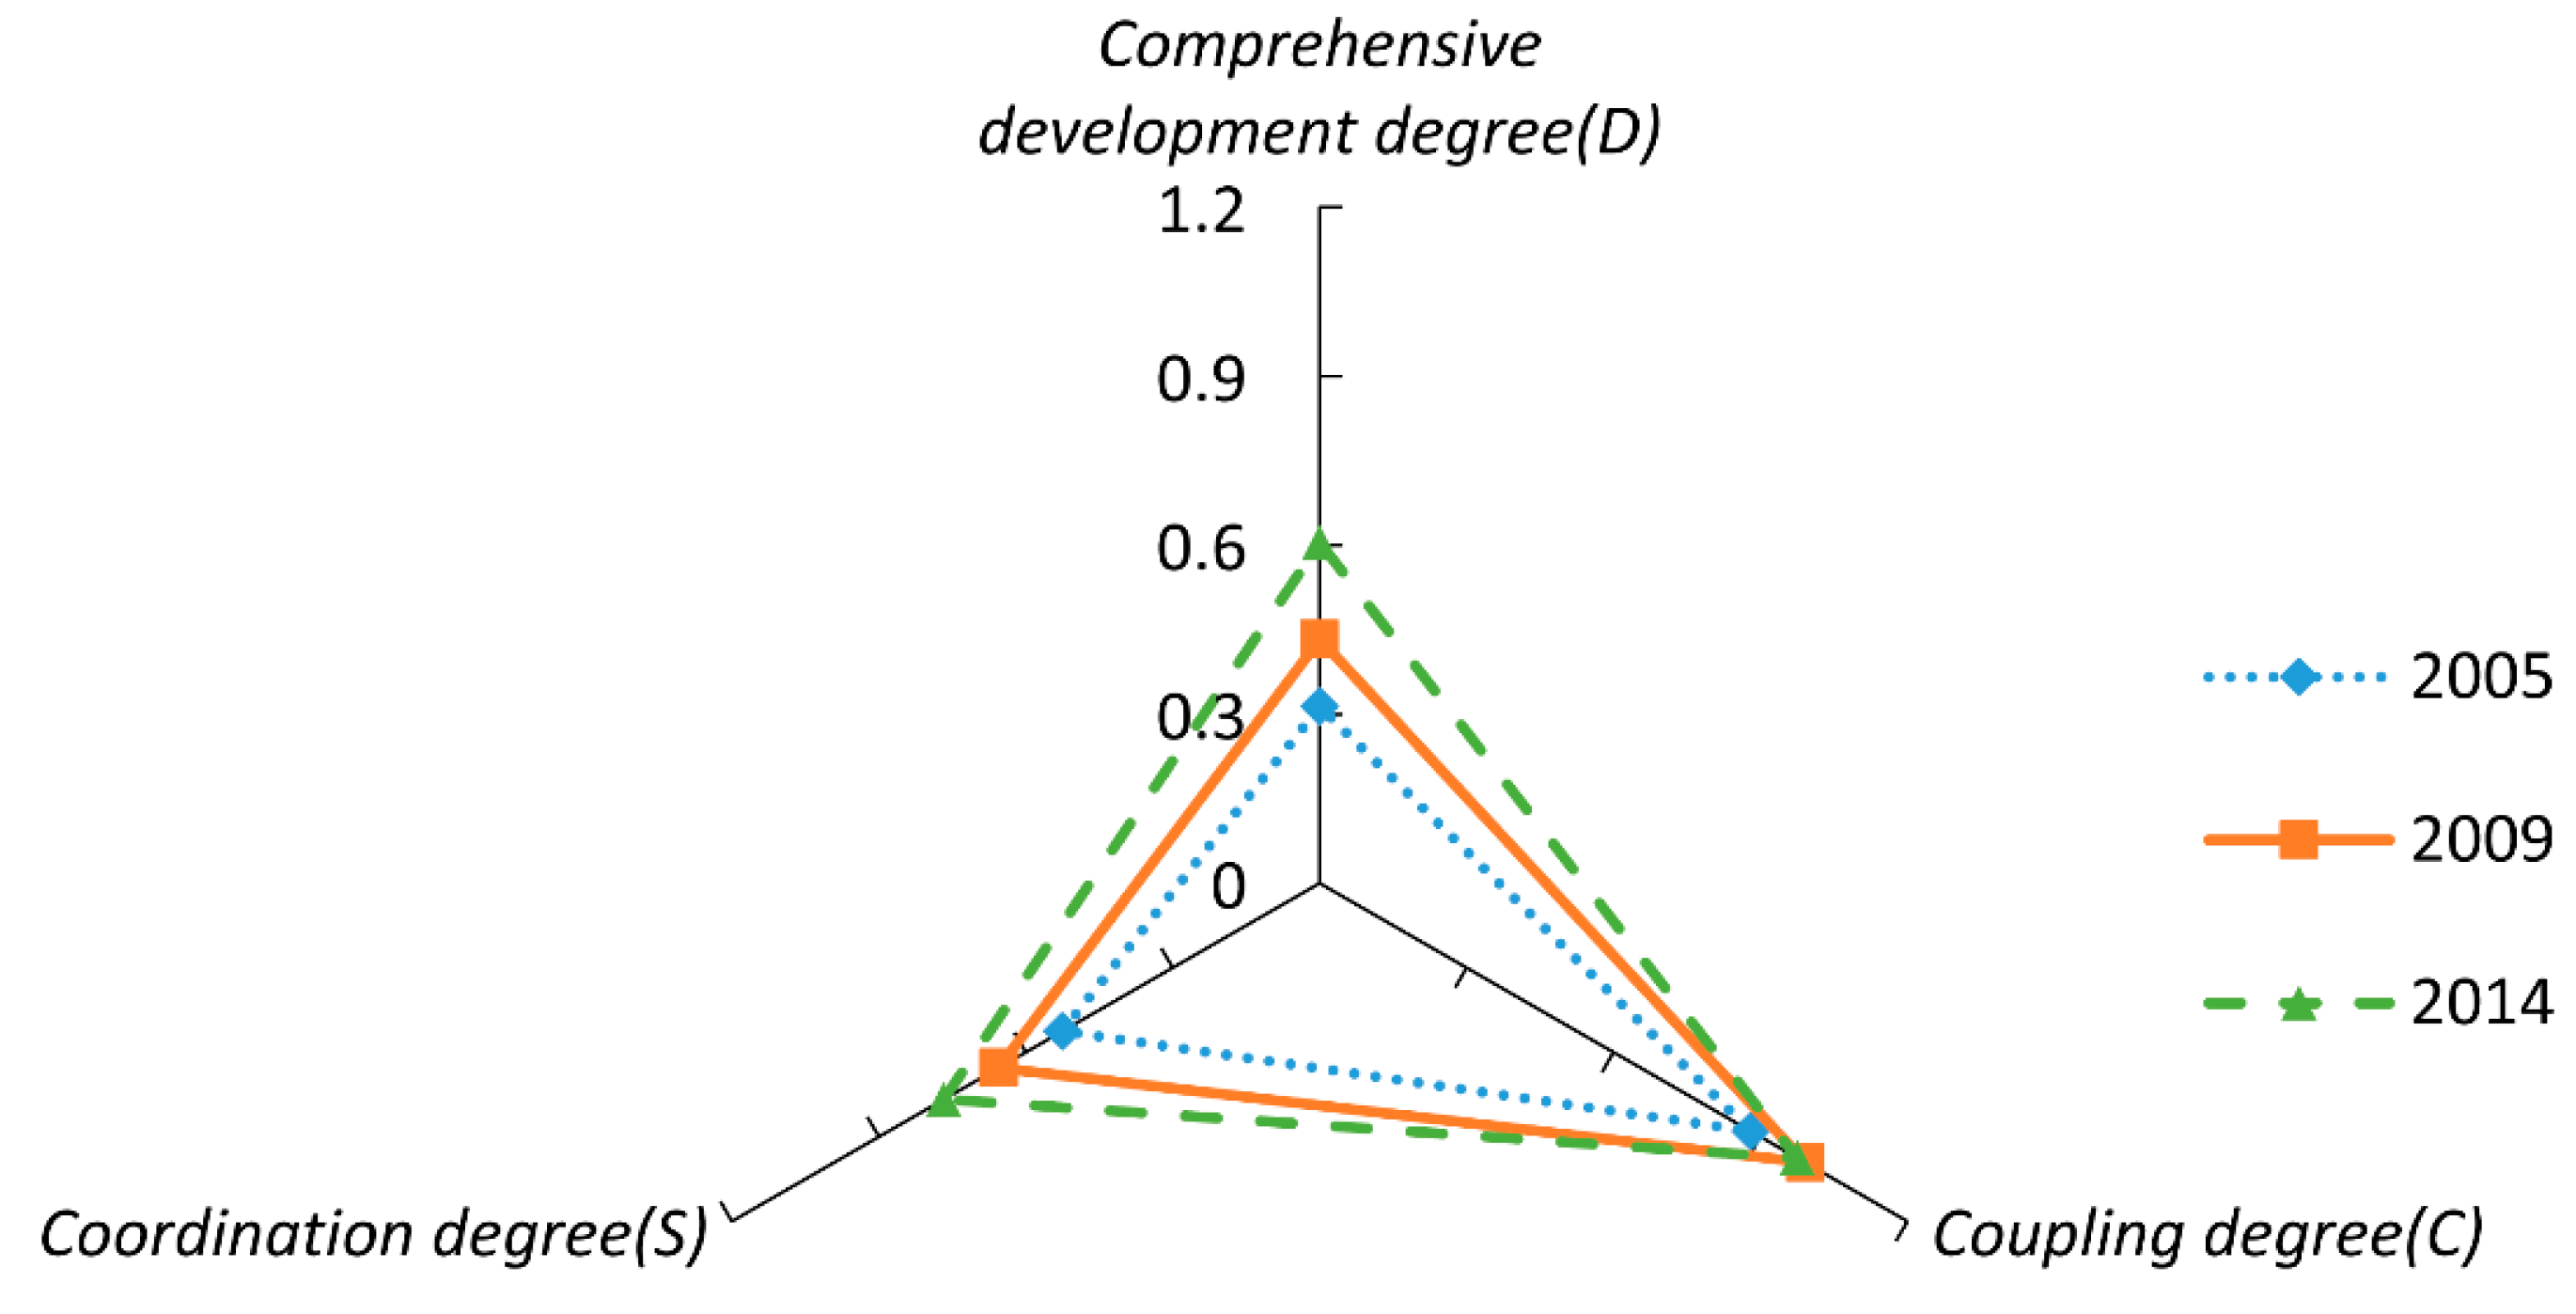
3. Results and Discussion

The indicators from Table 1 are obtained from three sources: The Wuhan Statistics Yearbook (2005–2014) [22], Wuhan Water Resources Bulletin (2005–2014) [23] and the aforementioned questionnaires carried out during research. The values of these indicators are shown in Table 2 and were used to calculate Dn, D, C, and S. Table 3 is the weights assigned to the elements.
Table 2. Indicator values of the river–lake and urban compound system of Wuhan.
SystemIndicator2005200620072008200920102011201220132014
River–lake systemQuantity of channels193186189165149157162166171171
Quantity of lakes and reservoirs479438424406394407411419426435
River network density (km/km2)1.21.21.21.11.01.11.41.51.61.9
Environment subsystemTotal volume of water resource (100 million m3)50.442.429.936.936.076.627.247.939.540.7
Groundwater usage (10,000 m3/year)2055220022602306238524992558267427342760
Eco-environmental water consumption rate (%)0.40.30.40.40.40.20.20.30.30.3
Sewage treatment rate (%)45.071.075.876.978.481.483.184.885.185.3
Infrastructure subsystemWetland coverage rate (%)30.028.526.823.621.021.725.526.128.332.1
Number of Large and medium bridges9101212121313141515
Length of drainage pipelines (km)1730181061266321659275437909817390109853
Length of sewage pipelines (km)46763210211839214525732996334837854061
Social subsystemWaterfront landscape satisfaction (%)74.364.851.158.056.582.047.067.068.276.8
Water resources per capita (m3/people)628.3517.6360.1439.0422.4888.8312.0542.0441.5448.8
Urbanization rate (%)59.260.261.061.162.162.763.764.064.765.3
Economic subsystemPer capita GDP (Yuan)26,54830,92136,34746,03551,14458,96168,31579,48289,00098,527
GDP output per unit water (10,000 Yuan/m3)74.986.1100.8111.4125.3150.4169.5183.5205.6223.8
Investment in wastewater treatment (10,000 Yuan)93.2132.6191.8191.8191.8205.9227.4229.3254.3260.3
Table 3. The Weights assigned to the Elements.
a 1 a 2 a 3 a 1 a 2 a 3 a 4 a 5 a 1 a 2 a 3 a 1 a 2 a 3 a 1 a 2 a 3 b 1 b 2 b 3 b 4 b 5 c 2 c 3 c 4 c 5
for D 1 for D 2 for D 3 for D 4 for D 5 b n c j
0.360.270.380.190.160.220.190.250.300.370.320.340.370.280.330.340.360.370.220.210.130.080.370.200.290.15
From Figure 2 we can clearly see that the development degree of the five systems changes over time. In this study, the development degree of the river–lake system (D1) is mainly influenced by the quantity of lakes and rivers, and by the density of river networks, which reflect the structural characteristics of the river–lake system. In 2005 (D1) in Wuhan was low to begin with, and then continued to decline, to a minimum by 2008. After 2008, (D1) began to show steady growth. Since the 1980s the Wuhan city region has been expanding rapidly, resulting in large areas of wetland being occupied, and the destruction of river–lake systems, which led to the low river–lake system development degree in 2005. After the implementation of the Donghu Lake Ecological Water Network Engineering Project in 2009, the development of the river–lake system began to improve. However, disparity still remains between the results of the engineering project and the status of the natural river–lake system connections.
Figure 2. Line graph of the development degree of each system, 2005 to 2014.
Sustainability 08 00015 g002
The environment subsystem development degree (D2) is not only affected by the overall amount of water resources and groundwater extraction, it is also related to ecological water consumption and the domestic sewage treatment ratio condition. Within the time scale of this study, the results show that (D2) experienced constant minor fluctuations but with no overall change and the development level still remains low. The value of (D2) has a close connection with the overall amount of water resources in a given area. The volume of overall water resources in 2007 was 2.987 billion m3 (Table 2), which represents the lowest level of (D2) during the period of time studied. In the year 2010 when water resources were most abundant, the value of (D2) was at its highest level during the ten year study. The infrastructure subsystem development degree (D3) is influenced by wetland coverage rate, the number of large and medium bridges, the length of water drainage and sewage pipelines. By the end of the ten year period studied, the value of (D3) was more than four times higher than it was in 2005. This is due to increasing infrastructure investment since 2005. The social subsystem development degree (D4) is related to the urbanization rate, per capita water resources, and waterfront landscape satisfaction. The value of (D4) in 2010 was more than 0.5 and significantly higher than that of other years. This is due to two main factors: firstly, the abundant precipitation in Wuhan city in 2010 meant that the water resources per capita had a volume of 888.75 m3. This high level of precipitation improved the environment subsystem, and had a positive effect on the society of Wuhan. Secondly, in 2009 the Wuhan local government started the Donghu Lake Ecological Water Network Engineering Project, which led to the improvement of the waterfront landscape, much to the satisfaction of the local residents. From 2005 to 2014 there was rapid economic growth in Wuhan. The per capita GDP greatly increased, as well as the yearly investment in sewage control and management. At the same time, the efficiency of water resources also increased, the GDP output per unit of water increased from 74.85 Yuan in 2005 to 223.79 Yuan in 2014. These are the reasons behind the rapid growth of the development degree of the economic system (D5). In the year 2012 the growth of D5 began to slow. This slowdown in growth is consistent with the macroeconomic situation of Wuhan city, and is caused by the more rational pattern of economic development in Wuhan.
The comprehensive development degree (D) is affected by the collective influence of the five systems, and it reflects the variation in the development level of the compound system (Figure 3). From 2005 to 2007, D maintained a low level. From 2008 onwards D showed significant growth, only slowing down after 2010. This trend continued into 2014. On the whole, during the ten years studied D showed a gradual yet steady increase and this corresponds to the fact that in recent years, Wuhan city has relied on the extensive spread of rivers and lakes in the surrounding area to improve the development of all systems. More specifically, D (Figure 3) and D1 (Figure 2) have increased to a certain extent within the ten years, however this rate of increase was not very large and these two development degrees are still at a low level. The infrastructure and economic systems dominated the development of the urban system (Figure 2), and their development degrees are superior to those of the river–lake system, society subsystem and environment subsystem. In the future, in order to improve D, a greater emphasis should be considered when focusing efforts on improving the development level of the three subsystems.
Figure 3. Line graph of comprehensive development degree, coupling degree, and coordination degree of the compound system, 2005 to 2014.
Sustainability 08 00015 g003
The coupling degree (C) reflects the interaction and feedback of each system. Before 2005, the power behind the economic development of Wuhan city was relatively inferior, the per capita GDP was only 26,548 Yuan, and the unilateral GDP output per unit of water and investment in wastewater treatment was also at a relatively low level (Table 2). There was a large difference between the level of development of the economic system of Wuhan and the average condition of other systems (Figure 3). Within the time period studied, C was at its lowest level in 2005. From 2008, the government of Wuhan began to attach great importance to the building of infrastructure connected with the river–lake system. At the same time, the integrated management of water resources enhanced public awareness of both the protection of water resources and the improvement in the condition of rivers and lakes in Wuhan city. Due to the reasons stated above, each system showed a similar level of development and a good amount of feedback between systems. C was at its highest level in 2008. The Donghu Lake Ecological Water Network Engineering Project began in 2009, after which the connection conditions of the river–lake system began to show quite obvious improvement. However, there was no obvious improvement in the development of other systems, and C within each system gradually declined. This trend continued until 2014.
The information coordination degree S includes two aspects: the comprehensive development level of the compound system and the composition of the feedback situation between the systems. Before 2007, both D and C of the compound system were relatively low, and the extent of change was small. Due to this low level, S essentially remained unchanged at a low level until 2007 (Figure 3). After 2009, C of the compound system appeared to decline slightly and as a result of an obvious increase in D after 2009, the change in S showed a similar tendency.
In order to reflect the change in D, C, and S, three dates were selected, at intervals of four and five years, respectively: the first year of the study period in 2005, the launch of the Donghu Lake Ecological Water Network Engineering Project in 2009, and the final year of the study period in 2014. The values of D, C, and S at these three time periods were used to create the following radar chat (Figure 4). We can clearly see that C within the three years chosen remains virtually unchanged around the endpoint, with its endpoint value close to 1. Since 2005, D and S have continuously extended outward from the centre of the diagram, and this trend continued until 2014. This shows that the sustainability of the river–lake and urban compound system has improved overall.
Figure 4. Radar chart of the change in the comprehensive degree, coupling degree and coordination degree of the compound system at three selected points in time.
Sustainability 08 00015 g004

4. Conclusions

In order to study the evolution of the relation between the river–lake system and the urban system, the urban system is simplified into four subsystems: environment, infrastructure, social, and economic. These four subsystems interact with the river–lake system to form a compound system. During the process of building a Collaborative Development Model, Dn, D, C, and S of the systems were used to represent the development level of each individual system, the development level of the compound system, the interaction and feedback between systems, and the sustainable statuses of the evolution of the compound system under the influence of internal and external factors, respectively. The aforementioned degrees were found using 17 related indicators as the basis for their calculation.
Using the Collaborative Development Model, the evolution of the river–lake and urban compound system of Wuhan city was studied from 2005 to 2014. The results from the Collaborative Development Model correspond to the actual situation in Wuhan city. Over the whole period of time studied, D and S experienced a certain degree of ascension and C was at a higher level of basic stability. The results from this study emulate how, throughout the time period studied, the systems which comprise the compound system were constantly evolving. The conflicts between the five systems were diminishing year by year, creating a more balanced relationship. However, the coordination degree still has much potential for improvement. Under the premise of ensuring a high coupling degree and by focusing on improving the situation of the river–lake system, environment subsystem and social subsystem, we can effectively improve the comprehensive development degree, and then promote the sustainable status of the compound system.
After adjusting the evaluation index system according to regional characteristics, this model could be used in other cities and regions in order to study the relationship between the river–lake system and the urban system and to provide the basis for sustainable development. The relationship between the river–lake and urban systems during extreme events, such as flooding and droughts, sporadic water contamination, climate change, and so forth, should also be investigated in further studies.

Acknowledgments

We would like to thank Bo He who collected the original data for our research, and Deshan Tang for his advice in writing this manuscript.

Author Contributions

All authors contributed to the design and development of this research. The manuscript was primarily written by Wei Wang and Melissa Pilgrim. Jinan Liu prepared the drafts.

Conflicts of Interest

The authors declare no conflict of interest.

References

  1. Macklin, M.G.; Lewin, J. The rivers of civilization. Quat. Sci. Rev. 2015, 114, 228–244. [Google Scholar] [CrossRef]
  2. Turner-Gillespie, D.F.; Smith, J.A.; Bates, P.D. Attenuating reaches and the regional flood response of an urbanizing drainage basin. Adv. Water Resour. 2003, 26, 673–684. [Google Scholar] [CrossRef]
  3. Tang, Z.; Engel, B.A.; Pijanowski, B.C.; Lim, K.J. Forecasting land use change and its environmental impact at a watershed scale. J. Environ. Manag. 2005, 76, 35–45. [Google Scholar] [CrossRef] [PubMed]
  4. Gregory, K.J. The human role in changing river channels. Geomorphology 2006, 79, 172–191. [Google Scholar] [CrossRef]
  5. Meng, X.; Zhang, Y.; Yu, X.; Zhan, J.; Chai, Y.; Critto, A.; Li, Y.; Li, J. Analysis of the temporal and spatial distribution of lake and reservoir water quality in China and changes in its relationship with GDP from 2005 to 2010. Sustainability 2015, 7, 2000–2027. [Google Scholar] [CrossRef]
  6. Van Stokkom, H.T.C.; Smits, A.J.M.; Leuven, R. Flood defense in the Netherlands—A new era, a new approach. Water Int. 2005, 30, 76–87. [Google Scholar] [CrossRef] [Green Version]
  7. Kayser, G.L.; Moriarty, P.; Fonseca, C.; Bartram, J. Domestic water service delivery indicators and frameworks for monitoring, evaluation, policy and planning: A review. Int. J. Environ. Res. Public Health 2013, 10, 4812–4835. [Google Scholar] [CrossRef] [PubMed]
  8. Cook, C.; Bakker, K. Water security: Debating an emerging paradigm. Glob. Environ. Change-Hum. Policy Dimens. 2012, 22, 94–102. [Google Scholar] [CrossRef]
  9. Gao, Y.; Wu, Z.; Lou, Q.; Huang, H.; Cheng, J.; Chen, Z. Landscape ecological security assessment based on projection pursuit in pearl river delta. Environ. Monit. Assess. 2012, 184, 2307–2319. [Google Scholar] [CrossRef] [PubMed]
  10. Cui, B.; Wang, C.; Tao, W.; You, Z. River channel network design for drought and flood control: A case study of Xiaoqinghe River basin, Jinan City, China. J. Environ. Manag. 2009, 90, 3675–3686. [Google Scholar] [CrossRef] [PubMed]
  11. Gurnell, A.M.; Shuker, L.; Lee, M.; Boitsidis, A.J. Gradients in the biophysical structure of urban rivers and their association with river channel engineering. River Res. Appl. 2012, 28, 908–925. [Google Scholar] [CrossRef]
  12. Allan, J.D.; Erickson, D.L.; Fay, J. The influence of catchment land use on stream integrity across multiple spatial scales. Freshw. Biol. 1997, 37, 149–161. [Google Scholar] [CrossRef]
  13. Billen, G.; Garnier, J.; Ficht, A.; Cun, C. Modeling the response of water quality in the Seine River Estuary to human activity in its watershed over the last 50 years. Estuaries 2001, 24, 977–993. [Google Scholar] [CrossRef]
  14. Gregory, K.J. Urban channel adjustments in a management context: An Australian example. Environ. Manag. 2002, 29, 620–633. [Google Scholar] [CrossRef]
  15. Chin, A. Urban transformation of river landscapes in a global context. Geomorphology 2006, 79, 460–487. [Google Scholar] [CrossRef]
  16. Kaushal, S.S.; Belt, K.T. The urban watershed continuum: Evolving spatial and temporal dimensions. Urban Ecosyst. 2012, 15, 409–435. [Google Scholar] [CrossRef]
  17. Butler, S.; Webster, T.; Redden, A.; Rand, J.; Crowell, N.; Livingstone, W. Using remote sensing to identify changes in land use and sources of fecal bacteria to support a watershed transport model. Water 2014, 6, 1925–1944. [Google Scholar] [CrossRef]
  18. Dutta, D.; Wilson, K.; Welsh, W.D.; Nicholls, D.; Kim, S.; Cetin, L. A new river system modelling tool for sustainable operational management of water resources. J. Environ. Manag. 2013, 121, 13–28. [Google Scholar] [CrossRef] [PubMed]
  19. Lv, H.; Xu, Y.; Han, L.; Zhou, F. Scale-dependence effects of landscape on seasonal water quality in Xitiaoxi Catchment of Taihu basin, China. Water Sci. Technol. 2015, 71, 107–114. [Google Scholar] [CrossRef] [PubMed]
  20. Toosi, S.L.R.; Samani, J.M.V. Evaluating water transfer projects using analytic network process (ANP). Water Resour. Manag. 2012, 26, 1999–2014. [Google Scholar] [CrossRef]
  21. Qiu, D.R.; Wu, Z.B.; Liu, B.Y.; Deng, J.Q.; Fu, G.P.; He, F. The restoration of aquatic macrophytes for improving water quality in a hypertrophic shallow lake in Hubei Province, China. Ecol. Eng. 2001, 18, 147–156. [Google Scholar] [CrossRef]
  22. The Wuhan Statistics Yearbook (2005–2014). Available online: http://acad.cnki.net/Kns55/oldnavi/n_item.aspx?NaviID=4&BaseID=YWHTJ&NaviLink=%e6%a3%80%e7%b4%a2%3a%e6%ad%a6%e6%b1%89-%2fKns55%2foldnavi%2fn_list.aspx%3fNaviID%3d4%26NaviQueryID%3d0%7c%e6%ad%a6%e6%b1%89%e7%bb%9f%e8%ae%a1%e5%b9%b4%e9%89%b4 (accessed on 6 August 2015).
  23. Wuhan Water Resources Bulletin (2005–2014). Available online: http://www.whswj.com/News/default.asp?cataid=25 (accessed on 3 August 2015).

