3.1. Results of Life Cycle Impact Assessment
The results of impact assessment are unveiled in
Table 2 and
Table 3 as the values of 18 Midpoint indicators and three Endpoint indicators for each alternative.
Among the analysed alternatives, the following ones revealed the slightest impact: “8” (simulation based on Ecoinvent data); “2” (silica sand production from high quality raw sand utilizing simple processing techniques such as sizing and washing); “3” (silica sand production from high quality raw sand utilizing simple processing techniques such as sizing and washing plus drying in a rotary drier); “6” (silica sand production utilizing processing techniques such as sizing, washing and gravity concentration); “4” (silica sand production utilizing processing techniques such as sizing, washing and froth flotation). An intermediate impact was attributed to alternatives “1” (silica sand production utilizing processing techniques such as sizing, washing, drying with grain surface conditioning using hydrofluoric acid, and electrostatic separation) and “7” (silica sand production utilizing processing techniques such as sizing, washing, gravity concentration and drying). A major impact was generated by alternative “5” (silica sand production utilizing processing techniques such as sizing, washing, flotation and drying). Utilization of fossil fuels and water intensified the impacts to a great extent.
Table 2.
Midpoint indicator results of life cycle impact assessment for eight cradle-to-gate alternatives in silica sand production (ReCiPe Midpoint (H) V1.06/Europe ReCiPe H) per ton of produced silica sand.
Table 2.
Midpoint indicator results of life cycle impact assessment for eight cradle-to-gate alternatives in silica sand production (ReCiPe Midpoint (H) V1.06/Europe ReCiPe H) per ton of produced silica sand.
| Impact Category | Unit | Alternative |
|---|
| 1 | 2 | 3 | 4 | 5 | 6 | 7 | 8 |
|---|
| Electrost | Basic/w | Basic/d | Flotation/w | Flotation/d | Gravity/w | Gravity/d | Simulation |
|---|
| 1 | Climate Change | kg·CO2·eq | 5.27 × 10 | 3.30 × 10 | 4.30 × 10 | 4.31 × 10 | 7.52 × 10 | 4.19 × 10 | 5.25 × 10 | 2.96 × 10 |
| 2 | Ozone Depletion | kg·CFC-11·eq | 8.14 × 10⁻⁶ | 4.66 × 10⁻⁶ | 6.90 × 10⁻⁶ | 6.23 × 10⁻⁶ | 1.17 × 10⁻⁵ | 6.01 × 10⁻⁶ | 8.30 × 10⁻⁶ | 4.48 × 10⁻⁶ |
| 3 | Human Toxicity | kg·1.4-DB·eq | 5.46 | 1.92 | 2.38 | 4.51 | 5.52 | 4.57 | 5.09 | 7.25 × 10⁻¹ |
| 4 | Photochemical Oxidant Formation | kg·NMVOC | 4.26 × 10⁻¹ | 3.56 × 10⁻¹ | 3.71 × 10⁻¹ | 4.44 × 10⁻¹ | 6.42 × 10⁻¹ | 4.48 × 10⁻¹ | 4.63 × 10⁻¹ | 5.07 × 10⁻¹ |
| 5 | Particulate Matter Formation | kg·PM10·eq | 1.33 × 10⁻¹ | 9.93 × 10⁻² | 1.07 × 10⁻¹ | 1.37 × 10⁻¹ | 1.90 × 10⁻¹ | 1.28 × 10⁻¹ | 1.36 × 10⁻¹ | 1.13 × 10⁻¹ |
| 6 | Ionising Radiation | kg·U235·eq | 4.23 | 1.47 | 1.73 | 3.96 | 4.59 | 3.62 | 3.93 | 2.27 |
| 7 | Terrestrial Acidification | kg·SO2·eq | 3.35 × 10⁻¹ | 2.21 × 10⁻¹ | 2.51 × 10⁻¹ | 3.36 × 10⁻¹ | 4.79 × 10⁻¹ | 2.81 × 10⁻¹ | 3.13 × 10⁻¹ | 2.77 × 10⁻¹ |
| 8 | Freshwater Eutrophication | kg·P·eq | 7.39 × 10⁻³ | 2.47 × 10⁻³ | 2.83 × 10⁻³ | 6.15 × 10⁻³ | 7.00 × 10⁻³ | 5.08 × 10⁻³ | 5.59 × 10⁻³ | 6.78 × 10⁻⁴ |
| 9 | Marine Eutrophication | kg·N·eq | 1.59 × 10⁻² | 1.27 × 10⁻² | 1.31 × 10⁻² | 1.66 × 10⁻² | 2.37 × 10⁻² | 1.61 × 10⁻² | 1.65 × 10⁻² | 1.75 × 10⁻² |
| 10 | Terrestrial Ecotoxicity | kg·1.4-DB·eq | 6.87 × 10⁻³ | 2.62 × 10⁻³ | 5.68 × 10⁻³ | 3.28 × 10⁻³ | 9.09 × 10⁻³ | 4.06 × 10⁻³ | 7.22 × 10⁻³ | 8.17 × 10⁻⁴ |
| 11 | Freshwater Ecotoxicity | kg·1.4-DB·eq | 1.33 × 10⁻¹ | 5.15 × 10⁻² | 6.46 × 10⁻² | 1.14 × 10⁻¹ | 1.45 × 10⁻¹ | 1.07 × 10⁻¹ | 1.21 × 10⁻¹ | 2.27 × 10⁻² |
| 12 | Marine Ecotoxicity | kg·1.4-DB·eq | 1.63 × 10⁻¹ | 5.70 × 10⁻² | 9.05 × 10⁻² | 1.14 × 10⁻¹ | 1.75 × 10⁻¹ | 1.14 × 10⁻¹ | 1.50 × 10⁻¹ | 2.13 × 10⁻² |
| 13 | Agricultural Land Occupation | m2a | 4.59 × 10⁻² | 2.68 × 10⁻² | 2.81 × 10⁻² | 9.91 × 10⁻² | 1.02 × 10⁻¹ | 1.05 × 10⁻¹ | 1.03 × 10⁻¹ | 4.16 × 10⁻³ |
| 14 | Urban Land Occupation | m2a | 5.61 × 10⁻¹ | 4.72 × 10⁻¹ | 4.73 × 10⁻¹ | 6.22 × 10⁻¹ | 6.24 × 10⁻¹ | 8.37 × 10⁻¹ | 8.27 × 10⁻¹ | 2.90 × 10⁻¹ |
| 15 | Natural Land Transformation | m2 | 4.04 × 10⁻⁴ | 1.29 × 10⁻⁴ | 1.37 × 10⁻⁴ | 2.73 × 10⁻⁴ | 2.99 × 10⁻⁴ | 7.29 × 10⁻³ | 6.95 × 10⁻³ | 5.54 × 10⁻³ |
| 16 | Water Depletion | m3 | 1.81 | 1.24 | 5.83 | 5.24 | 5.28 | 3.06 | 3.08 | 1.43 |
| 17 | Metal Depletion | kg·Fe·eq | 1.22 × 10⁻² | 4.35 × 10⁻³ | 5.31 × 10⁻³ | 1.20 × 10⁻² | 1.41 × 10⁻² | 8.48 × 10⁻¹ | 8.07 × 10⁻¹ | 4.57 × 10⁻² |
| 18 | Fossil Depletion | kg·oil·eq | 2.16 × 10 | 1.17 × 10 | 1.79 × 10 | 1.69 × 10 | 3.05 × 10 | 1.54 × 10 | 2.18 × 10 | 1.01 × 10 |
Table 3.
Endpoint indicator results of life cycle impact assessment for eight cradle-to-gate alternatives in silica sand production (ReCiPe Midpoint (H) V1.06 / Europe ReCiPe H) per ton of produced silica sand.
Table 3.
Endpoint indicator results of life cycle impact assessment for eight cradle-to-gate alternatives in silica sand production (ReCiPe Midpoint (H) V1.06 / Europe ReCiPe H) per ton of produced silica sand.
| Damage Category | Unit | Alternative |
|---|
| 1 | 2 | 3 | 4 | 5 | 6 | 7 | 8 |
|---|
| Electrost | Basic/w | Basic/d | Flotation/w | Flotation/d | Gravity/w | Gravity/d | Simulation |
|---|
| Human Health | DALY | 1.12 × 10⁻⁴ | 7.34 × 10⁻⁵ | 8.97 × 10⁻⁵ | 9.92 × 10⁻⁵ | 1.59 × 10⁻⁴ | 9.53 × 10⁻⁵ | 1.12 × 10⁻⁴ | 7.14 × 10⁻⁵ |
| Ecosystems | species.yr | 4.33 × 10⁻⁷ | 2.73 × 10⁻⁷ | 3.53 × 10⁻⁷ | 3.58 × 10⁻⁷ | 6.14 × 10⁻⁷ | 3.63 × 10⁻⁷ | 4.47 × 10⁻⁷ | 2.52 × 10⁻⁷ |
| Resources | $ | 346.30 | 187.25 | 287.42 | 271.54 | 490.54 | 247.22 | 349.74 | 162.69 |
| Human Health | Pt | 2.23 | 1.46 | 1.78 | 1.97 | 3.14 | 1.89 | 2.23 | 1.42 |
| Ecosystems | Pt | 0.99 | 0.63 | 0.81 | 0.82 | 1.41 | 0.83 | 1.02 | 0.58 |
| Resources | Pt | 2.58 | 1.40 | 2.14 | 2.03 | 3.66 | 1.84 | 2.61 | 1.21 |
| Single score | Pt | 5.80 | 3.48 | 4.73 | 4.82 | 8.21 | 4.57 | 5.87 | 3.21 |
As shown, among the analysed beneficiation processes (alternatives 1–7), basic processing (sand washing and sizing) generated the smallest impacts. However, its application for glass-grade silica sand production is limited only to chemically very pure raw sand. The same counts for construction and foundry grade products. Depending on the quality of sand, attrition scrubbing is not always required. In such a case, and if raw sand contains a low percentage of dust particles, the sizing could be managed in a dry regime, which requires less energy and water, but does require more extensive dust control.
With more complex processing (electrostatic separation and flotation) implying prevention of emissions of chemicals into the environment, use of petrol based hydrocarbons (fuels and reagents) can be denoted as important environmental impact factors. This cradle-to-gate LCA of glass-grade silica sand indicated fossil fuel use as the major contributor to the impacts. The risk of at least one chemical incident in the lifetime of a plant should be taken into the account. Also, it is unclear whether the assumed recycling extent of process water and chemicals is really achievable or not. In the former case, the flotation technique would produce even the worst environmental impacts.
The applicability of gravity concentration depends on the quality of raw sand, particularly on the density difference between quartz and accompanying gangue minerals and on the process parameter setup which, according to plant engineers, can take much time and patience until the perfect setup is achieved. Gravity concentration definitely appears to be, from the environmental aspect, a technique worthy of discussion as to its further development. It remains to consider whether exploitation of river water and its return to the same watercourse about hundred meters downstream (after sedimentation) would produce worse environmental impacts than could be expected.
Transportation of naturally dried wet sand and drying it in a glass factory using waste heat resulted in a smaller impact as drying it in a processing plant and then transporting it into a glass factory; however, it would be illusory to expect favourable climate conditions throughout the whole year. The drying option based on fuel oil was probably the worst case scenario. Maybe it would be more beneficiary to use, for example, gas as an energy source, which the respective plant has lately been doing. As an improvement in this area, it might be advisable to consider “greener” sources of heat as well as design of a processing or dryer plant in cooperation with large waste heat producers.
3.2. Contribution Analysis
In analysed alternatives we can group all unit processes in four groups:
In this part the contribution analysis is shown. The tables and details can be found in
supplementary material (Appendices 2 and 3).
3.2.1. Production of the Raw Silica Sand in Croatia
The production of the raw silica sand is based on the work of the building machine (bull-dozer) and transportation of the excavated material by dumper truck. Both types of machines require diesel and lubricating oil. For the lighting of the excavation site, low voltage electricity is used. Analysing the contributions to calculated endpoint impact categories, fuel (and lubricants) are contributing to 99.9% of human health damage, 92.5% of damage to ecosystems and 99.9% to resource damage. Electricity use contributes to less than 0.1% damage in each category. Damage to ecosystems that follow from land occupation and use is 7.4%. However, this contribution can vary depending the size of the excavation site and area occupied by the mining company.
Obviously, any lowering of the diesel consumption in raw silica production would contribute to lowering the damage to human health, ecosystems and resources. The excavation and transportation calculated here use a cyclic regime of work in which part of the time machines are working “empty”, returning from the dumping site or manoeuvring. It would be worthwhile to also analyse the continuous regime of excavation and transport.
The production of the raw silica in Croatia is included in alternatives 1–7 because all alternatives are analysed cradle to gate.
3.2.2. Alternative 1: Sizing and Washing without Drying
Alternative 1 includes raw silica sand production, transport from the excavation site to the plant, sizing and washing and transport of the material to the glass factory gate. Processes included are using fuel (petrol based), electricity and water. Contributions to endpoint category “human health” for sizing and washing without drying are 46.8% from petrol based processes, 5.5% from electricity use and 0.8% from water use. Contributions to ecosystems damage are 50.7% from petrol based processes, 5.0% from electricity use and 0.8% from water use. Contributions to resources damage are 52.7% from petrol based processes, 4.3% from electricity use and 0.6% from water use. In this alternative, previously described raw silica sand production makes the remaining 46.9%, 44.5% and 42.3% for the respective endpoint categories. Clearly, the petrol based processes such as material handling and transport from excavation site to the plant and from the plant to the factory gate are mainly contributing to impact categories.
3.2.3. Alternative 2: Sizing and Washing with Drying
Alternative 2 includes raw silica sand production, transport from the excavation site to the plant, sizing, washing, drying and transport of the material to the glass factory gate. Processes included are using fuel (petrol based), electricity and water. Contributions to endpoint category “human health” for sizing and washing without drying are 53.4% from petrol based processes, 4.7% from electricity use and 0.6% from water use. Contributions to ecosystems damage are 59.1% from petrol based processes, 4.0% from electricity use and 0.6% from water use. Contributions to resources damage are 51.6% from petrol based processes, 2.9% from electricity use and 0.4% from water use. The remaining 41.3%, 36.2% and 45.0% for the human health, ecosystems and resources respectively are contribution of the raw silica production.
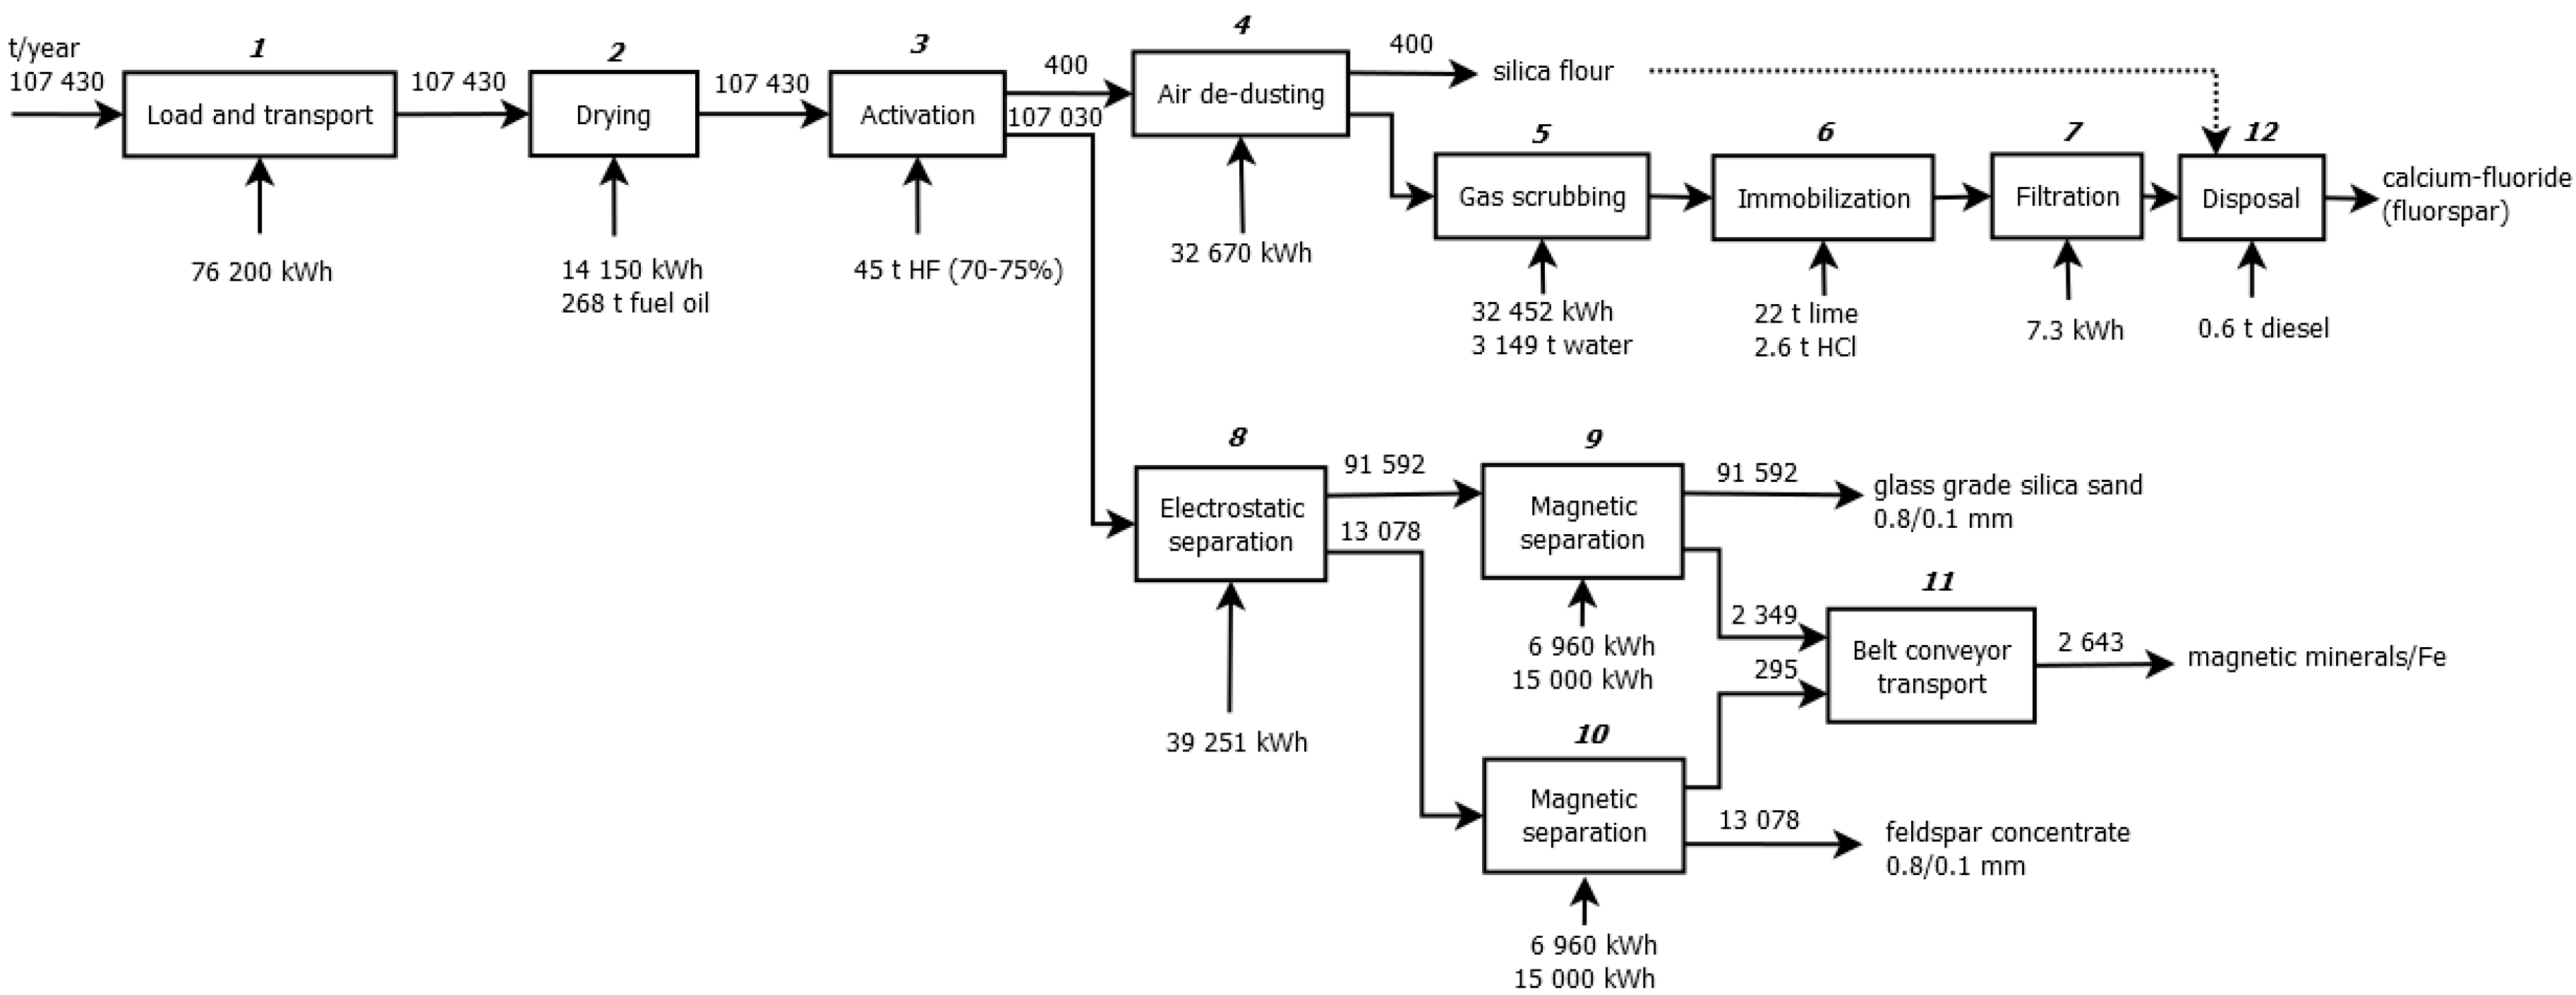
3.2.4. Alternative 3: Electrostatic Separation
Alternative 3 includes raw silica sand production, sizing and washing which are already analysed in Alternative 1. Assuming that the quality of the washed sand is unfit for glass production due to excessive percentage of the feldspar and heavy minerals, beneficiation technique (electrostatic separation/concentration) is applied. Electrostatic concentration of quartz minerals includes pre-treatments such as drying, conditioning the minerals’ surface with hydrofluoric fumes and air cleaning in absorption tower. The produced silica sand is transported to the glass factory.
Analysing the contribution of the applied concentration technique to the endpoint impact categories “human health”, “ecosystems” and “resources”, the petrol based processes contribute with 34.2%, 38.5% and 45.9%; electricity use 5.6%, 4.9% and 3.7%; and the chemicals use with 2.3%; 1.4% and 1.0% respectively. The remaining 57.9% in human health, 55.2% in ecosystems and 49.3% in resources category are following from the processes corresponding to Alternative 1 without transport.
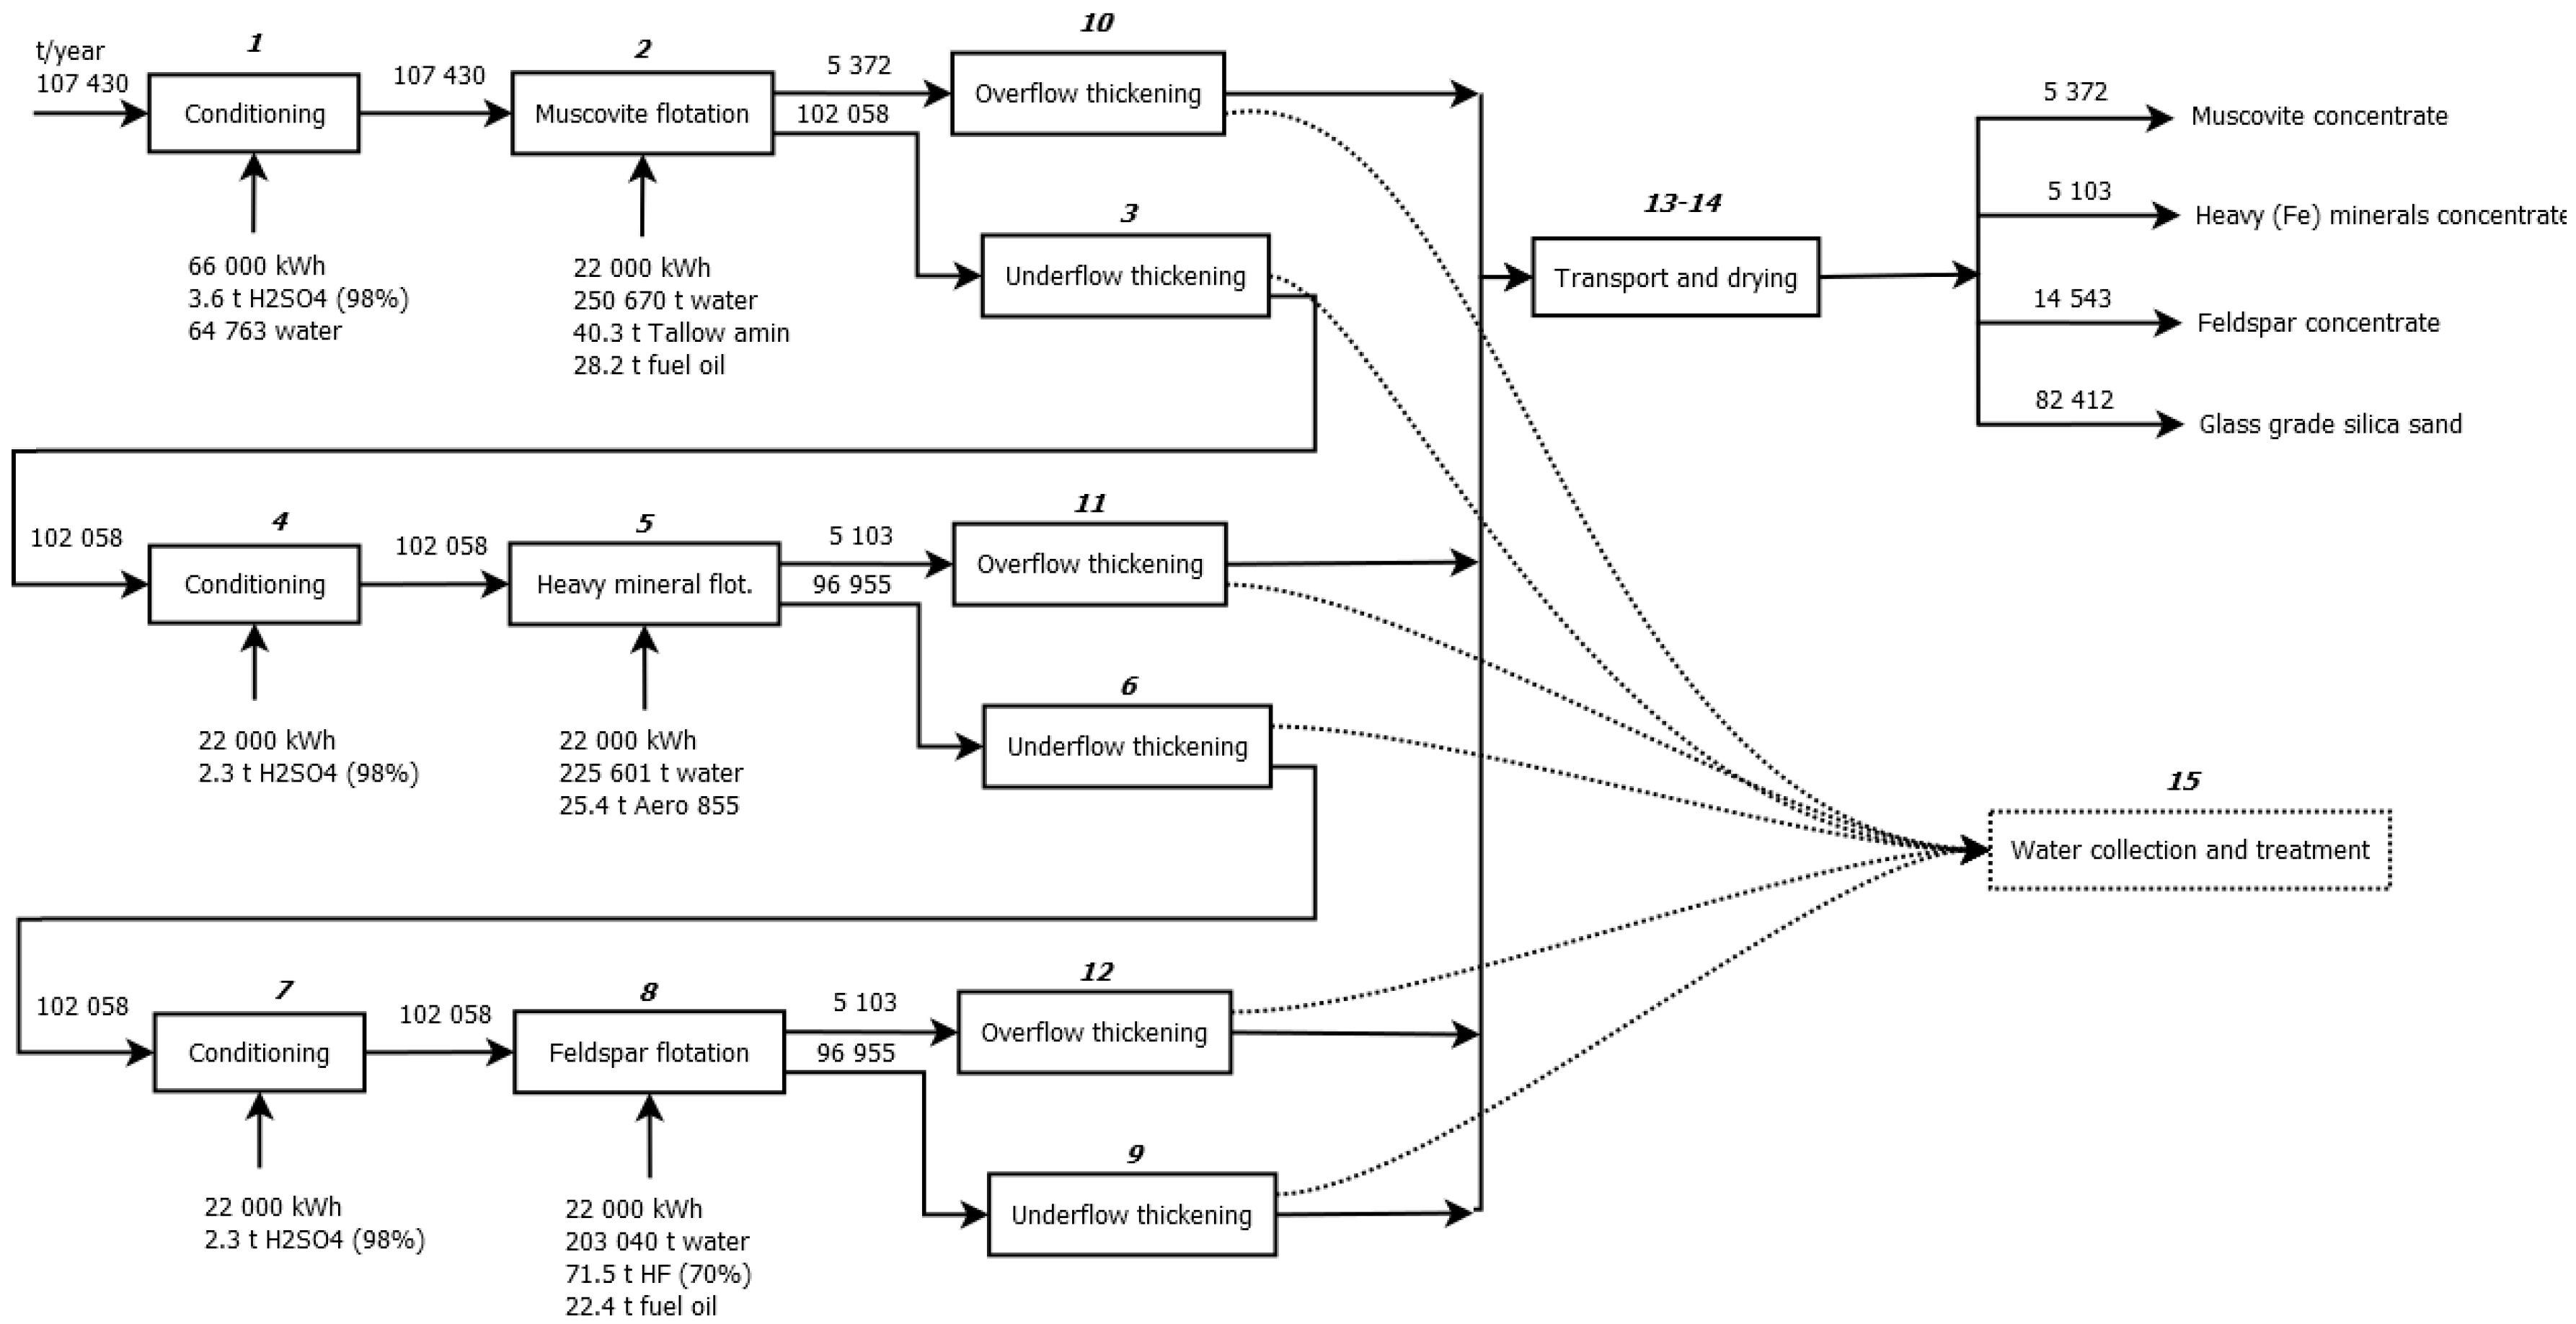
3.2.5. Alternative 4: Flotation without Drying
Analysing the contribution of the flotation technique to the endpoint impact categories “human health”, “ecosystems” and “resources”, the petrol based processes contribute with 3.6%, 3.9% and 10.5%; electricity use 2.2%, 2.0% and 1.6%; water use 1.4%, 1.6% and 1.1%; and the chemicals use with 7.0%, 5.5% and 6.9% respectively. The remaining 85.7% in human health, 87.0% in ecosystems and 79.9% in resources category are following from the processes corresponding to Alternative 1 without transport.
3.2.6. Alternative 5: Flotation with Drying
Analysing the contribution of the flotation technique with drying to the endpoint impact categories “human health”, “ecosystems” and “resources”, the petrol based processes contribute with 31.8%, 35.6% and 43.9%; electricity use 2.0%, 1.7% and 1.3%; water use 1.0%, 1.0% and 0.7%; and the chemicals use with 4.9%, 3.7% and 4.3% respectively. The remaining 60.3% in human health, 58.0% in ecosystems and 50.0% in resources category are following from the processes corresponding to Alternative 1 without transport.
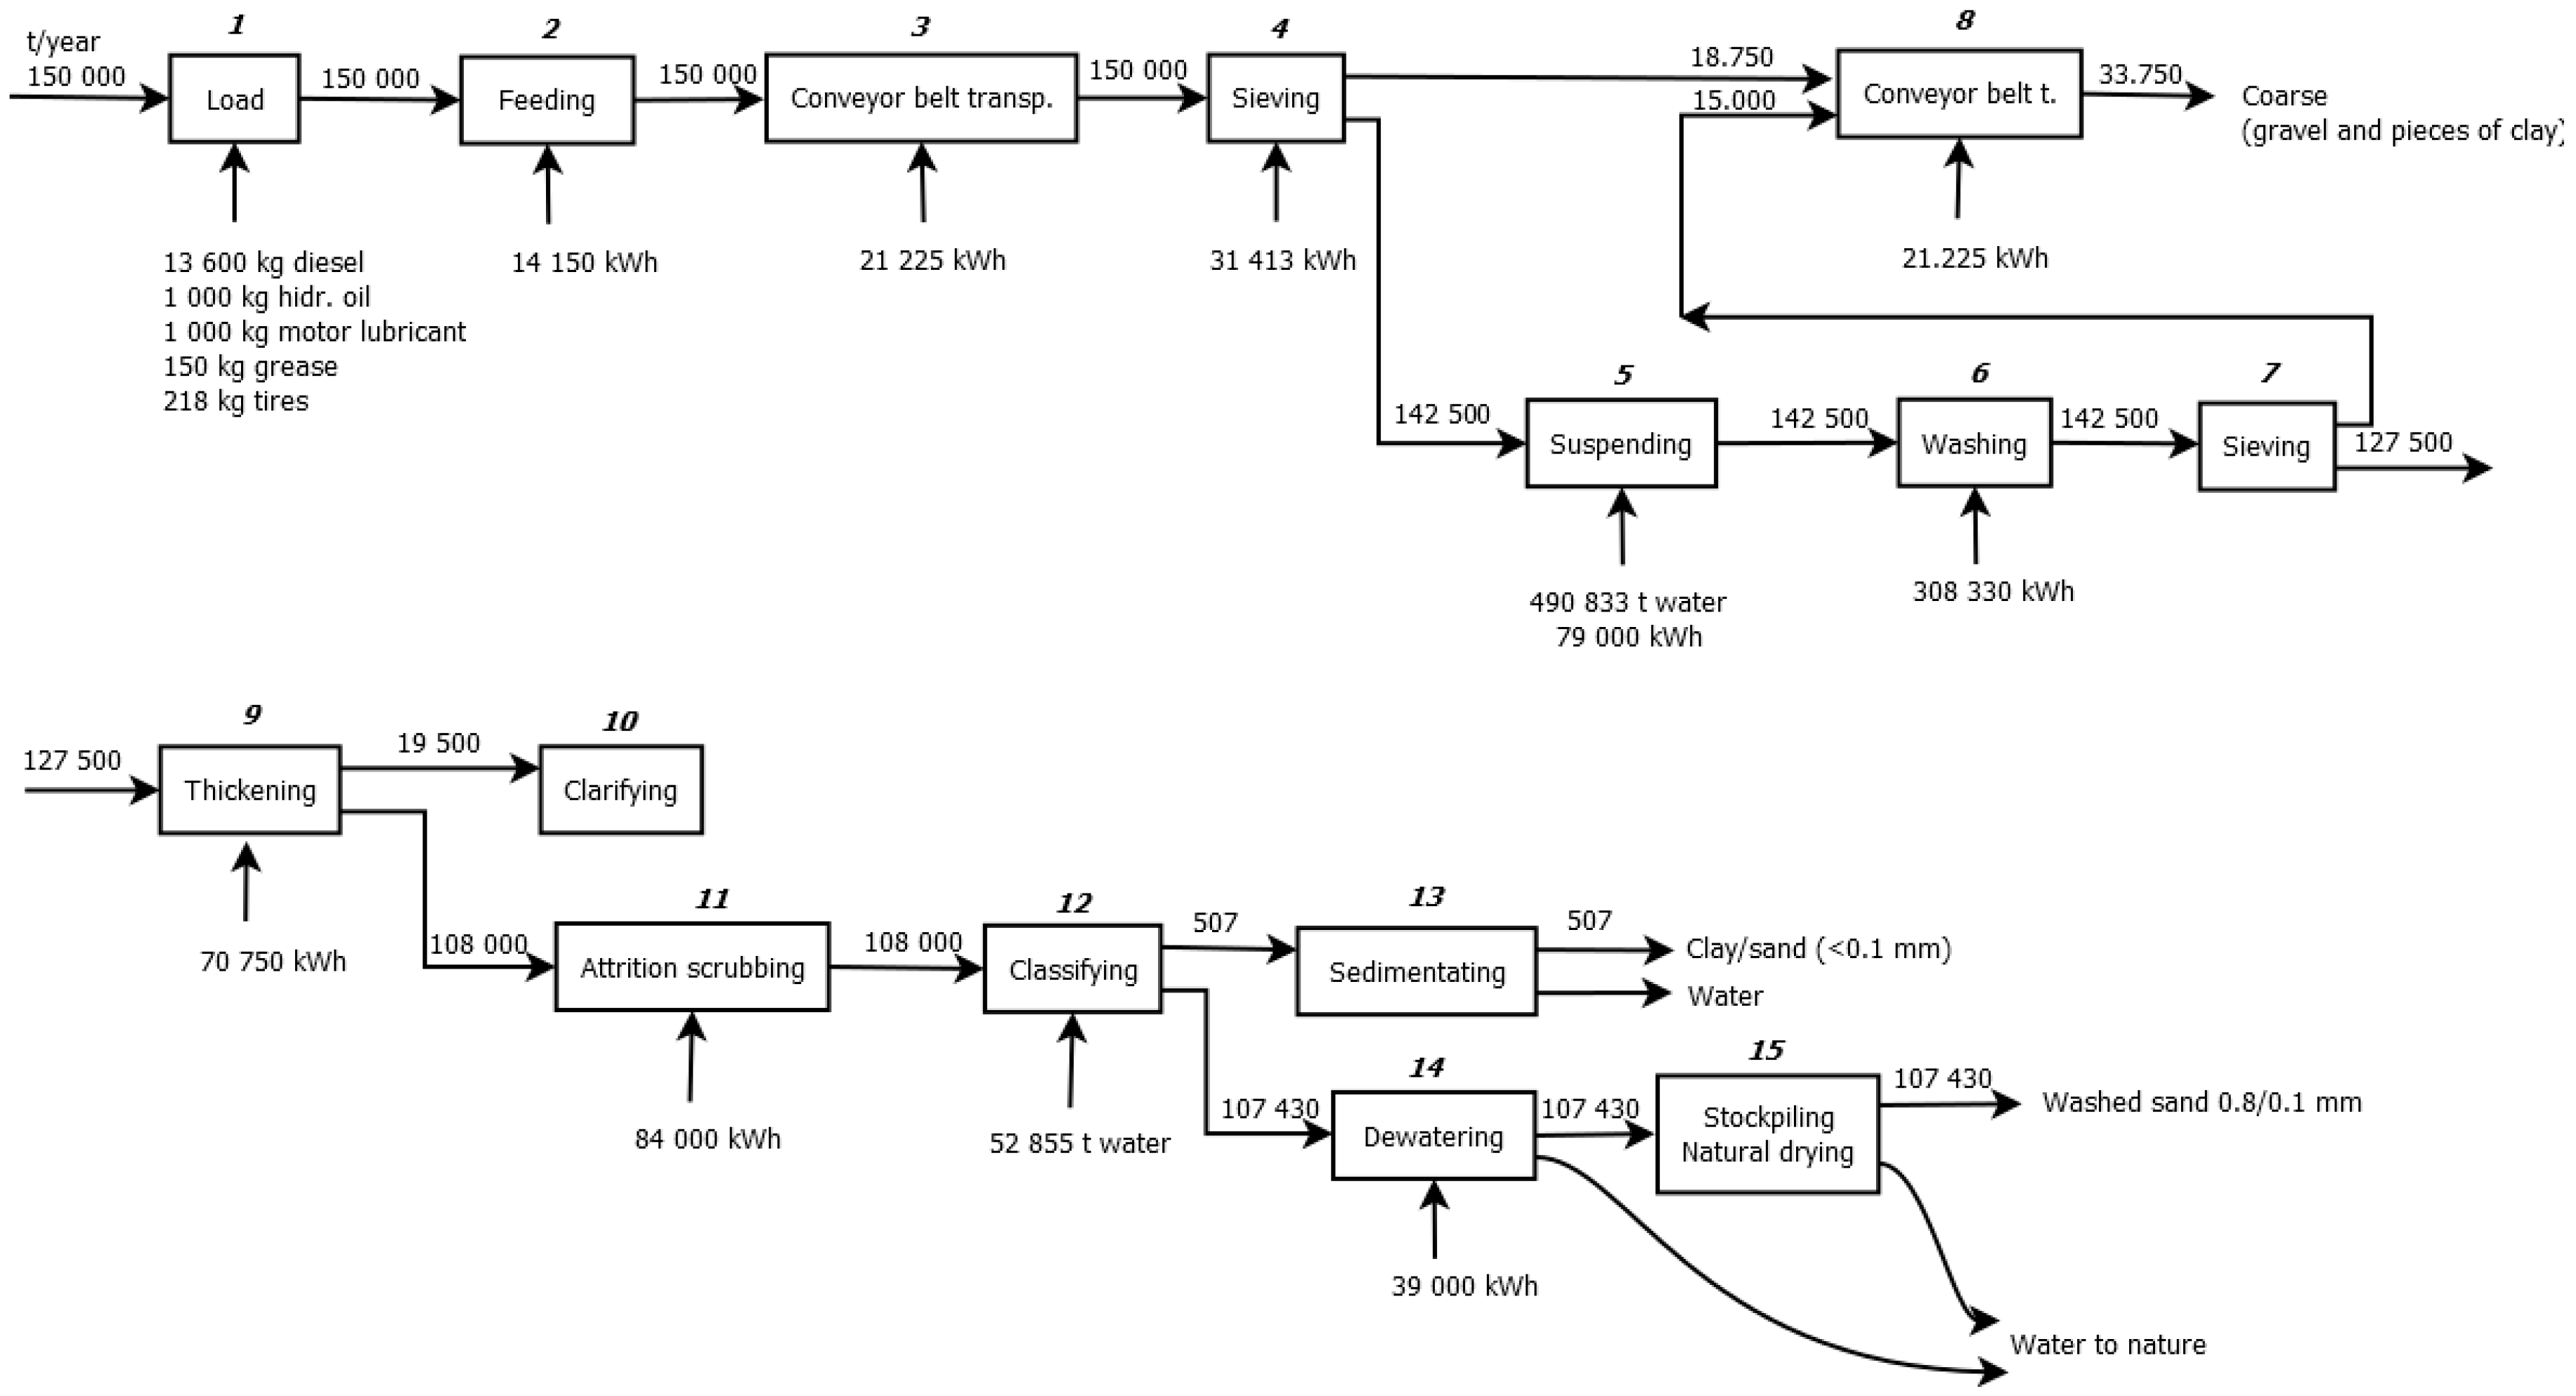
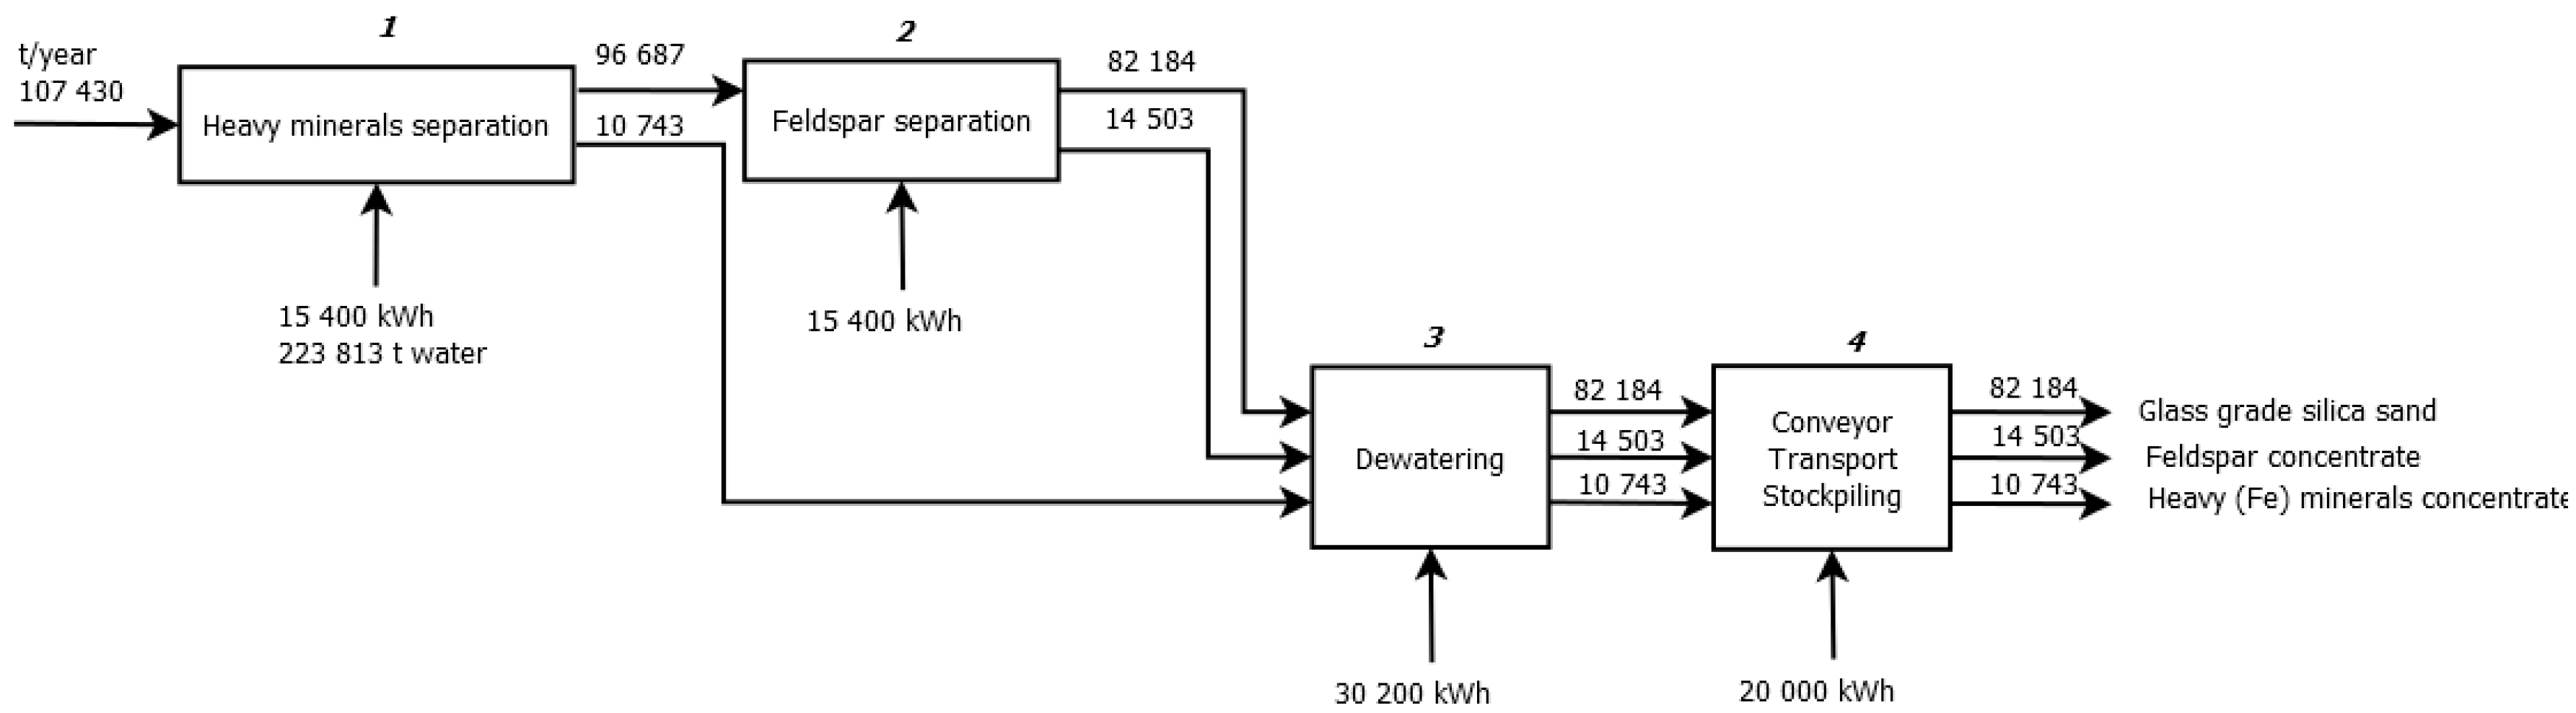
3.2.7. Alternative 6: Gravity Concentration without Drying
In this alternative it is assumed that the pulp (solid/fluid mix) is achieved in the washing stage so no additional water was required. Analysing the contribution of the gravity concentration technique to the endpoint impact categories “human health”, “ecosystems” and “resources”, the petrol based processes contribute with 29.7%, 32.9% and 32.4%; the electricity use 0.8%, 0.7% and 0.6% respectively. The remaining 59.5% in human health, 66.4% in ecosystems and 66.0% in resources category are following from the processes corresponding to Alternative 1 without transport.
3.2.8. Alternative 7: Gravity Concentration with Drying
In this alternative, it is assumed that the pulp (solid/fluid mix) is achieved in the washing stage so no additional water was required. Analysing the contribution of the gravity concentration technique to the endpoint impact categories “human health”, ‘ecosystems” and “resources”, the petrol based processes contribute with 36.1%, 40.5% and 46.0%; the electricity use 1.2%, 1.0% and 0.8% respectively. The remaining 62.7% in human health, 58.5% in ecosystems and 53.3% in resources category are following from the processes corresponding to Alternative 1 without transport.
3.2.9. Alternative 8: Simulation
Alternative 8 includes the Ecoinvent Data for the production of sand in Switzerland and the data for train transport. Diesel use in train transport contributes with 93.8% to human health damage, 88% to ecosystems damage and 93.6% to resources damage. The remaining 6.2%, 12% and 6.4% in human health, ecosystems and resources damage category are following from the sand production. In sand production, petrol based processes contribute to respective endpoint categories with 80%, 40% and 82.3%; and the electricity use with 18%, 9.3% and 15.6%.


