1. Introduction
Utilisation of biomass resources has attracted worldwide attention because of its potential to contribute to rural development and employment generation. It may also help improve energy security and decrease dependency on fossil fuels.
Over the last decade, interest in energy generation as well as material applications of biomass as a renewable resource has rapidly risen. The use of biomass to generate energy is a traditional practice, with woody plants serving as firewood. Contemporary uses of biomass as fuel, or as a source of bioenergy, are based on the application of various technologies that convert biomass to liquids, briquettes, pellets, or a gaseous mixture known as a synthesis gas to enhance their heat value and hence their combustion efficiency.
Although the use of biomass in the energy sector has been widely discussed at the global level, it can also be used as a renewable feedstock in biomaterial and biochemical product development. The production of bio-composites, comprising biomass fibers bound in synthetic or in-situ natural polymeric resins, is a well-established industrial process for producing wood polymer composites used as building materials and in making furniture. Research on the application of commercial scale bioprocesses for transforming biomass into biochemicals such as polylactic acid, polyhydroxyalkanoates, and polyamides is ongoing.
The increasing demand for biomass resources has also led to the recognition of some potentially negative issues, evidenced in the implementation of policies for the enhanced use of biomass. These issues are mainly related to environmental or social concerns regarding increased greenhouse gas (GHG) emissions, loss of biodiversity, adverse impacts on community livelihoods, and increasing food insecurity. In recent years, growing concern over these issues, especially in relation to biomass utilisation for generating energy, has led to the emergence of several initiatives for assessing bioenergy sustainability [
1]. These initiatives are aimed at developing sustainability criteria, indicators, certification systems, and legislation for processing bioenergy feedstock as well as producing and consuming bioenergy. Although stakeholders from East Asian countries are engaged in some of these initiatives, most are led by developed countries. Thus, East Asia is not at the forefront of initiatives to assess bioenergy sustainability. To develop appropriate sustainable assessment methodologies for biomass utilisation in biomass-rich East Asian countries, it is important to consider existing feedstock availability and socioeconomic conditions within this diverse group of countries.
Against this background, an expert working group (WG) was formed within the Economic Research Institute for Association of Southeast Asian Nations and East Asia (ERIA) in 2007. Comprising researchers from the region, the WG has conducted research to develop a theoretically sound and practically implementable methodology for assessing sustainable biomass utilisation that reflects the needs and potential of biomass resources in East Asian countries. The WG has adopted the definition of “sustainable development” proposed in the United Nations World Commission on Environment and Development report Our Common Future [
2]. This is: “development that meets the needs of the present without compromising the ability of future generations to meet their own needs”. The triple bottom line approach, focusing on “people, planet, and profit”, is based upon social, environmental, and economic criteria. These criteria are applied to ascertain the sustainability of biomass energy development. They must be considered to overcome and minimize problems that may occur as a result of expanding biomass utilisation initiatives. In 2008, the WG produced its first report [
3], which discussed general issues and offered policy recommendations on biomass utilisation. The WG also framed “Asian biomass energy principles” which were endorsed at the energy ministers’ meeting, held during the East Asian Summit in Bangkok in August 2008 [
4]. Subsequently, these energy ministers requested the WG to develop a region-specific methodology for assessing the environmental, economic, and social impacts of biomass energy. In response to this request, the WG compiled another report in 2009 [
5], which highlighted issues relevant to East Asian countries. In this report, the WG identified and developed sustainability indicators. Subsequently in 2010, the WG tested the above guidelines and indicators through their application in four respective pilot studies conducted in India, Indonesia, Thailand, and the Philippines. These field studies used the WG methodology to assess the sustainability of biomass energy produced from various feedstocks in these countries [
6]. Although the pilot studies confirmed that the WG indicators were applicable to the East Asian region, they were also found to have some shortcomings. These included the need for extensive data collection to measure the chosen indicators and interpret the results. Based on the experiences and lessons learned from the four pilot studies, in 2011, the WG suggested the applicability of new indicators and proposed some key indicators to comprehensively assess the sustainability of biomass energy in relation to both small- and large-scale initiatives [
7].
The WG methodology was originally aimed at assessing the sustainability of biomass energy. However, its application is not limited to energy production; it can also be applied to material production. For a given biomass feedstock with several potential applications, it is important to identify the most sustainable use among multiple possible options. Therefore in 2012, the WG presented the results of a case study entailing an ex-ante assessment of the sustainability of utilizing biomass from empty fruit bunches of oil palm in two separate domains; bioenergy and biomaterials [
8]. The WG group methodology was used to support appropriate decision-making and to ensure sustainable biomass utilisation during the planning stage of the biomass projects. As a culmination of this process, in 2013, the WG added some important missing sustainability indicators that have been included within other international biomass sustainability initiatives.
In this article, we introduce the WG’s methodology development and indicators formulated for assessing the sustainability of biomass utilisation in the specific context of East Asia.
2. Development and Field-Testing of Sustainability Indicators for Biomass Energy Utilisation
Since 2008, the WG had worked on development of sustainability assessment methodology for biomass energy utilisation in East Asia in accordance with the energy ministers’ meeting of East Asian Summit. In the year 2010, the applicability of the sustainability indicators developed was field-tested in four pilot studies conducted in East Asian countries.
2.1. Life Cycle GHG Emissions as Environmental Indicator
The life cycle assessment (LCA), which is increasingly being promoted as a technique for analyzing and assessing the environmental performance of a product system, is appropriate for environmental management and long-term sustainable development. The LCA can be used to quantitatively assess the extent of a product system’s impact in relation to serious environmental issues such as acidification, eutrophication, photo-oxidation, toxicity, and biodiversity loss. However, these impact categories do not currently receive the same degree of attention as does climate change, a phenomenon associated with the increasing frequency of extreme weather conditions and disasters. The effects of climate change have been directly attributed to the increased atmospheric concentration of greenhouse gases (GHGs) released as a result of anthropogenic activities. Considering indicators used in other initiatives for biomass energy sustainability, the WG selected life cycle GHG (LCGHG) emissions as the main indicator for evaluating the environmental sustainability of biomass energy utilisation. These emissions can be quantified by performing a life cycle inventory (LCI) analysis using compiled foreground and background data.
The LCGHG system boundary comprises feedstock cultivation, feedstock collection and biomass energy conversion. The LCI for biomass utilisation should cover CO
2 and major non-CO
2 GHGs, namely CH
4 and N
2O that are released directly and indirectly from agricultural activities. The GHG inventory, calculated as the CO
2 equivalent (CO
2eq), is based on the IPCC’s Fourth Assessment Report that assigns Global Warming Potential (GWP) values for a 100-year horizon [
9].
2.2. Total Value Added as Economic Indicator
Economic sustainability of biomass utilisation relates to the exploitation of biomass resources in a manner whereby the present generation obtains resultant benefits without depriving future generations of such benefits. In sustainability assessments, it is important to determine the actual level and degree of economic benefits brought about by the biomass industry. Specific economic indices have to be considered to measure the scope of the benefits. Existing methodologies for quantifying such indicators should also be evaluated and adopted. Economic indicators ultimately provide an accurate measurement of the economic performance of a particular industry such as biomass. A review of the literature reveals that the most common economic contributions of biomass utilisation are value addition, job creation, and tax revenue generation. Therefore, the WG adopted total value added (TVA), which is the sum of the value added generated from the biomass development process, including production, further conversion or processing, and byproducts, as the main economic sustainability indicator of biomass energy utilisation. TVA can be calculated by the following equations in the same manner as income approach of national accounts:
where:
where:
where:
2.3. Human Development Index as Social Indicator
Social issues in the growing markets for biomass energy are expected to become prominent as the producers and consumers of biomass energy may belong to different countries. Major social benefits of biomass energy include greater energy security, employment opportunities and improved health from reduced air pollution. On the other hand, the possible negative social impacts of biomass energy, such as food insecurity, need to be considered seriously. While there could be some relief on the energy front, food insecurity and increase in food prices, particularly in the developing economies, may aggravate the negative social impacts of biomass energy.
Measurement of social development differs significantly from that of economic development. In addition, compared to the indicators of social development, those of economic development are available for most countries. However, in many cases, particularly in the developing economies, economic indicators often reflect a rosy picture that may be far away from the reality. To capture the holistic picture of development across countries, the United Nations Development Programme (UNDP) has used the Human Development Index (HDI). This essentially takes into account the measures for living a long healthy life (measured by life expectancy), being educated (measured by adult education and enrolment at primary, secondary and tertiary levels) and having a decent standard of living (measured by purchasing power parity, PPP). HDI is developed to evaluate social and economic progress in different countries. However, there are some references that calculated HDI by different region or local governments of some Asian countries [
10,
11]. There was also evidence that showed a correlation between the HDI and consumption of energy and electricity [
12]. Therefore, the WG challenged to adopt HDI as the indicator to evaluate the endpoint social sustainability of biomass energy utilisation. The calculation of HDI can be described as in Equation (5) and
Table 1. Although the calculation of HDI has changed in the UNDP report published in 2010 [
13], in this paper, the WG’s calculation is based upon the previous report [
14].
Table 1.
Calculation of Human Development Index (HDI).
Table 1.
Calculation of Human Development Index (HDI).
| Index | Measure | Minimum Value | Maximum Value |
|---|
| Life expectancy | Life expectance at birth (LE)
LE index = (LE − LEmin)/(LEmax − LEmin) | 25 years | 85 years |
| Education | Education index = ALI × 2/3 + GEI × 1/3
Adult literacy index (ALI)
= (ALR − ALRmin)/(ALRmax − ALRmin)
where ALR: Adult literacy rate (%)
Gross enrolment index (GEI)
= (GER − GERmin)/(GERmax − GERmin)
where GER: Gross enrolment ratio (%) | 0% | 100% |
| GDP | GDP index
= {ln(GDP) − ln(GDPmin)}/{ln(GDPmax) − ln(GDPmin)}
where GDP: GDP (PPP) per capita (USD) | 100 USD | 40,000 USD |
2.4. Field-Testing the Applicability of the Sustainability Indicators for Biomass Energy
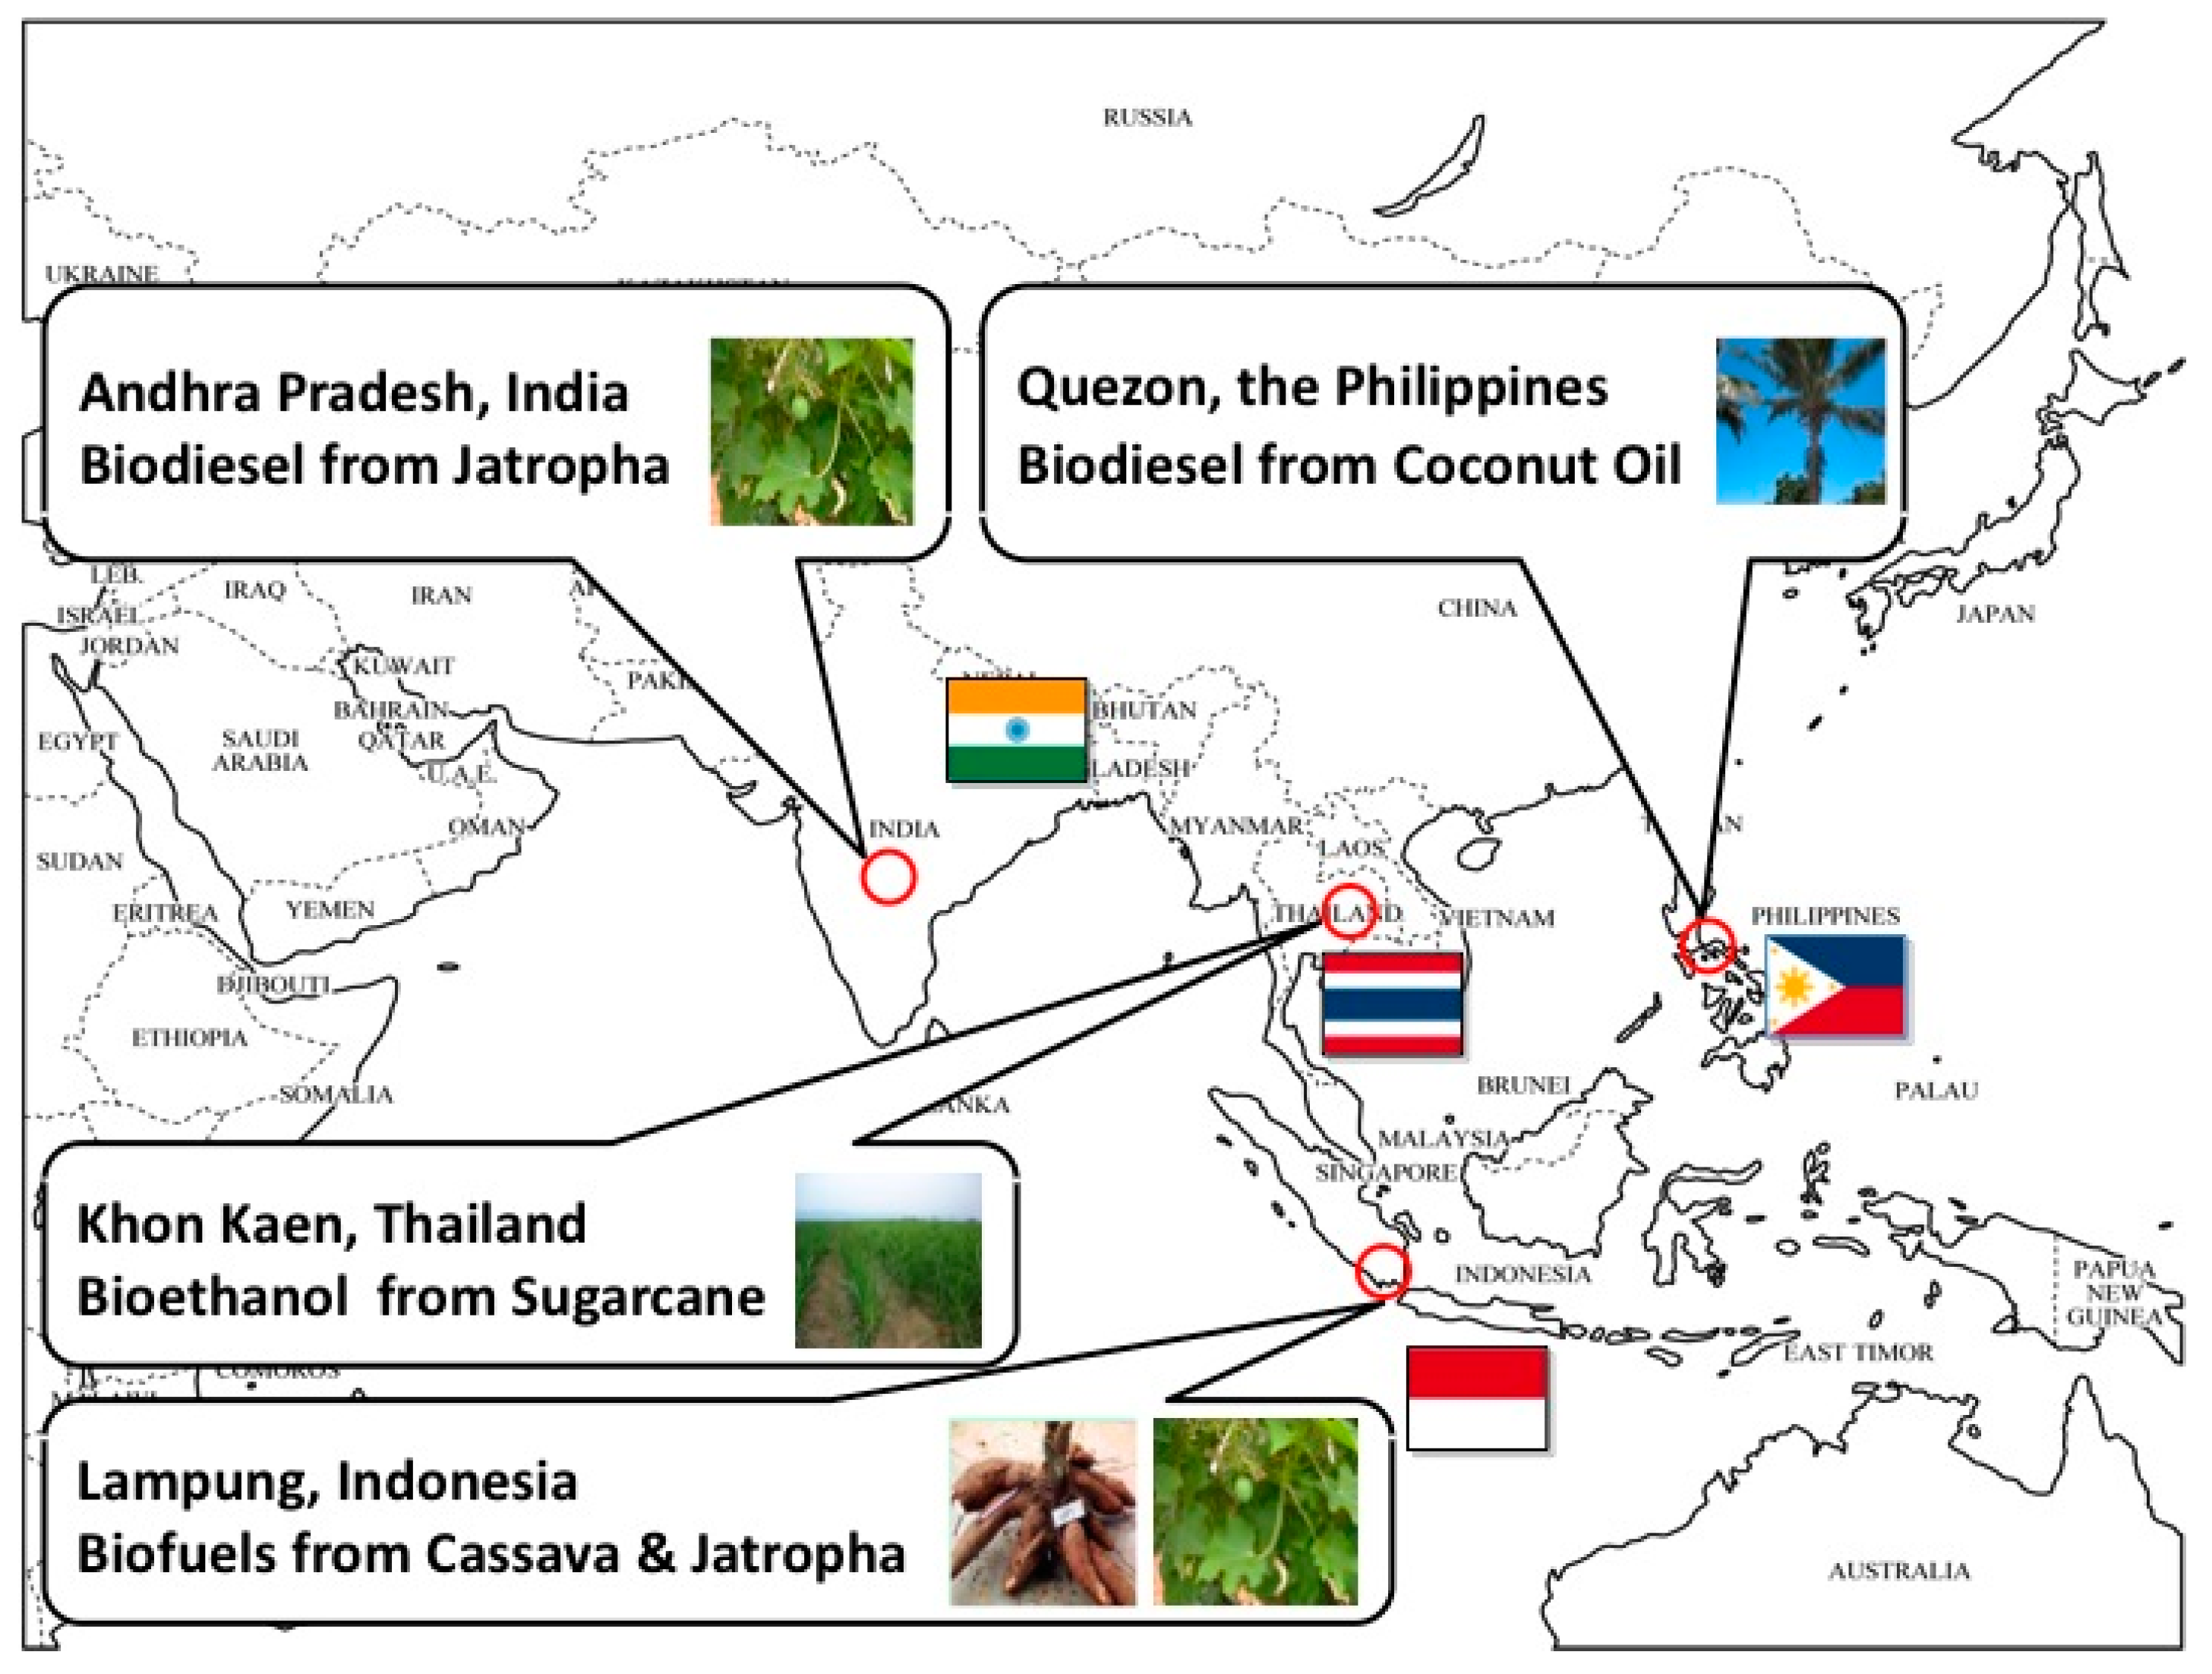
Four pilot studies were conducted in the selected East Asian countries during the year 2009–2010 to field-test the applicability of the indicators formulated for biomass energy sustainability. One case study was implemented in each country, namely, India (Andhra Pradesh), Indonesia (Lampung), the Philippines (Quezon) and Thailand (Khon Kaen), where the name within brackets represent the location of the case study in each country as shown in
Figure 1.
In each pilot study, more than a hundred datasets were obtained through actual site visits and personal interviews. Calculations based upon primary data collected from the pilot study sites, and secondary data from elsewhere were used to estimate the environmental, economic and social indicators of sustainability of biomass energy utilisation. The brief summaries of each pilot study are addressed in this subsection. More details can be found in the WG report [
6].
Figure 1.
Location of four pilot study sites with different feedstocks for biomass energy.
Figure 1.
Location of four pilot study sites with different feedstocks for biomass energy.
2.4.1. Pilot Study in Andhra Pradesh, India
For India, the economic assessment indicates that the cost incurred during the Jatropha cultivation stage is much higher than the revenue generated, which is not economically viable. At the biodiesel production stage, both total value added (TVA) and total net profit (TNP) are quite attractive, provided the raw material is available at a reasonable price. On the environmental front, companies expect some carbon saving and an additional revenue from carbon credits. GHG saving potential estimated during the process shows a net carbon saving of 2772 million t-CO2eq per year during the lifecycle of biodiesel production process. On the economic front, a TVA of 1674 USD and a net profit of 824 USD per hectare per year were estimated. On the social front, HDI at study site was 0.616, which showed 0.004 higher than HDI at Andhra Pradesh. This indicated several positive effects during various stages of biodiesel production, the main being employment generation for local people increasing their income, which could result in an overall improvement in their living standard.
2.4.2. Pilot Study in Lampung, Indonesia
It was observed that the cassava utilisation for ethanol in the Lampung Province is facing a competition for raw material from tapioca factories. Environmental assessment showed that during bioethanol production GHG emissions depended upon treatment of the biogas from wastewater; GHG emissions were 14.0, 88.9 and 12.7 kg-CO2 equivalent per GJ of bioethanol when biogas is flared, vented to the atmosphere and utilized for electricity generation, respectively. Economic assessment indicated that processing cassava for bioethanol increased the value added of cassava by about 0.103–0.120 USD per liter of bioethanol or about 0.0159–0.0186 USD per kg of cassava. In terms of social assessment, the HDI values for cassava farmers in the study region were 0.541, which became lower than the HDI of 0.694 for North Lampung. This was because of the low cassava price that affected to the farmer income and then to the GDP index of HDI calculation of the study region.
In case of Jatropha biodiesel, environmental assessment indicates that GHG emissions from Jatropha plantation and crude Jatropha oil processing accounted for 59% and 82% of the total emissions of 12.6 kg-CO2 equivalent per GJ of Jatropha oil respectively, whereas the waste utilisation from biogas production reduced the GHG emissions by 41% of total emissions. Although farmers in the target village received a very low benefit by cultivation due to the low selling price of Jatropha seeds, utilisation of Jatropha waste, namely Jatropha seed cake for biogas production for kitchen stoves and fertilizer production for farming, increased their earnings significantly. HDI estimates of 0.398 for the pilot study site, which is far lower than HDI of 0.694 in North Lampung, indicated indicate that quality of life, education, and income for the people in the village were quite low than average.
2.4.3. Pilot Study in Quezon, the Philippines
Environmental analysis of the Philippines study showed that the use of coconuts biodiesel to replace diesel resulted in GHG emissions reduction of 2824 kg-CO2 equivalent per ha per year. Economic analysis indicated that considering the production costs and revenues for each product, the net profit per unit of product is highest for copra production (at 0.150 USD per kg) and lowest for coconuts biodiesel production (at 0.0027 USD per liter). The cumulative total profit for all product forms is about 844 USD per ha and the TVA from the biodiesel industry in the province of Quezon was estimated to be around 305 million USD. In terms of social indicator, the calculated HDI is 0.785, which is higher than HDI of Quezon by 0.004; this indicated a higher level of social development than the average. In terms of living standard, the majority (66%) of coconut farmers perceived that there was an improvement in their living conditions due to coconut farming. In general, the results show that majority of the employees benefited from their respective employment in the biodiesel production chain.
2.4.4. Pilot Study in Khon Kaen, Thailand
The environmental assessment of the lifecycle of ethanol production in the Thailand study indicates that the overall GHG emissions associated with the ethanol production and consumption stages are slightly lower but not significantly different from that of gasoline. Increasing the utilisation of the materials produced during various unit processes in the biorefinery complex results in reducing the GHG emissions. The Economic assessment of the overall process of bioethanol production indicates that the TVA for the whole biorefinery complex amounts to about 116.1 million USD and it is economically viable. The social assessment indicates that the HDI of the sugarcane plantation, biorefinery complex and Khon Kaen were 0.736, 0.797 and 0.763, respectively. Although sugarcane farmers have a lower social development than an average person in Khon Kaen or employee at the biorefinery complex, they still benefit from a steady income as a result of the contract farming, which links them to the sugar mill and guarantees an annual income. Employees at the biorefinery have a higher social development (shown by a positive change of 0.034 in HDI) as compared to the Khon Kaen.
2.5. Lessons Learnt from the Field-Testing the Biomass Energy Sustainability Indicators
The field-testing of the indicators to assess sustainability of biomass energy in selected East Asian countries revealed that they could quantify the sustainability of biomass energy projects. Some of the lessons learnt from the pilot studies were noticeable or common in all countries. However, the WG recognized that some minor location-specific modifications might be required when applying this methodology to biomass energy projects in other East Asian countries. The summary of lessons learnt from the pilot studies and suggestions for minor modifications in the WG methodology are addressed as follows for each pillar of sustainability.
The WG recognizes that one of the important roles of utilizing biomass energy is to improve the environment in terms of GHG emissions. The LCA is a well-established, standard technique for quantifying GHG emissions during the life cycle of a product or process. Although the WG was aware of the importance of the GHG emissions attributed to land use change (LUC) from the beginning of the WG activities [
3], it had been excluded from the system boundary of the life cycle emissions. This was because the WG observed that there were very few LUC models when we identified and field-tested the sustainability indicators for biomass energy until 2010, which posed a big challenge for countries in East Asia to obtain information/data and calculate losses of carbon stock from land clearance. However, a comparison of data from literature indicated that GHG emissions from LUC (from land with high carbon stocks) could be a significant factor in determining the sustainability of biomass utilisation for energy. Therefore, for a complete sustainability assessment of biomass cultivation and utilisation, it is essential to consider the environmental impacts pertaining to any loss of carbon stock from LUC. The WG also recognized that the environmental impacts caused by biomass energy utilisation are not merely restricted to climate change induced by GHG emissions. The other candidate environmental impact categories that should be evaluated are—impacts on air, water and soil quality; water use/efficiency of water use; biodiversity; issues associated with LUC; abiotic resources depletion; eutrophication and acidification. These impact categories can also be quantified by LCA, according to the environmental concerns of the sites where biomass utilisation initiatives are planned or already implemented.
The economic indicators in most of the pilot studies showed a positive result and signified that the biomass energy projects undertaken were economically viable. However, the economic viability will also depend on the level at which the results of economic analysis are applied. For example, the three components of the TVA are appropriate economic indicators for the business and community levels; total net profit (TNP) is more business related; wages derived from employment benefit the laborers; and, tax revenue generated is contributed to the local and national governments. Thus, neither a high TNP alone nor the high wages of the employees or the high tax paid to the government will ensure the economic viability of production. The economic sustainability of biomass energy utilisation will be attractive only when all the components of TVA, namely, TNP, wages and tax generation, have a positive impact.
The lessons learnt for establishing HDI as social indicator showed that HDI calculation is a highly data-intensive process, requiring inputs on a variety of parameters. These data are not available for small-scale biomass initiatives. In addition, it is difficult to isolate the effects attributed to biomass energy initiatives from those of other activities implemented at the community level to improve people’s quality of life. Because HDI was originally developed to measure average achievements in relation to key dimensions of human development (a long and healthy life, being knowledgeable, and having a decent standard of living) at national levels, the WG considered direct or midpoint impact measures that are triggers for the key dimensions of human development, as suitable measures for evaluating social impacts at the community level such as employment opportunity; secured income; increase in personal income; better education; improved health conditions; improved inter-personal relationships within the community; and, easier access to modern and clean energy.
3. Reviews on International Frameworks on Biomass Energy Sustainability
In order to check the relevance of the WG’s sustainability indicators with the other sustainability assessments, the WG reviewed some academic papers on sustainability assessments [
15,
16,
17] and other initiatives working to develop sustainability criteria and indicators for biomass energy and their feedstocks [
1] in 2010. Taking into the nature of the WG to develop sustainability assessment methodology for biomass energy under the request from East Asian Summit, however, the WG decided to put priority on the two international frameworks, namely the Roundtable on Sustainable Biofuels and the Global Bioenergy Partnership, to discuss biomass energy sustainability that have already field-tested or announced to field-test the indicators to seek the way forward of the WG’s indicators modifications. The prominent features of the two initiatives reviewed are summarized as follows.
The Roundtable on Sustainable Biomaterials (RSB), a multi-stakeholder initiative, was originally established in 2007 to ensure the sustainability of biofuels and has expanded in 2013 to cover biomaterials to offer a sustainability standard for certifying biomass feedstock. In August 2008, the RSB released its first draft of a generic standard for sustainable biofuels production. After the consultations for their “Version Zero” draft until April 2009, they released their “Version One” of international standard for better biofuel production and processing. In 2010, “Version One” was pilot tested in biofuel supply, namely in Germany, South Africa, Australia, Brazil, Guatemala and Peru, to identify areas in need of further refinement. Based upon this feedback and further consultation, the RSB approved “Version Two” in November 2010 [
18]. The RSB standard has now become a fully operational biofuel certification standard, which includes principles and criteria, an associated guidance document, detailed compliance indicators and the glossary of terms. The RSB standard is built around the following twelve principles: (1) legality; (2) planning, monitoring and continuous improvement; (3) GHG emissions; (4) human and labor rights; (5) rural and social development; (6) local food security; (7) conservation; (8) soil; (9) water; (10) air; (11) use of technology, inputs, and management of waste; and (12) land rights.
The Global Bioenergy Partnership (GBEP), a forum where national governments, international organizations and other partners seek to facilitate effective policy frameworks and suggest rules and tools to promote sustainable biomass energy development through voluntary cooperation, has been working to develop a set of relevant, practical, science-based voluntary sustainability criteria and indicators under the Task Force on Sustainability since 2008. The criteria and indicators are intended to guide any analysis undertaken of biomass energy at the domestic level with a view to informing decision-making and facilitating the sustainable development of biomass energy in a manner consistent with multilateral trade obligations. In May 2011, the GBEP Steering Committee endorsed a set of sustainability indicators for bioenergy defined by the Task Force [
19]. As shown in
Table 2, a total of twenty-four indicators have been set out under the three pillars of sustainability (environmental, social and economic) and each sub-set of eight indicators is given under its respective pillar. In order to evaluate the feasibility and enhance the practicality as a tool for policymaking, the GBEP indicators were tested in Columbia [
20], Indonesia [
20], Germany [
21], Ghana [
22], Japan [
23] and the Netherlands [
24] and currently are tested in other countries as well.
Table 2.
Global Bioenergy Partnership (GBEP) sustainability indicators for bioenergy [
19].
Table 2.
Global Bioenergy Partnership (GBEP) sustainability indicators for bioenergy [19].
| Environmental Pillar | Social Pillar | Economic Pillar |
|---|
| 1. Life-cycle GHG emissions | 9. Allocation and tenure of land for new bioenergy production | 17. Productivity |
| 2. Soil quality | 10. Price and supply of a national food basket | 18. Net energy balance |
| 3. Harvest levels of wood resources | 11. Change in income | 19. Gross value added |
| 4. Emissions of non-GHG air pollutants, including air toxics | 12. Jobs in the bioenergy sector | 20. Change in consumption of fossil fuels and traditional use of biomass |
| 5. Water use and efficiency | 13. Change in unpaid time spent by women and children collecting biomass | 21. Training and re-qualification of the workforce |
| 6. Water quality | 14. Bioenergy used to expand access to modern energy services | 22. Energy diversity |
| 7. Biological diversity in the landscape | 15. Change in mortality and burden of disease attributable to indoor smoke | 23. Infrastructure and logistics for distribution of bioenergy |
| 8. Land use and land-use change related to bioenergy feedstock production | 16. Incidence of occupational injury, illness and fatalities | 24. Capacity and flexibility of use of bioenergy |
4. Formulation of Sustainability Indicators for Biomass Utilisation
From the year 2011 to 2013, the WG formulated the sustainability indicators for biomass utilisation not only as energy but also as materials by reflecting the lessons learnt from the field-testing of the biomass energy sustainability indicators and the discussions made in RSB and GBEP for establishing their standard and indicators.
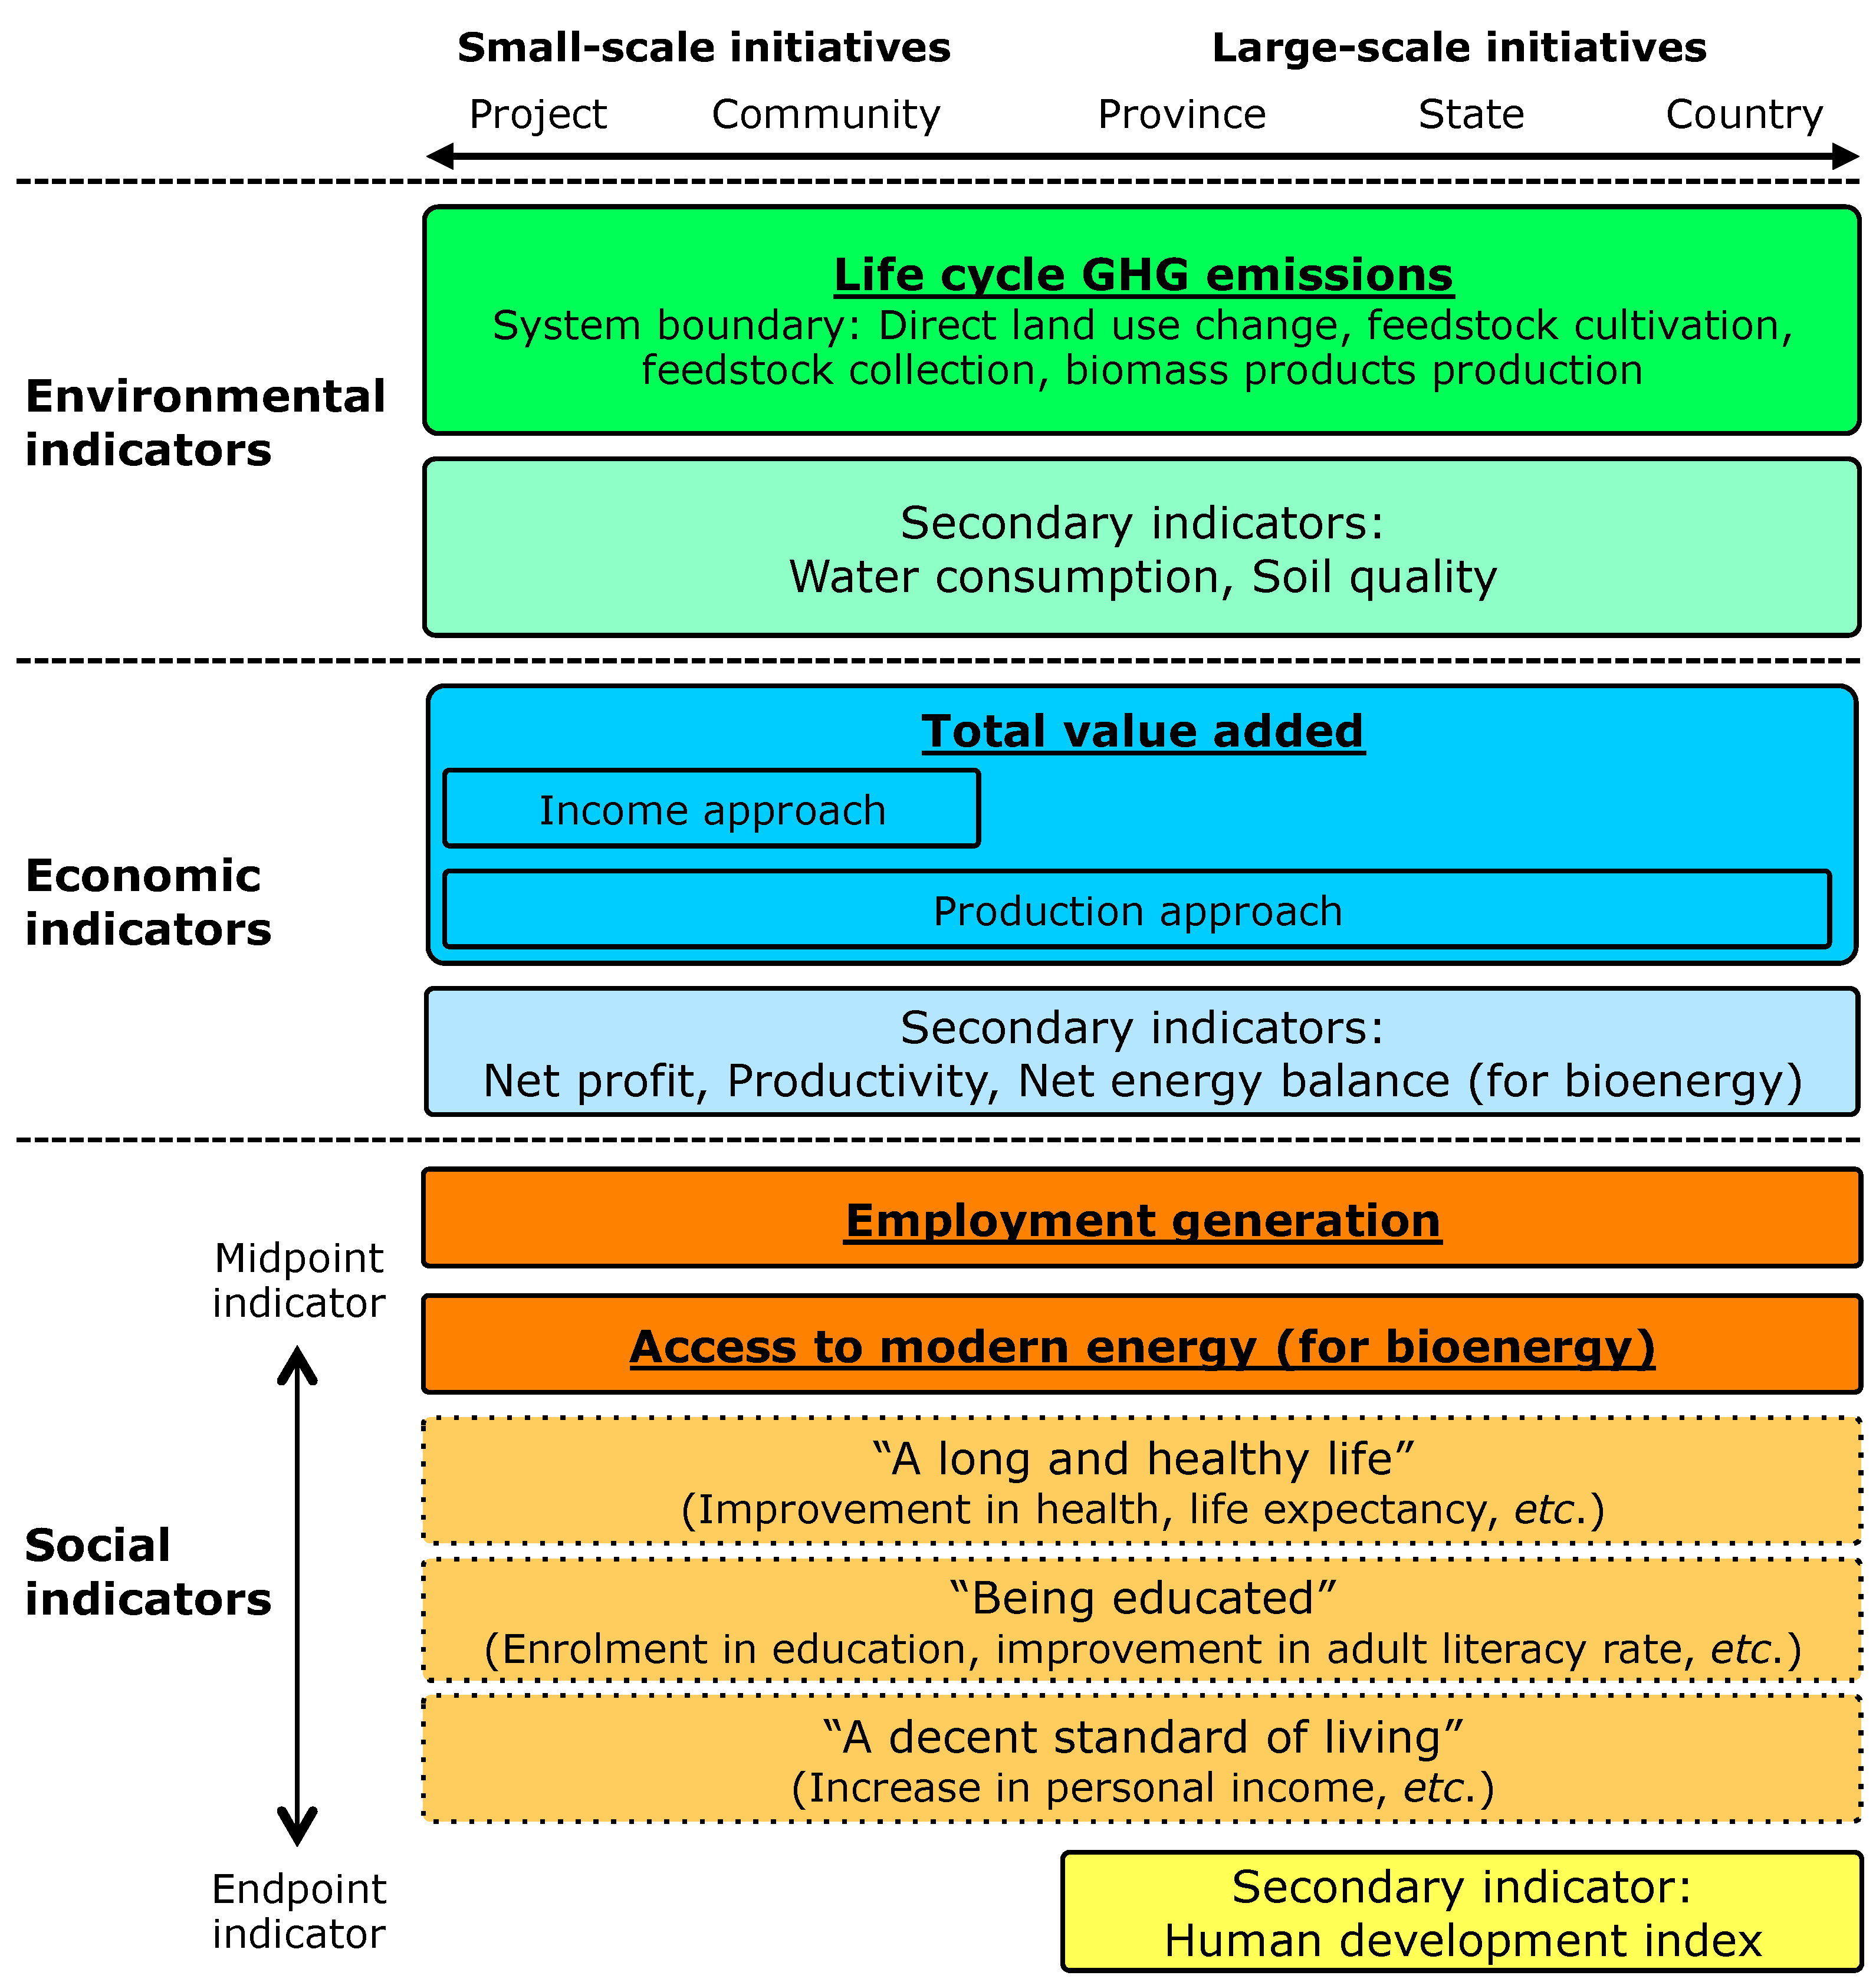
Figure 2 shows the set of main and secondary indicators selected by the WG, based on our expertise, to evaluate the sustainability of biomass utilisation initiatives implemented at different levels (large- and small-scale) in East Asia. The following subsections discuss the rationale for selecting indicators for biomass utilisation.
Figure 2.
Set of main and secondary indicators of sustainability at different levels.
Figure 2.
Set of main and secondary indicators of sustainability at different levels.
4.1. Environmental Indicators
Amongst the candidate environmental impact categories the WG were aware of, we selected life cycle GHG emissions as the main indicator and water consumption and soil quality as secondary indicators that are listed in the GBEP indicators as well.
Here we would like to specifically refer to the reason for not selecting biodiversity as one of the indicator. Biodiversity has become one of the main ecological problems [
25] and has been included as the environmental indicator of GBEP as well. However, we did not selected specifically as an indicator due to its complexity of accounting and dynamic seasonal variations as compared to the other indicators where measurements and analysis to produce the necessary data can be carried out within practical limits. Biodiversity loss or gain (when arid waste land is converted to agriculture land) in terms of affected species per standard area is also not easy to relate to functional unit of the LCA. Background data of species richness before LUC are not readily available. Hence, although an important impact related to LUC biodiversity loss/gain could not be included as one of the environmental indicators of sustainability at the current stage. It will be considered when data and the accounting methodology are more widely available.
4.1.1. Life Cycle GHG Emissions as the Main Indicator
The results of the field-testing the life cycle GHG emissions to evaluate sustainability of biomass energy initiatives in four selected countries proved that LCA was a well-established, standard technique for quantifying GHG. Life cycle GHG emissions as environmental indicator were applicable for both small- and large-scale biomass utilisation initiatives and this indicator was included both in RSB and GBEP; therefore the WG decided to adopt this indicator as main environmental indicator for biomass utilisation.
Here we focus on emissions attributed to land use change (LUC) that were not included within the system boundary of the WG’s environmental indicator for biomass energy sustainability. LUCs caused by biomass utilisation can be categorized into direct and indirect effects. Direct LUC (dLUC) occurs in a site or plantation when previously unused areas (e.g., forest) are used to satisfy additional feedstock demands [
26] for biomass resources. Indirect LUC (iLUC) comprises “leakage” effects, that is, displacement of a previous land use type (e.g., arable and pasture land use) to another location where dLUC may occur. LUC can have both positive and negative consequences on biodiversity, carbon stocks, livelihoods, GHG balance, and competition between land uses for food, feed, fuel, and/or fiber production. Moreover, land conversion from one use to another by producers and farmers can be motivated by market forces. When biomass utilisation expands in relation to the market and production, the occurrence of
in situ dLUC is associated with commercial decisions that pertain to a specific supply chain for a specific product. For example, if a field used to grow cassava is converted to an oil palm plantation, iLUC occurs when another land area changes as a consequence of this direct change.
As some studies and reports have indicated, dLUC emissions have a significant impact on LCGHG emissions from biomass utilisation. These emissions greatly depend on what the previous land use was prior to biomass feedstock cultivation. There are even cases of conversion of land with high carbon stocks into croplands for biomass feedstock where the dLUC emissions alone may possibly be larger than the LCGHG emissions associated with fossil-based energy. In formulating a methodology to quantify these emissions, many initiatives aimed at achieving biomass sustainability have referred to the 2006 Intergovernmental Panel on Climate Change (IPCC) Guidelines [
27]. Although these guidelines were specifically formulated for compiling a National Greenhouse Gas Inventory Report, they are a preferred reference because of their wide usage and applicability to analyses of LCGHG emissions from biomass utilisation. The Tier 1 methodology, described in the IPCC guidelines, provides default values and methods for estimating carbon stocks for various land use types. Without directly measuring carbon stock in biomass and soil, dLUC emissions and default values associated with a particular kind of uncertainty can be computed using this method [
28].
Although several approaches have been developed to identify and quantify the effects of iLUC and GHG emissions [
28,
29,
30,
31], iLUC is still a controversial topic because of the implications of an increased demand for biomass resources. Moreover, quantifying iLUC effects is difficult and has been extensively debated. Therefore, iLUC has not been included in the system boundary of the main indicator. However, in the future, if calculation models become well established with sufficient scientific evidence available, it should be included.
4.1.2. Water Consumption as a Secondary Indicator
The basic production system comprises three main phases for utilizing biomass as feedstock for energy and materials. These are feedstock cultivation, feedstock pre-processing, and bioenergy or biomaterials conversion.
Water is required during the feedstock cultivation and growth phase not only for the crop, but also for land preparation up to harvesting time. To obtain suitable forms of biomass feedstock for various conversion technologies, pre-processing is required for some types of feedstock such as oil palm, Jatropha, sugarcane, and cassava. Considering its usage in feedstock pre-processing and bioproducts conversion, water is required to support some of the main processes such as milling, mixing, and fermenting. Moreover water is also used for subprocesses or supporting process like cleaning and washing, and is essential for steaming and during all phases, either as an integrated part of a process line or as a separate unit [
32,
33,
34]. Consequently, to account for water consumption in biomass utilisation, all water-related activities and processes should be included.
More water is used to produce biomass from the cultivation of agricultural crops than for processing bioenergy and biomaterials. Therefore, the expansion of cultivated feedstock areas creates an additional demand for accessible water resources and irrigation systems. In addition, seasonal variation, geographic conditions, traditional agricultural practices, and crop cultivation technologies all affect the quantity of water required for cultivation [
35,
36,
37,
38].
Several studies have assessed water uses associated with biomass utilisation, and especially biofuels feedstock production. Some studies have only applied water footprints (e.g., [
39,
40,
41,
42]), while others have only used the LCA approach (e.g., [
43]). There are also studies that have combined the water footprint and LCA approaches at different spatial scales (e.g., [
44,
45]).
There are a number of methods for assessing water consumption during biomass utilisation. The most prominent and well developed approaches are: the virtual water footprint approach, formulated by the water footprint network, the life cycle assessment approach (midpoint and endpoint characterization) developed by the UNEP/SETAC Life Cycle Initiative [
46] and ISO 14046 [
47].
Each of the first two approaches yields informative results based on the application of a specific methodology. The water footprint method provides more meaningful results than LCA in relation to water resources management. On the other hand, LCA is more suitable than water footprints for tracing impact pathways through cause and effect relationships [
48]. Consequently, these two approaches can be simultaneously applied for assessing water consumption associated with biomass utilisation, even though they differ in their definitions of water use and in their impact assessments.
To combine these methods, a water footprint is applied at the data collection or data inventory level and LCA is conducted at the impact assessment level [
45,
49,
50]. A water footprint is applied to reflect competitive demands for water relating to agricultural production for food feed, fiber, and fuel or to indicate the type of water (green or blue), and its use, that each area or country depends on. Subsequently, LCA is conducted to quantitatively evaluate water use in relation to water scarcity. Ridoutt and Pfister [
51] recommend combining the water footprint and LCA methods using a regional water stress index as a characterization factor, as suggested by Kounina
et al. [
52]. Both methods entail a number of significant variables such as geography, agricultural practices, meteorology, economics, and demographics that influence the relationship between water demand and supply, as do variations in collected data [
38], It is, therefore, recommended that water assessment be conducted at a local level or for a natural geographical unit, such as a watershed, rather than at a larger scale. Alternative outcomes resulting from the expansion of feedstock cultivation can be obtained through a scenario analysis.
4.1.3. Soil Quality as a Secondary Indicator
The sustainable use of soil resources depends on three factors: soil characteristics, related environmental conditions (e.g., climate and hydrology), and land use. These factors interact with each other according to a systems-based principle where a change in one factor causes alterations in the others. Therefore, sustainable use of soil resources entails a dynamic process. Consequently, soil resources should be assessed from this standpoint and soil should be considered as the primary object of sustainable use in relation to land management under given (changing) natural conditions.
Accelerated use of biomass feedstocks could have several negative impacts on the soil environment. Soil is an essential determinant of the productive capacity of the land. In many cases, biomass production based on poor agricultural practices has led to a decline in the productive capacity of the land. Climatic factors and their interaction with poor agricultural practices can cause soil quality degradation and lower the productive capacity of the land. Appropriate agricultural and soil management practices can help to maintain or improve soil quality, thereby having a positive effect on the productive capacity of the land. Soil quality is one of the keys for achieving sustainability of bioenergy feedstock production, and soil quality could be considered an additional indicator or secondary indicator on the environmental pillar.
The WG acknowledges that, as a well-established main indicator and a standard technique for quantifying GHG emissions, LCGHG plays an important role in assessments of biomass utilisation for improving the quality of the environment. However, the WG also recognizes that climate change induced by GHG emissions is not the only environmental impact associated with biomass utilisation. The merits of producing any bioproduct should be assessed along with some crucial indicators of sustainability and environmental concerns. Based on this recognition, the WG views soil quality as another environmental impact category and an important indicator of sustainability.
Evaluating soil quality and sustainability is a fundamental bridging area between the utilisation and protection aspects of soil-use planning. A sustainability analysis of soil use can be performed for any individual soil function or for groups of soil functions in a defined land use systems, considering the potential effects of degradation [
53]. Outcomes of soil degradation processes include the decline of soil fertility, carbon, and biodiversity; lower water retention capacity; disruption of gas and nutrient cycles; and reduced degradation of contaminants. Soil degradation has a direct impact on environmental quality, preventing the soil from performing services at the required levels that benefit ecosystems and society. These services include: biomass production; storing, filtering, and transforming nutrients, substances, and water; maintaining biodiversity pools such as habitats, species and genes; providing sources of raw materials; and acting as a carbon pool.
Maintenance of soil fertility is the first condition of any permanent system of agriculture and biomass production. Soil quality also informs GHG emissions, because changes in soil quality can reveal changes in land productivity and consumption of certain chemical fertilizers.
Soil quality can be estimated by observing or measuring several different properties or processes. Soil quality indicators include measurable physical, chemical, and biological properties, processes, and characteristics for monitoring changes in the soil. However, explanations of soil quality using a single index are very complex. Organic carbon content of soil, productive capacity of the land, and good agricultural practices can be used as sustainability indicators for biomass feedstock production. The structure of the microbial community in a soil, reflected in the characteristics of that soil such as fertility, biodiversity, and the soil’s physical condition, are closely correlated with organic carbon content. Measuring organic carbon content can also be promoted as a more representative indicator of soil quality than the above characteristics, but requires further refining of its methodology and the interpretation of results.
4.2. Economic Indicators
4.2.1. Total Value Added as the Main Indicator
The lessons learnt from the field-testing of the biomass energy sustainability revealed that TVA as economic indicator was applicable for any biomass initiative.
TVA that can be calculated using equations (1–4) follows the income approach of measuring GDP. This is applicable when all the components of TVA, namely, total net profit (TNP), personal remuneration and tax revenue, are available for the target biomass utilisation initiative. As in national accounts, TVA can also be calculated by the following equation.
where gross revenue is simply the product of price and quantity (applicable to both main products and byproducts). Intermediates include goods and services, other than fixed assets, that are produced elsewhere in the economy, or imported, and used as inputs into the biomass production process. It should be noted that land, labor, and capital are primary inputs and are not included among intermediates. This is equivalent to measuring the GDP using the production approach. TVA using production approach is applicable for large-scale biomass utilisation initiatives where the detailed data for using income approach are not available.
4.2.2. Total Net Profit as a Secondary Indicator
Total net profit (TNP) is the sum of the net profit generated as a result of conversion or processing of the main product and byproducts. To determine the TNP, total production costs are deducted from the returns or revenue gained from the enterprise. Enterprise returns include revenue from sales of the primary output and byproducts. Total costs, on the other hand, include the values of all inputs used in the production process such as purchasing costs of biomass, processing costs, and costs of electricity and other inputs such as chemicals. In addition to the value of intermediate inputs, other costs items such as labor costs, including wages and salaries, as well as the various taxes and duties charged for the production process are also included.
As shown in equation (4), TNP is a component of TVA; however it is selected as a secondary indicator for economic sustainability. The reason behind this is that TVA shows the overall economic benefits of a target biomass utilisation initiative which include the economic benefit of the investors measured in terms of TNP, economic benefit of laborers measured in terms of wages and economic benefit of governments measured in terms of tax revenue. For a biomass utilisation initiative to become economic sustainable, it must be financially beneficial to investors to sustain its operation, which is measured by TNP.
The TNP is calculated for a given operating or production cycle. Considering the entire project life in the long run, investment returns of the stakeholders can be determined using the following financial tools: net present value (NPV), benefit-cost ratio (BCR), and internal rate of return (IRR). The NPV is the difference between the present value of the benefits and the present value of the costs, while BCR is computed as the ratio of the present value of benefits to the present value of costs. The IRR is the discount rate that enables the present value of benefits to be equal to the present value of costs.
4.2.3. Productivity as a Secondary Indicator
Productivity is an average measure of production efficiency. It is a ratio of production output to production requirements (e.g., inputs of capital, labor, land, energy, and materials). The measure of productivity is defined as the total output per one unit of a total input.
The indicator applies to biomass feedstock production for all bioproduct pathways. An increase in productivity resulting in more efficient use of all inputs, including land and other resources, would mean a reduction in the quantities of all inputs, resulting in increased profits and a reduced burden on the environment.
Productivity during the stage of feedstock production is referred to as land productivity. This can be measured in terms of the quantity of feedstock (either in volume or mass) produced per hectare of land and expressed in tons per hectare per year. A higher ratio of feedstock per hectare means higher land productivity. It can also be measured as the ratio of the total production cost to the total quantity of feedstock produced per hectare of land per year.
Productivity during the processing of feedstock into bioproducts depends on the efficiency of production and/or distribution processes. There are several ways of measuring productivity during processing operations. It can be expressed in terms of volume or amounts of bioenergy per metric ton of feedstock, or as the production cost per unit of bioenergy or of the bioproducts produced.
The overall measure of productivity in the production of bioproducts can be expressed in terms of the volume or amount of bioproducts generated per hectare per year, or as the annual costs incurred for the production of bioproducts in one hectare.
Productivity derived from the production of biomass feedstock and/or processing of feedstock into bioproducts is another indicator of long-term economic sustainability.
4.2.4. Net Energy Balance as a Secondary Indicator for Bioenergy
A net energy balance is described as an energy ratio of the bioenergy value chain compared with that of other energy sources, including energy ratios of feedstock production, processing of feedstock into bioenergy, bioenergy use. It is generally expressed in terms of the ratio of energy outputs to total energy inputs for all stages of bioenergy production. A positive net energy balance implies that the energy that can be derived from the bioenergy production is more than what is required to produce that energy. Efficient production of bioenergy results in a higher net energy balance, thus leading to energy savings. A large volume of energy savings may improve energy security. Energy inputs may also be in the form of fossil fuels or renewable energy. If the energy input is from fossil fuels, a higher net energy balance will reduce fossil fuel consumption, thereby reducing dependence on fossil fuels.
A net energy balance would be better expressed in terms of the difference between the energy content of bioenergy and the total energy inputs deployed in the production of feedstock and in its processing into bioenergy.
A positive net energy balance makes for sustainable bioenergy production as it entails a greater energy output than the amount of energy used in the process. If bioenergy is produced in large quantities, this could enhance a country’s energy security.
4.3. Social Indicators
The lessons learnt from the field-testing of the biomass energy sustainability proved that although HDI could be used as social indicator to evaluate social sustainability at endpoints, it might be only applicable for large-scale biomass utilisation initiatives because of the data unavailability at community level. To quantify the social impact by biomass utilisation, it was deemed that the direct or midpoint social indicators that should trigger the key dimension of human development should be relevant.
In order to identify relevant midpoint social indicators for evaluating sustainability of biomass utilisation initiatives in East Asia, the WG investigated the applicability of the GBEP’s sustainability indicators for social pillar based on our experiences for conducting four pilot studies.
Table 3 shows the relevance of the GBEP’s social sustainability indicators to social factors observed in the pilot studies. Remarks on applicability to East Asian context in terms of quantification or observability were based on first hand experiences after conducting the pilot studies. Based on these observations, the WG selected employment generation and access to modern energy (only for bioenergy) as main social indicators for biomass utilisation sustainability. Relevance of selecting these indicators were also confirmed from the testing results of GBEP indicators that the indicator “12. Jobs in the bioenergy sector” were regarded relevant in all the tested countries [
20,
21,
22,
23,
24] and the relevance of the indicator “14. Bioenergy used to expand access to modern energy service” was observed in Ghana case [
22].
Table 3.
Relevance of Global Bioenergy Partnership (GBEP) social indicators in East Asian Context.
Table 3.
Relevance of Global Bioenergy Partnership (GBEP) social indicators in East Asian Context.
| Social Indicators | Description | Relevance in East Asian Context |
|---|
| 9. Allocation and tenure of land for new bioenergy production | Percentage of land—total and by land-use type—used for new bioenergy production where:
A legal instrument or domestic authority establishes title and procedures for change of title; and The current domestic legal system and/or socially accepted practices provide due process and the established procedures are followed for determining legal title
| Not observed in the pilot studies |
| 10. Price and supply of a national food basket | Effects of bioenergy use and domestic production on the price and supply of a food basket, which is nationally defined collection of representative foodstuffs, including main staple crops, measured at the national, regional, and/or household level, taking into consideration:
Changes in demand for foodstuffs for food, feed, and fibre Changes in the import and export of foodstuffs Changes in agricultural production due to weather conditions Changes in agricultural costs from petroleum and other energy prices The impact of price volatility and price inflation of foodstuffs on the national, regional, and/or household welfare level, as nationally-determined
| Changes in demand and supply of foodstuffs used as biofuel feedstocks could be observed; data may also be available but were not collected in the pilot studies |
| 11. Change in income | Contribution of the following to change in income due to bioenergy production:
Wages paid for employment in the bioenergy sector in relation to comparable sectors Net income from the sale, barter and/or own-consumption of bioenergy products, including feedstocks, by self-employed households/individuals
| Observable, though should check the correlation between the personal remuneration which is a component of TVA |
| 12. Jobs in the bioenergy sector | Net job creation as a result of bioenergy production and use, total and disaggregated (if possible) as follows: Skilled/unskilled Temporary/indefinite Total number of jobs in the bioenergy sector and percentage adhering to nationally recognized labour standards consistent with the principles enumerated in the ILO Declaration on Fundamental Principles and Rights at Work, in relation to comparable sectors
| Observable but problems of double counting could happen especially that biofuel production entails a lot of existing independent activities from growing of the crops to processing May not create new jobs in case of farmers or other skilled workers in processing plants but could enhance ‘market reliability’ as biofuel industry could be an additional market for farmers to sell their produce or enhance ‘job security’ for processing employees
|
| 13. Change in unpaid time spent by women and children collecting biomass | Change in average unpaid time spent by women and children collecting biomass as a result of switching from traditional use of biomass to modern bioenergy services | Observable though not critical in pilot cases; collection of firewood were done in their own farms (e.g. fallen leaves of coconut trees) and somewhat integrated to farmer’s activities |
| 14. Bioenergy used to expand access to modern energy services | Total amount and percentage of increased access to modern energy services gained through modern bioenergy (disaggregated by bioenergy type), measured in terms of energy and numbers of households and businesses Total number and percentage of households and businesses using bioenergy, disaggregated into modern bioenergy and traditional use of biomass
| Observable except for some cases (some farmers in the pilot studies were not able to use the end bioenergy product coming from their feedstocks) Impact could be as effect of additional income from engaging in biofuel production, they could afford to shift to avail modern energy services
|
| 15. Change in mortality and burden of disease attributable to indoor smoke | Change in mortality and burden of disease attributable to indoor smoke from sold fuel use, and change in these as a result on the increased deployment of modern bioenergy services, including improved biomass-based cookstoves | From the survey conducted in Jatropha pilot study site in Indonesia, it was difficult to establish the impact of indoor smoke to overall health (especially in cases where smoking inside the house for adult males were common) Farm houses in East Asia generally have kitchen windows or use light materials as wall so indoor smoke from cooking escapes though leaving black soot in the wall and cooking utensils
|
| 16. Incidence of occupational injury, illness and fatalities | Incidences of occupational injury, illness and fatalities in the production of bioenergy in relation to comparable sectors | Observable |
4.3.1. Employment Generation as a Main Indicator
Biomass production and its utilisation are labor-intensive processes that could create both primary employment and supplemental incomes in rural areas. For example, farmers could deliberately grow and sell biomass and farm residues to generate revenue. Employment is generated in the processing of biomass and at the conversion facilities for bioproducts. Indirectly, other rural enterprises can also benefit from biomass feedstock production. These enterprises include providers of agricultural inputs such as fertilizers, suppliers of farm equipment, transporters, and marketers of daily use consumer items and other goods.
However, utilisation of some bioproducts may also create problems on the employment front. For example, coconut coir, which is a raw material in the coir industry, is a commonly used form of biomass in India. If coconut husks and coir were diverted for biomass power generation, this would adversely affect the labor-intensive coir industry, posing a threat to its workers. Hence, care should be taken to assess the net employment generated from alternate uses of bioproducts.
Employment is calculated as the ratio of employed individuals to the total labor force of the economy. Children and dependents within the population are not considered to be part of the labor force. The concept of under-employment, implying employment of a person below his/her capacity, is also used in some literatures. For example, if an individual can only find paid work for two hours a day, despite wishing and being able to work for more than eight hours a day, he or is she is considered to be underemployed. However, this individual is still considered to be employed.
Measuring the total labor force and the employed labor force within an economy is complex, and may be country-specific and based on several other factors. Rather than expressing the absolute number of persons employed, the WG recommends calculating the rate of people employed at various stages of the bioproducts supply chain. Using the above definition of employment, quantification of employment in the bioproduct chain can be expressed as follows.
where NPEB denotes the number of people employed in a bioproduct chain and TLF denotes the total labor force of the village/community.
4.3.2. Access to Modern Energy as a Main Bioenergy Indicator for Bioenergy
Modern energy services are crucial for human well-being and for a country's sustainable development [
54,
55]. Energy services refer to the services that energy and energy appliances provide. They include lighting, heating for cooking and warmth, power for transport, water pumping, grinding, and numerous other services that are made possible by fuels, electricity, and mechanical power.
Bioenergy development in rural areas is expected to provide access to modern forms of energy such as electricity, cooking and heating fuel, or for mechanical power to improve productivity. Enhanced access to energy is also expected to influence, if not improve, other socioeconomic conditions such as education, health, income, and the environment within communities [
56].
Global initiatives such as those aimed at providing universal access to modern forms of energy by 2030 require coordinated efforts among local, national, and international players and tracking to measure and report on their progress. Robust measurement processes and reporting mechanisms will contribute to: improving availability of information about the range and impacts of actions that countries are taking to increase access to energy; helping countries clearly delineate and monitor actions they can take to meet their agreed target; increasing awareness among countries of policy options and best practice; and enhancing the effectiveness of implementation of such policies at national and local levels, and the credibility of all countries’ efforts [
57]. Moreover, availability of statistical data and of clear descriptions of energy services are necessary preconditions for successful rural energy access policies [
58]. Measurement of energy access is envisaged on a per project basis.
Clean and modern forms of energy that can be generated from biomass are liquid biofuels, heat, electricity, and gas. In many East Asian countries, generation of biogas through anaerobic biomass digestion is a relatively old phenomenon, and has been practiced in rural areas since the early seventies. However, only a few companies have historically generated heat and electricity through thermal gasification of biomass. The use of energy, generated this way, by the general public is thus comparatively new. Access to modern energy services is defined as households’ access to electricity and clean cooking facilities. Modern bioenergy services that are provided through biomass utilisation include clean cooking fuels and stoves, advanced biomass cook stoves and biogas systems, and bio-power.
The WG has proposed the following calculation for quantifying access to modern energy forms:
where NHME denotes the number of households with access to modern energy and TNHH is the total number of households in the village/community.
The proportion of households in relation to the total population using modern energy services is expressed as the ratio of the population (number of households) accessing modern energy services. Individuals using traditional biomass energy sources are not counted within the population with access to modern energy services.
While the proposed methodology appears simple and straightforward, complexities can arise when it is applied on the ground. For example, the biomass produced may not necessarily be used locally. Tracing its utilisation and impacts may, therefore, be difficult. The use of alternative indicators such as land productivity, in terms of the amount of biofuels produced per unit of land, is recommended based on the assumption that access to energy is equivalent to the amount of energy generated from biomass development. This option is appropriate for making ex-ante estimations when baseline data on the proportion of people in the community with access to modern energy are not available. The output can be estimated instead of assessing access to energy within the community where the bioenergy project is implemented. If biofuels are the output, energy balance, which is estimated as the amount of energy consumption per unit of energy output, may also be applied to select the best appropriate feedstock.
4.3.3. The Human Development Index as a Secondary Indicator
The WG’s experience for field-testing the sustainability indicators for evaluating sustainability of biomass energy initiatives revealed that it was our challenge to evaluate the social sustainability at local level using HDI. It was because the data availability at local level and the hurdles in isolating the social impacts of biomass energy on related activities to overall health, education or even income.
Since HDI is originally developed to evaluate social development at state or national levels, however, the WG kept the card for using HDI as secondary indicator applicable for evaluating social sustainability for large-scale biomass utilisation initiatives. It could capture the social sustainability if only a biomass utilisation initiative was implemented in the target area and the required data for calculating HDI were available.
5. A Way of Presentation of Results and Integration Methods
The development of indicators for the three pillars of sustainability—environment, economy and society—has been discussed in the previous sections. Much effort has gone into the identification and refinement of appropriate sustainability indicators to evaluate biomass utilisation systems in East Asia. Scientific discussions among the WG researchers were conducted over several years for identifying and then field testing and finally refining the indicators to come up with a robust set that could be used for assessing biomass utilisation at large as well as small scale initiatives. However, it must be remembered that these indicators have been developed to assist policy makers in the region, not all of who are scientists. Hence, care must be taken to present the results to them in a way that may facilitate understanding of the issues being considered in assessing the sustainability of biomass utilisation initiatives.
Decision-making would be much easier if there were only a single index that would somehow include all the aspects of sustainability. Comparison of the sustainability of systems would almost be trivial should such an index exist. However, as seen in the earlier sections, a suite of indicators has been developed for assessing the environmental, economic and social aspects of sustainability for biomass utilisation initiatives. The development of a single index integrating all the identified indicators would thus require a systematic method of aggregation. As the different indicators for environmental, economic and social pillars of sustainability are in widely varying units, integration would first require some form of normalization to bring the indicators to the same unit followed by weighting to allow for the difference in relative importance/seriousness of the various indicators after which they could be aggregated to a single index.
Many methods for normalization exist. A number of weighting techniques also exist [
59]. Some are derived from statistical models, such as factor analysis, data envelopment analysis and unobserved components models (UCM), or from participatory methods like budget allocation processes (BAP), analytic hierarchy processes (AHP) and conjoint analysis (CA). Regardless of which method is used, weights are essentially value judgments. While some analysts might choose weights based only on statistical methods, others might reward (or punish) components that are deemed more (or less) influential, depending on expert opinion, to better reflect policy priorities or theoretical factors. Weights may also be chosen to reflect the statistical quality of the data. Higher weights could be assigned to statistically reliable data with broad coverage. However, this method could be biased towards the readily available indicators, penalizing the information that is statistically more problematic to identify and measure.
One of the normalization techniques, “Min-Max” method, was attempted earlier on for bringing the indicators in the range [0, 1] so that they could be visually presented as a radar diagram [
6]. However after initial testing and discussions in the WG, this method was discarded [
7]. One of the major reasons for discarding was the increase in number of indicators from the initial three to more due to inclusion of secondary indicators. The normalization techniques developed for the initial three indicators were already a bit arbitrary because they were not comparable amongst themselves. This limitation would actually be true for any normalization scheme. Additional indicators would only compound this shortcoming. Hence, it was decided to revert to a simple tabular presentation of results acknowledging that it provided all the necessary information to the decision makers without introducing any bias from the researchers.
The discussion in the WG considered a possible way to normalize the indicators that could hold appeal, especially for non-scientists: monetization of all the indicators. However, finding monetary equivalents for environmental and social externalities would be a quite a challenge. Even for a commonly used indicator such as GHG emissions, there are several values internationally which means it would be difficult to select a unique value. For other indicators, such monetary values do not even exist. Much resources and time would be required to develop such a scheme for using with the indicators selected for assessing the sustainability of biomass utilisation initiatives. In addition, even this scheme would still suffer from uncertainty and subjectivity as with other normalization methods.
Hence, as of now a tabular presentation is still the preferred choice to the WG. Future efforts may look at providing some reference values for each indicator that may help the decision makers to somehow get a sense of magnitude of the numbers. This would also indirectly be a kind of normalization effort even though calculating the normalized values would be avoided. Intensive discussions among the researchers would be needed following an investigation in this direction.
6. Conclusions and Recommendations
This article has outlined a sustainability assessment methodology, along with the main indicators and secondary indicators that the WG deemed suitable for the East Asian context based on our expertise. The aim of the actual research project was to propose a theoretically sound and practically implementable methodology for sustainable biomass utilisation in East Asian countries. This project responds to a growing need to utilize biomass resources in East Asian countries and to an increasing emphasis on the sustainable use of biomass within discussions, worldwide. Because the target users of the WG methodology are decision makers (and not academics and experts), the WG carefully identified sustainability indicators that were not too scientific or complicated, and that did not have high levels of uncertainty associated with them. The methodology should be relevant and applicable to any type of biomass utilisation initiative.
The WG methodology and indicators shown in
Figure 2 are expected to be applied for the following purposes. (i) To assess the sustainability of a planned biomass utilisation initiative. (ii) To compare the sustainability of several planned options for a biomass utilisation initiative. (iii) To assess the sustainability of an ongoing biomass utilisation initiative. (iv) To compare several options for improving the sustainability of an ongoing biomass utilisation initiative. Hence, the WG methodology applies to both ex-ante and ex-post evaluations of sustainable utilisation of biomass. The results of sustainability assessments conducted using the WG methodology and indicators will support decision makers (politicians responsible for biomass utilisation policy, owners of farms and plantations, and plant managers) in determining the feasibility of a new or existing biomass initiative.
The WG considers it important to conduct sustainability assessments of biomass utilisation using its proposed methodology and to share these results within East Asian countries. This would enable the methodology to support policymakers in determining the types of biomass resources and methods for their utilisation that can be sustainably implemented in East Asian countries.


 ,
, 

