Article

A Practical Approach to Screening Potential Environmental Hotspots of Different Impact Categories in Supply Chains

1
Department of Urban Engineering, The University of Tokyo, 7-3-1 Hongo, Bunkyo-ku, Tokyo 113-8656, Japan
2
Bank of Tokyo-Mitsubishi UFJ, 5-42-8 Nakakasai, Edogawa-ku, Tokyo 134-8504, Japan
*
Author to whom correspondence should be addressed.
These authors contributed equally to this work.
Sustainability 2015, 7(9), 11878-11892; https://doi.org/10.3390/su70911878
Submission received: 12 June 2015 / Revised: 22 July 2015 / Accepted: 12 August 2015 / Published: 26 August 2015
(This article belongs to the Section Environmental Sustainability and Applications)

Abstract

:
Identification of environmental hotspots becomes a pressing issue for companies pursuing sustainable supply chain management. In particular, excessive dependence on water resources outside the country may put the supply chain at unanticipated risk of water shortage. This article presents a practical approach to screening potential environmental hotspots of different impact categories that occur in the supply chain using environmental input-output analysis. First, the amounts of domestic and foreign potential impacts of global warming, terrestrial acidification, and water resource consumption, induced through supply chains were calculated for 403 sectors of Japanese products. Thereafter, with a focus on potential impacts induced through the import of raw materials, a framework for screening foreign potential hotspots was presented. The results showed that the sectoral potential impacts of water resource consumption had high rates of foreign impacts at deeper tiers of the supply chains for some sectors, which indicated that there exist hidden water hotspots outside the country. In the case study of fiber yarns, impacts on water resource consumption induced as a result of the import of crops, as well as that induced in silviculture as a result of the import of wood chips, were found to be the foreign potential hotspots.

Graphical Abstract

1. Introduction

The supply chain (or value chain) from the collection of raw materials to the manufacture, distribution, and retail sale to consumers, has become increasingly complex as a result of the process of globalization in recent years. This global supply chain serves to alleviate poverty and improve labor environments and living standards on one hand, but it has the negative aspect of an unrestrained thirst for water, energy, and other resources that create an excessive burden on the planet [1]. In particular, scientific methodologies, such as life cycle assessment (LCA), are held up as keys to the holistic management of a sustainable supply chain, by guiding the concentration and focus of research hours toward improved outcomes [2]. Identifying these environmental hotspots can support decision-making, for example, on strategies for corporate sustainability regarding supplier selection or product improvement [3].
Recent years have seen an active shift towards corporate accounting for and reporting on greenhouse gases (GHGs), not only with respect to direct emissions by the company (a.k.a., Scope 1) or emissions at the energy source (Scope 2) but also on impacts originating in the company’s supply chain, such as in material procurement (Scope 3) [4,5,6,7]. In addition, the importance of cross-cutting evaluation of interventions and impacts that target various impact categories, as requested in the Product/Organization Environmental Footprint issued by the European Commission [8], goes without saying. One much-debated topic is the water footprint (WF) [9], which determines water consumption in a product’s life cycle, and for which an ISO standard has been recently published [10]. To account for these environmental burdens, the life cycle inventory (LCI) method may be used, but it is difficult for a company to trace its supply chain all the way upstream to assess the interventions, including its foreign sources.
Thus, with the advantages of completeness of the upstream system boundaries over process-based LCIs [11], the embodied environmental intensities from environmental input-output analysis (EIOA) can provide useful secondary data for screening particular emission sources that should be prioritized for data collection (hotspots) [4,5]. In recent years, various multi-region input-output (MRIO) models have provided embodied intensities of GHGs and other substances that take into account the import and export [12,13,14,15,16]. A similar approach can be applied to various other types of environmental burden or resource consumption measures including the ecological footprint (EF) and WF [17]. However, sometimes fewer types of interventions are addressed in MRIO models; e.g., the global link input-output (GLIO) model [16] for Japanese products has high sector resolution (406 sectors), while the model has not taken into account water resources yet. In addition, if we consider the availability of data and models of region-dependent characterization in life cycle impact assessment (LCIA) [18,19,20], the accurate evaluation of impacts outside a nation, for all impact categories using the same framework, is not a straightforward task (see also Section 1.1 and Section 1.2 of the Supplementary Information).
Still, identification of impact category hotspots, as having been studied for GHG emissions or water consumption of specific products [21,22], is a pressing issue for companies pursuing sustainable supply chain management. In particular, excessive dependence on water resources outside the country may put the supply chain at unanticipated risk of water shortage. A more practical framework for screening potential hotspots abroad with high sector resolution needs to be introduced. Even with the limitations of the domestic technology assumption (DTA) inherent in single-region input-output (SRIO) models, we can differentiate between impacts from domestically generated direct or indirect burdens, with a certain degree of accuracy, and the potential impacts generated abroad. Additionally, by identifying how deep tiers of the supply chain potential impacts are being induced through the import of raw materials, companies may be able to find a lead on potential hidden hotspots outside a nation within their own supply chain.
In this article, we present a practical approach to screening potential environmental hotspots of different impact categories in supply chains of domestically produced products using EIOA with a focus on sectors in which potential impacts are induced and the contribution of imported raw materials. First, potential impacts under the DTA are evaluated using embodied interventions (GHGs, acidifying substances, and water resources) for 403 sectors through EIOA that utilizes the Japanese input-output tables and unit direct environmental burdens and resource consumptions, as well as characterization factors of each impact category for Japan or the entire globe. For each impact category, we categorized as domestic or abroad the sectoral-embodied environmental intensities and the potential impacts by each tier of the supply chain. We also analyzed the characteristics across impact categories, especially water resource consumption. We then propose a framework for screening potential hotspots abroad that occur in the supply chain through the import of raw materials. Fiber yarns, which were perceived to have a distinctive trend for water resource consumption, were used as the subject of a case study wherein we categorized their potential impacts as being either domestic or abroad and then analyzed the potential impacts associated with the import of raw materials.

2. Materials and Methods

2.1. Embodied Intensities

On the basis of the input-output system that provides the theoretical framework for EIOA, we first assume that sector i only produces product i , and that product i is not produced by other sectors. Here, the intensity of embodied intervention Q k for sector k is derived from Equation (1).
Q k = e · B · f k ' = e · ( I A ) 1 · f k '
where, A is the input coefficient matrix with input coefficient a i j as its element, and f k ' is a column vector where the final demand f k for product k is 1 and the final demand for products in other sectors f i (   i k   ) is 0. Moreover, e is a row vector with unit direct impact e i as its element, with the product of the characterization factor and the unit direct intervention in sector i . In this study, e i indicates the direct impact on global warming, terrestrial acidification, or water resource consumption per unit activity (one million JPY). B = ( I A ) 1 is known as the Leontief inverse matrix, whose element b i j indicates an entire series of direct and indirect effects [23]. The embodied environmental intensity is based on the assumption that the amount of the environmental burden of production of the imported product is the same as the same product produced domestically. Such an embodied intensity under the DTA is often called the ( I A ) 1 type [24].
On the other hand, when calculating only the environmental burdens generated from the domestic production activity of each sector, excluding the input of imports, the embodied environmental intensity Q k ' is derived by Equation (2). Here, M is an import coefficient matrix, i.e., a diagonal matrix with the import coefficient m i as its diagonal component. This embodied intensity is called the ( I ( I M ) A ) 1 type [24].
Q k ' = e · B · f k ' = e · ( I ( I M ) A ) 1 · f k '
In this article, on the basis of the transaction table (basic sector classification) in the 2005 Input-Output Tables for Japan [25], the input coefficients and import coefficients (total imports divided by the total sum of input to the endogenous sectors and the domestic final demand) were configured for the 403 sectors in accordance with the Embodied Energy and Emission Intensity Data for Japan Using Input-Output Tables (3EID) [24,26].

2.2. Unit Direct Interventions

For environmental burdens, this study referred to the direct GHG emissions per million JPY in each sector in Japan, which were applied in 3EID (2005 table) [24]. The six target substances include fuel-derived and nonfuel-derived carbon dioxide (CO2), methane (CH4), nitrous oxide (N2O), hydrofluorocarbons (HFCs), perfluorocarbons (PFCs), and sulfur hexafluoride (SF6). With respect to acidifying substances, we applied the direct emissions of nitrous oxides (NOx) and sulfur oxides (SOx) per million JPY, which are also used in the GLIO model [16]. For water consumption, we used the direct consumptions per million JPY for each water source (river water, ground water, and rain water) that corresponds with the 403 sectors in the Japanese input-output tables [27,28].

2.3. Characterization Factors

In this study, we used the midpoint characterization factors (Table 1) to analyze the characteristics across impact categories. In addition to global warming and water resource consumption, this article also focuses on terrestrial acidification, where unit direct emissions that correspond to the Japanese input-output tables and characterization factors for Japan are available.
For global warming, as an unit impact of each sector, we used the respective direct GHG emission provided in 3EID (2005 table) [24], where the above six substances were converted and aggregated into CO2 equivalents based on the Global Warming Potential (GWP) with a time horizon of 100 years (GWP 100) [29]. For terrestrial acidification, the characterization factors we applied were the average values for the Deposition-oriented Acidification Potential (DAP), which is the characterization factor for acidification used in the Life-cycle Impact assessment Method based on Endpoint modeling (LIME 2) [30]. For NOx and SOx, we used the DAPs for nitrogen dioxide (NO2) and sulfur dioxide (SO2), respectively. The DAP is deemed to be a regionally dependent characterization factor that assumes the environmental conditions in Japan.
Among various models for characterization of water use [20], we applied the Water Stress Indicator (WSI) [31,32], which has been proposed as a midpoint characterization factor for water resource consumption. This shows the availability of water resources of which other competing users are deprived as a consequence of water use [32], and is used as a proxy indicator of water shortage risks in this study. We approximated the WSI [m3·water·eq] as water consumption for each water source (river water, ground water, and rain water) weighted by the stress index α i of the average water quality level (surface water: S2b, ground water: G2b) of Japan, and then these results were aggregated into a total (see also Section 2.1.3 of the Supplementary Information).
Table 1. Characterization factors for each impact category used in this study.
GWP 100
of the SAR [29]
Ref.) GWP 100
of the AR4 [33]
DAP [30]
(Japan Average)
WSI [31]
(Japan)
(kg·CO2·eq/kg)(kg·CO2·eq/kg)(kg·SO2·eq/kg)(m3·water·eq/m3)
CO2: 1CO2: 1NO2: 0.63Surface water (S2b): 0.536
CH4: 21CH4: 25SO2: 1.00Ground water (G2b): 0.024
N2O: 310N2O: 298 Rain water: 0.999
HFCs: 1300 a etc.HFCs: 1430 a, etc.
PFCs: 6500 b etc.PFCs: 7390 b, etc.
SF6: 23,900SF6: 22,800
Note: a 1,1,1,2-tetrafluoroethylene (HFC-134a); b perfluoromethane (PFC-14).

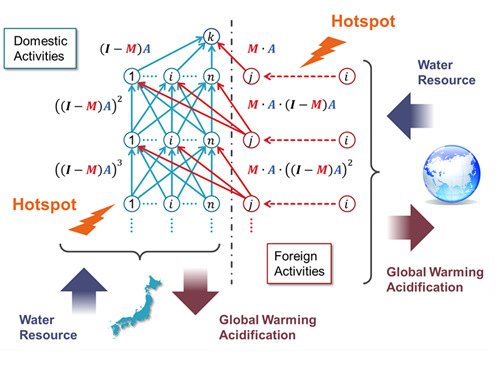
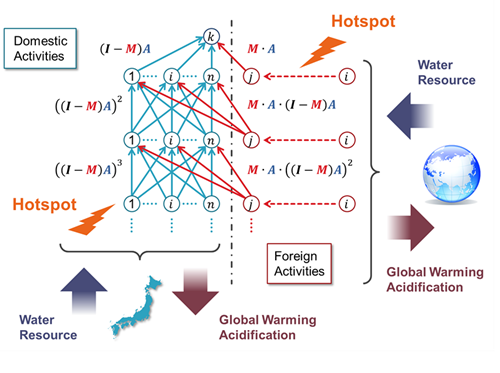
2.4. Domestic and Foreign Potential Impacts by Each Tier of the Supply Chain

We categorize the potential impacts that arise domestically, Q D , and abroad, Q F , on the basis of the embodied environmental intensities under the DTA and those excluding the input of imports that are mentioned above. As shown in Equations (3) and (4), we used the diagonal matrix E ˜ , which deploys the element e i of e onto the diagonal component e ˜ i i .
Q D = E ˜ · ( I ( I M ) A ) 1
Q F = E ˜ · ( I A ) 1 Q D
The above potential impacts are further categorized into domestic direct, Q D ( 0 ) , and domestic and foreign subsequent tiers (   t -th tier), Q D ( t ) and Q F ( t ) , and these are derived in Equations (5)–(7).
Q D ( 0 ) = E ˜ · I
Q D ( t ) = E ˜ · ( ( I M ) A ) t
Q F ( t ) = E ˜ · A t Q D ( t )
where, element q i k D ( t ) in a certain row i of Q D ( t ) provides the impact induced in the domestic sector i at the t -th tier of the supply chain of product k . Similarly, element q i k D ( t ) of Q F ( t ) shows the potential impact induced in a foreign production activity that corresponds to sector i at the t -th tier. At this point, the column sum of q i k D ( t ) as a ratio of the embodied intensity Q k under the DTA, is called the “rate of domestic impact” at the t -th tier for product k . Similarly, the column sum of q i k F ( t ) as a ratio of the embodied intensity Q k is called the “rate of foreign impact” at the t -th tier. For details, see also Section 2.4 of the Supplementary Information.

2.5. Potential Impacts Associated with the Import of Raw Materials

In Equation (8) below, the element y i j ( k ) of Y ( k ) allows the calculation of the contribution of imported raw material j to the potential impacts induced by product k in the foreign production activity that corresponds to sector i . For example, potential impacts induced in the foreign electricity sector ( i ) as a result of the import of synthetic fibers ( j ) for domestic production of fiber yarns ( k ) can be calculated. The underlying concept of the accounting method for determining the potential impacts associated with import is shown in Figure S1 of the Supplementary Information, and is regarded as a partial application of structural path analysis (SPA) [21,34] with a focus on the import of raw materials.
Y ( k ) = E ˜ · B · X ˜ · k = [ e 1 0 0 e n ] [ b 11 b 1 n b n 1 b n n ] [ x 1 k 0 0 x n k ]
X = M · A · B = [ m 1 0 0 m n ] [ a 11 a 1 n a n 1 a n n ] [ b 11 ' b 1 n ' b n 1 ' b n n ' ]
where, X ˜ · k is a diagonal matrix that deploys element x j k in column k of X , described by Equation (9), into the diagonal component. Element x j k represents the monetary value of the imports for raw material j induced by producing one unit of product k . In addition, B = ( I A ) 1 and B = ( I ( I M ) A ) 1 . Then, for raw material j with a large value of element y i j ( k ) , the import partners are identified by, for example, trade statistics. By this process it is possible to screen for the possibility of hidden hotspots existing within the production activity that correspond to sector i in a specific country, through the import of raw material j .

3. Results

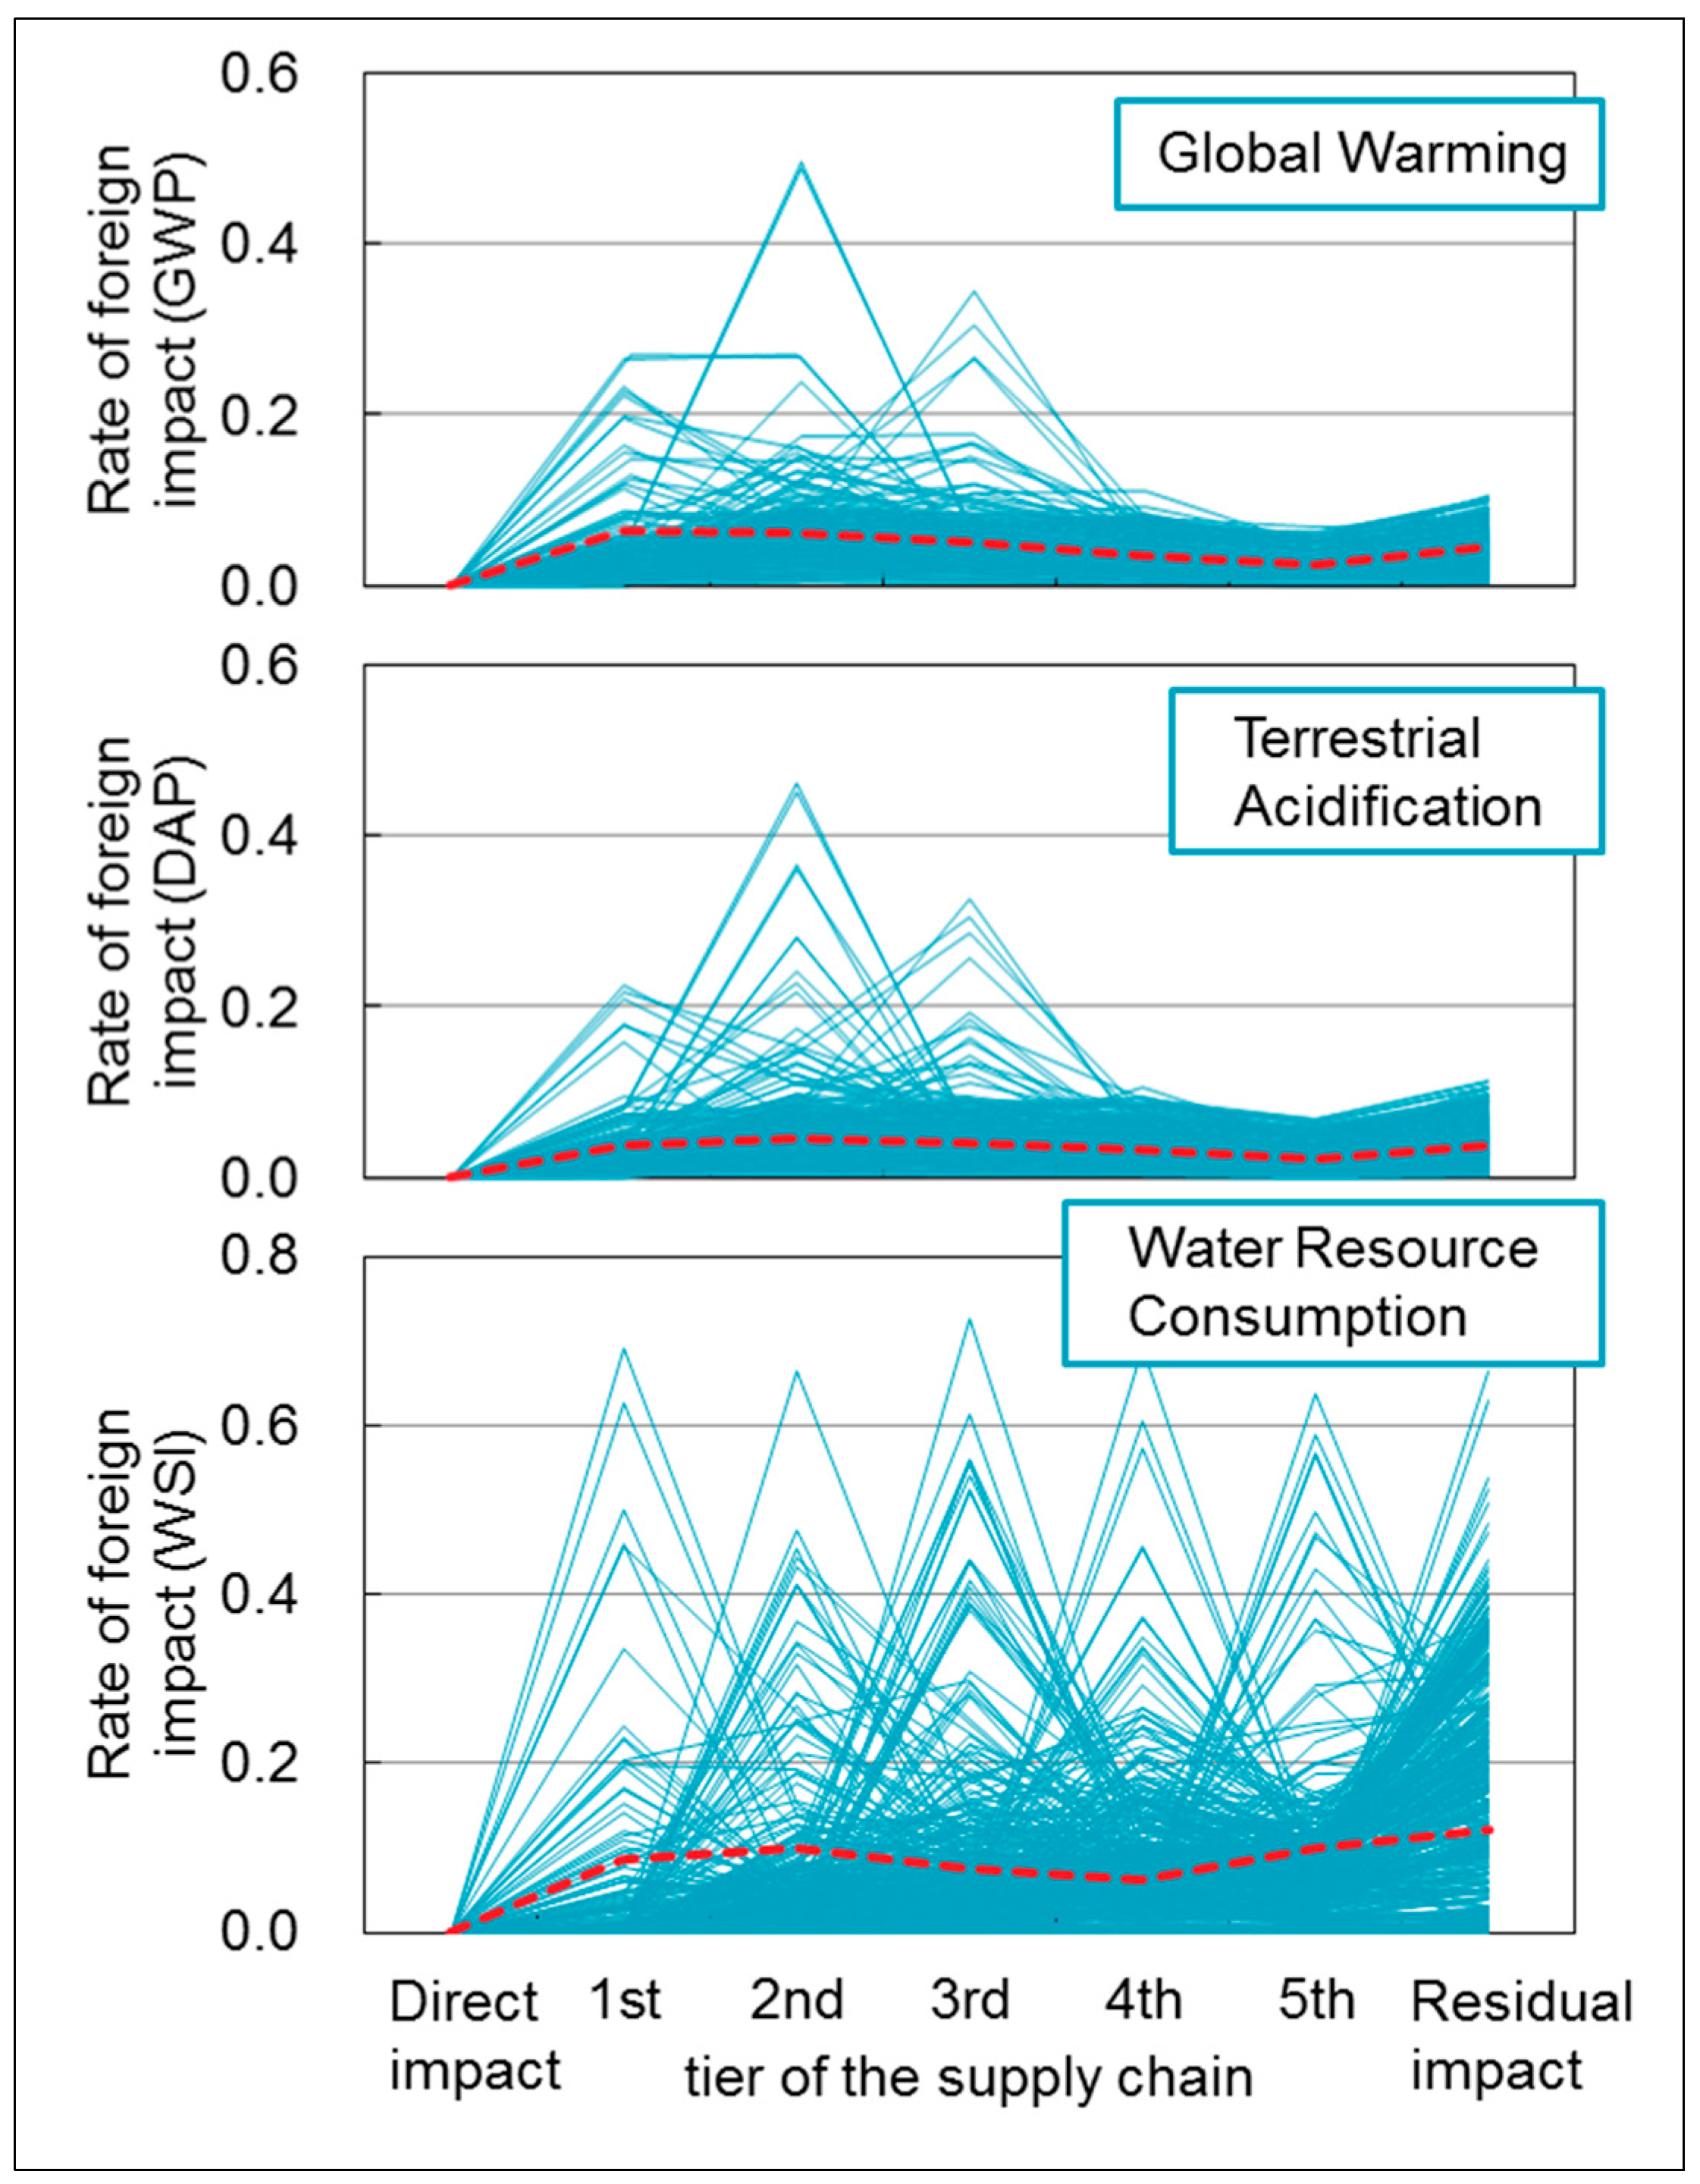
3.1. Rates of Foreign Potential Impacts

We calculated the rates of foreign impacts by each tier of the supply chain in the embodied intensities of potential impacts for each sector (see Section 2.4), and compared our results across all impact categories. The foreign ratios of the WSI tend to be higher than those of the GWP and DAP (see Section 3.1 of the Supplementary Information). Respective lines presented in Figure 1 show tier-to-tier fluctuation of the rates of foreign impacts in the GWP, DAP, and WSI for the 403 sectors. For all impact categories, there are some sectors in which the rates of foreign impacts are high at a specific tier. In such a sector, the rates of potential impacts in other tiers requisitely become low; in line graphs of Figure 1, one tier of the supply chain conspicuously protrudes above others, and as a result it looks oscillating especially for water resource consumption. This result indicates that sector k fulfills the following two conditions: (a) the production of product k induces production in a certain sector i , which has a high unit impact; (b) there is a sector with a high import rate along the paths of the supply chain leading to sector i .
Figure 1. Rates of foreign impacts by each tier of the supply chain in embodied environmental intensities for the 403 sectors of Japanese products. Note: The red dotted lines show the rates of foreign impacts of the fiber yarns sector.
Sustainability 07 11878 g001
The rates of foreign impacts in the GWP and DAP are generally low for all tiers. The causal factor for this result is the small import rates in sectors i with large unit impacts for the GWP and DAP and in sectors j which induce production in such sectors i (for additional descriptions, see Section 3.3 of the Supplementary Information). On the other hand, for the WSI, there are sectors with high rates of foreign impacts at any tier of the supply chain, and the prevalence of such sectors even for deeper tiers is characteristic of this impact category. The import coefficients are not small for crops for feed and foraging (0.274) and inland water fisheries and culture (0.312), where the unit impacts of water consumption are high. The import coefficients are also not small for logs (0.463), to which products from silviculture, where the unit impact is large, are directly input. Therefore, sector k which induces production in such sectors i fulfills the above two conditions. In particular, the top sectors for unit impact for the WSI tower conspicuously over the others. The WSI impacts [m3·water·eq] per million JPY are as follows: silviculture: 33 million; crops for feeding and foraging: 12 million; industrial water supply: 10 million; inland water fisheries and culture: 9 million; while the weighted average by domestic production of the 403 sectors is 48, and those in 388 sectors are less than 0.1. Therefore, even where the monetary value of induced production is not large, the contributions of these sectors cause larger impacts abroad (often at deeper tiers of the supply chain).

3.2. Product Subject to a Case Study

We look into the results of the domestic and foreign potential impacts induced by fiber yarns. We also applied the framework for screening foreign potential hotspots presented in Section 2.5 to a case study on the fiber yarns sector. A large amount of the production of fiber yarns is induced from other textile products sectors. In other words, fiber yarn production is part of the supply chain paths for other textile products, so analyzing its potential impacts is an important way to identify potential hotspots in other textile products as well. As shown in Figure 1, different trends of impacts by tier of the supply chain are shown for the WSI in relation to the GWP and DAP.

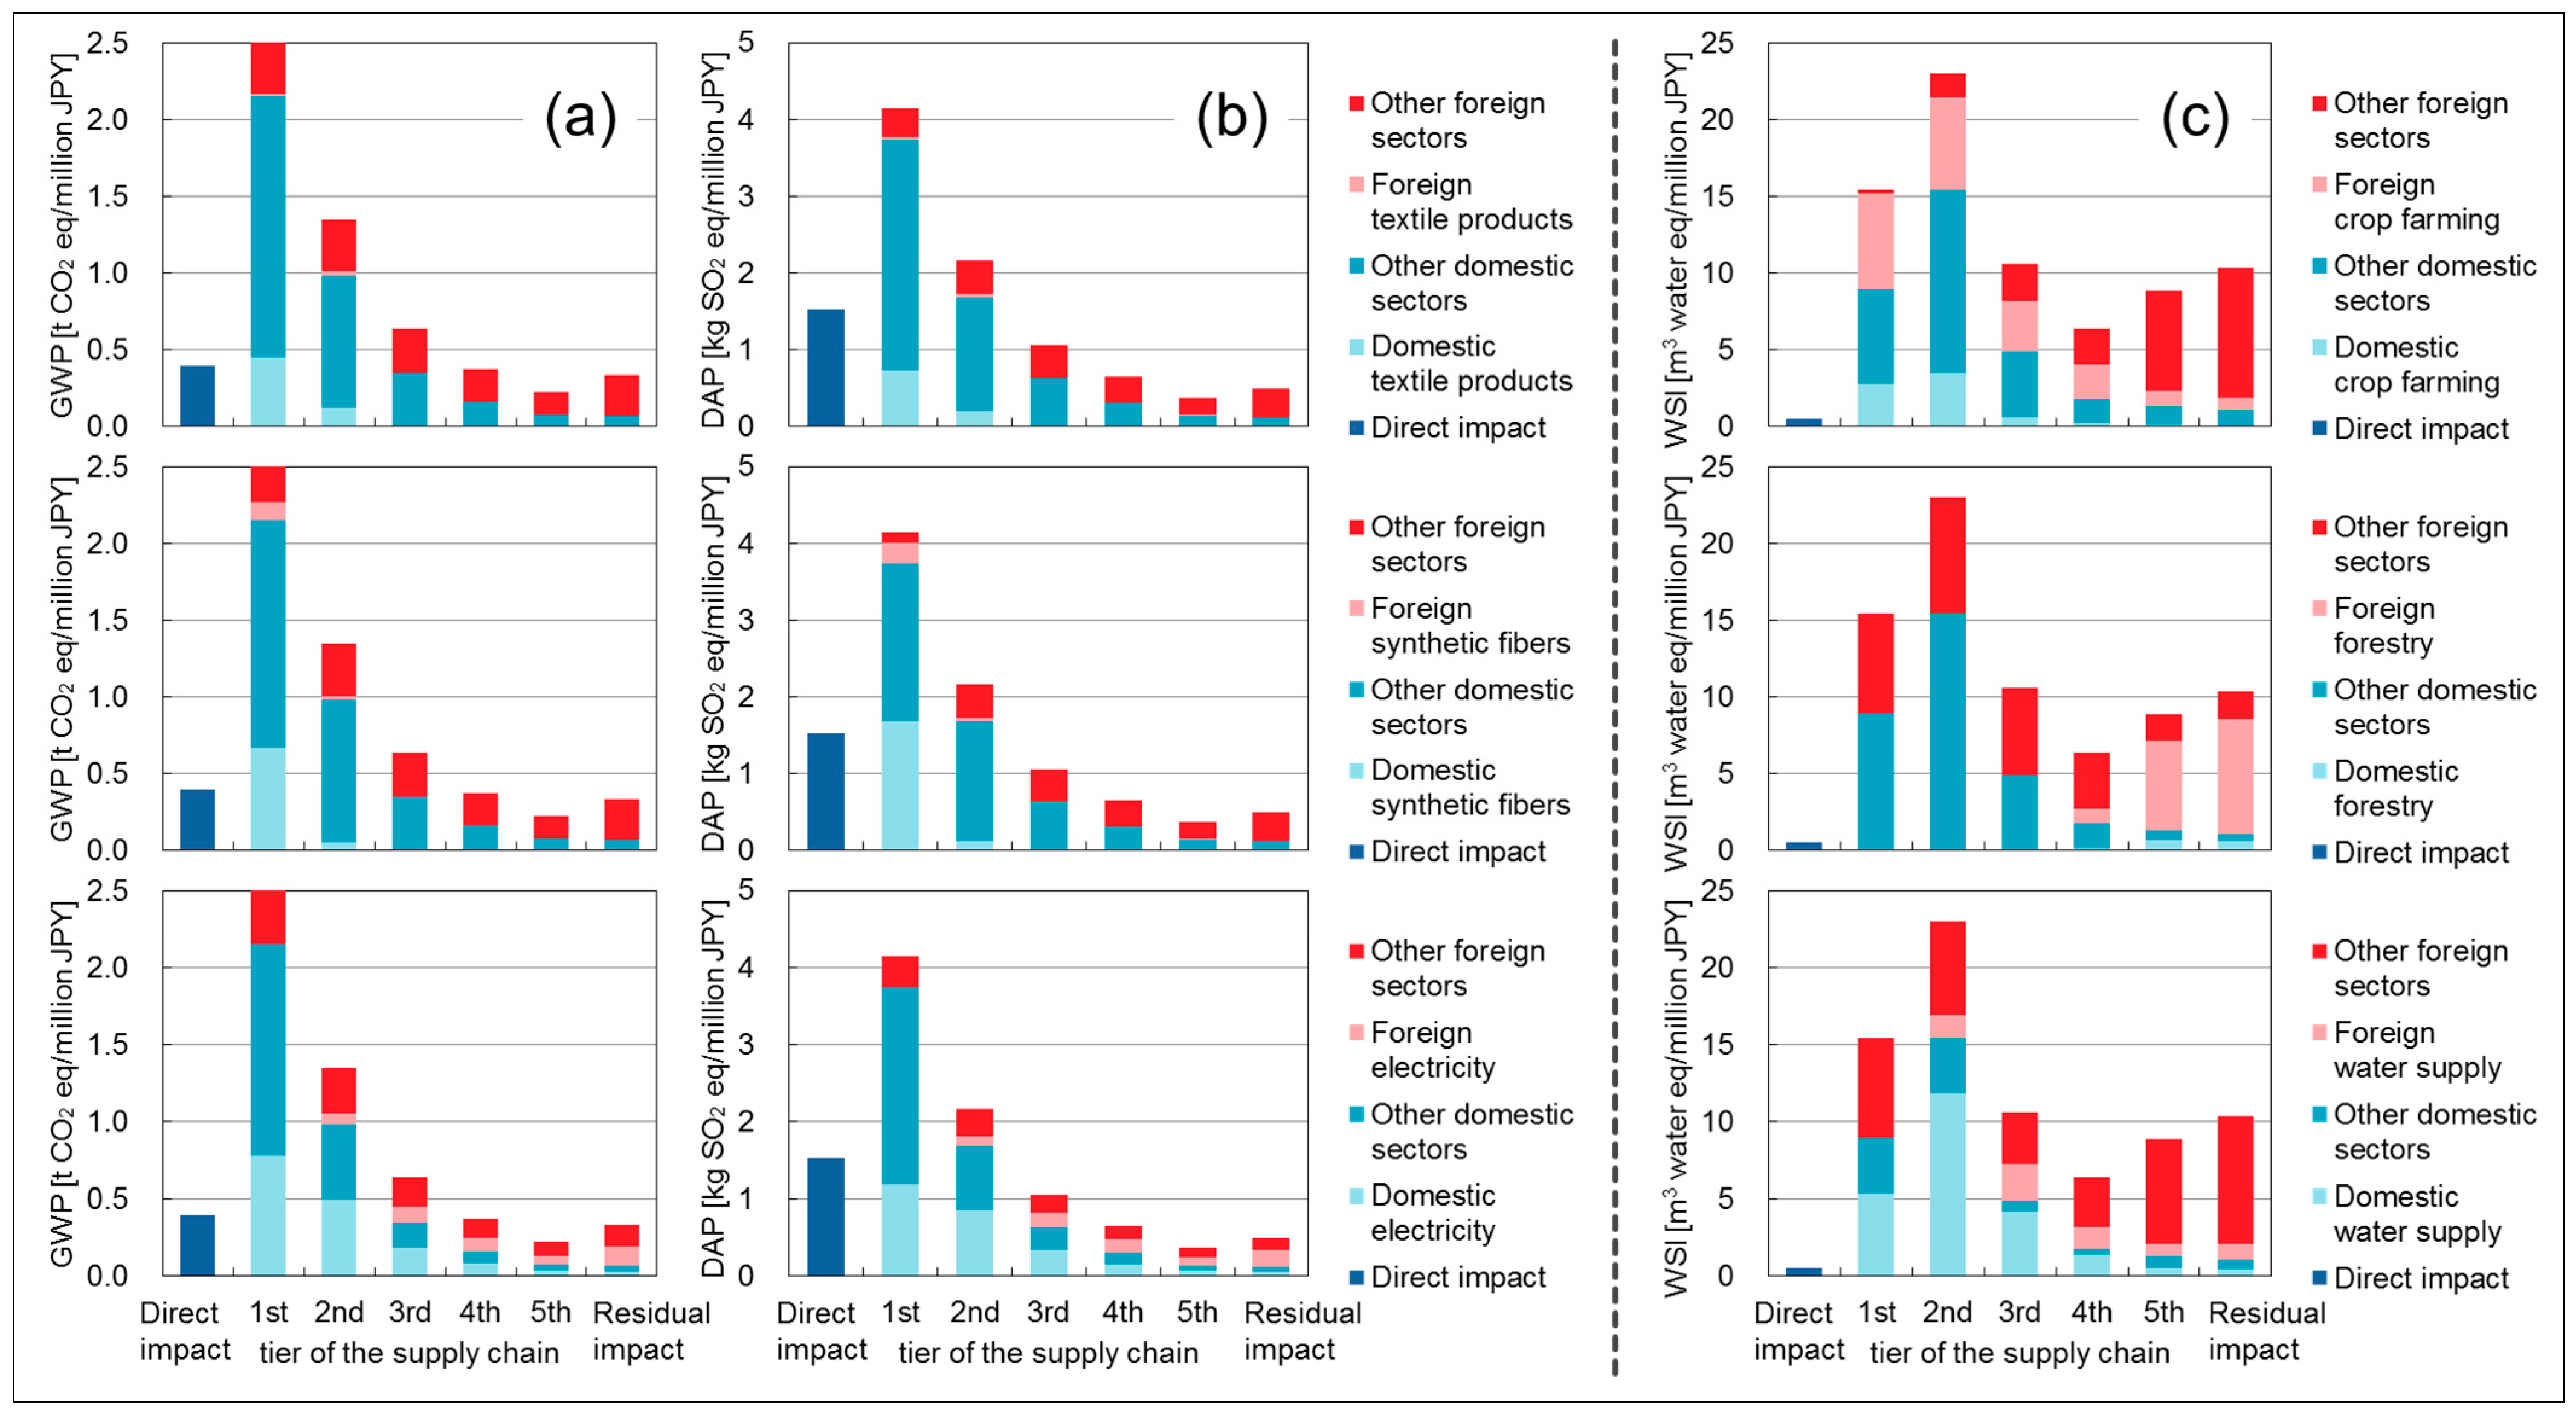
3.3. Domestic and Foreign Potential Impacts by Each Tier of the Supply Chain

In terms of global warming (GWP), we analyzed domestic and foreign potential impacts by tier of the supply chain (Figure 2a). Similarly, the domestic and foreign potential impacts by the tier for terrestrial acidification (DAP) and water resource consumption (WSI) are shown in Figure 2b,c. From these evaluations, we found that as the tiers of the supply chain span out from first to deeper tiers, the GWP and DAP impacts monotonically decrease. In terms of the WSI, domestic impacts become smaller as we follow the tiers of the supply chain, but conversely, foreign potential impacts show an increasing trend after the fourth tier. As such, there is a trend of high rates of foreign impacts (see Figure 1) at deeper tiers, even when compared with the GWP or the DAP.

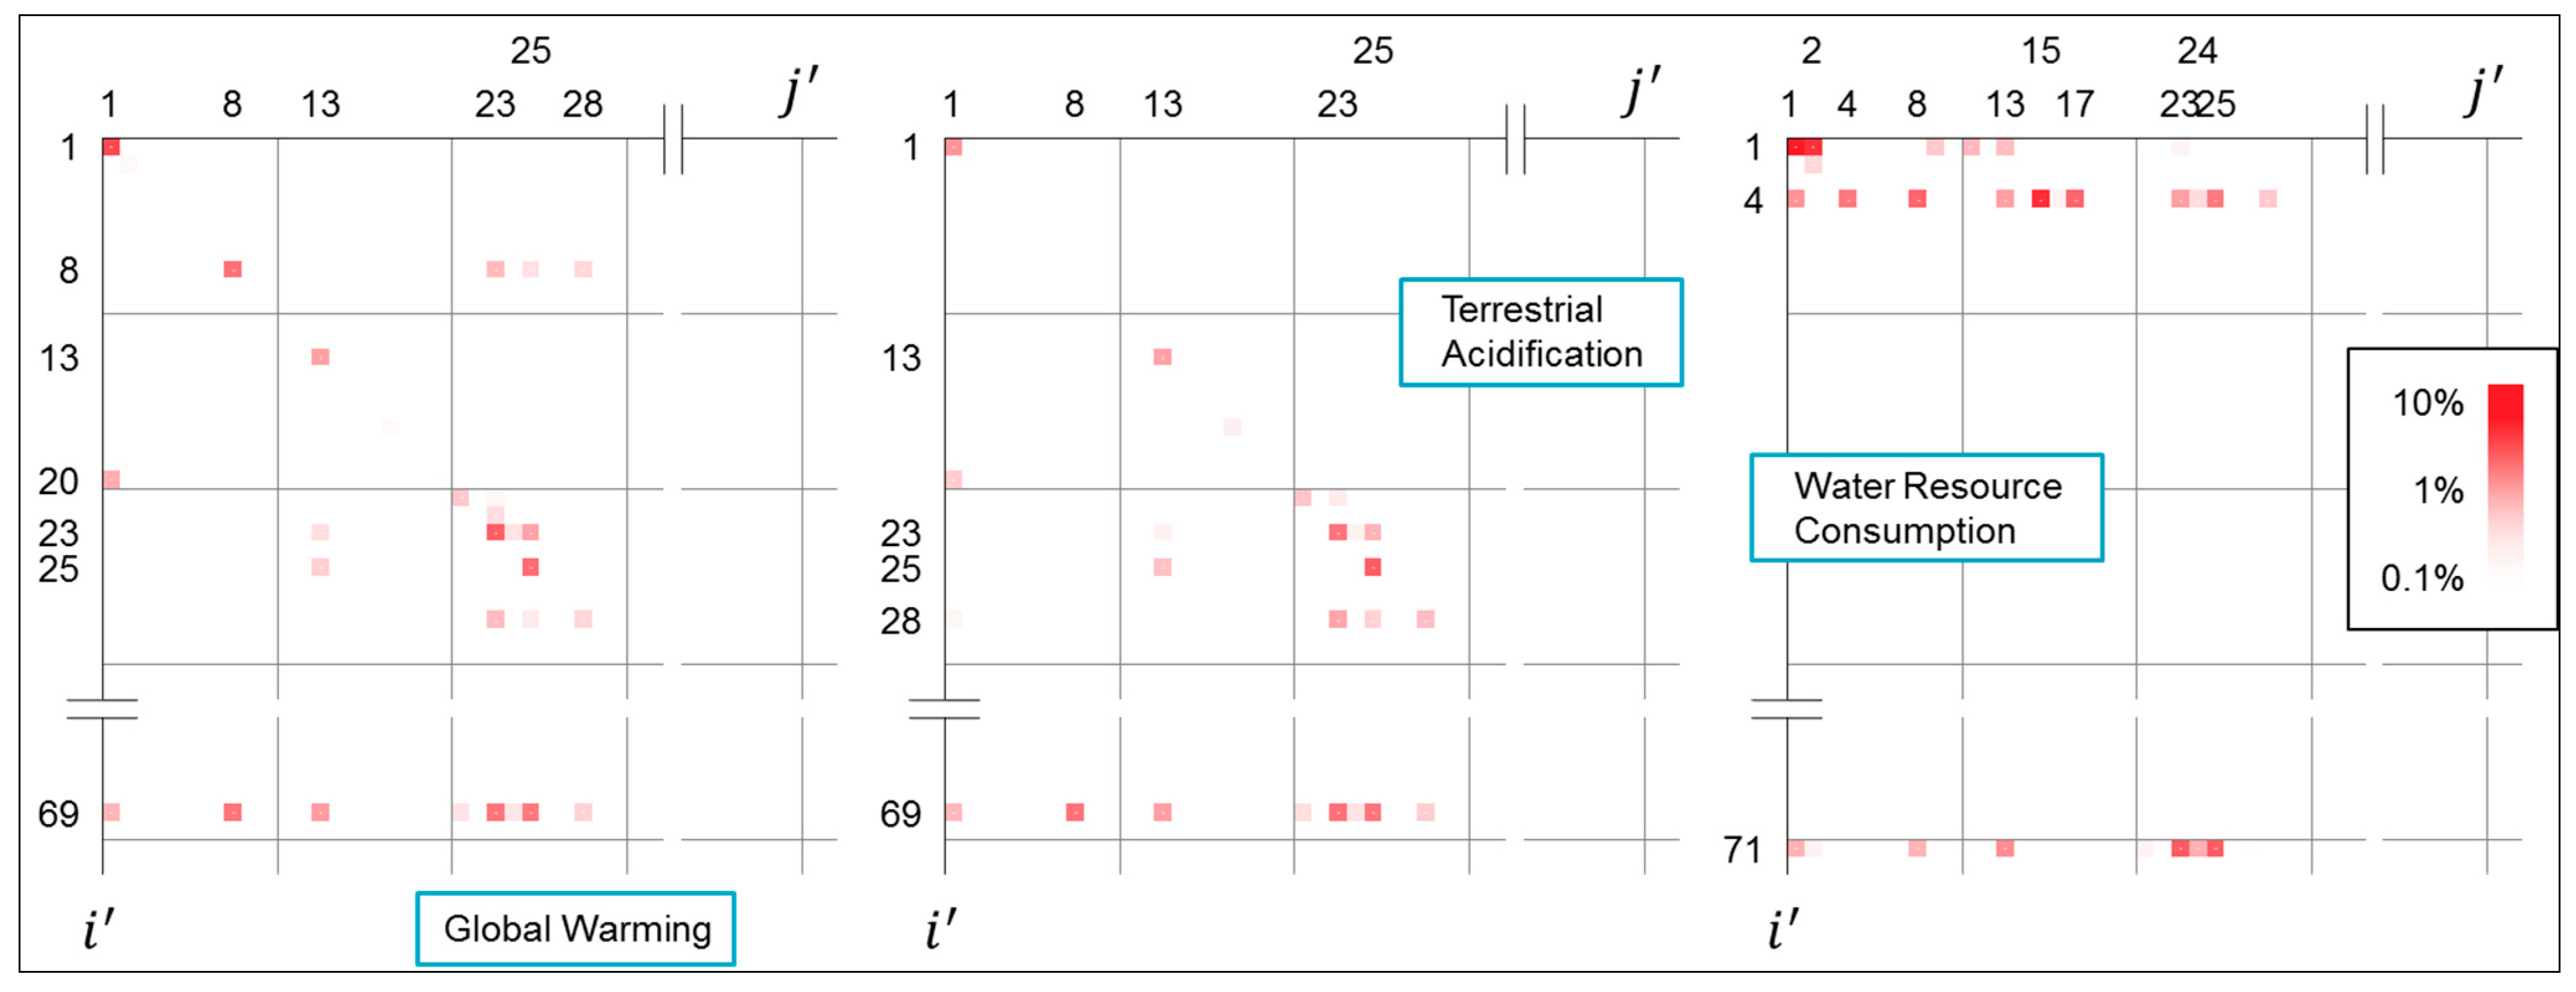
3.4. Sectors that Significantly Contribute to Potential Impacts

Next, we analyzed which sectors i are contributing in each tier of the supply chain for each impact category by extracting elements q i k D ( t ) of Q D ( t ) in Equation (6) and elements q i k F ( t ) of Q F ( t ) in Equation (7). The results are described below for the top three aggregated sectors, within the 108 aggregated sectors, in terms of the contribution to the embodied intensities under the DTA, ( q i k D + q i k F ) /   Q k , for the GWP and the WSI. For the GWP and DAP, the top three contributors were all in the same sectors, and similar trends were observed in the results.
Figure 2a,b show the contributions to potential impacts of the GWP and DAP domestically and abroad from the textile products, synthetic fibers, and electricity sectors. Contributions from these top three aggregated sectors account for 66.4% (GWP) and 77.4% (DAP) of the embodied intensities. In contrast to the other two aggregated sectors, which claim small contributions in second and subsequent tiers as well as to foreign potential impacts, contributions from the electricity sector claimed a certain level in each tier, and contributions to foreign potential impacts were seen in the second and subsequent tiers. In terms of the WSI, the contribution from the electricity sector was only 0.1% of the embodied intensity, and showed a trend different from those in the GWP and DAP.
Similarly, Figure 2c shows the contribution to potential impacts of the WSI domestically and abroad from the crop farming, forestry, and water supply sectors. Contributions from these top three aggregated sectors account for 97.5% of the embodied intensity. As stated in Section 3.1, in terms of the WSI, their contributions are dominated by the top sectors with conspicuously high unit impacts, especially silviculture in the forestry sector and industrial water supply in the water supply sector. In addition, for the crop farming sectors, contributions to domestic and foreign potential impacts are seen in the lower tiers, while the forestry sector is characterized by its large contributions abroad in the deeper tiers of the supply chain.
Figure 2. Contributions of the top three aggregated sectors to the potential impact in the (a) GWP; (b) DAP; (c) WSI of the fiber yarns sector by each tier of the supply chain. Note: The top three aggregated sectors are the textile products, synthetic fibers, and electricity sectors for the GWP and DAP, and the crop farming, forestry, and water supply sectors for the WSI. The textile products sector includes fiber yarns; cotton and staple fiber fabrics; silk and artificial silk fabrics; woolen fabrics, hemp fabrics and other fabrics; knitting fabrics; yarn and fabric dyeing and finishing; ropes and nets; carpets and floor mats; fabricated textiles for medical use; other fabricated textile products. The synthetic fibers sector includes rayon and acetate; synthetic fibers. The electricity sector includes electricity; private power generation. The crop farming sector includes rice; wheat and barley; potatoes and sweet potatoes; pulses; vegetables; fruits; sugar crops; crops for beverages; other edible crops; crops for feed and foraging; seeds and seedlings; flowers and plants; other inedible crops. The forestry sector includes silviculture; logs; special forest products. The water supply sector includes water supply; industrial water supply; sewage disposal.
Sustainability 07 11878 g002

3.5. Potential Impacts that Associated with the Import of Raw Materials

For potential impacts induced by Japanese domestically produced fiber yarns in foreign production activities that correspond to sectors i , contributions from the import of raw materials j were identified through the method described in Section 2.5. For the GWP, DAP, and WSI, the potential impacts from the pairing of sector i and raw material j are summarized and illustrated in Figure 3 (see also Tables S1–S3 of the Supplementary Information).
Pairings in which imported raw material j and sector i match and pairings in which potential impacts are induced in the electricity sector cover the top ranks for the GWP and DAP. Contributions to the embodied GWP and DAP intensities claim more than 2% only for potential impacts that other inedible crops (including raw cotton) and synthetic fibers induce in their own sectors, respectively. Both sectors have large production values induced by fiber yarns; they are 4th and 1st in the 402 sectors excluding fiber yarns, respectively. The other inedible crops sector has a high import coefficient of 0.691 and can be deemed to be a relatively predictable hotspot.
Figure 3. Foreign potential hotspots of Japanese domestically produced fiber yarns. Note: Sector i and raw material j were aggregated into the 108 aggregated sectors. Figures in the legend show the potential impacts induced in foreign production activities that correspond to sector i by importing product j , as a percentage of the embodied intensities under the DTA in the fiber yarns sector. Although some rows and columns were omitted, all pairings of sector i and raw material j that claim over 0.5% of the embodied intensity under the DTA are shown in the chart. i ,   j = 1 indicates crop farming (including raw cotton); j = 2 indicates livestock; j = 4 indicates forestry (including silviculture and logs); i ,   j = 8 indicates coal mining, crude petroleum and natural gas; i ,   j = 13 indicates textile products; j = 15 indicates timber and wood products (including wood chips), j = 17 indicates pulp, paper, paperboard, building paper; i = 20 indicates chemical fertilizer; i ,   j = 23 indicates organic chemical products (including cyclic intermediates and synthetic dyes); j = 24 indicates synthetic resins; i ,   j = 25 indicates synthetic fibers (including rayon and acetate); i ,   j = 28 indicates petroleum refinery products; i = 69 indicates electricity; i = 71 indicates water supply (including industrial water supply).
Sustainability 07 11878 g003
The contribution of the potential impact that other inedible crops induce in their own sector claims the top rank in the WSI as well. Meanwhile, pairings can also be seen between sector i and raw material j in which the induced production value is not large. In particular, wood chips, pulp, logs, and silviculture have rankings of production value induced by fiber yarns of 94th, 60th, 110th and 147th, respectively, out of the 402 sectors excluding fiber yarns. Nonetheless, foreign potential impacts of pairings between wood chips, pulp, logs as imported raw materials j and silviculture as sector i claim 6.3%, 2.1%, and 1.7% of the embodied WSI intensity under the DTA. In other words, this shows that there are such hidden hotspots abroad with respect to water resource consumption.
In addition, from an LCIA perspective, the difference of the characterization factors (WSI) between Japan and its trading partners could be examined to determine how the potential impacts, or risks of water shortage, may change through these factors. According to trade statistics [35], of all the imporpartners in 2005, the United States was at the top for raw cotton and Australia was at the top for wood chips. α i values of surface water (S2b) in those countries are 0.732 and 0.927 [31], respectively, which are both larger than the value of 0.536 in Japan.
From these results, we can see that production activities of raw cotton in the import partner such as the United States are screened as potential hotspots of the supply chain of Japanese fiber yarns. In addition, impacts on water resource consumption have hotspots in production activities in silviculture that are induced through the import of wood chips from the partner country such as Australia.

4. Discussion

The results reveal that there are some sectors in which the foreign ratios of the embodied intensities of water resource consumption are high and the foreign potential impacts become large at deeper tiers of the supply chain, compared with global warming or terrestrial acidification impacts. This suggests that there exist hidden water hotspots outside the country. Moreover, our analysis demonstrates that screening for foreign potential hotspots is made possible by examining the magnitude of the potential impacts induced through the import of raw materials. Imported raw materials that are associated with water hotspots exist along the paths of the supply chain leading to the sector in which a significant direct impact is observed. The results indicate that some imported raw materials have large potential impacts in the WSI despite the relatively small production values induced in those sectors. Conversely, imported raw materials that are associated with large potential impacts in the GWP and DAP coincide with sectors whose production values rank at or near the top. This discrepancy between the GWP/DAP and the WSI, which is one of the most significant findings of this study, is observed across most of the 403 sectors of Japanese products (see Table S4 of the Supplementary Information). This suggests that companies need to focus on different raw materials when attempting to ameliorate the GWP/DAP and WSI impacts originating in their supply chain.
Analysis using input-output tables, i.e., IO-based LCIs, has advantages over process-based LCIs in terms of the coverage of production activities and the accessibility of data. However, as discussed in Section 1, our analysis has been based on SRIO models under the DTA, which means that the amounts of the environmental burdens of production of the imported product is assumed to be the same as the same product produced domestically. Considering these merits and limitations, the framework would be better utilized in screening foreign potential hotspots that should then be prioritized for further analysis using regionalized LCIs and characterization factors. For example, a textile product producer who procures domestically produced fiber yarns as a raw material needs to trace and, if necessary, revisit the supply chain paths including the import of raw cotton and wood chips to avoid being associate with water shortage risks in the import partner countries.
The framework described in this article has the practical benefit of allowing companies who procure a number of products or raw materials to screen the supply chain paths that should be traced to assure or enhance the sustainability of their own supply chains. This approach can also be applied to a range of other environmental and social impacts that have recently been addressed in LCA studies [36,37], by establishing unit direct interventions for each sector and characterization factors for each impact category. In particular, rather than GHG emissions whose impacts are evaluated using the global common GWP, it will be of more significance to impact categories that are largely regionally dependent or unevenly distributed, as was conspicuously the case for water resource consumption.

Supplementary Files

Supplementary File 1

Acknowledgments

This research was supported by Grants-in-Aid for Scientific Research (A) from the Japan Society for the Promotion of Science (No. 24246150 and No. 15H01750).

Author Contributions

Jun Nakatani, Kosuke Fukuchi and Yuichi Moriguchi conceived and designed the analysis; Jun Nakatani, Tamon Maruyama and Kosuke Fukuchi analyzed the data; Jun Nakatani wrote the paper. All authors read and approved the final manuscript.

Conflicts of Interest

The authors declare no conflict of interest.

References

  1. Wible, B.; Mervis, J.; Wigginton, N.S. Rethinking the Global Supply Chain. Science 2014, 344, 1100–1103. [Google Scholar] [CrossRef] [PubMed]
  2. Dooley, K.J. The Whole Chain. Science 2014. [Google Scholar] [CrossRef] [PubMed]
  3. Hellweg, S.; Milà i Canals, L. Emerging Approaches, Challenges and Opportunities in Life Cycle Assessment. Science 2014, 344, 1109–1113. [Google Scholar] [CrossRef] [PubMed]
  4. Greenhouse Gas Protocol (GHG) Protocol. Corporate Value Chain (Scope 3) Accounting and Reporting Standard. Available online: http://www.ghgprotocol.org/standards/scope-3-standard (accessed on 11 June 2015).
  5. Greenhouse Gas Protocol (GHG) Protocol. Technical Guidance for Calculating Scope 3 Emissions, Version 1.0. Available online: http://www.ghgprotocol.org/feature/scope-3-calculation-guidance (accessed on 11 June 2015).
  6. International Organization for Standardization (ISO). ISO/TR 14069: 2013, Greenhouse Gases–Quantification and Reporting of Greenhouse Gas Emissions for Organizations—Guidance for the Application of ISO 14064-1. Available online: http://www.iso.org/iso/catalogue_detail.htm?csnumber=43280 (accessed on 11 June 2015).
  7. Carbon Disclosure Project (CDP). Supply Chain Report 2013–14: Collaborative Action on Climate Risk. Available online: https://www.cdp.net/en-US/Results/Pages/Supply-Chain-Reports.aspx (accessed on 11 June 2015).
  8. European Commission (EC). Commission Recommendation of 9 April 2013 on the Use of Common Methods to Measure and Communicate the Life Cycle Environmental Performance of Products and Organisations. Available online: http://eur-lex.europa.eu/legal-content/EN/TXT/?uri=CELEX:32013H0179 (accessed on 11 June 2015).
  9. Berger, M.; Finkbeiner, M. Water Footprinting: How to Address Water Use in Life Cycle Assessment? Sustainability 2010, 2, 919–944. [Google Scholar] [CrossRef]
  10. International Organization for Standardization (ISO). ISO 14046: 2014, Environmental Management–Water Footprint–Principles, Requirements and Guidelines. Available online: http://www.iso.org/iso/catalogue_detail?csnumber=43263 (accessed on 11 June 2015).
  11. Suh, S.; Huppes, G. Methods for Life Cycle Inventory of a Product. J. Cleaner Prod. 2005, 13, 687–697. [Google Scholar] [CrossRef]
  12. Wiedmann, T. A Review of Recent Multi-Region Input–Output Models Used for Consumption-based Emission and Resource Accounting. Ecol. Econ. 2009, 69, 211–222. [Google Scholar] [CrossRef]
  13. Peters, G.P.; Hertwich, E.G. CO2 Embodied in International Trade with Implication for Global Climate Policy. Environ. Sci. Technol. 2008, 42, 1401–1407. [Google Scholar] [CrossRef] [PubMed]
  14. EXIOBASE. Available online: http://www.exiobase.eu/ (accessed on 11 June 2015).
  15. Lenzen, M.; Moran, D.; Kanemoto, K.; Geschke, A. Building Eora: A Global Multi-Region Input–Output Database at High Country and Sector Resolution. Econ. Syst. Research 2013, 25, 20–49. [Google Scholar] [CrossRef]
  16. Nansai, K.; Kondo, Y.; Kagawa, S.; Suh, S.; Nakajima, K.; Inaba, R.; Tohno, S. Estimates of Embodied Global Energy and Air-Emission Intensities of Japanese Products for Building a Japanese Input–Output Life Cycle Assessment Database with a Global System Boundary. Environ. Sci. Technol. 2012, 46, 9146–9154. [Google Scholar] [CrossRef] [PubMed]
  17. Ewing, B.R.; Hawkins, T.R.; Wiedmann, T.O.; Galli, A.; Ercin, A.E.; Weinzettel, J.; Steen-Olsen, K. Integrating Ecological and Water Footprint Accounting in a Multi-Regional Input–Output Framework. Ecol. Indic. 2012, 23, 1–8. [Google Scholar] [CrossRef] [Green Version]
  18. Hauschild, M.; Goedkoop, M.; Guinée, J.B.; Heijungs, R.; Huijbregts, M.; Jolliet, O.; Margni, M.; de Schryver, A.; Humbert, S.; Laurent, A.; et al. Identifying Best Existing Practice for Characterization Modeling in Life Cycle Impact Assessment. Int. J. Life Cycle Assess. 2013, 18, 683–697. [Google Scholar] [CrossRef]
  19. Finnveden, G.; Hauschild, M.Z.; Ekvall, T.; Guinée, J.; Heijungs, R.; Hellweg, S.; Koehler, A.; Pennington, D.; Suh, S. Recent Developments in Life Cycle Assessment. J. Environ. Manag. 2009, 91, 1–21. [Google Scholar] [CrossRef] [PubMed]
  20. Kounina, A.; Margni, M.; Bayart, J.B.; Boulay, A.M.; Berger, M.; Bulle, C.; Frischknecht, R.; Koehler, A.; Milà i Canals, L.; Motoshita, M.; et al. Review of Methods Addressing Freshwater Use in Life Cycle Inventory and Impact Assessment. Int. J. Life Cycle Assess. 2013, 18, 707–721. [Google Scholar] [CrossRef]
  21. Acquaye, A.A.; Wiedmann, T.; Feng, K.; Crawford, R.H.; Barrett, J.; Kuylenstierna, J.; Duffy, A.P.; Koh, S.C.L.; McQueen-Mason, S. Identification of ‘Carbon Hot-Spots’ and Quantification of GHG Intensities in the Biodiesel Supply Chain Using Hybrid LCA and Structural Path Analysis. Environ. Sci. Technol. 2011, 45, 2471–2478. [Google Scholar] [CrossRef] [PubMed]
  22. Pfister, S.; Bayer, P.; Koehler, A.; Hellweg, S. Environmental Impacts of Water Use in Global Crop Production: Hotspots and Trade-Offs with Land Use. Environ. Sci. Technol. 2011, 45, 5761–5768. [Google Scholar] [CrossRef] [PubMed]
  23. Miller, R.E.; Blair, P.D. Foundations of Input–Output Analysis. In Input–Output Analysis: Foundations and Extensions, 2nd ed.; Cambridge University Press: Cambridge, UK, 2009; pp. 10–68. [Google Scholar]
  24. National Institute of Environmental Studies, Japan (NIES). 3EID: Embodied Energy and Emission Intensity Data for Japan Using Input-Output Tables. Available online: http://www.cger.nies.go.jp/publications/report/d031/eng/index_e.htm (accessed on 11 June 2015).
  25. Statistics Bureau, Japan. 2005 Input–Output Tables for Japan. Available online: http://www.stat.go.jp/english/data/io/io05.htm (accessed on 11 June 2015).
  26. Nansai, K.; Moriguchi, Y.; Tohno, S. Compilation and Application of Japanese Inventories for Energy Consumption and Air Pollutant Emissions Using Input–Output Tables. Environ. Sci. Technol. 2003, 37, 2005–2015. [Google Scholar] [CrossRef] [PubMed]
  27. Ono, Y.; Horiguchi, K.; Itsubo, N. Development of Water Footprint Inventory Database Using Input-Output Analysis in Japan. J. Life Cycle Assess. Jpn. 2013, 9, 108–115. [Google Scholar] [CrossRef]
  28. Itsubo, N.; Laboratory, Tokyo City University. Database of the Amounts of Water Use & Consumption, Ver. 2. Available online: http://www.yc.tcu.ac.jp/~itsubo-lab/research/water_db.html (accessed on 11 June 2015).
  29. Intergovernmental Panel on Climate Change (IPCC). Climate Change 1995: The Science of Climate Change, Contribution of Working Group I to the Second Assessment Report of the Intergovernmental Panel on Climate Change. Available online: http://www.ipcc.ch/publications_and_data/publications_and_data_reports.shtml (accessed on 11 June 2015).
  30. Itsubo, N.; Inaba, A. LIME 2: Life-cycle Impact assessment Method based on Endpoint modeling, JLCA Newsletter, Nos. 12–17, 2012–2014. Available online: http://lca-forum.org/english/ (accessed on 11 June 2015).
  31. Interuniversity Research Centre for the Life Cycle of Products, Processes and Services (CIRAIG). WaterUseImpacts. Available online: http://www.ciraig.org/fr/wateruseimpacts.php (accessed on 11 June 2015).
  32. Boulay, A.M.; Bulle, C.; Bayart, J.B.; Deschênes, L.; Margni, M. Regional Characterization of Freshwater Use in LCA: Modeling Direct Impacts on Human Health. Environ. Sci. Technol. 2011, 45, 8948–8957. [Google Scholar] [CrossRef] [PubMed]
  33. Solomon, S.; Qin, D.; Manning, M.; Chen, Z.; Marquis, M.; Averyt, K.B.; Tignor, M.; Miller, H.L. (Eds.) Climate Change 2007: The Physical Science Basis, Contribution of Working Group I to the Fourth Assessment Report of the Intergovernmental Panel on Climate Change. Available online: http://www.ipcc.ch/publications_and_data/ar4/wg1/en/contents.html (accessed on 11 June 2015).
  34. Lenzen, M. Structural Path Analysis of Ecosystem Networks. Ecol. Modell. 2007, 200, 334–342. [Google Scholar] [CrossRef]
  35. Ministry of Finance, Japan (MOF). Trade Statistics of Japan. Available online: http://www.customs.go.jp/toukei/info/index_e.htm (accessed on 11 June 2015).
  36. Benoît Norris, C. Data for Social LCA. Int. J. Life Cycle Assess. 2014, 19, 261–265. [Google Scholar] [CrossRef]
  37. Onat, N.C.; Kucukvar, M.; Tatari, O. Integrating Triple Bottom Line Input–Output Analysis into Life Cycle Sustainability Assessment Framework: the Case for US Buildings. Int. J. Life Cycle Assess. 2014, 19, 1488–1505. [Google Scholar] [CrossRef]

