1. Introduction
Walking is the most natural form of transportation due to its inexpensiveness and accessibility to almost everyone [
1]. Growing evidence from public health has emphasized the importance of walking in promoting population-level human health [
2].
Some planning practices have been developed to encourage walking behaviors. Smart Growth, a reaction to encourage active travels, applies several land use and transportation principles at the community-level and the regional-level to promote walking behaviors [
3]. In addition, New Urbanism is an architectural and planning movement to mitigate the adverse effects from sprawl developments [
4]. In general, both practices employ strategies such as providing mixed land uses, raising residential densities, creating walkable neighborhoods,
etc. Thus, such practices have supported the importance of walkable neighborhoods that encourage walking.
The effectiveness of walkable neighborhoods, however, has to work under the premise of providing safe environments for people to walk. If the designs of environments cannot ensure the safety for pedestrians, the effort to encourage walking may cause safety threats for pedestrians and increase pedestrian-related deaths and injuries [
1].
Pedestrians have been ignored in the design of roadway systems [
5]. Such neglect exposes pedestrians to vulnerable positions when they share roads with vehicles. More than 47,700 pedestrians were killed and 688,000 were injured from 2000 to 2009 in the U.S. The number of killed pedestrians accounted for 12% of all traffic-related deaths [
6]. Thus, an understanding of potential factors causing pedestrian injuries is needed to guide the design of pedestrian-friendly environments.
A large number of studies on pedestrian crashes have focused on traffic countermeasures such as signal installations and visible crosswalks. Recently, both researchers and practitioners from urban and transportation planning have considered the importance of built environments in facilitating or constraining the likelihood of pedestrian injuries [
7]. Specifically, the influences of development patterns on pedestrian crash frequency have been emphasized and examined [
2,
8,
9,
10,
11,
12,
13]. However, few studies have investigated development patterns’ impacts on pedestrian injury severity. It should be noted that if a crash is an outcome of random errors and is inevitable, reducing the probability of being severely injured or killed for pedestrians in turn becomes an important safety goal. Therefore, it is imperative to develop and implement effective interventions to reduce the likelihood of severe pedestrian injury.
To fill this research gap, this study examines the impacts of development patterns on the probability of injury severity for pedestrians, while also considering the effects of other individual characteristics and road environments. The results provide insight in enhancing pedestrian safety through designing safe environments.
A systematic review has been conducted to identify significant factors related to the probability of injury severity for pedestrians. Accumulating evidence recognized three domains of determinants—individual characteristics, road environments, and neighborhood environments [
14,
15,
16,
17].
The impacts of individual characteristics on severity of injury have been extensively examined. Older pedestrians are more likely to be severely injured or even killed in collisions [
14,
18,
19,
20,
21,
22,
23,
24]. Younger drivers that are more likely to have risky behaviors lead to a greater fatality risk when they are involved in crashes [
19,
25,
26]. Male pedestrians who usually have more risky behaviors than females are more likely to be severely injured [
21,
27,
28,
29]. Drivers and pedestrians under the influence of alcohol behave riskily, which in turn increases the probability of injury severity [
14,
18,
19,
20,
21,
22,
25,
26]. Driver’s distraction also plays an important role. However, it is difficult to measure how this distraction reflects to driver’s behaviors [
14].
Vehicles moving straight along roadways increase the likelihood of injury severity [
14], while turning vehicles with low operating speeds result in lower probability of injury severity [
14,
25,
26]. Large and heavy vehicles (e.g., trucks, buses, trailers,
etc.), having a great amount of kinetic energy, are positively associated with severe injury. Vehicles with high travel speeds increase the probability of a pedestrian being severely injured or even killed.
The effects of road environments have also been explored in previous studies. Drivers fail to react effectively to unexpected hazards in conditions of inclement weather and in the dark [
18,
20,
21]. Crashes that occur during peak times lower the probability of injury severity for pedestrians [
23,
25,
26].
Roads with high posted speed limits are positively related to pedestrian injury severity [
19,
20,
22,
23]. Also, the number of lanes is also positively correlated with the probability of a pedestrian being severely injured [
19,
21]. The probability of severe injury for pedestrians increases when crashes occur on city streets with high annual daily traffic volume [
14]. Having traffic control devices at the crash location reduces the probability of injury severity [
20,
25,
26]. Crashes involving a pedestrian at intersections increase the probability of severe injury [
30].
The influences of neighborhood environments on injury severity for pedestrians are understudied. Studies that consider this domain focus primarily on areas around the crash location. For example, Clifton, Burnier and Akar [
18] generated 0.25-mile airline crash buffers to examine the effects of commercial uses, transit access, presence of school, and intersection density on injury severity for pedestrian–vehicle crashes. Moudon, Lin, Jiao, Hurvitz and Reeves [
14] investigated the impacts of office uses, residential units, grocery stores, retail uses, and schools from 0.5-km around crash locations.
Another possible effect of neighborhood environments may come from the broad-scale development patterns where crashes occur. Ewing and Dumbaugh [
7] asserted that development patterns (e.g., population density, street networks, transit-service density, sidewalk coverage,
etc.) affect crash severity through the traffic volumes they generate and the traffic speeds they allow. Furthermore, Huang and Abdel-Aty [
31] also proposed a conceptual framework and mentioned that the characteristics of geographic regions (e.g., population, socio-economic features, spatial features,
etc.) could affect traffic safety situations. Thus, the importance of this contextual factor has been emphasized.
Few studies considered the impacts of contextual factors. Clifton, Burnier and Akar [
18] investigated the effects of population density and median income of census block groups where crashes occurred on pedestrian injury severity and found that both had no significant impacts. However, this study ignored the multilevel data structure. Previous studies have identified the existence of hierarchical data structures in examining traffic safety [
31,
32,
33,
34]. Without considering this, it is possible to generate biased estimates, produce incorrect standard errors, and lead to overestimation [
35].
2. Methods
This study included pedestrian–vehicle crashes (2008–2012) that occurred in the city of Austin, Texas, USA. The population density in Austin is 6.8 persons per acre and the percentage of population under the age of 18 is 22.1%. Austin is much smaller than New York and Los Angeles (population density in New York and Los Angeles is 42.21 and 12.64 persons per acre). The city features diverse physical environmental characteristics, ranging from inner-city neighborhoods with high density and well-connected street networks to suburban neighborhoods with low density and low street connectivity.
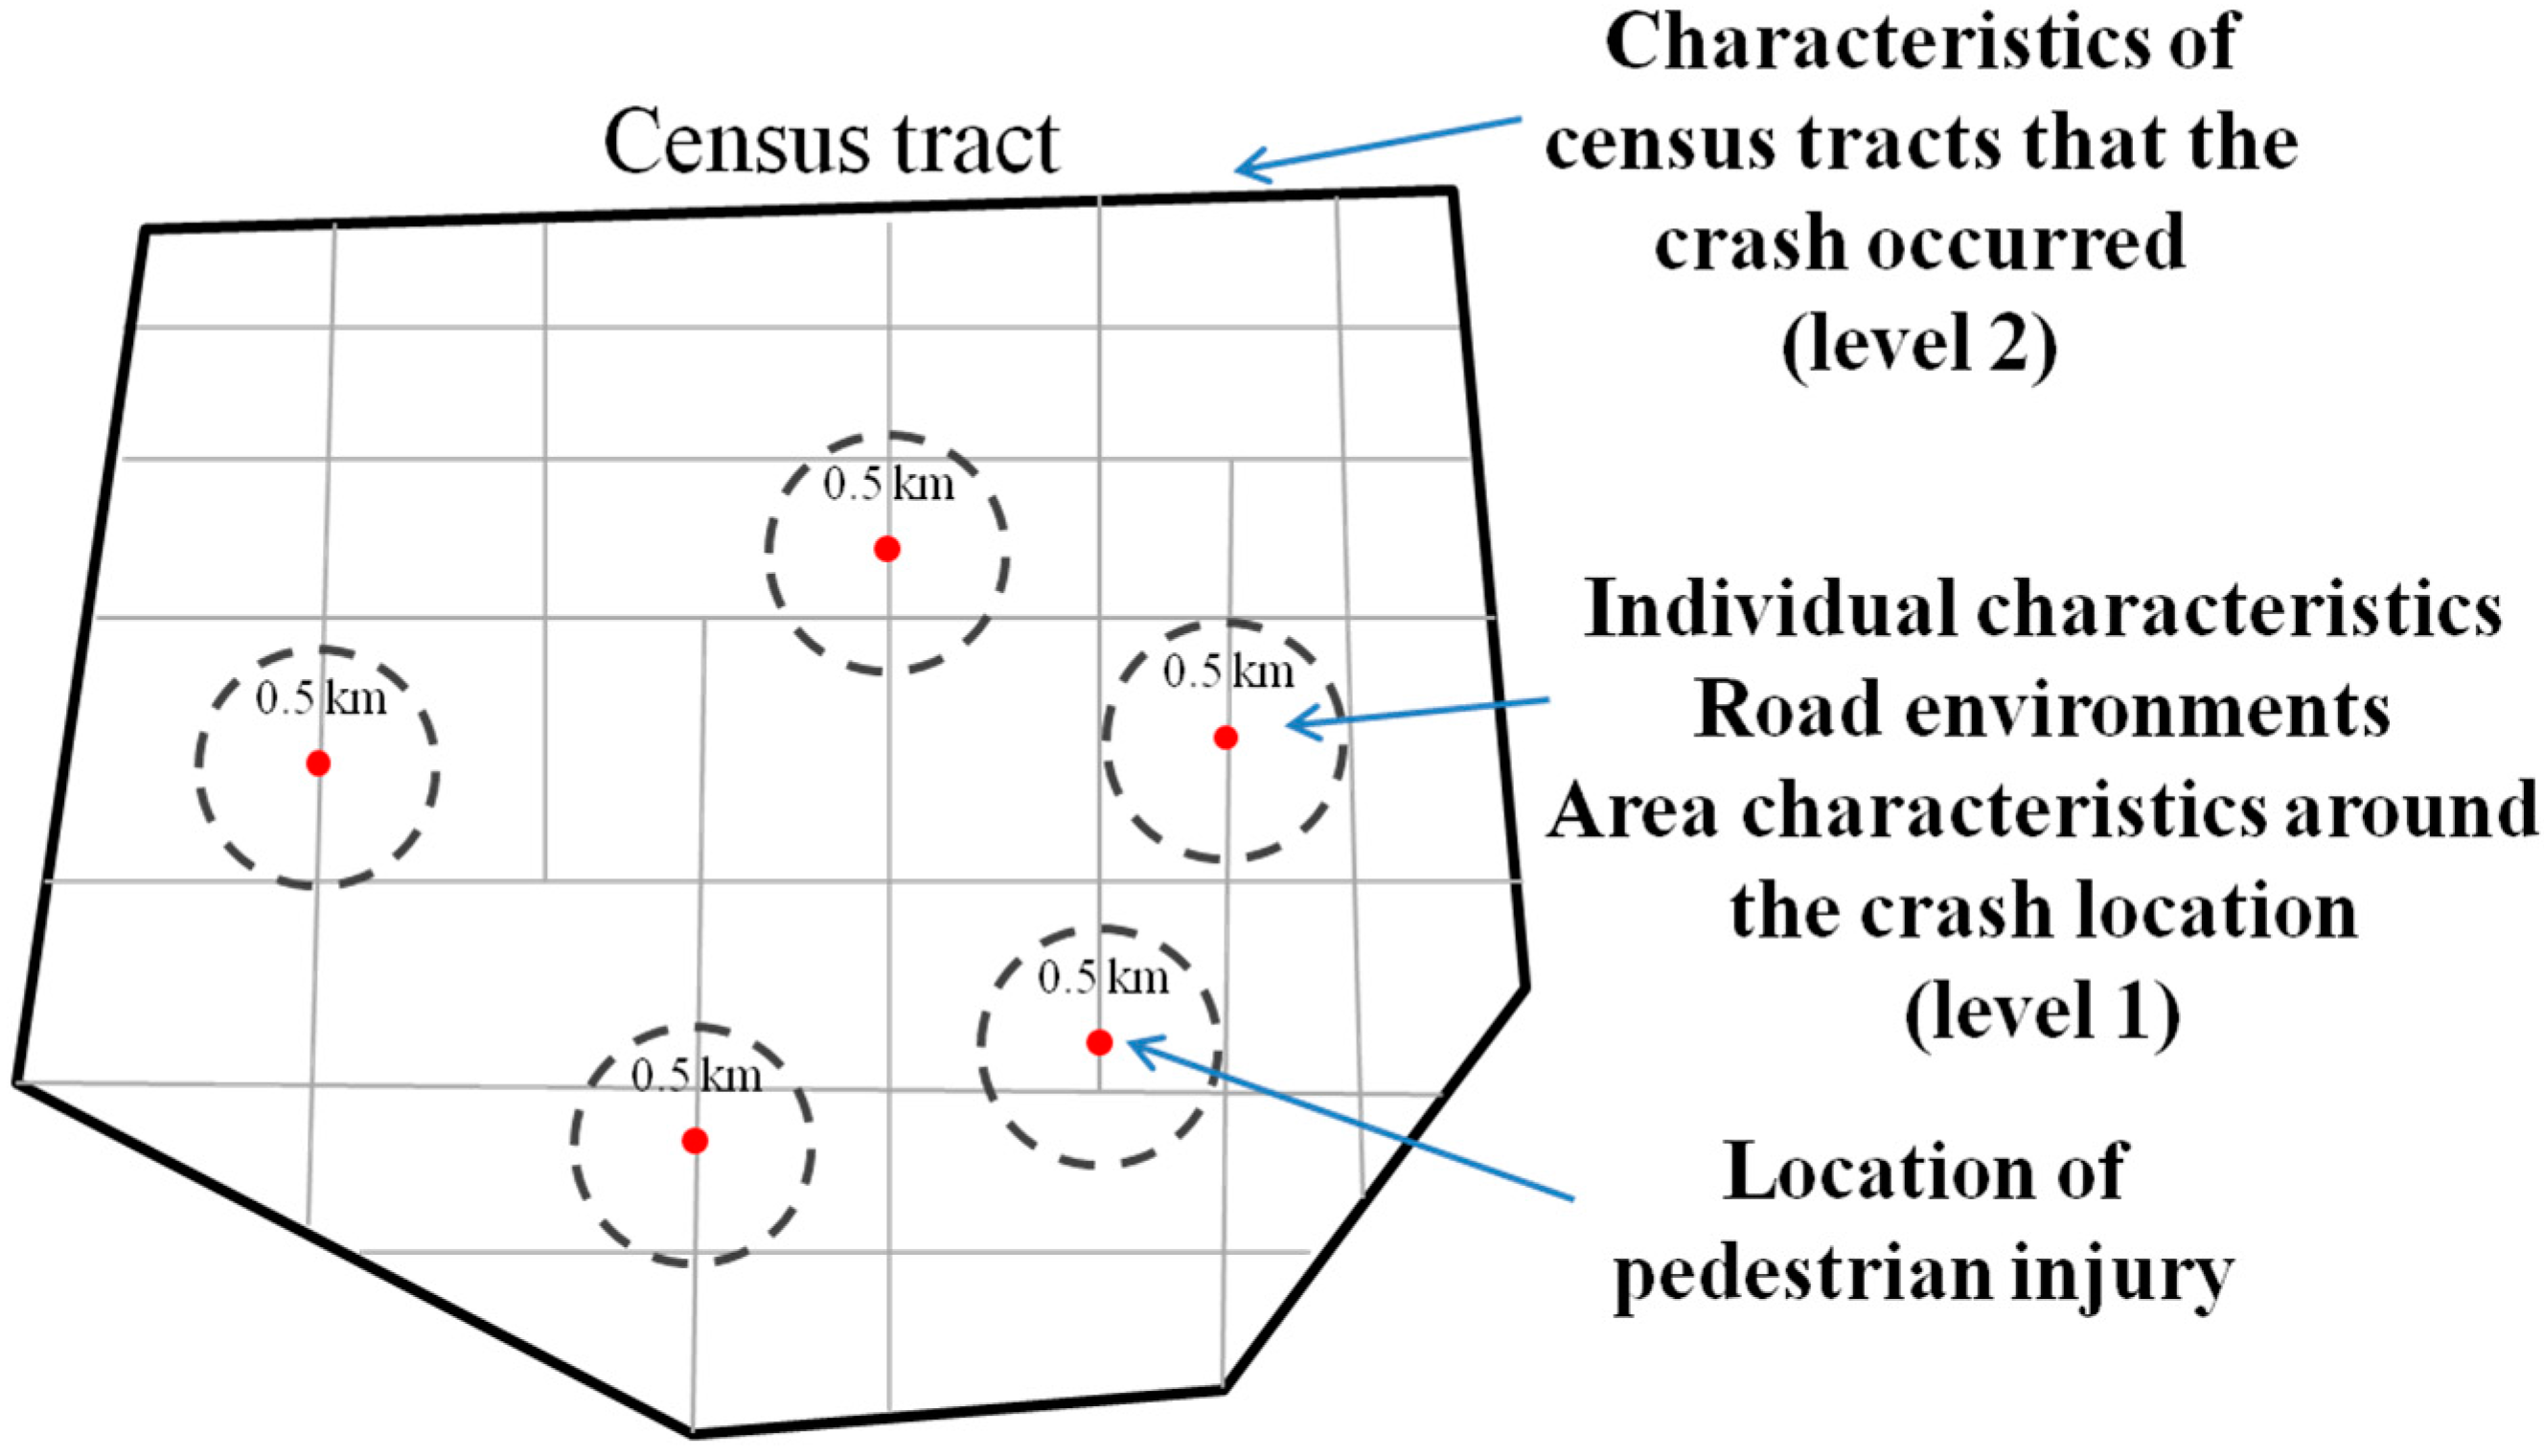
In order to consider the effects of contextual factors and test that whether these factors should be modeled at different hierarchy from other variables (individual characteristics, road environments, area characteristics around the crash location), this study considered two hierarchical levels: individual level and contextual level (
Figure 1).
Figure 1.
The hierarchical structure of level 1 and level 2 factors.
Figure 1.
The hierarchical structure of level 1 and level 2 factors.
To obtain accurate socio-demographic information and have enough variations, three geographic units were considered for the contextual level—census tracts, census block groups, and traffic analysis zones. Because some socio-demographics were not provided in census block groups and traffic analysis zones in the 2010 census data (e.g., education level, median income, etc.), this study used census tracts as the second level of the hierarchy. In total, 1407 pedestrian–vehicle collisions were nested in 140 census tracts in Austin.
2.1. Data Sources
The five-year (2008–2012) crash data came from the Texas Department of Transportation (TxDOT). This data offered crash severity within five classes—the KABCO scale (K = killed injury, A = incapacitating injury, B = non-incapacitating injury, C = possible injury, and O = no injury), the types of crash (pedestrian–vehicle, vehicle–vehicle, fixed-object–vehicle, etc.), the age and gender of pedestrians and drivers that were involved in the crash, vehicle types that were involved in the crash, vehicle actions when the crash occurred, the time of day where the crash occurred, posted speed limits at the crash location, whether the crash occurred at an intersection or not, the weather condition, light condition, surface condition, and traffic control devices when the crash occurred, and the road class, number of lanes, and median width at the crash location. This study geo-coded these collisions based on the longitude and latitude where the crash occurred, which was provided by the data.
The parcel-level land use, street centerline, and sidewalk data came from the city of Austin GIS Datasets. Land use data provided several land use classifications including residential uses, commercial uses, office uses, open space, school uses, and others. The traffic volume data of major highways and regional arterials were collected from the TxDOT, and arterials and local roads were collected from the city of Austin. The transit stop data came from the website of Capital Metro—Austin Public Transit, which provided the location of transit stops. For the socio-demographic information of census tracts, this study used the 2010 census data.
2.2. Variables and Measurements
2.2.1. Dependent Variables
This study estimated the pedestrian injury severity involved in crashes with vehicles. In total, 1407 pedestrians were involved with vehicles between 2008 and 2012 in the city of Austin. In terms of the injury severity, around 5.76% of them were fatal injuries, 15.42% were incapacitating injuries, 49.54% were non-capacitating injuries, 21.89% were possible injuries, and 7.39% had no injuries (
Table 1). From this category, ordered models were applied to consider the ordered nature of this dependent variable. Moreover, in order to test the stability of results, this study aggregated injury severity into two classes as the dependent variable—fatal/high injury severity by combining categories K and A and low/no injury severity by aggregating categories B, C, and O. Although this approach may lose some information of injury severity, it would still be feasible strategy to produce valid estimates. Previous studies also used this approach to examine injury severity [
14,
36].
Table 1.
The number and percentage of crashes with different injury severity.
Table 1.
The number and percentage of crashes with different injury severity.
| | Number | Percent (%) |
|---|
| Fatal injury (K) | 81 | 5.76 |
| Incapacitating injury (A) | 217 | 15.42 |
| Non-incapacitating (B) | 697 | 49.54 |
| Possible injury (C) | 308 | 21.89 |
| No Injury/Property Damage Only (O) | 104 | 7.39 |
| Total | 1407 | 100 |
2.2.2. Independent Variables
From the systematic literature review, this study considered three domains of factors—individual characteristics, road environments, and neighborhood environments—to examine pedestrian injury severity (
Table 2).
Individual characteristics included socio-demographics of pedestrians and drivers and vehicle characteristics. Socio-demographics considered the age and gender of pedestrians and drivers, while vehicle characteristics included vehicle actions (whether vehicles went straight, turned right, or turned left when the crash occurred) and vehicle types (whether it was a large vehicle (e.g., truck, bus, and trailer) involved in the crash or not).
Road environments considered roadway designs and traffic characteristics. This study included the weather condition, light condition, surface condition, having traffic control devices or not, time of the day when the crash occurred, posted speed limits, road class, number of lanes, median width, annual daily traffic (ADT) volume where the crash occurred, and whether the crash occurred at an intersection or not.
This study considered two different neighborhood environments: area characteristics around the crash location and characteristics of census tracts where the crash occurred. Environmental variables were captured by objective measurements.
Table 2.
Variable list, their measurements, and descriptive statistics.
Table 2.
Variable list, their measurements, and descriptive statistics.
| Variables | Measurements | Mean (S.D.) or % |
|---|
| Dependent Variable | |
| KABCO scale | 5 = fatal injury; 4 = incapacitating injury;
3 = non-incapacitating injury; 2 = possible injury;
1 = no injury | See Table 1 |
| Fatal/high injury severity | 1 = fatal and incapacitating injury; 0 = non-incapacitating, possible, and no injury | 21.2% |
| Independent Variables | |
| Individual Characteristics | |
| Pedestrian age | Continuous (year) | 32.16 (19.24) |
| Pedestrian gender | 1 = male; 0 = female | 58.6% |
| Driver age | Continuous (year) | 31.36 (21.56) |
| Driver gender | 1 = male; 0 = female | 51.6% |
| Driver vehicle action | | |
| Going straight | 1 = yes; 0 = no | 63.0% |
| Turning right | 1 = yes; 0 = no | 7.5% |
| Turning left | 1 = yes; 0 = no | 23.2% |
| Vehicle types | 1 = large vehicle (e.g., truck, van, bus, and trailer); 0 = other | 41.2% |
| Road Environments | |
| Time that the crash occurred | 1 = peak time (6–9 am, 4–7 pm); 0 = off-peak time | 33.5% |
| Posted speed limit | Continuous (MPH [miles per hour]) | 32.76 (27.54) |
| The crash occurred at an intersection or not | 1 = yes, at intersection; 0 = no | 43.0% |
| Weather condition | 1 = inclement weather (rain, snow, fog, cloudy); 0 = clear | 49.8% |
| Light condition | 1 = dark; 0 = daylight, dawn, and dusk | 40.7% |
| Surface condition | 1 = wet, ice, snow, sand, mud, dirt, slush, standing water; 0 = dry | 8.4% |
| Traffic control device | 1 = having (signal light, crosswalk, warning sign, stop sign, yield sign, marked lane); 0 = none | 52.8% |
| Road class | | |
| Interstate | 1 = yes; 0 = no | 7.3% |
| Highways | 1 = yes; 0 = no | 11.9% |
| City streets | 1 = yes; 0 = no | 76.8% |
| Number of lanes | Continuous | 3.57 (0.76) |
| Median width | Continuous (feet) | 8.66 (22.37) |
| Annual daily traffic (ADT) volume | Continuous | 22,393.72 (13,336.79) |
| Neighborhood Environments | |
| Area Characteristics Around the Crash Location | |
| Sidewalk density | (Sidewalk length)/(street length × 2) in 0.5 km crash buffer | 0.71 (0.20) |
| Three-leg intersections | # of three-leg intersections/area of 0.5 km crash buffer (acres) | 0.10 (0.06) |
| Four-or-more-leg intersections | # of four-or-more-leg intersections/area of 0.5 km crash buffer (acres) | 0.08 (0.08) |
| Transit stops | # of transit stops/area of 0.5 km crash buffer (acres) | 0.07 (0.06) |
| Commercial areas | % of commercial area in 0.5 km crash buffer (acres) | 0.14 (0.13) |
| Office use | % of office area in 0.5 km crash buffer (acres) | 0.09 (0.13) |
| Industrial use | % of industrial area in 0.5 km crash buffer (acres) | 0.06 (0.14) |
| Schools | % of school area in 0.5 km crash buffer (acres) | 0.15 (0.17) |
| Parks | % of park area in 0.5 km crash buffer (acres) | 0.13 (0.29) |
| Characteristics of Census Tracts | |
| Sidewalk density | (Sidewalk length)/(street length × 2) in tract | 0.64 (0.16) |
| Three-leg intersections | # of three-leg intersections/tract area (acres) | 0.10 (0.05) |
| Four-or-more-leg intersections | # of four-or-more-leg intersections/tract area (acres) | 0.07 (0.06) |
| Transit stops | # of transit stops/tract area (acres) | 0.05 (0.04) |
| Commercial areas | % of commercial area in tract | 0.11 (0.08) |
| Office use | % of office area in tract | 0.09 (0.11) |
| Industrial use | % of industrial area in tract | 0.05 (0.09) |
| Schools | % of school area in tract | 0.10 (0.11) |
| Parks | % of park area in tract | 0.09 (0.10) |
| Average annual daily traffic (ADT) volume | Average ADT in tract | 21,620.50 (11,082.72) |
| Average posted speed limit | Average speed limit in tract (MPH [miles per hour]) | 13.42 (11.85) |
| Population density | # of population/tract area (acres) | 8.78 (6.86) |
| Employment density | # of employment/tract area (acres) | 4.56 (2.96) |
| Non-white populations | # of non-white population/total population | 0.32 (0.18) |
| Population with education level less than high school | # of population less than high school/total population | 0.14 (0.11) |
| Median income | Continuous (US dollar) | 48,618.81 (22,374.05) |
With respects to area characteristics around the crash location, this study generated 0.5 km airline buffers around the crash location. This buffer size has been recognized as a common pedestrian travel catchment area in previous studies [
14,
37]. This study included the effects of sidewalks, street connectivity (densities of three-leg intersections and four-or-more-leg intersections, respectively), transit stops, and traffic-generating uses (e.g., commercial uses, office uses, industrial uses, school uses, and parks) that were identified as significant correlates of walking trips from previous studies [
38,
39].
For characteristics of census tracts, this study included not only the aforementioned environment variables in measuring the area characteristics around the crash location but also area’s socio-demographics, such as population density, employment density, percent of non-white populations, percent of population with education level less than high school, and median income. In addition, traffic characteristics for census tracts (e.g., area’s average ADT and area’s average posted speed limit) were also included.
This study classified these factors into individual-level (level-1) and contextual-level (level 2). The individual characteristics, road environments, and area characteristics around the crash location act as the level-1 variables, while the characteristics of census tracts where the crash occurred represent the level-2 predictors.
2.3. Data Analysis
This study developed two ordered logistic models (the single-level ordered logistic model and the multi-level ordered logistic model) and two binomial logistic models (the single-level binomial logistic model and the multi-level binomial logistic model). Order logistic models were utilized to explore the five KABCO categories of injury severity, while binomial logistic models were applied to examine fatal/high and no injury/low pedestrian injury severity categories. All models were predicted by individual characteristics, road environments, area characteristics around the crash location, and characteristics of census tracts. For the single-level model, all aforementioned factors were models in the same level, while characteristics of census tracts were modeled as level-2 predictors in the multi-level model.
Among the multilevel analysis, random-intercept models have been applied in previous studies. For example, Kim, Lee, Washington and Choi [
33] estimated random-intercept models to examine the probability that a type of crash will occur by using crash-level (level-1) and intersection-level (level-2) predictors. Huang, Chor and Haque [
34] also employed random-intercept models to explore driver injury severity and vehicle damage at signalized intersections. Although these models only considered varying intercepts and assumed that slope coefficients did not vary across level-2 units, this study still used random-intercept models to avoid the possibility of excess complexity and nonconvergence [
40].
Because of limited space, this study only introduced multi-level binomial logistic models and how these models applied to the data structure. For the information regarding multi-level ordered logistic models, please refer to Snijders and Bosker [
40].
The variance of level-1 residuals for binomial logistic distribution is π
2/3 = 3.29, while the intercept variance of level-2 binomial logistic random-intercept model is
[
40]. The intra-class correlation coefficient (ICC) is calculated by these two variances to examine the average correlation between subjects within a group.
Maas and Hox [
41] suggest a design effect to examine whether the multilevel model is necessary. If the value of the design effect is higher than 2, using single level analysis may lead to biased results.
A multilevel binomial logistic model for pedestrian injury severity is formulated as follows:
and
where
pij is the probability of a pedestrian being severely injured or killed;
γ00 is the intercept;
Wqj is a vector of contextual-level variables;
Xpj is a vector of individual-level variables; γ
0q and γ
p0 are regression coefficients of contextual-level variables and individual-level variables, respectively; and
u0j is the random effect at level-2, where
u0j~N(0,
).
The purpose of this study is to compare the effects of contextual factors that modeled at the same level and the different level with individual characteristics, road environments, and area characteristics around the crash location on pedestrian injury severity. This study first generated a base model that only included significant variables of individual characteristics, road environments, and area characteristics around the crash location. Second, characteristics of census tracts were added to the base model at the same level or the different level, respectively. Final models were estimated by removing insignificant variables of characteristics of census tracts to generate parsimonious models. Because of the potential multicollinearity issue, this study used the approach “mean center” for all independent variables by subtracting the mean of that independent variable from each observation for that variable [
42]. The estimation of the models was performed using HLM 7.0.
3. Results and Discussion
Table 3 presents the final estimated results for the probability of a pedestrian being severely injured or killed from the single-level binomial logistic model and the multi-level binomial logistic model. The findings from ordered logistic models (data not shown) were consistent with those from binomial logistic models, which indicated that the results were stable even using different modeling approaches for dependent variables.
Table 3.
Final estimated results of the single-level binomial logistic model and the multi-level binomial logistic model.
Table 3.
Final estimated results of the single-level binomial logistic model and the multi-level binomial logistic model.
| Variable | Coefficient | S.E. | Odds Ratio (95% CI) | Coefficient | S.E. | Odds Ratio (95% CI) |
|---|
| | Single-level Binomial Logistic Model (n = 1407) | Multi-level Binomial Logistic Model (n = 1407) |
| | Dependent Variable—Fatal/high Injury Severity |
| Fixed Part | | | | | | |
| Intercept (γ00) | −7.53 ** | 1.56 | 0.001 (0.0008, 0.03) | −4.15 ** | 0.36 | 0.02 (0.007, 0.03) |
| Individual Characteristics | Level 1 | Level 1 |
| Pedestrian age (year) | 0.02 ** | 0.01 | 1.02 (1.002, 1.04) | 0.02 ** | 0.01 | 1.02 (1.002, 1.04) |
| Turn left (1 = yes, 0 = no) | −1.19 ** | 0.37 | 0.30 (0.26, 0.35) | −1.26 ** | 0.38 | 0.28 (0.22, 0.33) |
| Road Environments | Level 1 | Level 1 |
| The crash occurred at an intersection or not (1 = yes, 0 = no) | −1.17 ** | 0.29 | 0.31 (0.23, 0.40) | −1.24 ** | 0.30 | 0.29 (0.22, 0.36) |
| Weather condition (1 = inclement weather, 0 = clear) | −0.73** | 0.24 | 0.48 (0.42, 0.53) | −0.73 ** | 0.25 | 0.48 (0.42, 0.52) |
| Light condition (1 = dark, 0 = daylight, dawn, and dusk) | 1.17 ** | 0.29 | 3.22 (3.05, 3.38) | 1.19 ** | 0.25 | 3.29 (3.11, 3.48) |
| Traffic control device (1 = have, 0 = none) | −3.73 ** | 0.35 | 0.02 (0.01, 0.03) | −3.84 ** | 0.37 | 0.02 (0.01, 0.03) |
| Posted speed limit (MPH) | 0.15 ** | 0.01 | 1.17 (1.05, 1.31) | 0.16 ** | 0.01 | 1.17 (1.05, 1.30) |
| Neighborhood Environments | | | |
| Area Characteristics around the Crash Location | Level 1 | Level 1 |
| Sidewalk density in 0.5 km buffer (%) | −0.72 ** | 0.92 | 0.48 (0.35, 0.61) | −0.73 ** | 0.94 | 0.48 (0.35, 0.61) |
| Characteristics of Census Tracts | Level 1 | Level 2 |
| Sidewalk density (%) | −3.59 ** | 1.22 | 0.03 (0.01, 0.05) | −3.21 ** | 1.46 | 0.04 (0.01, 0.07) |
| Density of four-or-more-leg intersections (#/acres) | 4.38 * | 4.42 | 79.84 (65. 43, 94,56) | 3.43 | 5.48 | 30.88 (11.47, 48.85) |
| Density of transit stops (#/acres) | −4.42 * | 6.45 | 0.01 (0.005, 0.02) | −3.11 | 8.06 | 0.04 (0.01, 0.08) |
| % of commercial uses | −2.22 ** | 1.51 | 0.11 (0.03, 0.18) | −2.29 ** | 1.89 | 0.10 (0.01, 0.19) |
| % of school use | 1.78 * | 1.48 | 5.91 (5.78, 6.03) | 2.28 | 1.78 | 9.78 (9.54, 9.98) |
| % of park use | 1.65 * | 1.38 | 5.22 (5.03, 5.39) | 1.91 | 1.63 | 6.75 (6.02, 7.46) |
| Population density (#/acres) | 0.12 ** | 0.06 | 1.13 (1.04, 1.21) | 0.12 ** | 0.07 | 1.13 (1.04, 1.21) |
| Random Part | | | | | | |
| Between-group Intercept | | | | 0.56 ** | | |
| Within-group | | | | 3.29 | | |
| ICC | | | | 0.15 | | |
| Design effect | | | | 2.37 | | |
| AIC | 566.61 | | | 487.56 | | |
In terms of the impacts of individual characteristics, road environments, and area characteristics around the crash location, pedestrians were more likely to be severely injured when crashes involved older pedestrians, when crashes occurred in the dark, and when crashes occurred on roads with higher posted speed limits. On the other hand, the probability of being severely injured or killed for pedestrians lowered when vehicles turned left, when crashes occurred at intersections, when crashes occurred under inclement weather conditions, when there were traffic control devices at the crash location, and when crashes occurred at areas with more sidewalks. One interesting finding is the weather condition. It is expected that inclement weather conditions may provide poor visibility for drivers, a situation that may increase the crash risk. However, because this study focuses on pedestrian injuries, it may be also expected that people do not walk during inclement weather conditions.
To check whether multilevel analysis fits the dataset, this study calculated the ICC based on Equation (1) and the design effect from Equation (2). The ICC was 0.15, indicating that approximately 15% of the total variation was explained by between-census tract variations. This also implied that characteristics of census tracts may significantly affect pedestrian injury severity. In terms of the design effect, the average number of crashes in each census tract was 10.15. The value of design effect was 2.37, which was higher than 2, suggesting that using single-level analysis for this study may result in biased results. Moreover, this study also applied the Akaike Information Criterion (AIC) to compare the performance of the single-level model and the multi-level model (the lower the value of AIC is, the better the model is). The result showed that the multi-level model (binomial logistic: 487.56; ordered logistic: 512.41) was preferred over the single-level model (binomial logistic: 566.61; ordered logistic: 585.47).
Sidewalk density, the percentage of commercial uses, and population density were all significant in both single-level and multi-level models to show the influence of characteristics of census tracts. An interesting finding is that the standard errors of characteristics of census tracts in the single-level model were smaller than those in the multi-level model. Furthermore, four variables (density of four-or-more-leg intersections, density of transit stops, % of school use, and % of park use) were significant by at least the 5% level in the single-level model but not significant in the multi-level model.
The results showed individual characteristics and road environments provided more contribution to the injury severity of pedestrians than neighborhood environments. In terms of individual characteristics, this study confirmed that older pedestrians with more vulnerable, physical conditions were more likely to suffer severe injury [
14,
18,
19,
21]. It was 72% less likely to be severely injured when the crash involved a left-turning vehicle. It may be attributable to vehicle speeds. Vehicles generally have lower travel speeds when making turns than moving along straight roadways [
14,
25,
26].
For road environments, although street intersections act as dangerous spots for pedestrians to cross, vehicles tend to slow at intersections. The likelihood of being severely injured or killed for pedestrians when crashes occurred at intersections was lower than those that did not occur at intersections.
The likelihood of being severely injured for pedestrians was 98% less likely when crashes occurred at places with traffic control devices than places without any traffic control device. Traffic control devices may force drivers to slow, which lowers the safety threats for pedestrians. Previous studies also supported this result [
20,
25,
26].
Traffic speeds are the primary predictors for injury severity. This study found that crashes occurring on roads with high posted speed limits increased the probability of severe injury for pedestrians. Generally, vehicles with high operating speeds offer drivers less time to react to unexpected hazards and increase the severity of injury [
19,
20,
23].
The main contribution of this paper is the hierarchical examination of development patterns (characteristics of census tracts) on pedestrian injury severity. This study adds to previous research that four contextual variables produce spuriously significant results when modeling them at the same level with other factors. These spurious relationships may overestimate the influence of environmental interventions based on these four variables. One important consequence of ignoring hierarchical data structure is the underestimation of standard errors [
43]. Some variables in the characteristics of census tracts (
i.e., density of four-or-more-leg intersections, density of transit stops, the percentage of school use, and the percentage of park use) that were significant in the single-level model were no longer significant in the multi-level model. Thus, this study demonstrates that the multi-level model is needed due to the hierarchical structures of traffic safety data.
From the multi-level model, pedestrians were more likely to be severely injured in areas with high population densities. High population density areas experience more pedestrian activities and more traffic volume, thus increasing traffic conflicts [
8,
44,
45]. In addition, areas with high sidewalk densities decreased injury severity for pedestrians. Connected sidewalks provide a safe space for pedestrians moving along the sides of streets rather than sharing roads with vehicles [
46], which generates fewer conflicts between pedestrians and vehicles and reduces injury severity. Furthermore, areas with more commercial uses had low probability of injury severity for pedestrians. Although commercial uses could lead to more vehicle miles and pedestrian activities, vehicles usually operate in lower speeds when they cross commercial areas. Two studies in North Carolina [
25,
26] also found that the presence of commercial uses decreased the probability of incapacitating injury.
Overall, this study revealed that individual characteristics and road environments explained pedestrian injury severity more than neighborhood environments because only three neighborhood environmental variables were significantly associated with injury severity. Thus, policy interventions in lowering the probability of injury severity for pedestrians should pay greater attention to individual behaviors and roadway designs: providing traffic control devices at intersections to offer safe-crossing environments and reducing posted speed limits of roads that pedestrians share with vehicles. Furthermore, safety programs should focus more on the provision of connected sidewalk networks and on populated areas.
4. Conclusions
This study examined the impacts of individual characteristics, road environments, area characteristics around the crash location, and characteristics of census tracts on the probability of injury severity for pedestrians. Moreover, this study considered the hierarchical safety data structure by including individual characteristics, road environments, and area characteristics around the crash location as level-1 factors and characteristics of census tracts as level-2 predictors.
The findings of this study indicated the need for using multilevel analysis in this study. The model results revealed that sidewalk density, the percentage of commercial uses, and population density in census tracts were significant correlates. Safety programs may need to target areas with high population densities and provide connected sidewalk networks.
This study has a few limitations that need to be addressed. In terms of area characteristics of the crash location, this study only examined objective measurements of neighborhood environments. Future studies are needed to include micro-level features of neighborhood environments, such as the maintenance and quality of traffic infrastructures and neighborhood facilities, by field audits. Furthermore, because this study examined whether contextual factors should be modeled at different level from other factors, the author only explored a two-level hierarchy: individual-level and contextual-level. Previous studies have mentioned that there are several hierarchies existing in traffic safety data [
32,
33,
34]: drivers’ and pedestrians’ characteristics are nested within each crash, crash characteristics are nested within areas around the crash location, area characteristics around the crash location are nested within regional characteristics, and so on. Future research is suggested to handle this complex data structure if the model could obtain convergent results. In addition, this study applied random-intercept models. It is possible that cross-level interaction effects may exist among variables on different levels. Researchers could apply random-slope models to consider this.
Overall, pedestrian injury severity has been and will continue to be an important topic for the fields of urban planning, transportation planning, and public health. This study is a preliminary step toward understanding the influence of development patterns on pedestrian injury severity and demonstrating the need for more detailed studies in this field.


