1. Introduction
The concept of a Zero Energy Building (ZEB) has garnered significant attention as a solution for reducing global greenhouse gas emissions and responding to global warming.
In a report written in 2006 by Torcellini
et al., the authors used the following general definition for a ZEB given by The U.S. Department of Energy (DOE) Building Technologies Program: “A net zero energy building (NZEB) is a residential or commercial building with greatly reduced energy needs through efficiency gains such that the balance of energy needs can be supplied with renewable technologies” [
1]. The term “net” indicates a balance between energy supplied by the electrical grid system to augment energy produced by a Renewable Energy System (RES), and energy transmitted to the electrical grid system produced as surplus energy by the RES [
2]. In 2010, the European Parliament enacted a building energy comprehensive roadmap called the Energy Performance of Building Directive (EPBD). The EPBD set the goals of a 20% reduction in greenhouse gas emissions and energy consumption by 2020, 20% expansion of renewable energy propagation by 2020, and enforcing application of nearly Zero Energy Building (nZEB) for all new buildings by 2021. nZEB is defined in the EPBD as “The nearly zero or very low amount of energy required should be covered to a very significant extent by energy from renewable sources, including energy from renewable sources produced on-site or nearby” [
3].
Through the International Energy Agency (IEA) Solar Heating and Cooling Programme (SHC) Task 13 from June 1989 to June 1994, zero-energy solar house technology development and propagation was jointly pursued by 16 nations over a five-year period [
4]. Additionally, 18 countries participated in the IEA SHC/EBC Task 40/Annex 52 from October 2008 to September 2013 on the subject of “Net Zero Energy Solar Buildings” [
5], and numerous studies were conducted to establish international standardization of the NZEB definition [
6,
7,
8,
9].
Voss [
10] reported on the status and outlook of low-energy to net zero energy buildings and analyzed the factors that affect energy balance. Studies on various energy calculation methods and load matching for NZEB definition were also performed [
11,
12,
13]. Optimization tools and methods for NZEB design were comprehensively reviewed [
14,
15,
16,
17]. Meanwhile, based on conventional international standards and design model cases, the influences of NZEB passive elements and occupant behavior patterns on energy consumption and generation were analyzed [
18,
19,
20]. In addition, the application sites of renewable energy such as glazed balconies, solar walls, and solar collectors were analyzed through remodeling demonstration buildings evaluated between 1995 to 1998 [
21]. In addition, the interaction between the building load matching and grid as a part of Subtask A of the Task 40/Annex 52 was analyzed through various case studies [
22]. Among the NZEB cases, a study assessed the performance of the EcoTerra House in Canada, where it was found that its energy consumption was approximately 12.4% of that of regular Canadian homes [
23,
24,
25]. Research on the NZEB design method and tools, innovative solutions, and energy monitoring methods has been conducted, as well as investigation of the NZEB status of France [
26,
27]. Through these studies, it was found that the Enerpos building consumed 10 times less energy than the standard building [
28]. Heinze [
29] monitored settlements in Freiburg, Germany, and analyzed their energy consumption and generation. The heating area and PV installation area, capacity, heating and electricity energy consumption, and total energy demand for each case were shown. In one study, the design process of the Solar XXI building was introduced as a part of the IEA project and the building was reported to have an energy performance 10 times greater than that of a traditional newly constructed office building [
30]. Additionally, research on renewable energy systems applied to each case was conducted, and it was concluded that the photovoltaic thermal mechanical ventilation with heat recovery
(PV/T MVHR) system is a major means to achieve net zero energy in cold climates [
31]. Another study applied a conventional thermal system and a combined heat and power
(CHP) integrated biomass system and analyzed to what degree NZEB was satisfied [
32]. A study on the PV design method for zero energy was also performed [
33,
34]. Case study based analysis research has been diversely pursued regarding renewable energy status and building load aspects for each NZEB.
The electricity energy demand for a NZEB can be relatively greater than the thermal energy demand due to the high insulation and high airtight envelope. In this regard, electricity generation via a PV system is essential for a NZEB, and the building integrated photovoltaic (BIPV) system plays an important role for NZEB in terms of functionality and aesthetics. In this study, the renewable energy application status of NZEB cases was investigated and a case study of the PV system application was analyzed. To this end, the “Net Zero Energy Solar Buildings” cases of the joint international project IEA SHC Task 40/Annex 52 were analyzed and, among them, the cases with a PV system applied were analyzed regarding the PV installation type, cell type, and PV power production. Additionally, the analysis results were used to perform a comparative analysis of the electricity energy demand and generation for PV-applied NZEB.
2. IEA SHC/EBC Task 40/Annex 52 Database
IEA SHC/EBC Task 40/Annex 52 is composed of three subtasks. Subtask A develops the international standard of the existing NZEB definition and concept along with monitoring and guide for NZEB verification. Subtask B pertains to the NZEB design tools and simulation, providing the design priorities, detailed design rules, and guide for NZEB. Subtask C concerns advanced building design and technology for the purpose of development and testing of technologies that provide the foundation for construction and demonstration projects and joint international projects. In addition, related studies have been conducted including the construction of an NZEB database.
In this study, 30 cases of the IEA SHC/EBC Task 40/Annex 52 were categorized by country, building use, climate, and renewable energy application.
Table 1 [
6] shows an overview of NZEB cases and these were cases selected based on the following criteria:
- (1)
Innovative solution sets and/or innovative technologies clearly identified for each project (ventilation/daylighting/architectural integration);
- (2)
Net ZEB Lessons learned (feedback from architect/builder);
- (3)
Net ZEB Energy performance < 50% standard buildings (primary and final energy);
- (4)
Energy supply/integration of renewable energy;
- (5)
Monitoring mandatory (energy measurements);
- (6)
Mismatch management (nearly or net ZEB);
- (7)
Indoor environment data (temperature, humidity, illuminance, etc.).
Table 1.
Overview of net zero energy building (NZEB) cases for International Energy Agency Solar Heating and Cooling Programme (IEA SHC)/Energy in Buildings and Communities Programme (EBC) Task 40/Annex 52.
Table 1.
Overview of net zero energy building (NZEB) cases for International Energy Agency Solar Heating and Cooling Programme (IEA SHC)/Energy in Buildings and Communities Programme (EBC) Task 40/Annex 52.
| Building use | Building name | Location | Climate | Renewable Energy |
|---|
| PV | ST | Wind | GT | Biomass | Biomass CHP |
|---|
| Residential | Casa Zero Energy House | Italy | HCD | √ | √ | | √ | | |
| Kraftwerk B | Switzerland | HD | √ | √ | | | √ | |
| Energy Flex House | Denmark | HCD | √ | √ | | √ | | |
| Single Family Building(Riehen) | Switzerland | HD | √ | √ | | √ | | |
| Riverdale | Canada | HD | √ | √ | | | | |
| Solarsiedlung am Schlierberg | Germany | HD | √ | | | | | √ |
| “Le Charpak”, IESC Cargese | France | HCD | √ | √ | √ | | | |
| Plus Energy Houses Weiz | Austria | HD | √ | | | | | |
| EcoTerra House | Canada | HD | √ | √ | | √ | | |
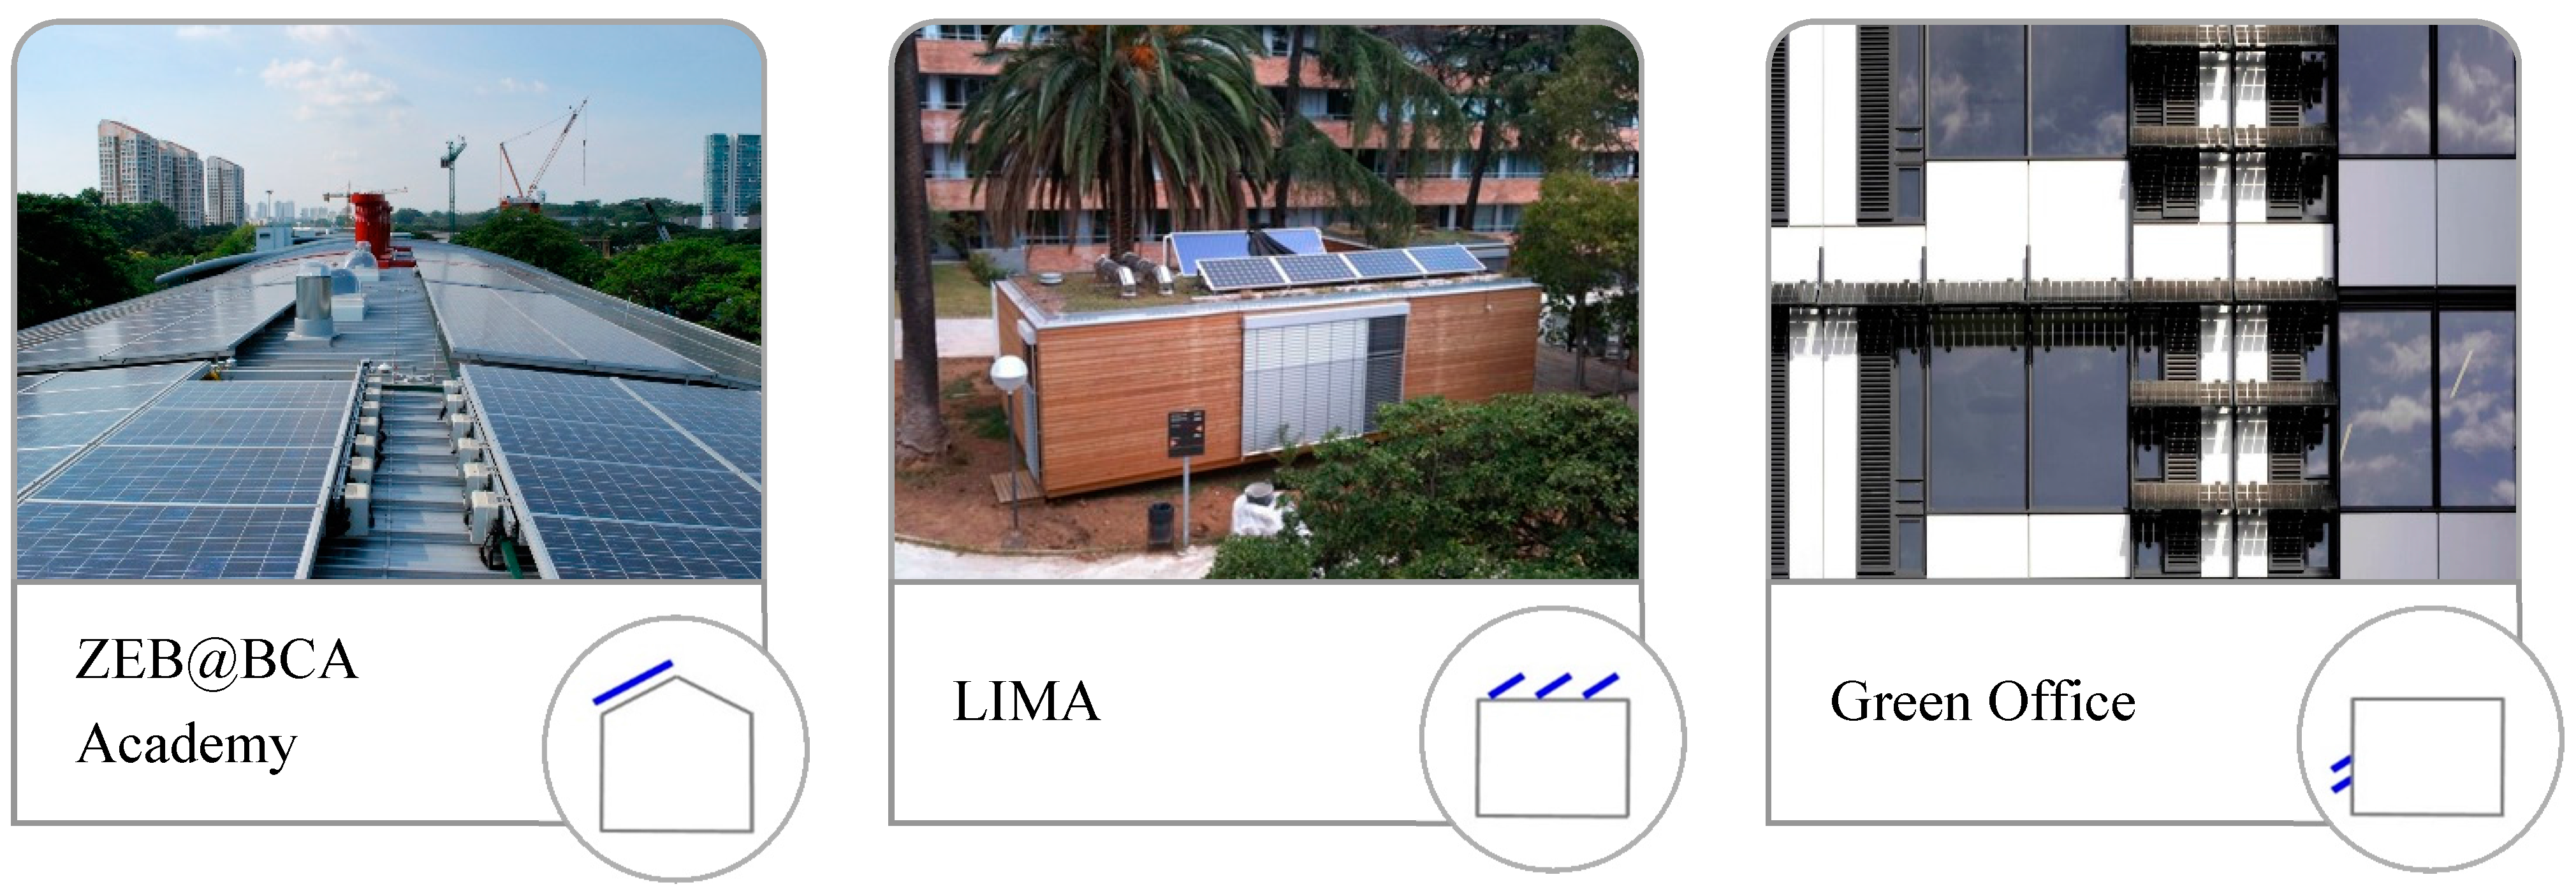
| LIMA | Spain | HCD | √ | √ | | | | |
| Leaf House | Italy | HCD | √ | √ | | √ | | |
| Kleehäuser | Germany | HD | √ | √ | √ | | | √ |
| Office | SOLAR XXI | Portugal | HCD | √ | √ | | | | |
| Marche Kempthal | Switzerland | HD | √ | | | √ | | |
| Elithis Tower | France | HCD | √ | | | | √ | |
| Ilet du Centre | Reunion | CD | √ | | | | | |
| Green Office | France | HCD | √ | | | | | |
| Pixel Building | Australia | HCD | √ | | √ | | √ | |
| Meridian Building | New Zealand | HCD | | √ | √ | | | |
| CIRCE Zaragoza | Spain | HCD | √ | √ | √ | √ | √ | |
| Villach Offices & Apartment | Austria | HD | √ | √ | | | | √ |
| Educational | Primary School of Laion | Italy | HCD | √ | √ | | √ | | |
| ENERPOS | Reunion | CD | √ | | | | | |
| Pantin Primary School | France | HCD | √ | √ | | | | |
| Limeil Brevannes School | France | HCD | √ | √ | | √ | | |
| ZEB@BCA Academy | Singapore | CD | √ | | | | | |
| Day Care Centre | Germany | HD | √ | √ | | √ | | |
| Primary School Hohen Neuendorf | Germany | HD | √ | | | | | √ |
| LYCEE KYOTO HIGH SCHOOL | France | HCD | √ | | | | | √ |
| Other | Alpine Refuge-Schiestlhaus | Austria | HD | √ | √ | | | | |
From
Table 1, the NZEB cases can be categorized into residential (40%) and non-residential (60%), which includes office and educational buildings. Categorization by country showed that the NZEB database number was greatest for France, and other European nations including Germany and Austria participated in the NZEB project for database construction.
The NZEB cases showed differing heating and cooling load properties depending on the climate of the region, and there were three types of load distribution according to the climate characteristics. Other than the cooling load being dominant in tropical climate regions, the northwestern Europe regions having a west coast oceanic climate and the southern Europe regions having a Mediterranean climate, were all dominated by heating and cooling loads while the central and eastern Europe regions having a continental climate were dominated by heating load.
Overall, there were 30 NZEB cases; more than one renewable energy system were installed for some buildings. Renewable energy systems were complexly applied for all cases except three, among others; the cases using solar energy were the most. Of all 30 cases, a PV system accounted for 97% (29 cases), solar thermal (ST) accounted for 63% (19 cases), geothermal (GT) accounted for 33% (10 cases), and wind and biomass systems accounted for less than 20%. Thus, PV systems were the most widely applied.
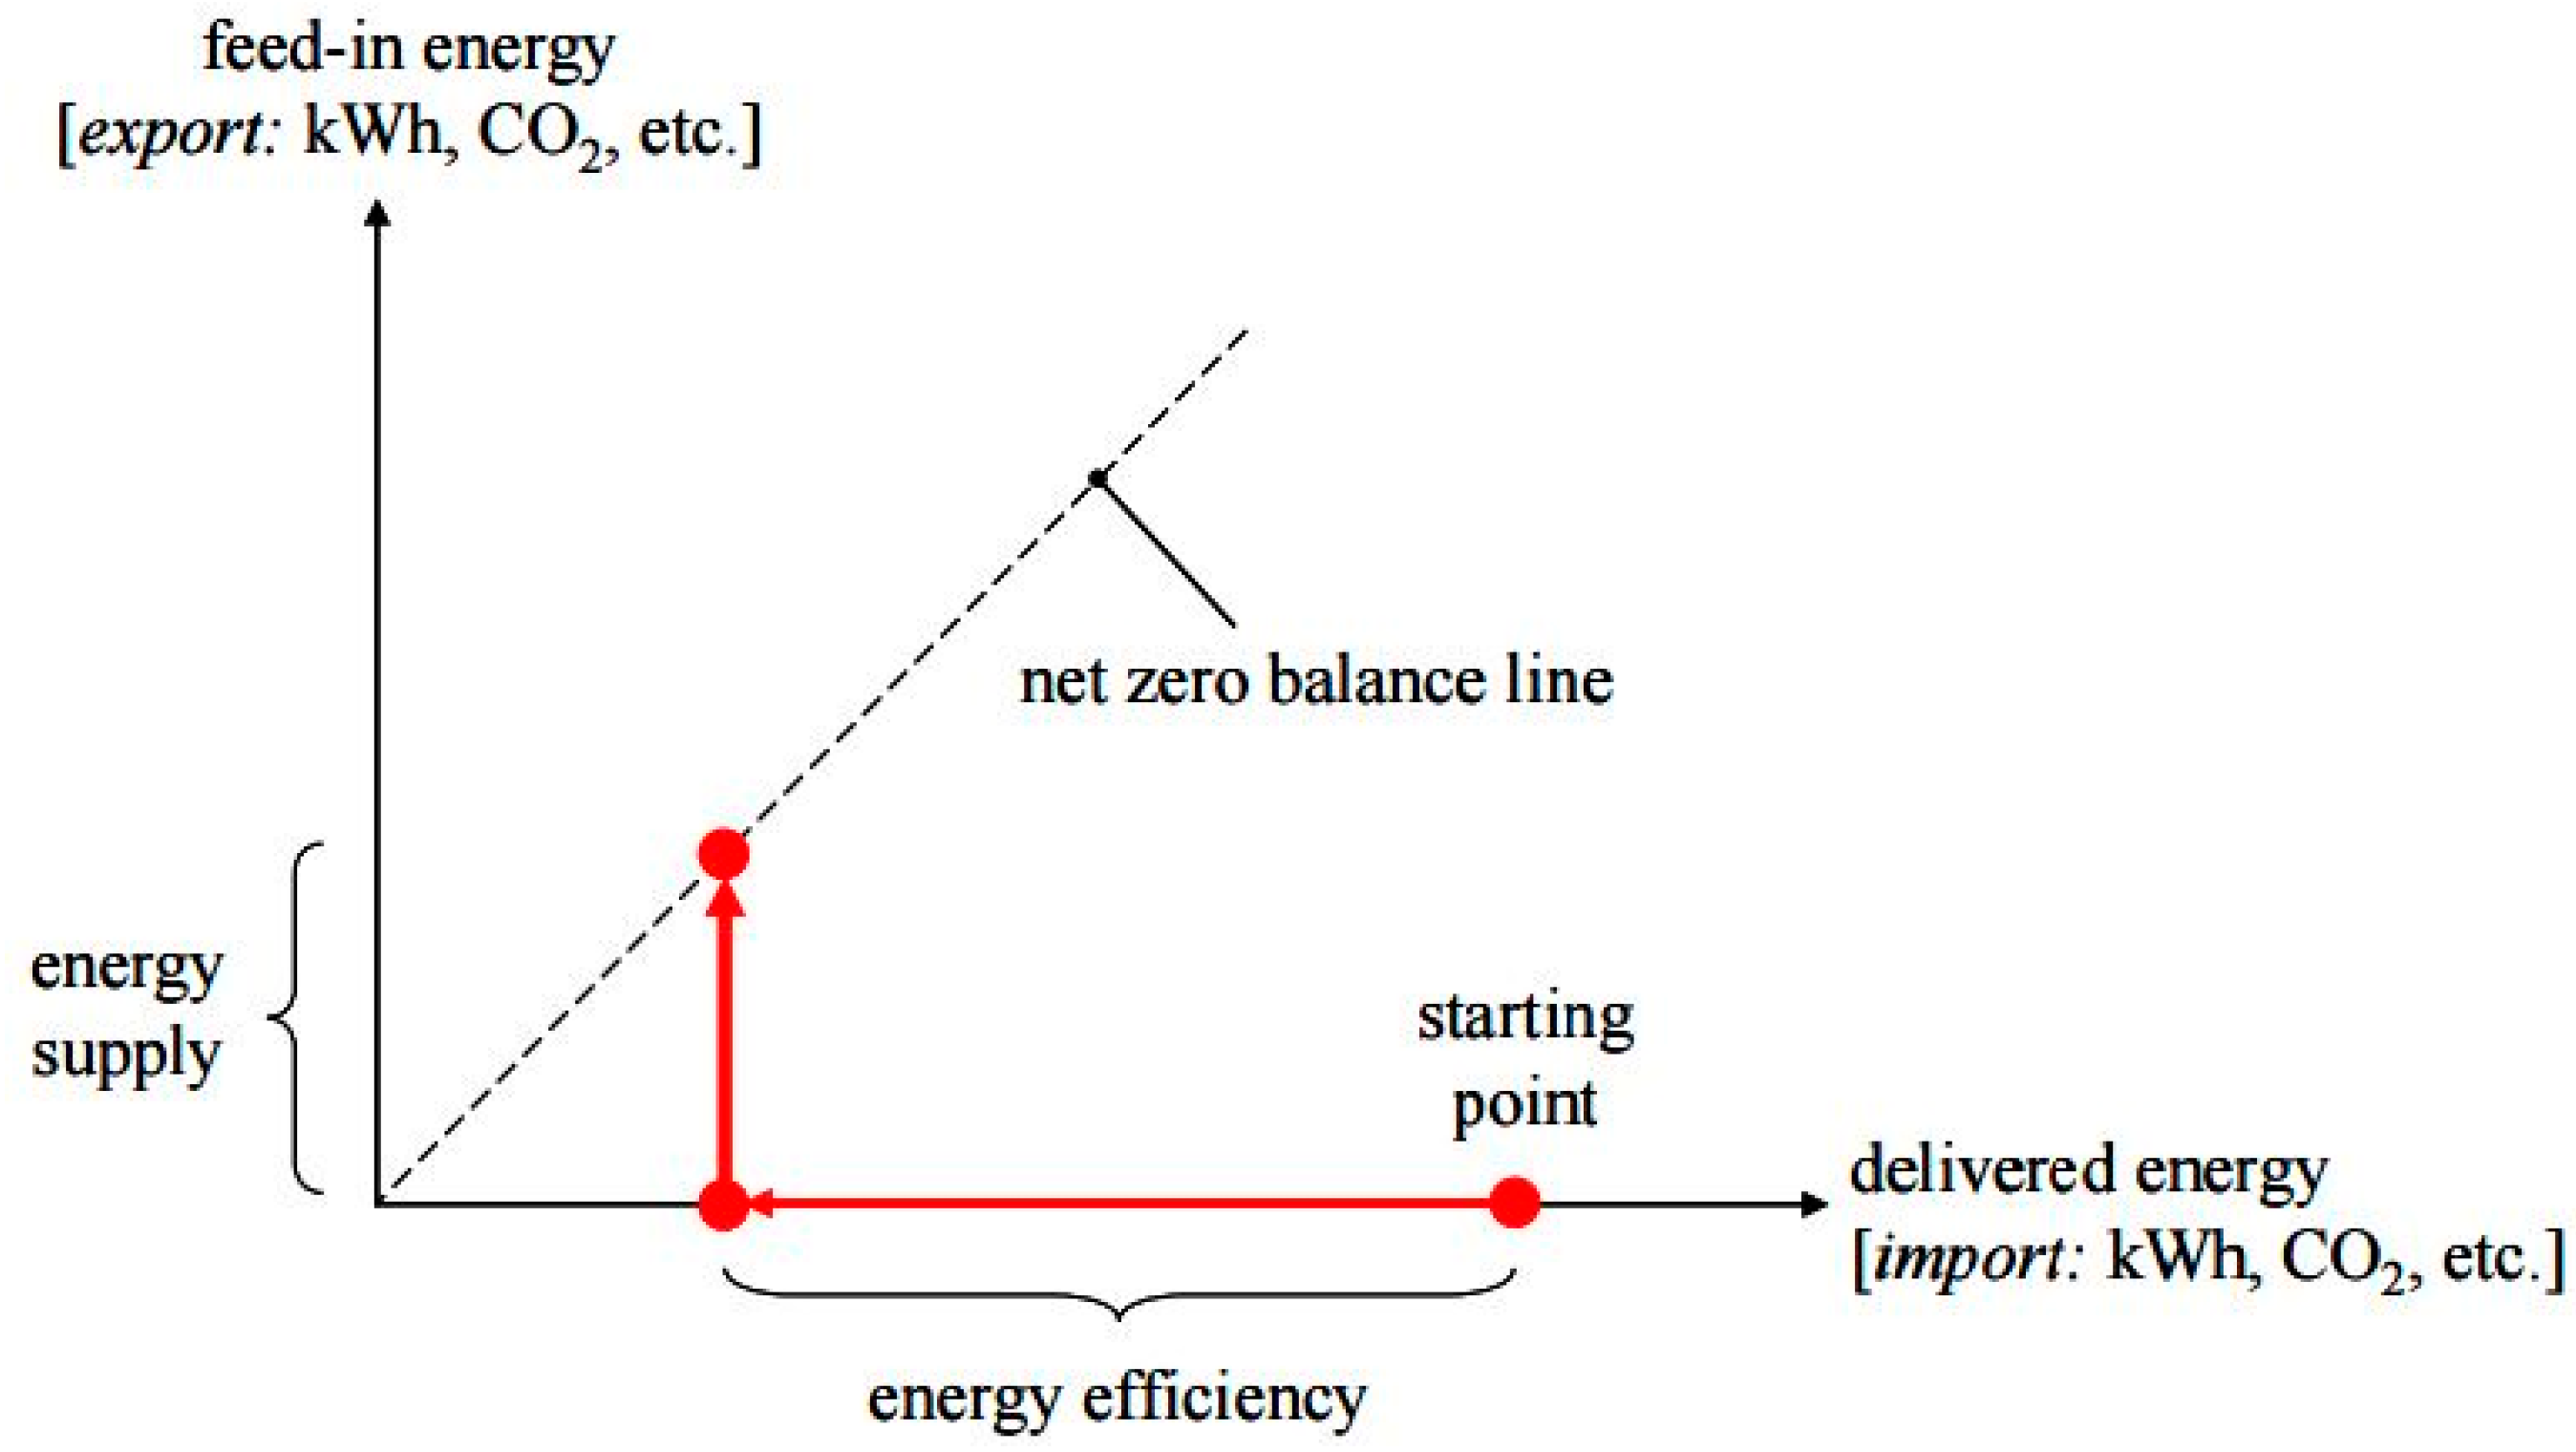
Pertaining to a NZEB, it is essential to balance (zero) import and export over a time period. In some cases embodied energy or embodied emissions in materials also have to be balanced off.
Figure 1 graphically depicts the balance of import (delivered energy) against export (feed-in energy) on the
x and
y axes, respectively.
Figure 1.
Graph representing the net zero balance of a Net ZEB [
22,
35].
Figure 1.
Graph representing the net zero balance of a Net ZEB [
22,
35].
The starting point may represent the performance of a new building built according to the minimum requirements of the building code or the performance of an existing building prior to renovation work. The general pathway to achieve an NZEB basically consists of two steps, namely reducing the energy demand (
x-axis) by means of energy efficiency measures, and generating electricity, or other energy carriers, by means of energy supply options to obtain enough credits (
y-axis) to achieve the balance [
35].
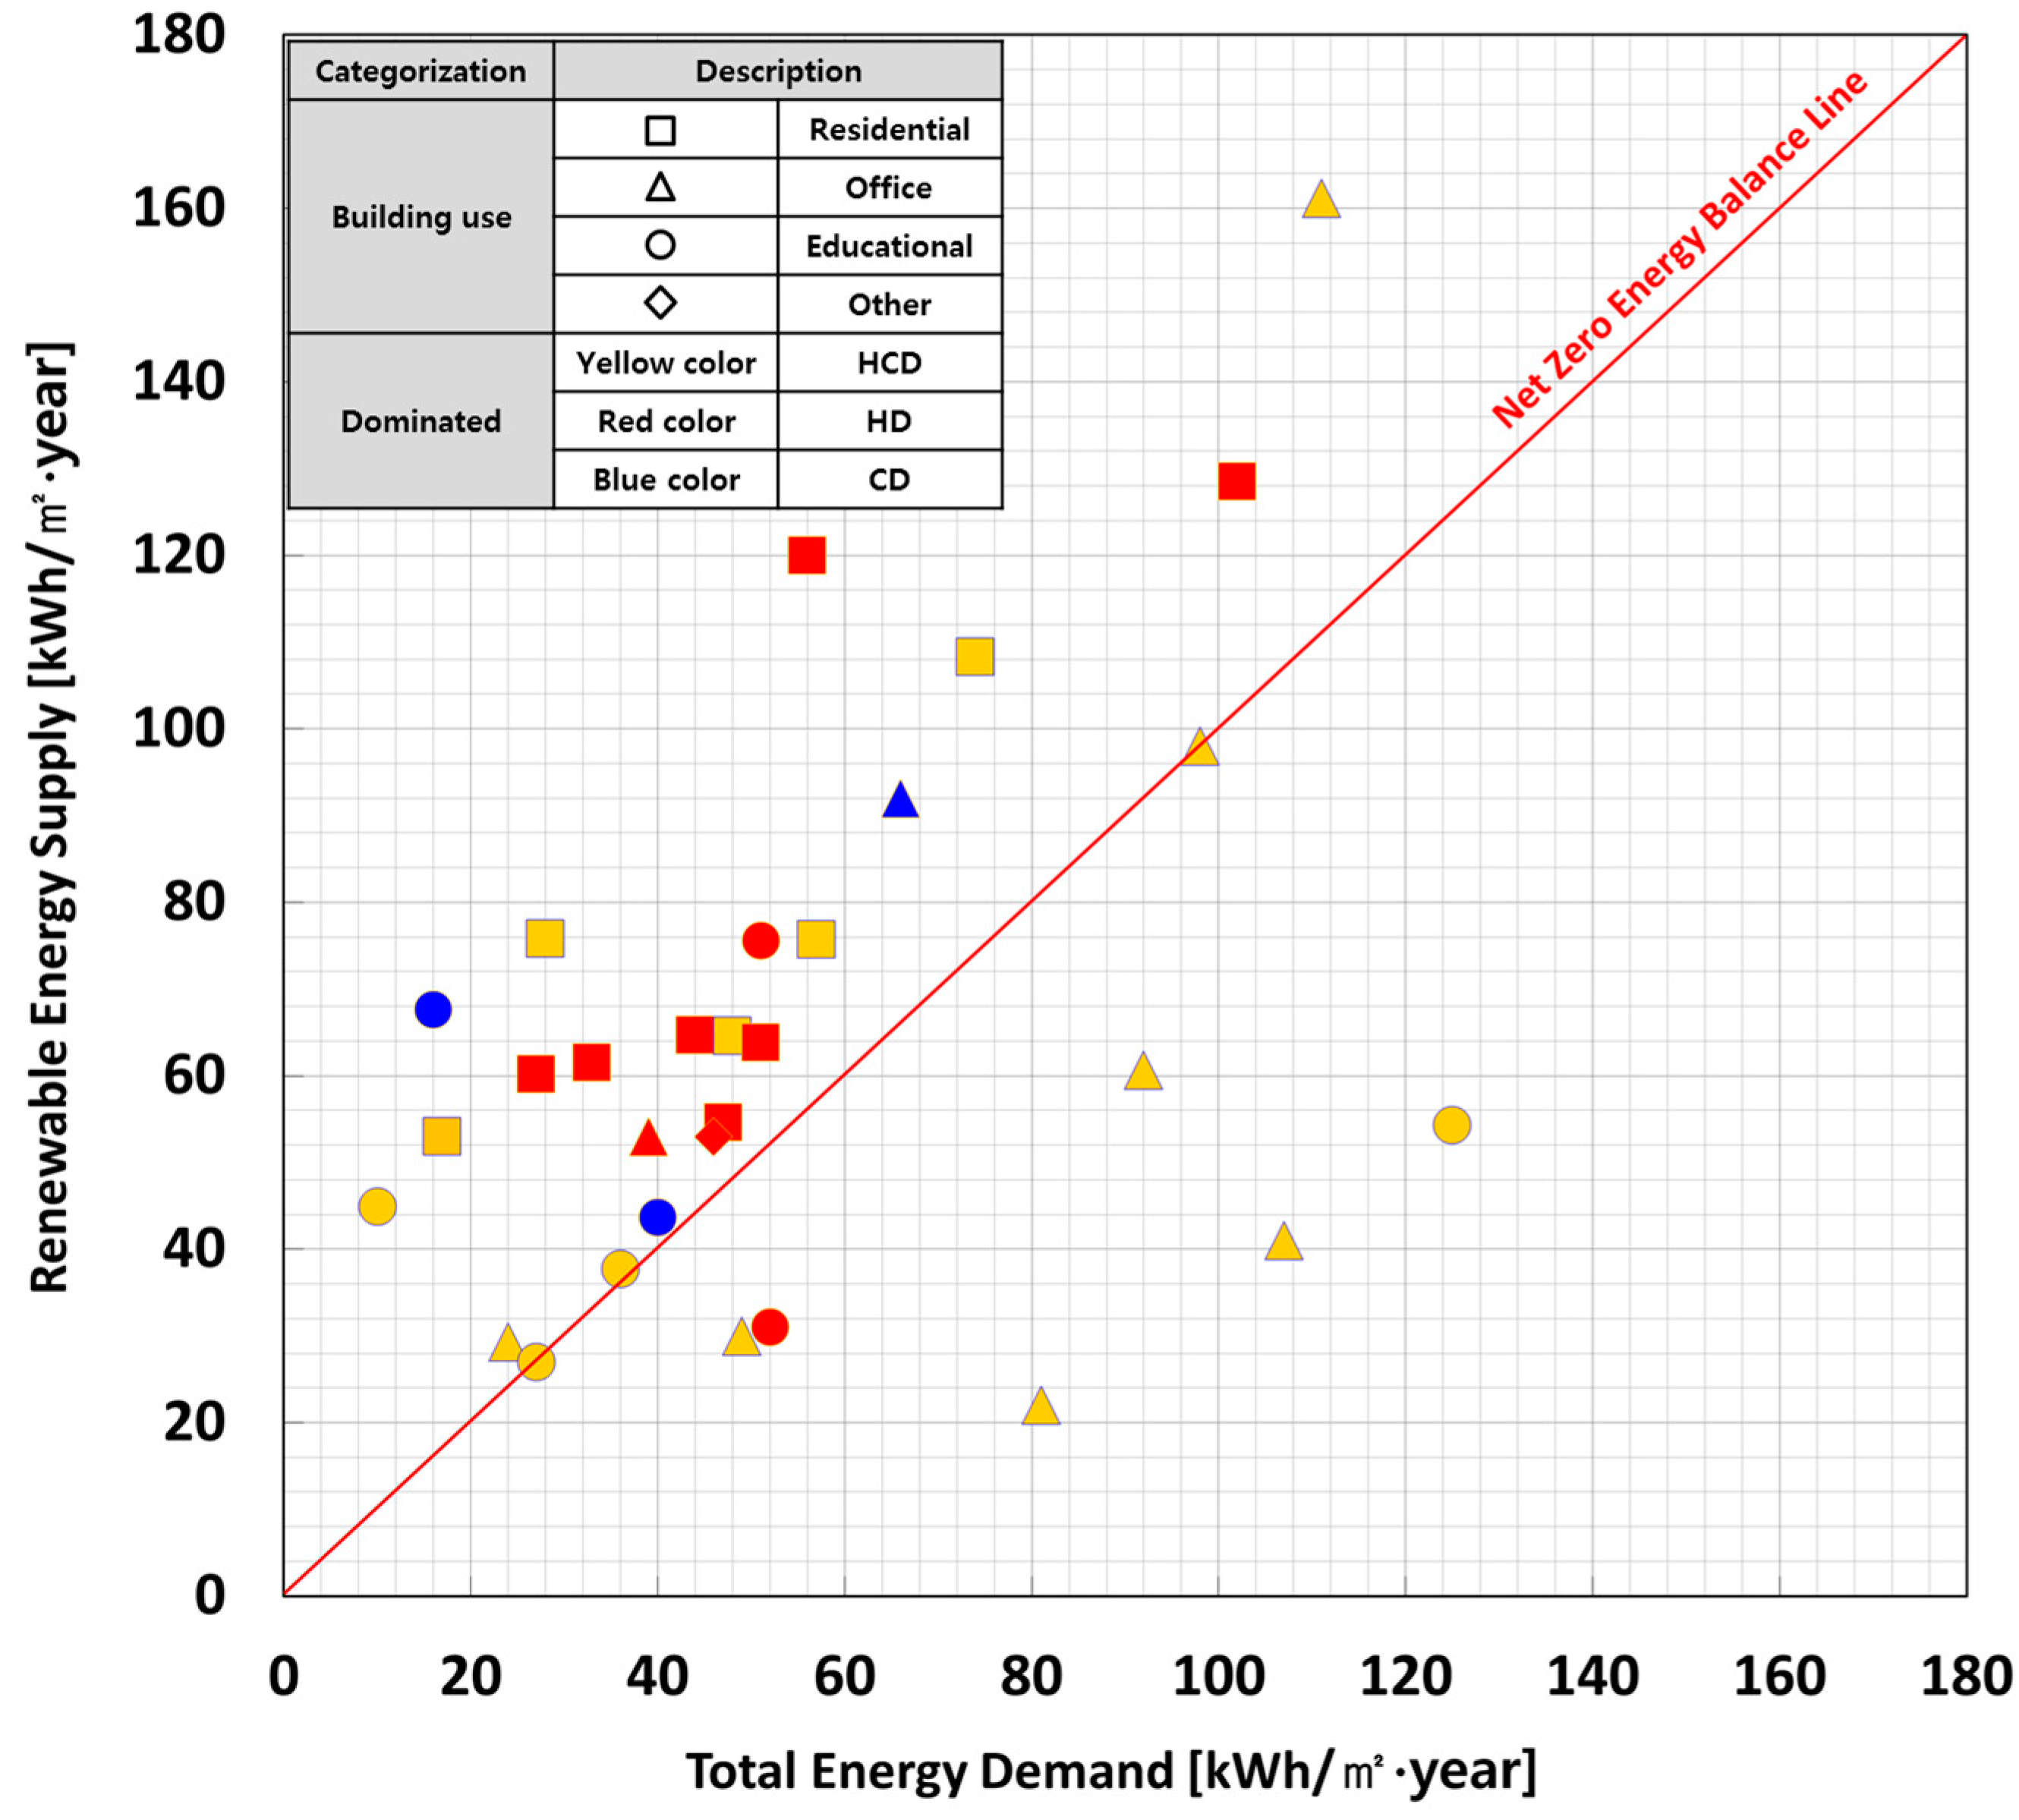
Figure 2 shows the relationship between the final energy demand and renewable energy supply of the NZEB cases according to the building use and climate. According to the building use, buildings were classified with symbols such as residential, office, and education, among others. In addition, according to the climate, the buildings were classified as Heating and Cooling Dominated (HCD: Yellow), Heating Dominated (HD: Red), and Cooling Dominated (CD: Blue).
Based on the analysis results, it was observed that 80% out of 30 cases utilized renewable energy sources to either achieve zero energy or generate additional energy. In particular, all residential buildings achieved ZEB. In office building cases, five cases (55%) met the ZEB range of building energy demand and RES were more widely used than in other buildings. Educational buildings totaled six cases (75%) and RES production was under 80 kWh/m
2.year. With most of the buildings, the total energy demand was lower than that of the other buildings because of the differences in schedule. With climate criteria, all CD buildings achieved ZEB. HD buildings were 10 cases (91%) and HCD buildings were 11 cases (69%). The achievement rate of the buildings that required heating and cooling thus was relatively low. Additionally, it was found that some cases did not achieve zero energy due to an insufficient renewable energy supply compared to the energy demand. This was determined to be due to malfunctioning of the applied renewable energy system [
36].
Figure 2.
Net zero energy balance status.
Figure 2.
Net zero energy balance status.
3. PV Application Status
Regarding renewable energy systems for NZEB, a number of aspects should be considered before application to a building such as thoroughly conducting an assessment of the foundation from the initial stages of construction due to the ground heat exchanger being buried for geothermal systems and maintaining a sufficient safety distance for the wind effect and blades for wind power systems. On the other hand, solar energy systems have the advantage of convenient installation on existing buildings as well as new buildings compared to other renewable energy sources. In particular, PV and BIPV systems are important renewable energy facilities for NZEB in terms of satisfying the electricity energy demand of buildings. In this section, analyses of PV applied NZEB cases were conducted regarding the PV installation type, cell type, and amount of PV power production. In addition, a comparison of the electricity energy demand and amount generated was performed.
3.1. NZEB Electricity Energy Demand
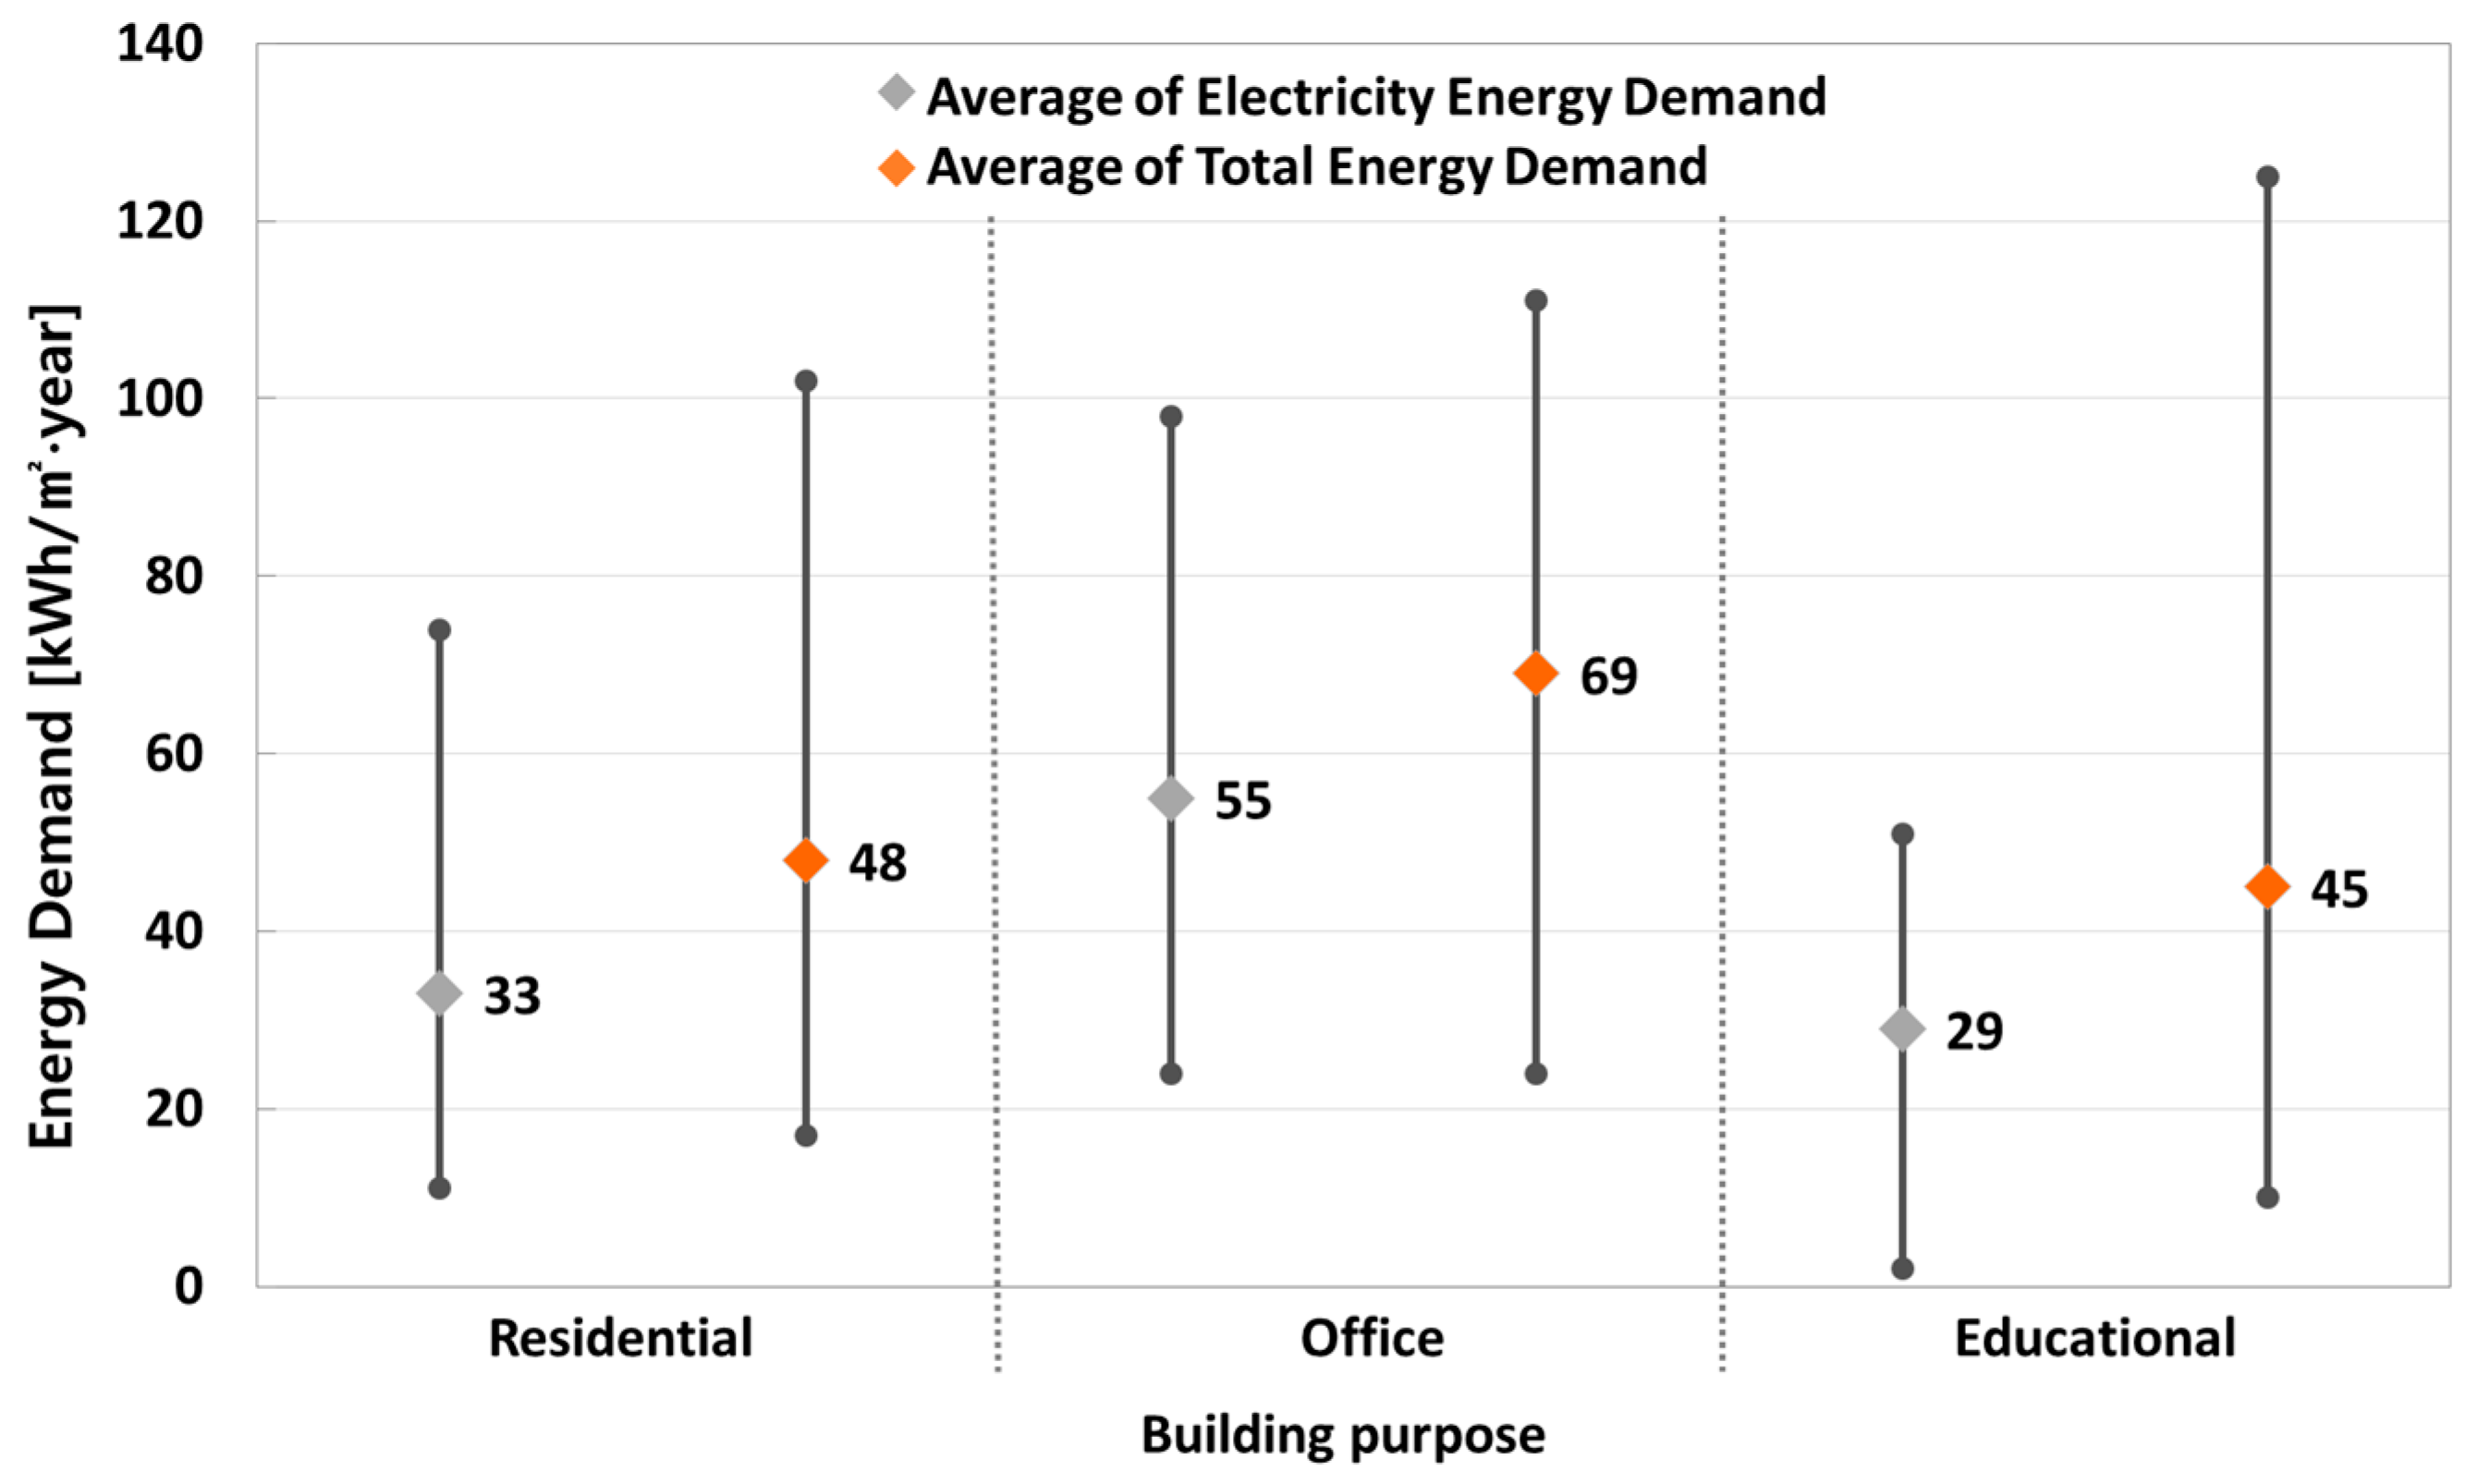
Figure 3 shows the electricity energy demand and total energy demand for each building purpose of the NZEB cases. The average electricity energy demand was higher than the average total energy demand. In office buildings, the average total energy demand and average electrical energy demand were 69 kWh/m
2 year and 55 kWh/m
2.year, respectively. The electrical energy demand therefore covered 80% of all energy demand, and that of other buildings. Thus, the NZEB cases had high electricity energy demand in comparison to the total energy demand.
The total energy demand was 2–125 kWh/m2.year and the deviation was found to greatly differ depending on the building purpose. The deviation for educational buildings is notable for being large, and this was ascribed to the different schedules of elementary and high schools despite both being educational buildings. The low electricity energy demand and total energy demand of educational buildings compared to other purpose buildings result from shorter occupancy time and inclusion of vacation periods. The electricity energy demand was determined to be on average 29–55 kWh/m2.year and the electricity energy demand was found to be highest for offices. Based on the analysis results, residential and educational buildings had lower electricity energy demand compared to office buildings because residential and educational buildings used natural gas or biofuel in place of electricity energy such as an Electric Heat Pump (EHP) for heating and cooling. Seventeen cases with 100% electricity energy demand for the total energy demand were found to use an EHP for heating and cooling. Electrical energy demand was 100% in 17 cases (57%) among all 30 buildings and these cases used an EHP for heating and cooling. The rest of the NZEB cases fulfill an estimated 50% of their energy demands with electricity.
Figure 3.
Average energy demand for building use.
Figure 3.
Average energy demand for building use.
3.2. Installation Type Analysis
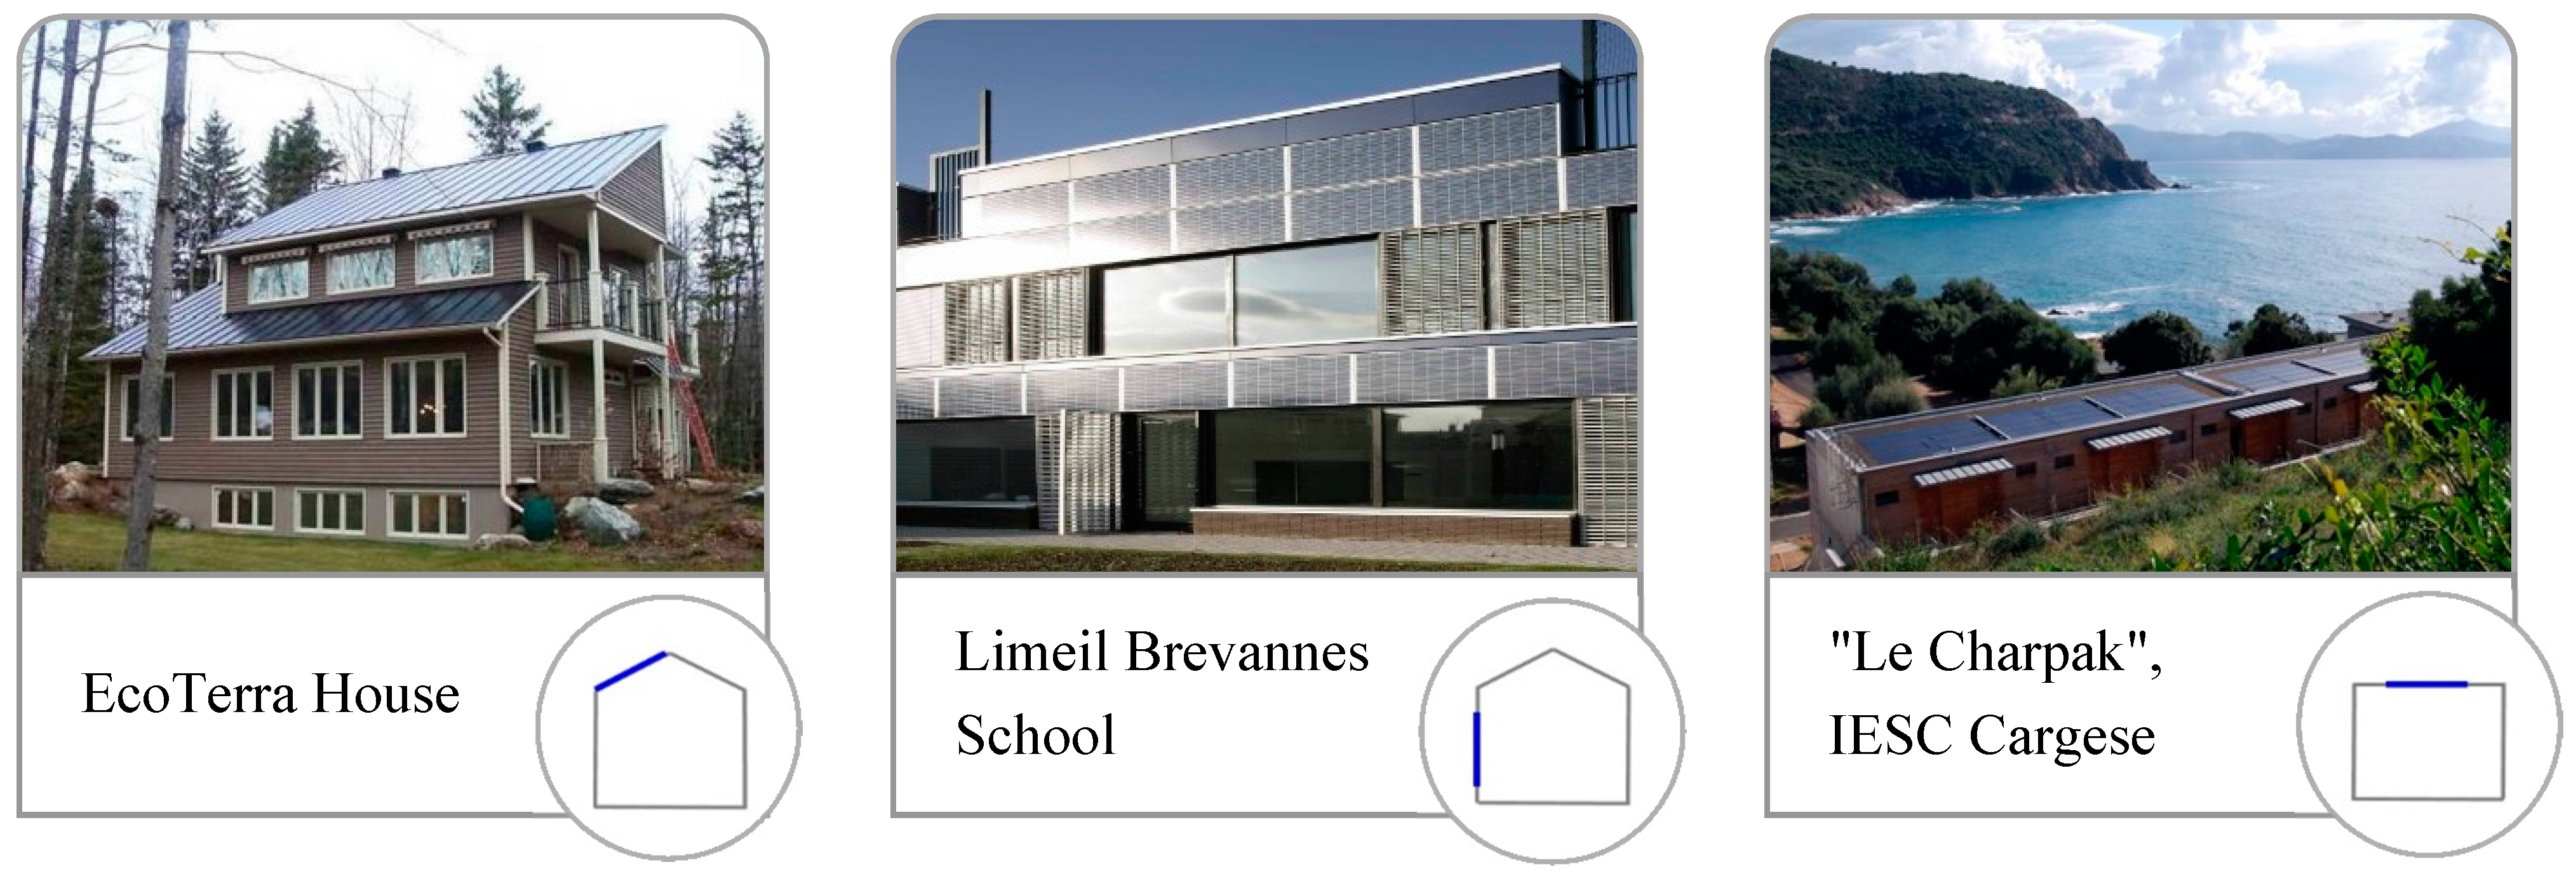
PV systems can be grouped into many categories such as skyward element, elevation elements, and so on. PV application methods are also variable. Above all, a PV system applied on a roof can be installed independently and at an inclined angle favorable to collect solar radiation. If a PV system with various colors, sizes and shapes were applied on the façade, buildings could be improved aesthetically. Moreover, in the cases of PV installed as shading devices, they could be used as design elements as well as for light control and electricity production. Categorization was conducted according to the installation methods, namely: the non-integrated types, where the PV module is installed by adding a holder or structure on a flat roof or a pitched roof, and the integrated types, where the PV module forms part of the building envelope exterior (see
Figure 4 and
Figure 5). In this section, the PV systems applied to NZEB are categorized according to the installation type and building factors of the roof and facade.
Figure 4.
Categorization of PV installation method: integrated type [
33].
Figure 4.
Categorization of PV installation method: integrated type [
33].
Figure 5.
Categorization of PV installation method: non-integrated type [
33].
Figure 5.
Categorization of PV installation method: non-integrated type [
33].
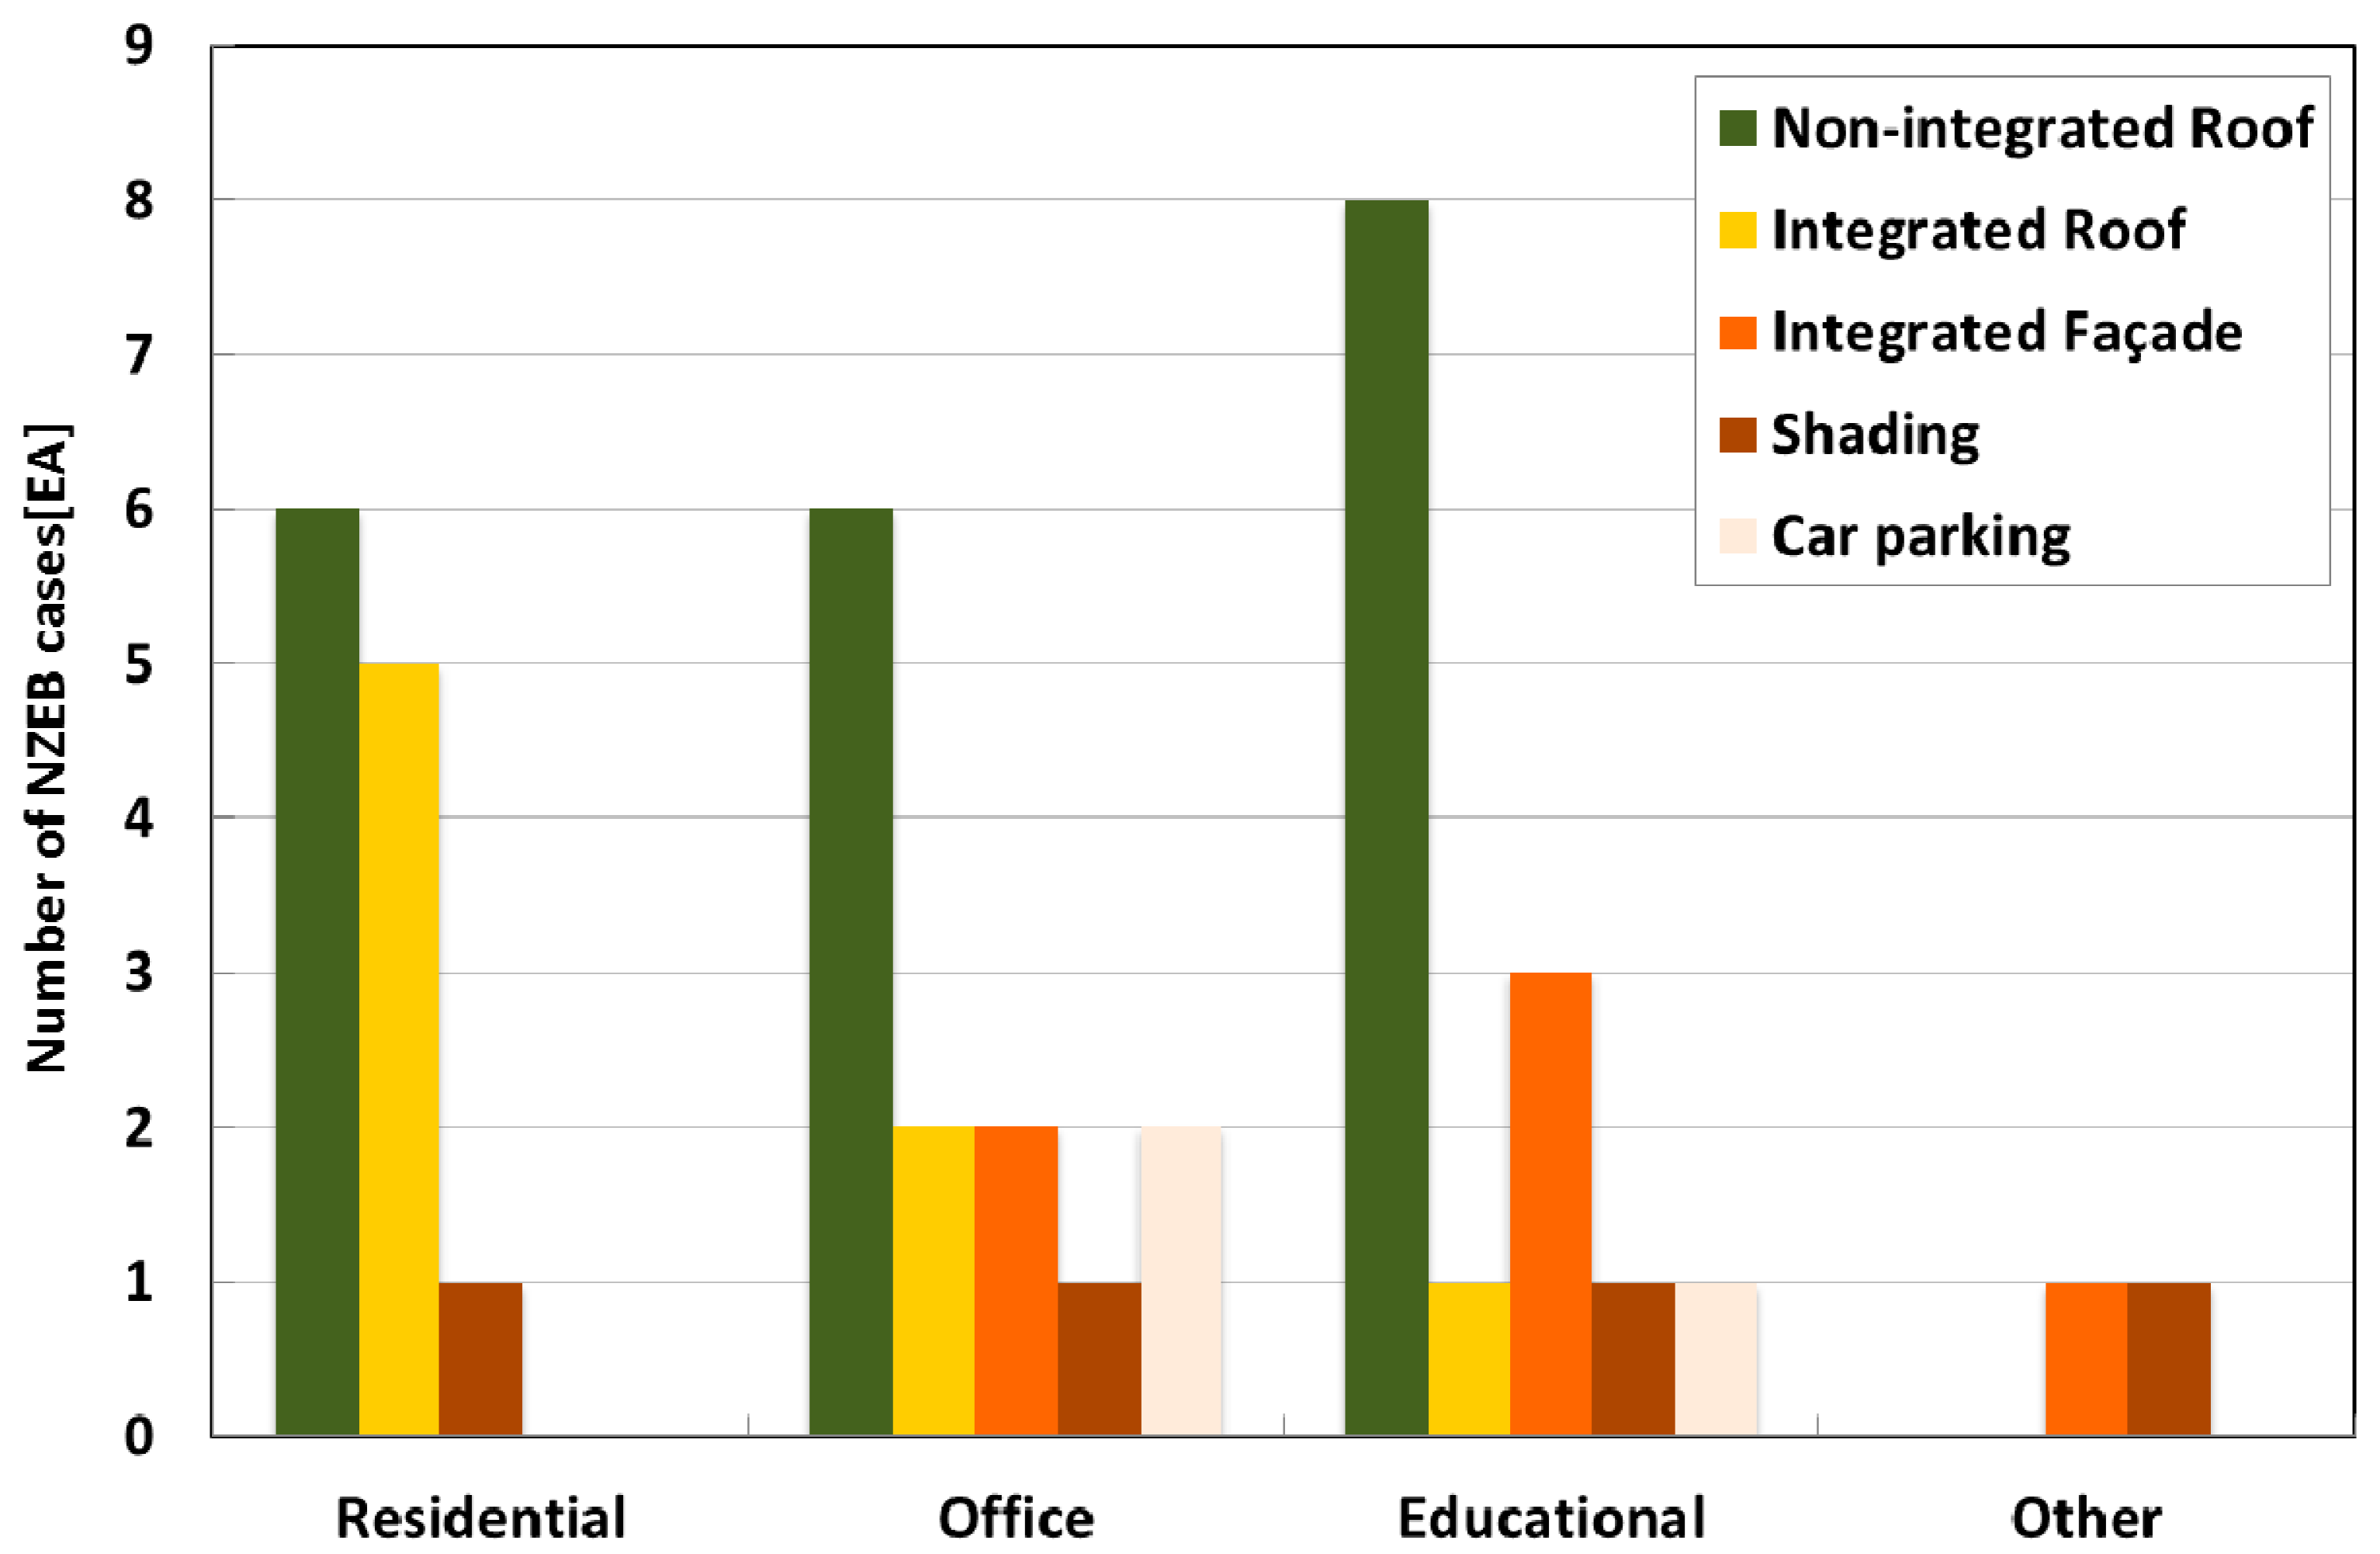
The 41 PV systems from the 29 NZEB cases were classified by installation type.
Figure 6 shows the PV installation type as building elements by building use. It was analyzed that the 28 PV systems among the 41 PV systems were installed on the roofs. In particular, in the cases of residential building, most of PV systems were applied as building element with roof. For office and educational buildings, they were secondly applied as a façade (
Figure 6). In the case of roofs, 29% of the cases employed the integrated method for complete integration with the building while the non-integrated method was applied in 71% of the cases. Additionally, the integrated type was mostly applied for residential buildings. In the case of façades, PV systems were applied to the façade as not only the building envelope but also on the balcony and to provide shade. Furthermore, more cases were found in educational buildings because of the larger effective area for PV installation than residential buildings. PV modules were dominantly applied in the form of the backsheet type while the Glass to Glass PV was applied to the roof and facade with shade functionality to control daylight intake.
Figure 6.
PV application for the NZEB cases.
Figure 6.
PV application for the NZEB cases.
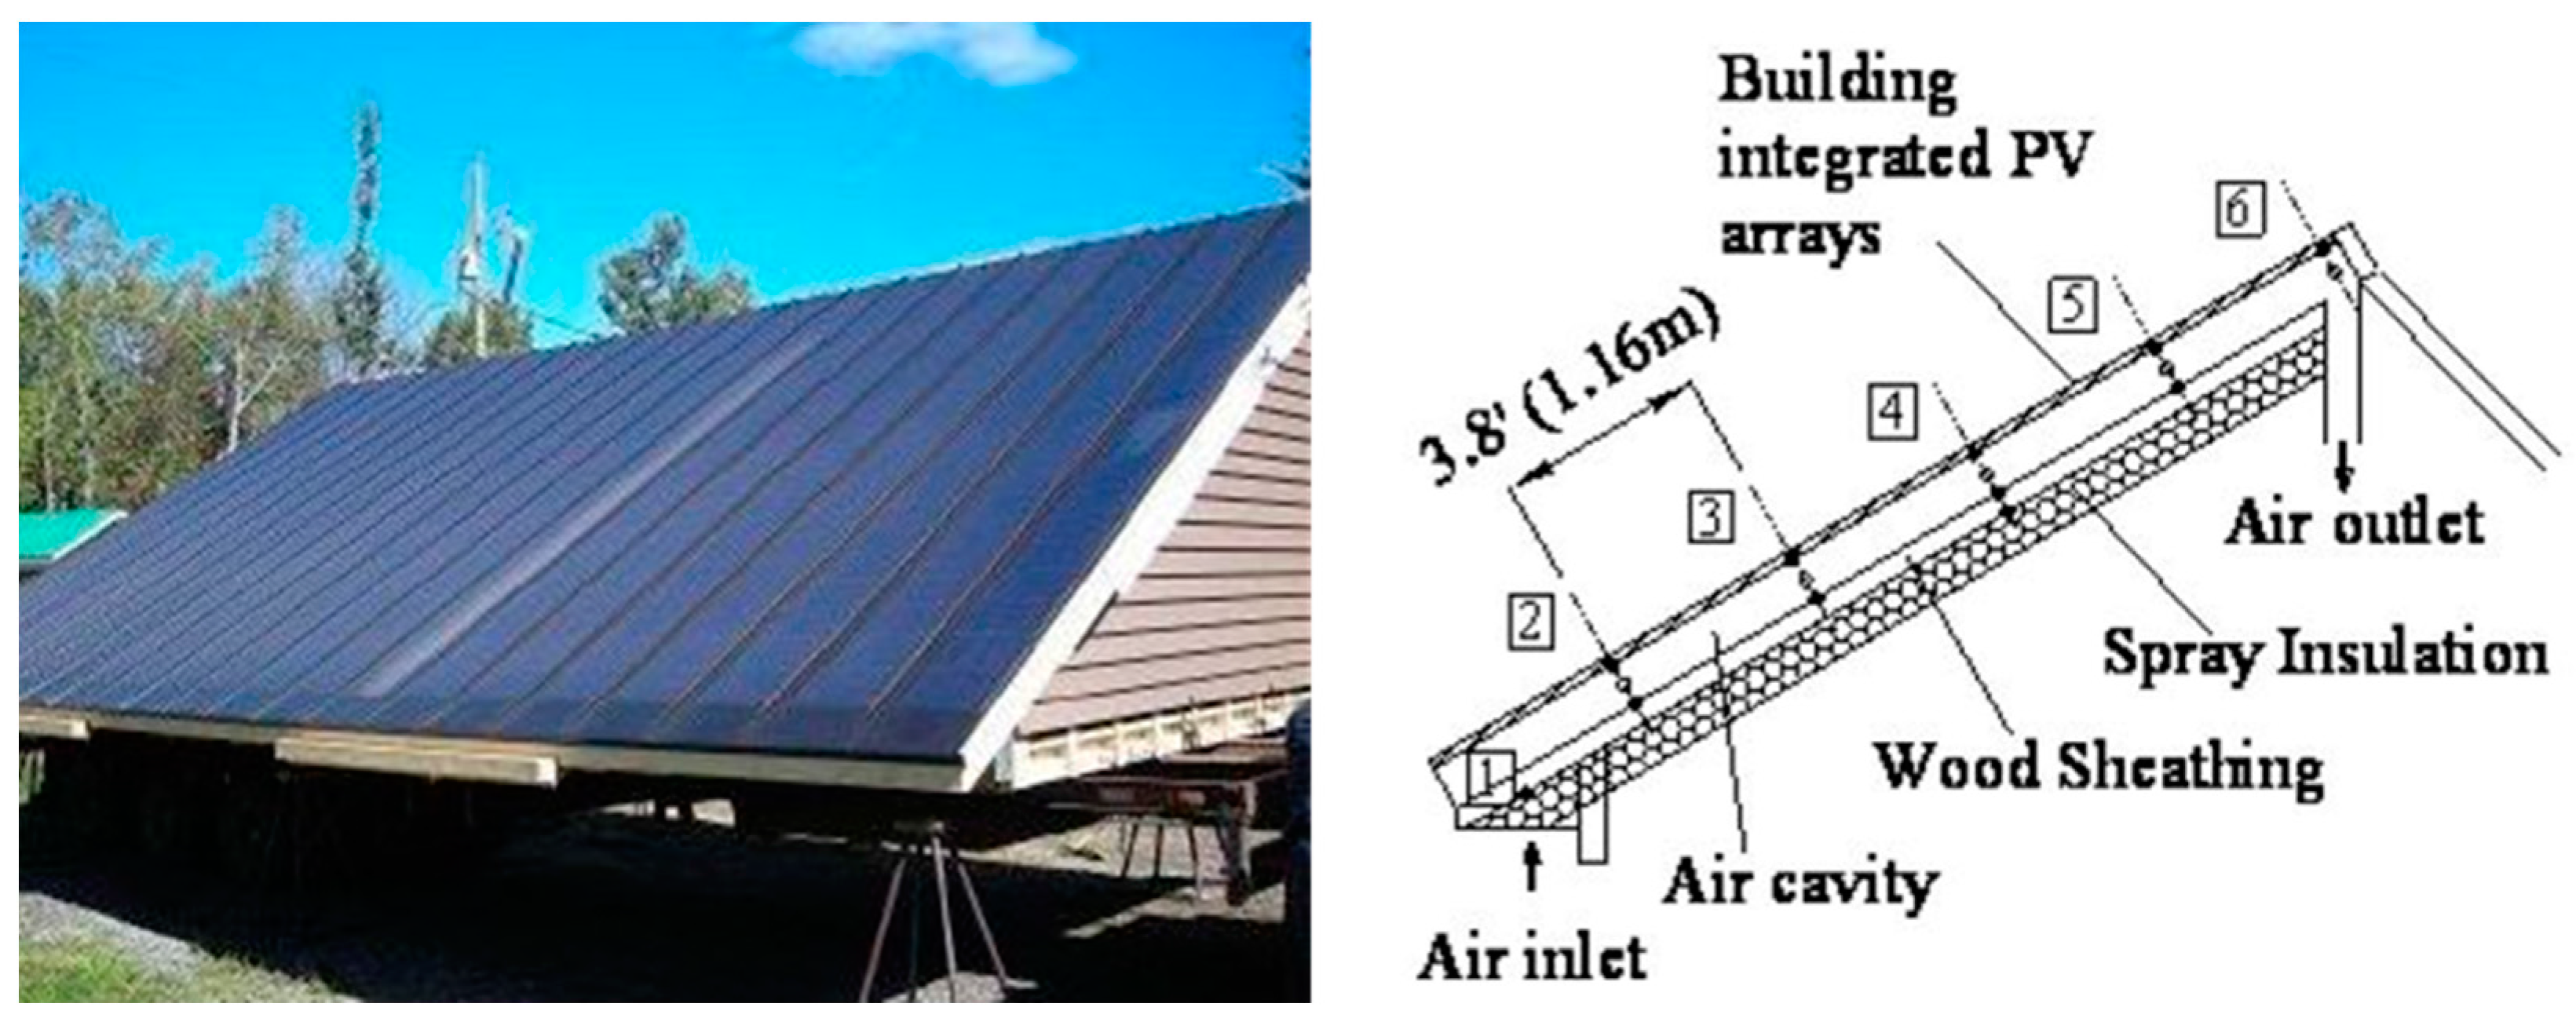
Among the integrated type cases, building integrated photovoltaic-thermal
(BIPVT) was also optionally installed to reduce the building heating load by supplying PV backside heat into the building as well as electricity generation. An amorphous silica applied BIPVT was installed as an integral system on the 30° pitched roof of the EcoTerra House, which was a case that considered BIPVT from the early stages of construction.
Figure 7 presents the BIPVT roof and conceptual diagram applied to EcoTerra House. The gap between the inlet air temperature and the outlet was more than 40 °C. The pre-heat source was used for heating and hot-water supply [
37].
Figure 7.
BIPVT case: EcoTerra House [
22,
38].
Figure 7.
BIPVT case: EcoTerra House [
22,
38].
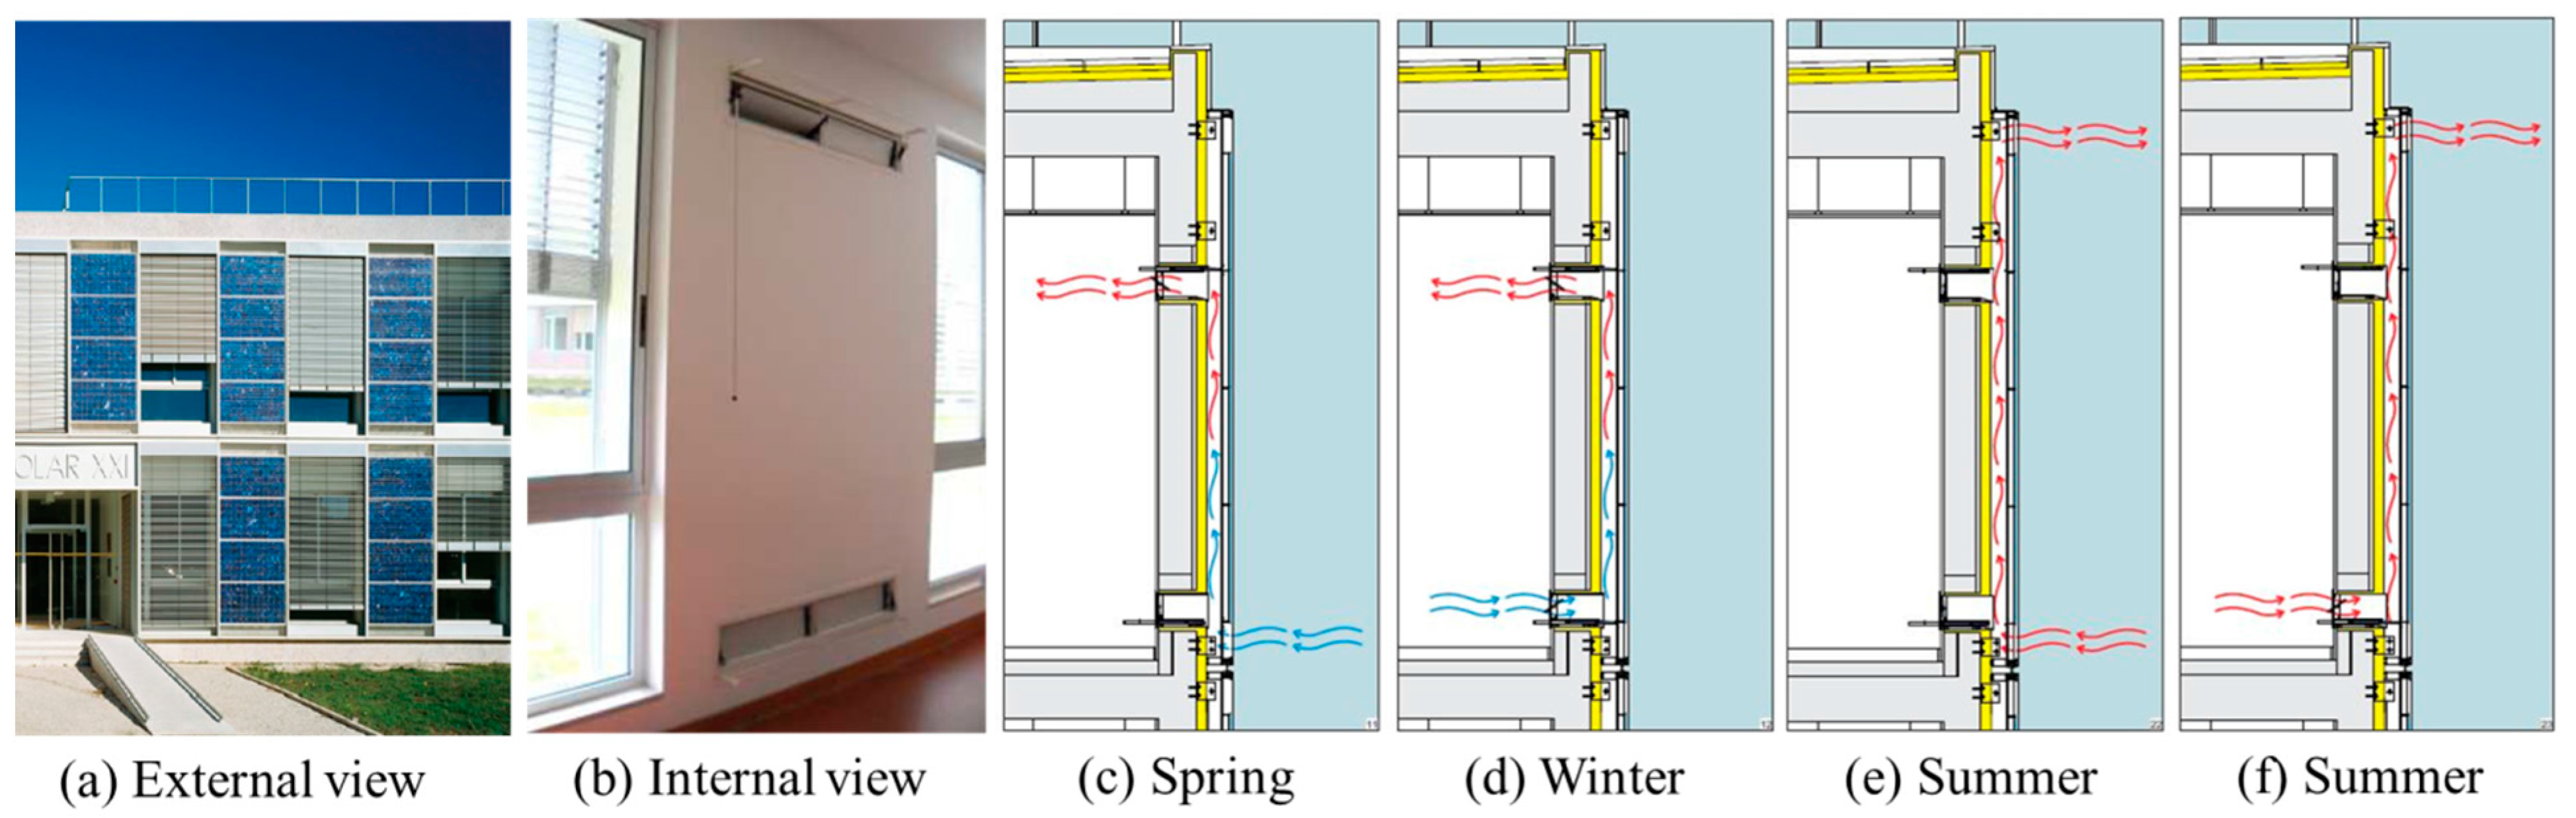
For the Solar XXI, BIPVT with poly-crystalline PV modules was installed in the façade in an integral form such that an air cavity was created between the PV backside and the building envelope. The system thus constitutes an outer layer (PV panels) and an inner layer (building envelope). The air gap formed between these two layers interacts with the indoor environment by means of two vents (dampers), one located in the upper part and the other located in the lower part of the brick wall. In addition, the system was designed to allow ventilation of the gap exclusively with outdoor air. The gap ventilation is simply imposed by the occupants who may maneuver the vents manually in the desired position according to their individual comfort needs and weather conditions (
Figure 8) [
39].
Figure 8.
BIPVT case: Solar XXI [
39]: seasonal operation mode.
Figure 8.
BIPVT case: Solar XXI [
39]: seasonal operation mode.
3.3. Cell Type Analysis
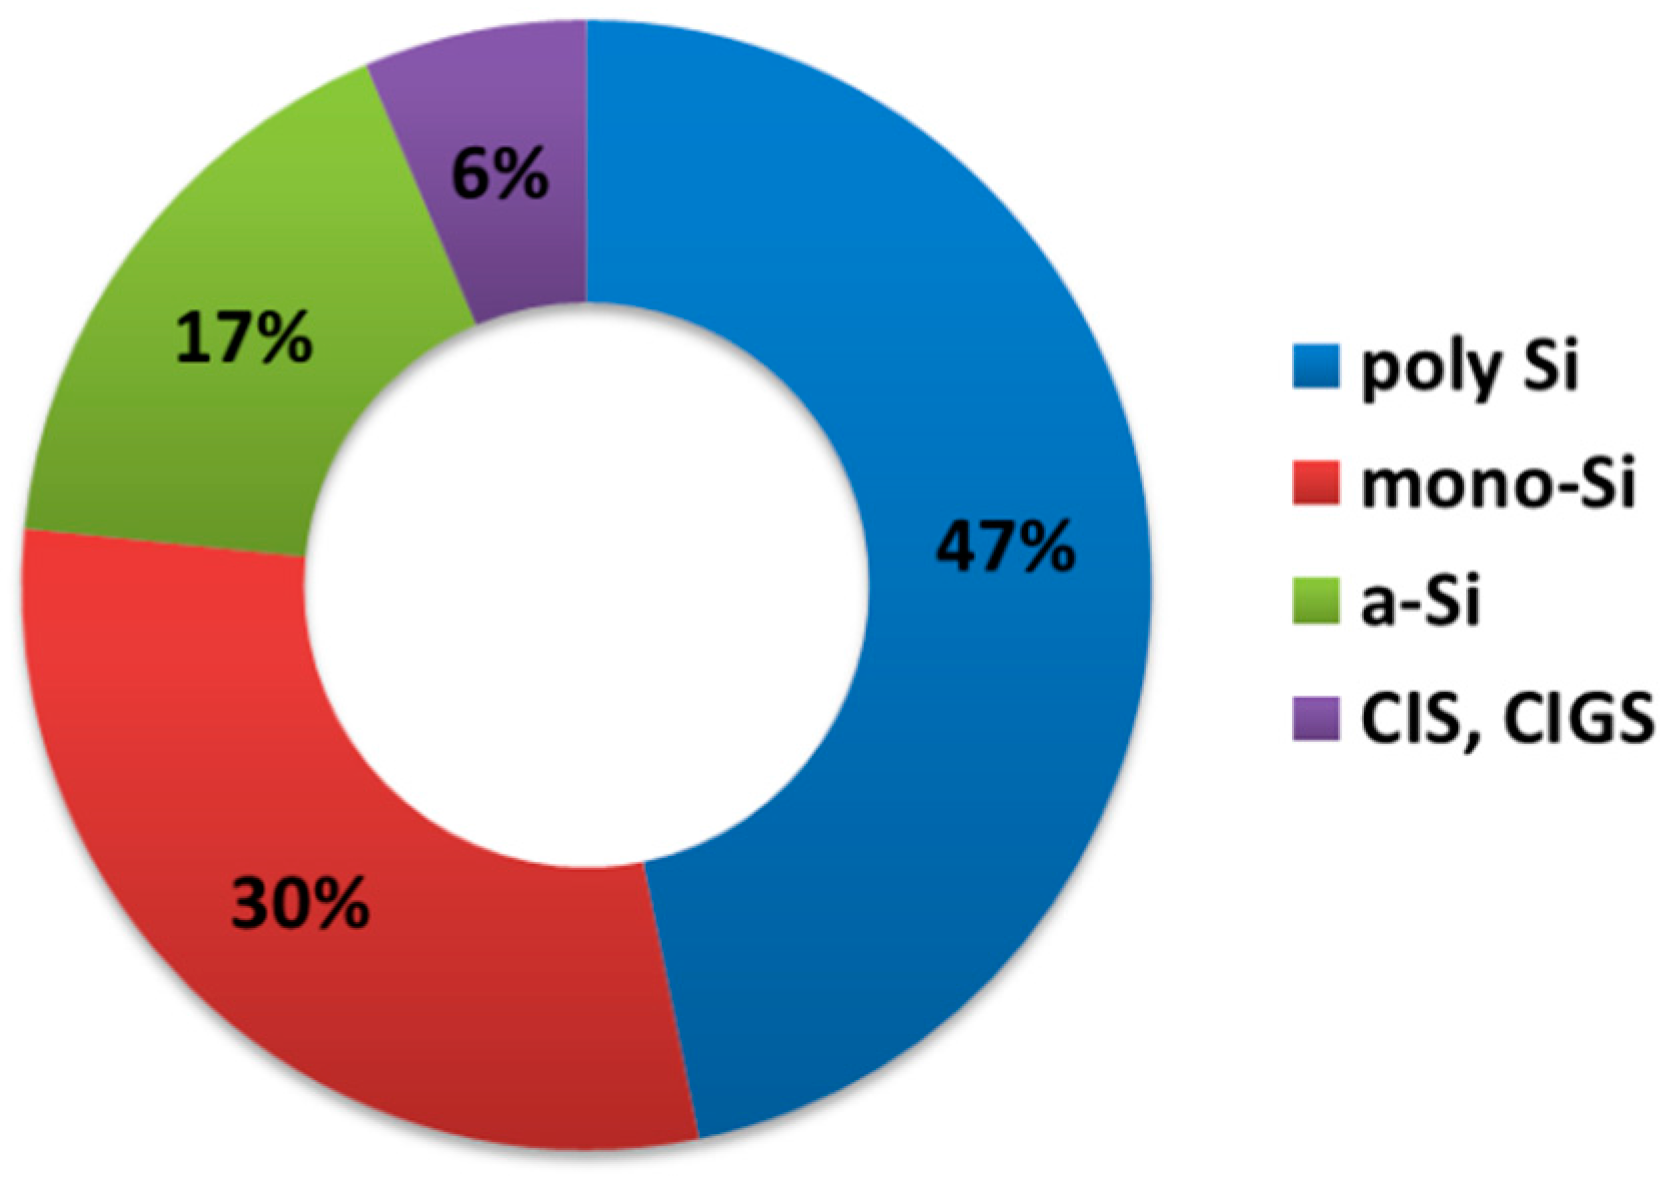
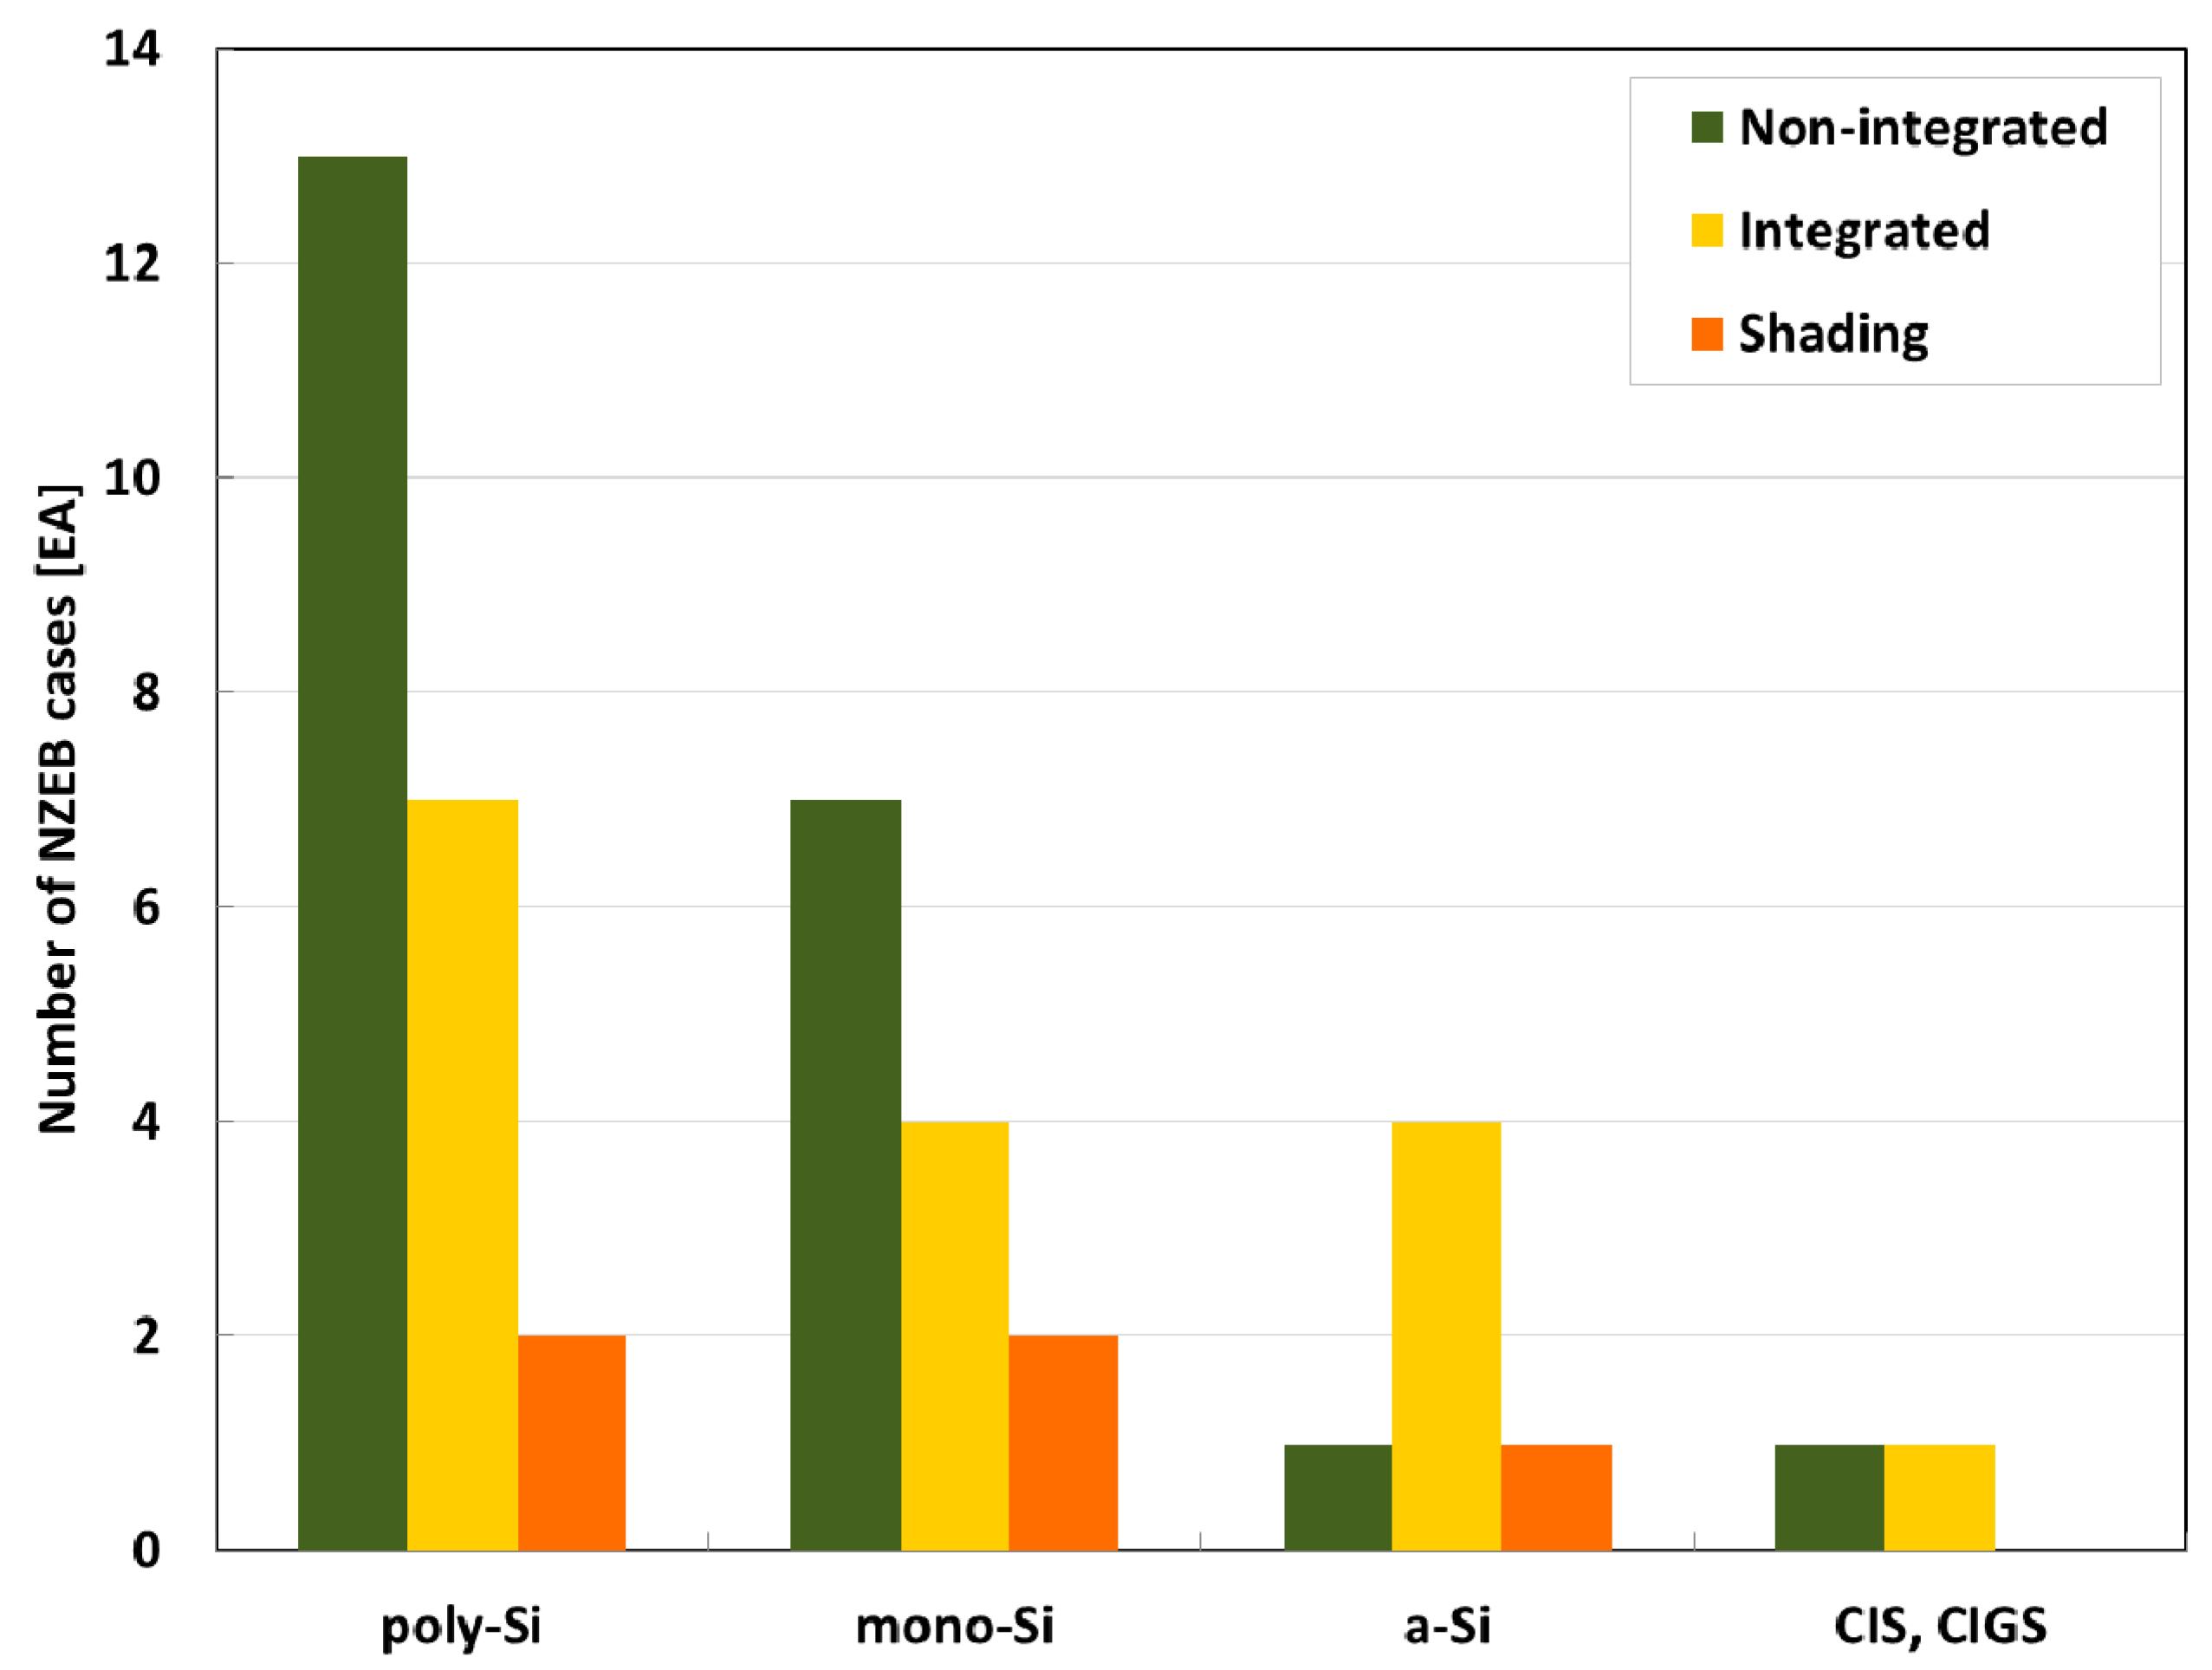
The crystalline-Silicon (c-Si) and thin film modules were applied for the PV systems in the NZEB. In general, thin film modules have lower efficiency than c-Si. On this basis, the PV power production of the thin film modules also would be lower. PV power production per unit area by cell type was analyzed in this section. The cases with various cell types applied simultaneously to a building were considered as well. 43 PV systems from the 29 NZEBs were classified by cell type. The cell types of PV systems applied to NZEB were categorized as shown in
Figure 9, and analyzed to be more than 77% mono-crystalline and poly-crystalline silicon.
Figure 10 shows the installation method for each cell type depending on the building integration. The non-integrated installation was on the roof and façade, whereas the integrated installation on the roof and façade was not integrated with the building but performed additional functions of shading. To analyze the installation method based on the cell type, the parking cases were not considered in the analysis, as installation was not done on the building. Analysis results revealed that most of the amorphous cell cases employed an integrated application. In the case of the crystalline cell type, non-integrated application was employed in comparison to the other cell types. This was ascribed to reduced efficiency by the temperature increase of the crystalline cell.
Figure 9.
Categorization of cell type.
Figure 9.
Categorization of cell type.
Figure 10.
Installation methods depending on building integration
Figure 10.
Installation methods depending on building integration
3.4. PV Power Generation
The power generation amount of a PV system is dependent on climate conditions, which determines the amount of radiation in the given region as well as the slope and orientation. It is also influenced by the power generation characteristics of cells and installation conditions. As such, comparing the power generation performance of the NZEB cases is difficult due to differences in region and installation conditions. This study investigated the amount of power generation of PV systems installed in NZEB.
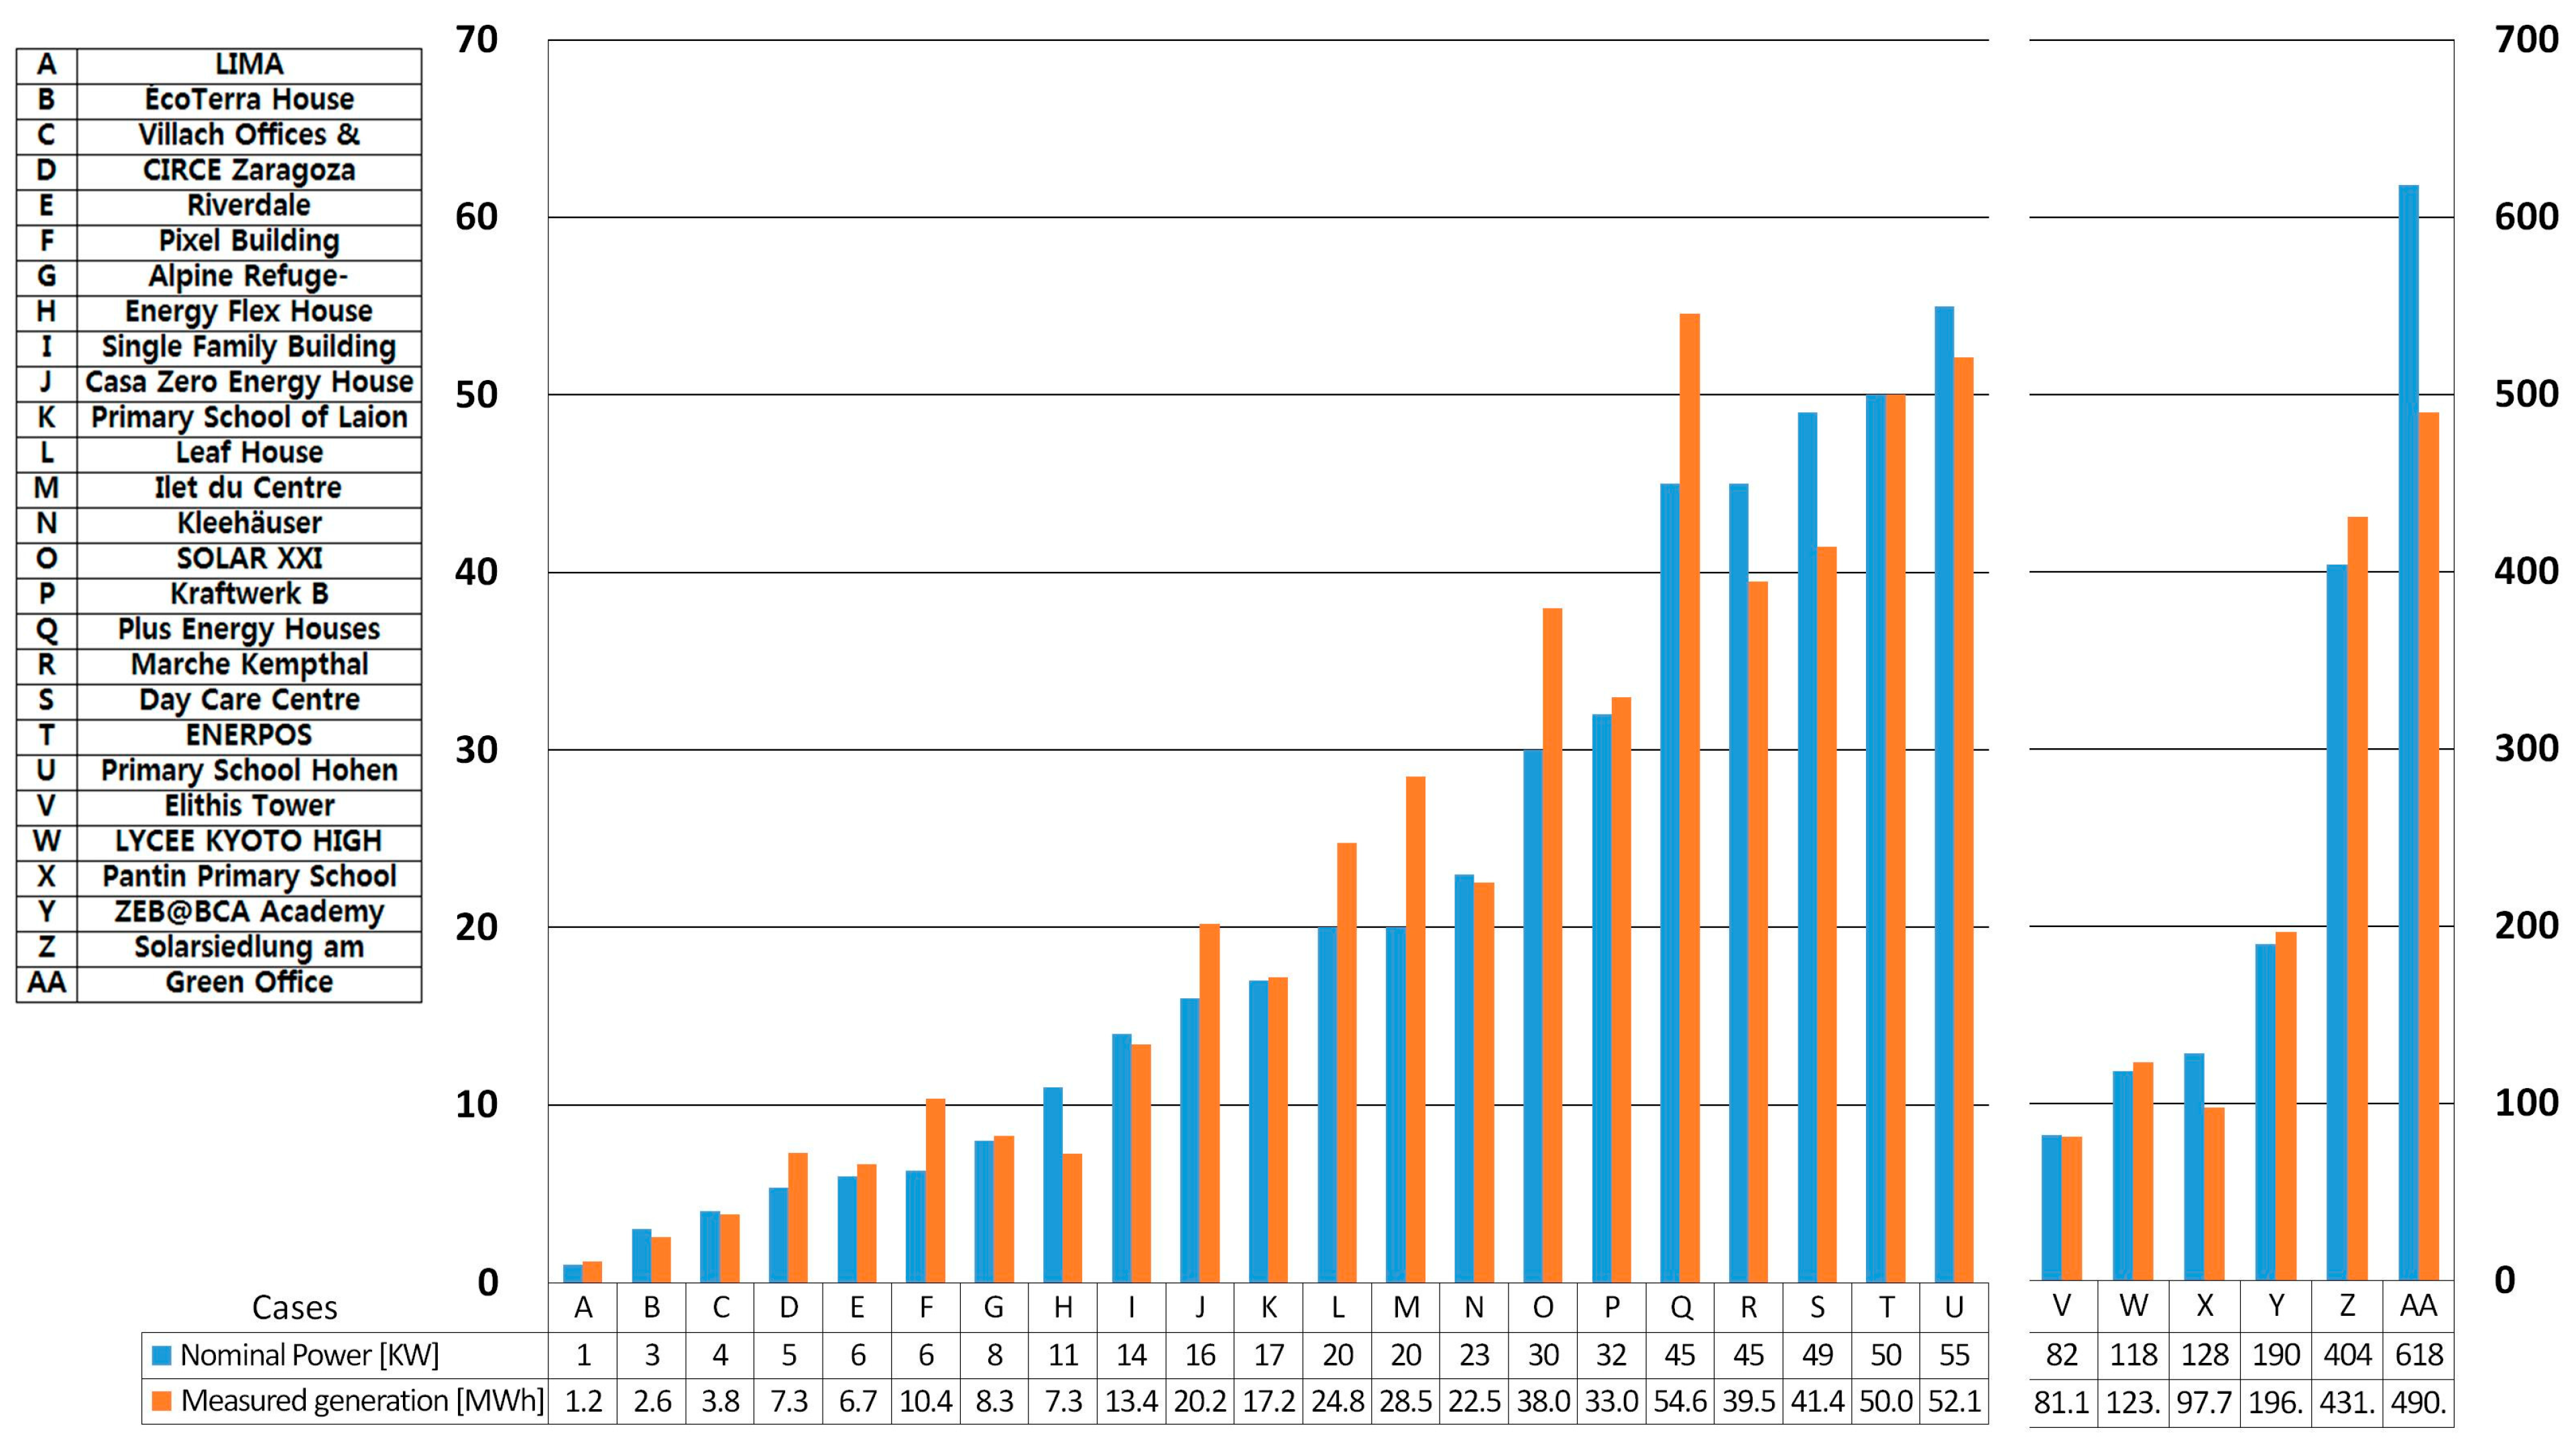
Figure 11 shows the nominal power of each PV system and the annual power generation for 27 NZEB cases arranged in ascending order.
From the graph, it can be deduced that case F has a larger amount of power generation than case E even though the two cases have the same nominal power. The measured generation of case F is much greater versus its nominal power. This can be explained by case F incorporating a tracking PV system, unlike other cases.
Case D has a smaller nominal power compared to case E, but a higher measured generation. Case H has a larger nominal power compared to both cases F and G but a lower measured generation. Cases D, F, J, L, M, O, and Q showed outstanding power generation versus nominal power, whereas cases B, H, R, S, U, and AA showed poor generation. Compared to case Z, case AA had a far larger nominal power but only a slightly higher measured generation, indicating low efficiency. While other cases involved installation on roofs or walls at an angle between 10 to 50 degrees, part of the PV system of case AA (approx. 52 kWp) was installed perpendicularly on a wall at 90 degrees.
Six cases featured PV systems installed on walls, but only four cases involved perpendicular wall surfaces (90 degree angle). For all four cases, the systems were partially installed at 90 degrees. Even for cases with PV systems installed on walls, the installation angle was set to maximize radiation. Among all 27 cases, case F (Pixel building, Australia) and case M (Ilet du Centre, Reunion) had the most outstanding power generation versus nominal power, while case H (Energy Flex House, Denmark) was the poorest.
Figure 11.
Nominal power and measured generation of PV system in NZEB cases.
Figure 11.
Nominal power and measured generation of PV system in NZEB cases.
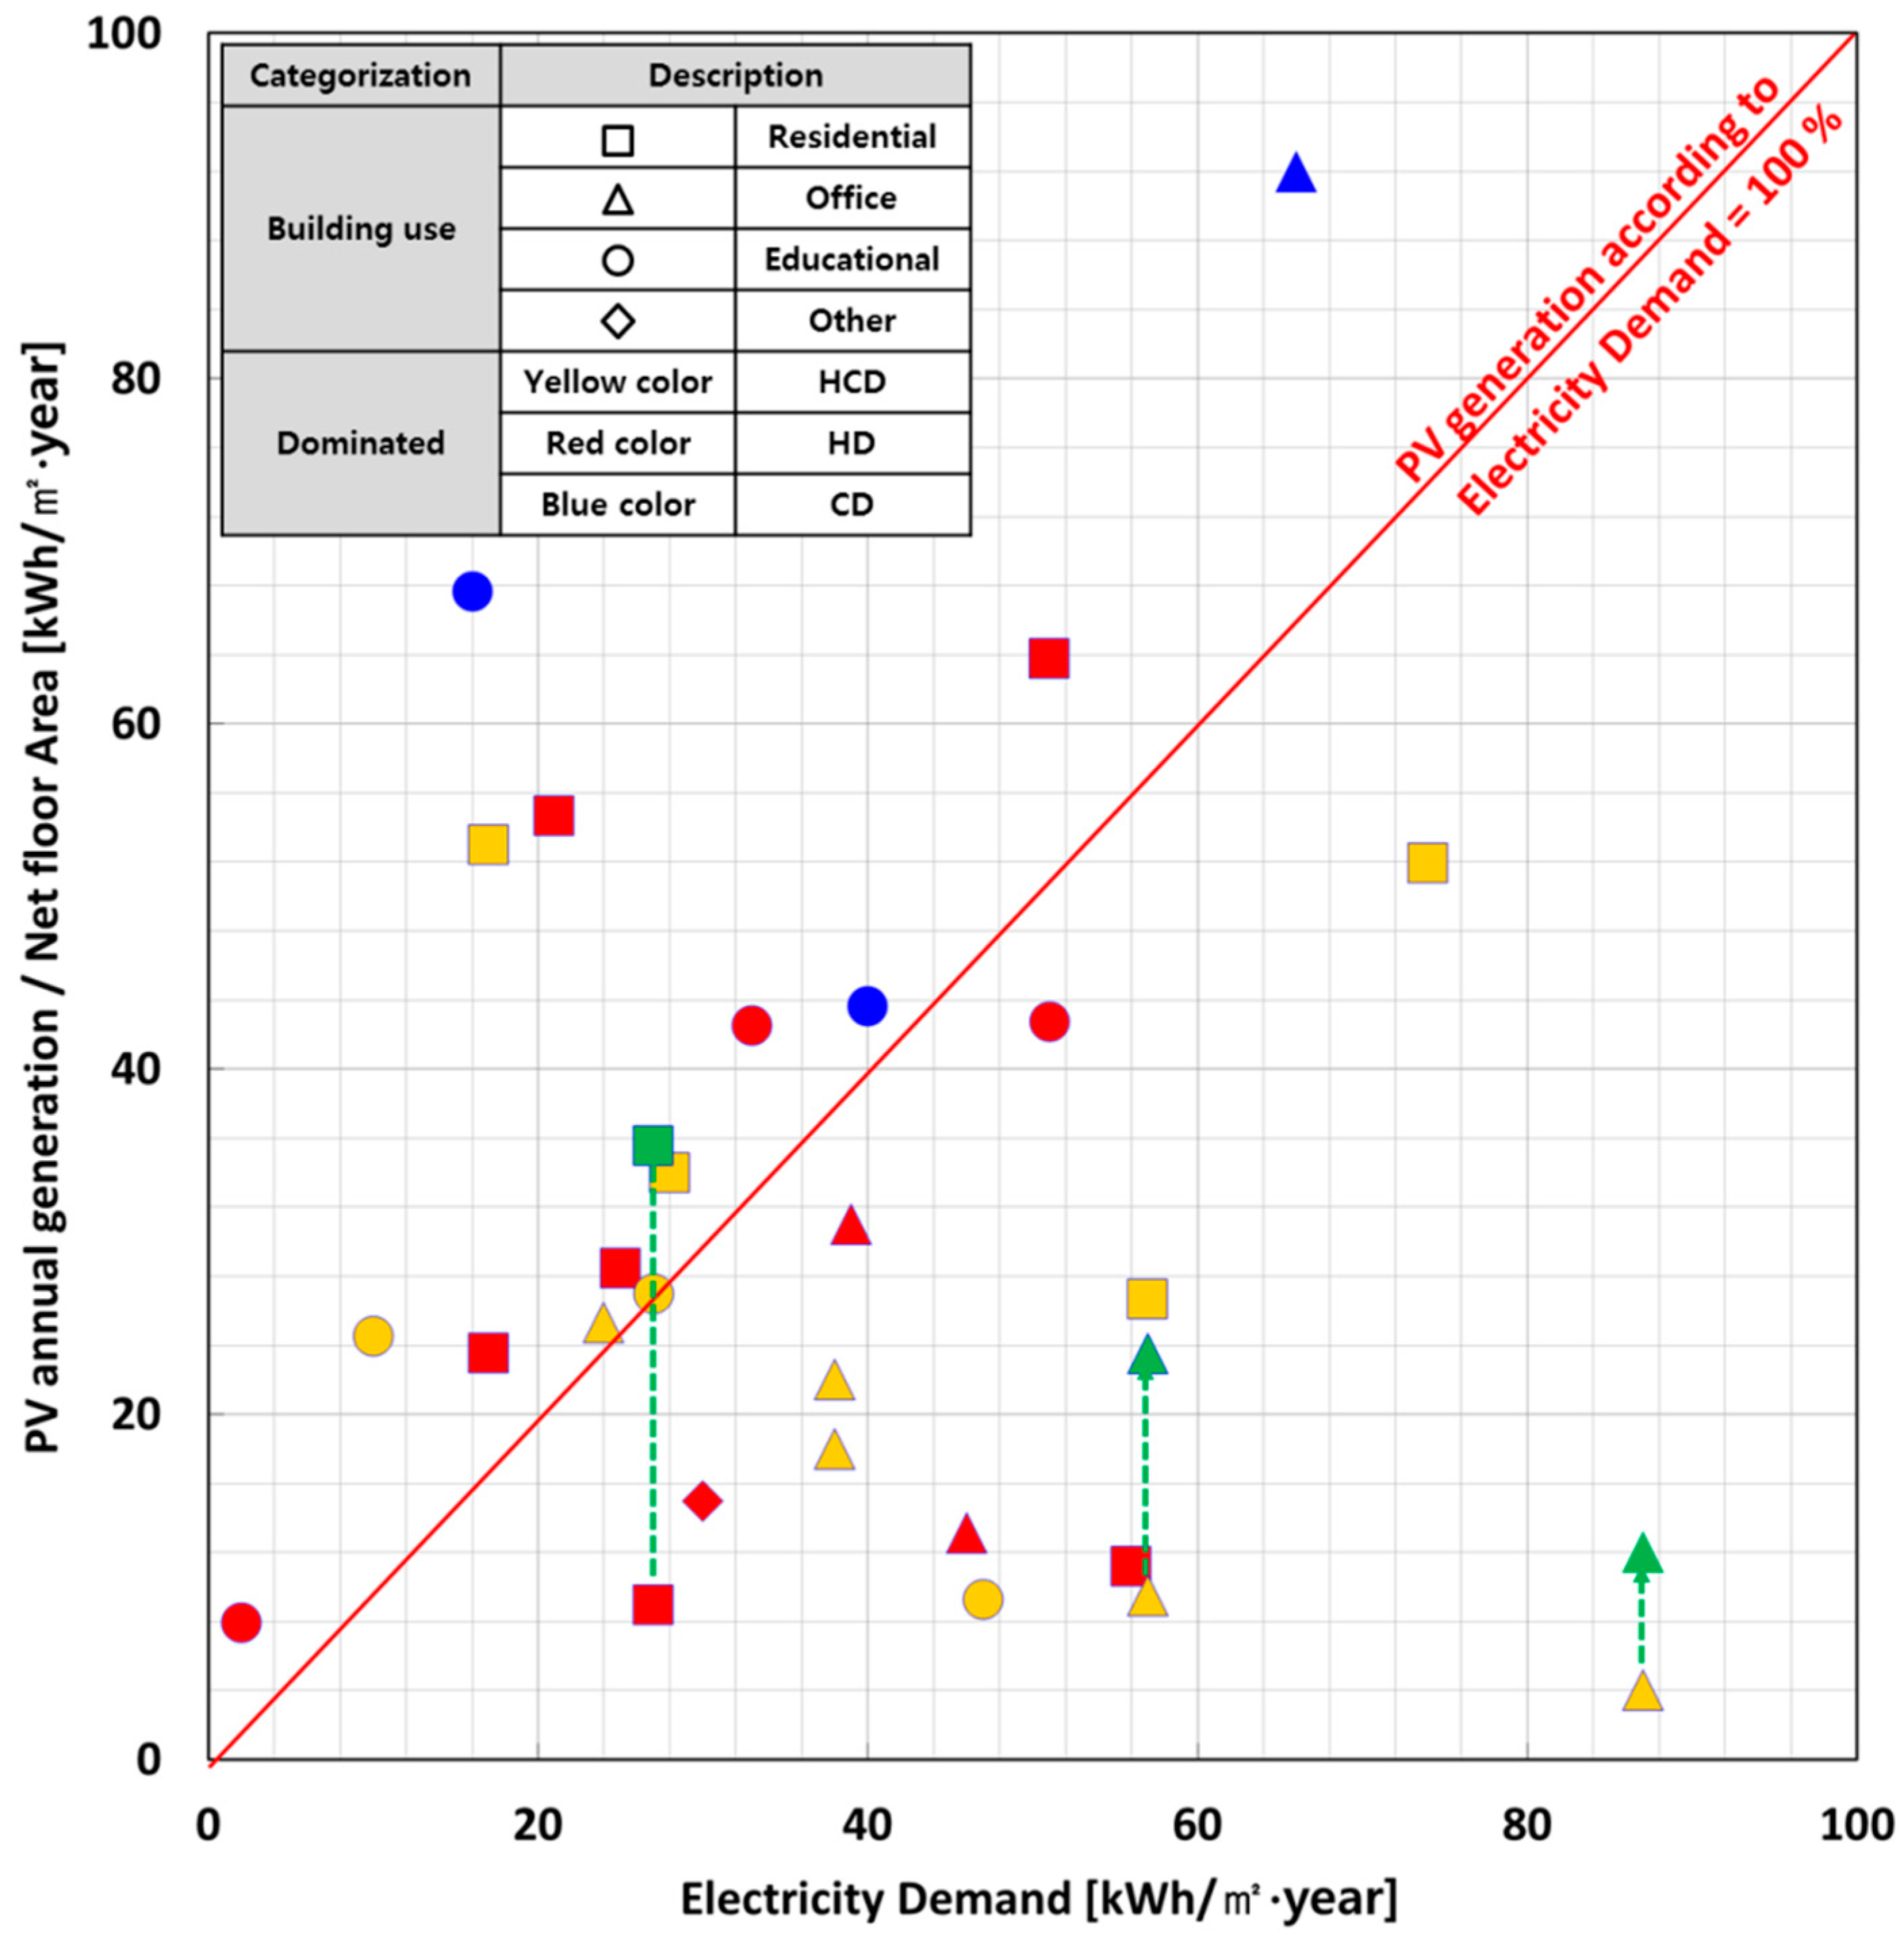
Figure 12 shows a graph of the annual PV power generation per unit area depending on the electricity energy demand of the 27 NZEB cases with PV applied. From the figure, the respective plots are distributed away from the PV generation/Electricity demand balance line. 15 cases (56%) had 100% electricity energy demand for the building in 27 cases. Furthermore, power generation in three cases with a CD climate offset the total energy demand. In addition, 14 cases (52%) of the subject buildings satisfied over 100% of the electricity energy demand from the PV system and were found to generate surplus electrical power. However, some cases showed very low PV power generation compared to the electricity energy demand. These cases were determined to have low PV power generation due to a malfunctioning system or because a low efficiency PV module was used [
37]. Wind power was also installed for three cases (depicted by green colored symbols in
Figure 12) to generate electrical power in addition to the PV system. For one case, the building satisfied the electricity demand, even when only a PV system was installed. Thus wind power generated surplus energy. Although the PV system was augmented with wind power in the second case, the building could not satisfy the electricity demand. Considering the third case, the building could not satisfy the electricity demand until wind power was integrated with the PV system.
Figure 12.
Balance of PV power generation and electricity energy demand of NZEB cases.
Figure 12.
Balance of PV power generation and electricity energy demand of NZEB cases.
4. Conclusions
In this research, through a case study of IEA SHC/EBC Task 40/Annex 52 NZEB, energy aspects of the PV system such as application methods and energy balance with a consideration of demand and production were analyzed. Results of the analysis showed that 70% of all the 41 types of PV systems that were applied to 30 cases of NZEB were installed on areas of roofs with effective solar energy gain; 34% of the total number of PV systems were applied as fully integrated BIPV systems. The remaining PV systems were attached as non-integrated PV systems on building facades or roofs. Therefore, it can be seen that there were not many cases of fully integrated PV systems that replaced building envelope materials. It can be said that fully integrated BIPV systems, when applied as building components, have great impacts on buildings in terms of architectural appearance and energy performance, as well as having effects on the PV system’s energy production. However, there are many aspects to consider when applying such systems to buildings, including economic viability, the harmonization of PV installation with the building exterior and structure, and surrounding environment; hence, the application of BIPV systems in buildings is difficult. Therefore, a variety of solutions, and consistent effort, will be required to make BIPV systems in NZEB a reality.
On the other hand, additional research results have showed that 57% of the NZEB cases use electricity for 100% of the energy demands for heating, cooling, and DHW. The rest of the NZEB cases fulfill an estimated 50% of their energy demands with electricity. Therefore it can be concluded that the electricity generation of PV systems in NZEB is essential.
Results indicated that for PV systems in NZEB cases, about 20% of the cases had relatively poor PV generation performance despite having similar levels of nominal power. For improved PV generation in NZEB, various attempts and efforts must be made to optimize running and design of PV systems including solar radiation and temperature characteristics. For those buildings that use electricity as their entire energy source, zero energy balance can be achieved through the installation of PV systems. Additionally, in 14 of the 27 cases in which PV systems were applied, all the electricity required in the buildings was supplied through electricity production by the PV system.
It is concluded that PV systems significantly contribute to net zero energy status for cases that demand electricity as their main energy source. However, in some cases, a wind power system was used to help achieve net zero energy balance, such that further analysis will be required to determine the effects of the combined application of PV systems with other renewable energy systems, such as wind power, solar thermal and geothermal energy systems. Furthermore, it is also important to analyze the characteristics of BIPV systems in relation to grid interaction and energy load matching.


