Article

Time-Use Patterns and Sustainable Urban Form: A Case Study to Explore Potential Links †

by
Edeltraud Haselsteiner
*,
Barbara Smetschka
,
Alexander Remesch
and
Veronika Gaube
Institute of Social Ecology Vienna, Alpen-Adria University Klagenfurt-Graz-Wien, Schottenfeldgasse 29, 1070 Vienna, Austria
*
Author to whom correspondence should be addressed.
This article is an expanded paper based on two conference papers (REAL CORP 2012 Re-mixing the city, 14–16 May 2012 in Schwechat, Austria; ENHR 2013, international conference, European network for housing research, 19–22 June 2013, Tarragona).
These authors contributed equally to this work.
Sustainability 2015, 7(6), 8022-8050; https://doi.org/10.3390/su7068022
Submission received: 7 February 2015 / Revised: 21 May 2015 / Accepted: 10 June 2015 / Published: 23 June 2015

Abstract

:
Linking time use of the inhabitants of a city with their energy consumption and urban form is an approach which allows integration of the social dimension into research on sustainable urban development. While much has been written about the planning of cities and its implications for human social life, the question of the relationship between time-use patterns and urban form remains underexplored. This is all the more astonishing as time-use statistics offer a unique tool for analysing socio-economic changes regarding family and household structures, gender relations, working hours, recreational behaviour and consumption patterns. Furthermore, spatial planning plays a significant role in establishing time structures. With this paper we aim to explore the possibility of using the time-use data of an urban population to find links between individual time-use patterns and urban form. We describe a case study in Vienna where we addressed time use and mobility of citizens in a participatory approach to jointly develop an integrated socio-ecological model of urban time-use patterns and energy consumption.

1. Introduction

Time-use structure of household members (including phenomena such as time squeeze and synchronization of activities of different persons), the energy requirements of households and the spatial organization of cities are connected with each other. Crossing larger distances between locations for activities requires more time, more energy or both. Consequently, lack of time often translates into spending more money and more energy, severely constraining individual and household choices. Further, time sovereignty, i.e., freedom of choice over one’s time use, is considered to be a key feature for quality of life. Available time, as much as available money, governs everyday decision-making of household members concerning living space, consumption patterns and means of transportation. All of these activities consume energy (transport energy, heating/cooling energy, etc.).
As part of the ongoing UTE research project (Urban Time and Energy: A socio-ecological model for assessing time use and energy metabolism), we aim to gain greater insight into the drivers of time-use patterns and energy use by focusing on time-policy measures that consequently impact the energy and material consumption activities of urban households and the necessary urban infrastructure. An integrated socio-ecological simulation model is being developed to study the linkages between time-use patterns in differently structured areas of the city of Vienna and urban energy consumption. With time-use patterns for the daily routine of citizens on the one hand and the urban energy flow on the other, we aim to explore how different urban planning or transport planning policies could lead to more sustainable time-use patterns.
Our research is based on a broad range of literature review, data analysis, model development, expert interviews and a participatory process. In this paper we focus on the latter, the participatory process, to explore links between individual time-use patterns and urban form. For this, a case study was carried out in the city of Vienna to learn more about drivers of individual time use of citizens and gain systematic understanding about correlations with urban form. The case study area was selected by a two-step analysis: a factor analysis to group and reduce indicators into main components, and a cluster analysis using the factor scores for each neighbourhood area. The finally designated neighbourhood area is one of the most densely populated areas in Vienna, centrally located with good public transport infrastructure, and a dominating building stock of the Founders’ Period. The urban district is just at the beginning of a revitalization process, an urban renewal office has been installed to actively support and coordinate revitalization and participation processes. By using qualitative interviews and workshops with representatives of important stakeholder groups, first assumptions about drivers behind time-use patterns were generated.
In this paper we focus on possible interrelations between time-use patterns and the urban space. A comprehensive review of key publications and transdisciplinary concepts that link time use, urban form and energy consumption are introduced in Section 2. In Section 3 we describe our methodical approach to find potential links between time use and urban form. In a case study in Vienna we addressed time use and mobility of citizens in a participatory approach to jointly develop an integrated socio-ecological model of urban time-use patterns and energy consumption. This case study is presented in detail in Section 4. The integrated socio-ecological modelling approach, which will guide our further research to synthesize concepts and insights from social and natural sciences into a coherent picture and thereby help to better understand the interrelations between various drivers behind the trajectories of socio-ecological systems, is presented in Section 5. Preliminary findings are discussed in the Section 6 and further steps finally summarized in Section 7.

2. Linking Time, Space and Energy

2.1. Time Policy and Time-Use Research

Time policy and its research is a young interdisciplinary field aiming to integrate time aspects in urban development planning and decision-making processes. In the early 1980s in Italy it was largely a result of linking gender issues to urban planning and transport [1,2,3,4], and it also has a tradition in Germany [5,6,7] and France [8]. These studies address the question of how major changes in western industrialized societies over the past 50 years—i.e., the increase in female employment, the shift to a knowledge society and changes in production and consumption patterns (Post-Fordism, precarious work, internationalization of labour)—lead to new patterns of time use, like more flexible working hours, multitasking, new working modes and different needs for services and infrastructure. In addition, they focus on how arising issues of time pressure and time conflicts can be addressed in terms of political measures concerning the times of a city [9]. The project draws on the international preliminary work and experiences gained from time-policy projects in Italy, Germany, France and the Netherlands. A few years ago, Vienna has launched an assessment of the potentials of communal time-policy in a feasibility study [10]. Similar to other international model projects, this study aimed at optimizing time issues in order to improve citizens’ quality of life and their “time affluence”.
In sustainability sciences, it is important to find indicators to assess quality of life and changes therein. Time use is an integrative aspect of many facets of quality of life and is seen as a helpful element to monitor [11,12,13,14,15,16,17,18]. The terms “time scarcity” and “time affluence” [19,20,21,22] are used to link economic and social factors and to find alternatives to a solely economic notion of growth and development [23,24,25]. Eurofound, the European Foundation for the Improvement of Living and Working Conditions, examines in its European Quality of Life Survey a range of issues, such as employment, income, education, housing, family, health, work-life balance, life satisfaction and perceived quality of society. Having sufficient time to fulfil both professional and personal goals—raising children, caring for older relatives, maintaining social and family contacts—is a crucial element in determining a good quality of life. However, findings from the European Quality of Life Survey 2007 indicate that work-life balance remains an elusive goal for many working Europeans [26,27].
Linking sustainability research with time-use research is gaining some importance in socio-economic national accounting, in non-monetary input-output approaches [28,29,30] and in other new attempts to strengthen socio-economic features within sustainability discourse [31,32,33,34,35].

2.2. Time-Use Patterns and Urban Form

The first approaches to integrating time aspects in regional and geographical studies already appeared at the beginning of the 1970s. A central model was the space-time aquarium developed by Hägerstrand [36]. The movement of humans is demonstrated in a three-dimensional model, whereby the area is represented as two-dimensional map and the temporal dimension in the vertical Z-axis is supplemented. Range of movement and speed depend on outside factors and are subject to certain restrictions. Hägerstrand divides these restrictions into three categories: capability constraints, coupling constraints and authority constraints. His seminal paper “How about people in regional science” was the beginning of time-geography. Hägestrand’s activity approach influenced fields ranging from urban planning to social sciences [37,38,39,40]. However, his approach was most widely adopted in transport studies, largely because of its ability to represent individual behaviour and transport accessibility [41,42,43]. Today, GIS methods have made it easier to integrate space and time. With modern communication technologies, such as internet and cell phones, new questions about spatial and temporal constraints have been raised, as people can be at different places at the same time, but also new perspectives of mapping and visualization of activity-based movements have opened up [44,45].
A city’s time map—its fast and slow speeds, working and opening hours, the locations of its businesses and its mobility infrastructure, which together set the pace for how its inhabitants move in it—is of major importance for the temporal quality of city life and work [11,46,47]. While much has been written about the integration of time and space in geography and transport science, there are few surveys of the interdependencies between time use in cities and their connections with urban form [47]. Henckel and Herkommer [48] refer to the “temporal topography of cities” as an “indicator for quality of life”. In light of Levine’s [49] “pioneer step to an empirical approach to the question of the speed of cities”, they ask for the driving forces of urban speed and conclude with the demand for a “chrono-urbanist perspective” in urban studies.
The influence of urban form and energy consumption is particularly discussed with regard to transport planning [50,51,52]. Schafer et al. [53] found that on average a person spends 1.1 h per day travelling. This time budget, together with a precise idea of the travel money budget—depending on their income level—is stable over space and time. His findings indicate that with greater distances citizens shift to faster modes of transport. The vision of a sustainable city is strongly associated with less dependence on automobiles and urban areas linked by public transport systems. Apart from transport, a number of principles related to energy, water and food security, conceptual models for zero-emission and zero-waste urban design, or the importance of social sustainability [54] have attracted increasing attention in the international debate.
Urban sprawl is seen as a major challenge for today’s cities [55,56,57]. In opposition to efforts to counter large-scale expansion in terms of area, land-use is constantly growing. For example, in Austria, 15 hectares of land are transformed daily into construction sites and transport infrastructure [58]. Along with the loss of land as an important future CO2 sink and source of energy and raw materials, the high ensuing costs (infrastructure costs for construction, maintenance, repair and renewal) and all further climate-related consequences of urbanization (increase in individual motorized transport, expansion of additional traffic routes, great use of fossil energy sources, etc.) are alarming. Contemporary models of built environment and spatial planning aim to align themselves again with the historical city. Knoflacher describes a “space-time dimension on the human scale” in the historical city whereas the “new city” is oriented along a “space-time dimension for machines” [59]. Concepts of the “compact city” or the “city of short distances” are favoured in contrast to the inflexible, divided and homogenous use of spaces [60,61,62]. Many authors outline three aspects of the compact city: a high density of population and built environment, a mixed-use city with a varied mix of supply of facilities and services and intensified urban land-use.
A growing body of research analyses potential indicators for a sustainable urban form [63,64,65,66]. Usually a mix of socio-economic indicators together with indicators that describe landscape metrics is proposed [67]. In recent times, the question of standardization of cities had been introduced, in response to the international trend to establish Smart Cities. However, there are no mandatory definitions for Smart City concepts so far. On the contrary, various meanings and interpretations exist, usually reflecting commercial or political interests. As a first step of harmonization, the International Organization for Standardization (ISO) published in 2014 the standard ISO 37120:2014 [68], “Sustainable development of communities-Indicators for city services and quality of life”, outlining a set of indicators to compare and evaluate cities.

2.3. Urban Energy Use

Departing from energy metabolism as a crucial concept in assessing society-nature interaction and sustainable development [69,70] we focus on energy use. Urban energy use can best be understood from a demand perspective, not just for final energy forms, such as electricity or transportation fuels, but for energy services [71,72]. Each household and economic activity in urban areas can be interpreted as a demand for energy services, such as mobility (physical access to certain destinations and certain goods), ambient temperature (hotter or colder than the local climate), or working appliances (for home, office and industry, communications, etc.). These urban energy services are common to most urban areas, but the energy consumed to provide them varies greatly. Household demand for energy services changes depending on several factors, which can be categorized as economic, demographic and behavioural.
The positive correlation of income and energy use has been long established in the traditional energy literature, especially in national level analyses. Energy use correlation with income has been measured for households in the Netherlands [73], India [74], Brazilian cities [75], Denmark [76] and Japan [77], with similar results for GHG emissions in Australia [78] and CO2 emissions in the USA [79]. Urban dwellers consume energy directly, in their homes and vehicles, and indirectly, through the goods and services they purchase. Since urban incomes are often higher than the national average, by this metric alone, urban populations can be expected to consume more energy than non-urban populations.
Demographic factors such as population growth, household size, average household age and migration influence urban energy usage. Household size plays an important role in energy use: above two persons per household, economies of scale can reduce the energy consumed per capita. Urban populations may have significantly smaller household sizes than rural populations, due to smaller family sizes and a larger generation gap as well as smaller dwellings, and are thus less likely to shelter extended families or many generations under the same roof. The evidence for the influence of age is mixed. In Sydney, increasing age was correlated with higher residential energy consumption but lower transportation use [80]. The most important effect of age may be through resulting changes in household sizes.
Behavioural or cultural factors clearly influence energy use: e.g., using a car, especially a big car or SUV, as a social status symbol, compared to using the bus or a bicycle. Individual behaviour and household decisions on dietary patterns, eating habits, preferred ways to spend leisure time and many other elements are surveyed in research on sustainable consumption and possible rebound effects [81,82,83,84,85,86,87]. Recent research on energy consumption and gender aspects [88,89], on household behaviour according to energy use [90,91] and studies on individual mobility types [92] and sustainable lifestyles [93,94] will supply valuable guidance for potential time use and energy scenarios.

3. Research Design: Time-Use Data and Urban Form Indicators

Time-use research is an interdisciplinary research field interested in how people spend their time during an average day, i.e., what activities they pursue for how long sometimes including information on locations or other people present. This information is usually collected in the form of time diaries using time-use surveys. We use such a time-use survey to analyse linkages with urban form and infrastructure, aiming to expose sustainable energy consumption patterns. These in turn can be influenced either by behavioural changes in individual time use, or by structural changes in the urban fabric and infrastructure. Our methodical approach and how to define and measure time use and urban form is subject matter of this section.

3.1. Time Use: Data and Definition

In socio-ecological, research time use can be classified according to its function in different systems. Time is used by individuals to produce and reproduce the personal system, the household system, the economic system and the community system [95]. These classification can be translated into time-use categories with the terms developed by Minx & Baiocchi [28] and can be operationalized with data from actual time-use surveys (Table 1). The time needed for mobility between activities can be included to the four categories. For the purpose of this study we decided to take time needed for transportation (by whatever means) as an extra category, as this is an important activity related to urban form and ideas on sustainable development of cities.
Table 1. Time-use activities and equivalent re/production of system.
Re/Production of systemEncompasses activities from Austrian time surveyTime-use category
personPersonal Care & SleepPersonal time
householdHousehold & Food; Family, Care & SupportCommitted time
economyEmployment & StudyContracted time
communityLeisure & Activities for society, politics, cultureFree time
transportTravelTravel time
A number of European nations conduct time-use surveys on a regular basis. These data are widely used to analyse changes in gender relations [28,29,30,31,32] and socio-economic changes like family and household structures, working hours, recreational behaviour and consumption patterns [22,33,34,35]. Statistics Austria finalized a new time-use survey for Austria in 2009, which serves as a data base for this research [36]. In this survey, 8234 respondents living in 4757 households have been asked to record all activities for a full day in slots of 15 min between 5 a.m. and 11 p.m. and of 30 min during the rest of the day. Respondents were allowed to report up to two simultaneous activities. Aside from their time use, respondents were asked to take down information on the presence of other people and the location. No pre-defined activity categories were provided, but activities were recorded in the respondents’ own words. The resulting survey sheets were then transformed into 427 activity categories by trained coders. Examples of very broad activity categories derived empirically are shown in Table 1.
With this very detailed measurement of time use as a foundation, we are able to empirically analyse the link between time use and various socio-economic and socio-demographic variables that were recorded together with the time-use survey. This enables us to assign time-use values to each activity category of the agents in the agent-based model based on these socio-economic and socio-demographic variables like age, household size, income, presence of children in the household. For example, a household without children will have no time use for child care assigned in the agent-based model.

3.2. Definition and Indicators of Urban Form

Relevant studies provide a wide range of significant parameters for urban form [63,68,96,97]. The defining indicators range from various variables of density or land use to socio-economic and economic factors affecting the urban metabolism of a city, or transport related variables [63,64,67,97,98]. We focus on indicators for a sustainable urban form and ask for linkages with time use and impact on the environmental performance. Morphological characteristics of urban form, such as monocentric, polycentric, compact or dispersed are the most common indicators to define sustainable urban form. The causal relationship between time use and urban form is most evident in distance related parameters, but can also be seen in new forms of compressing time and space that have emerged against the background of new developments in information technology and new modes of transportation. Although it is difficult to precisely quantify savings in energy use from time-policy measures, the results of related publications provide evidence on the extent to which time use and urban form matter [34,99,100].
When assessing characteristics of urban form we concentrate on urban design concepts that have significant links with time use and energy consumption. Due to findings from the literature [54,63,64,65,66,97,98] and according to the requirement to operationalize them through time use related indicators, we focus on the following three key dimensions of urban design concepts: density, mixed land use and sustainable transport. In this context we define density as the density of population and buildings—in brief, the intensity of land use. Mixed land use refers to the diversity of functions within the urban area and the close proximity between housing, workplaces, educational institutions, leisure and supply infrastructure or green spaces. Sustainable transport is characterized by the public transport system, car ownership, modal spilt and the attractiveness for cycling and walking. Table 2 contains variables that operationalize these three dimensions of urban form and shows the assumptions which guide our research. Indicators will be measured on the city level; for more in-depth analyses, investigations on the district or even on the neighbourhood level are performed.
Table 2. Sustainable urban form and corresponding time-use activities.
Urban Form DimensionDefinition of sustainable urban formIndicators to measure urban form [city/district/neighbourhood]How these variables might affect sustainable time-use patterns and quality of life (e.g.)Time-use activities
DensityMaintaining resources and rural land through intense land use and restriction of urban sprawl Residential units per ha
Inhabitants per residential square kilometre
Per cent of households ≤ 2P./≥ 3P. per area
Urban density enables choice for more sustainable modes of transport (e.g., lower densities encourage car-use) and less travel timeTravel
Mixed Land UseEfficient use of transport infrastructure, energy and resources by mixed-use and diversity of functions: housing, workplaces, educational institutions, leisure- and supply-infrastructure in close proximity to one another Share of residential and industrial/commercial/transport (i/c/t) land use of the total built-up area [per cent]
Share of workplaces per area [No. per 1000 residents]
No. of supermarkets/public health care facilities/schools/day-care facilities/… per 1000 residents
Green area [sqm per 1000 residents/per capita]
Mixed Land Use minimizes travel time between activities, less commuting timeand travelling time for shopping, social interaction, leisure activities; different activities can easier be balancedHousehold & Food
Family, Care & Support
Leisure & Activities for society, politics, culture
Travel
Sustainable Transport (Infrastructure & Accessibility)Infrastructure and accessibility that facilitates more sustainable modes of transport (public transport, bicycle, walking)Km. of public transport system per 1000 residents
No. of public transport stops per 1000 residents
Pct. of commuters using a travel mode to work other than a personal vehicle
Km. of bicycle paths and lanes per 1000 residents
No. of personal automobiles per capita
Sustainable Transport facilitates multi-use of time (e.g., walking, cycling/health, mobile work in public transport), more time-sovereignty to use time of travellingTravel

3.3. How to Link Time Use and Urban Form

Our understanding of sustainable time-use patterns involves an urban life with low carbon emission, along with high standards of quality of life for city dwellers. In particular, urban form in connection with sustainable time use and quality of life means decentralized, well-mixed areas with little need for long commuting, because workplaces, educational institutions, living space and recreational space and facilities are close. At the same time it can allow for a higher quality of life and counters the ever greater acceleration of our lives, which leads to higher energy demands.
We establish our hypothesis about sustainable time-use patterns on three main morphological and functional parameters of sustainable urban form: density, mixed land use and sustainable transport. These parameters have been specified and operationalized with measurable indicators in Table 2. To explore interactions between urban form and individual time use, our research is guided by the following assumptions:
-
Urban density enables choice for more sustainable modes of transport and less travel time.
-
Mixed land use minimizes travel time between activities and makes stipulating different activities easier.
-
Sustainable transport enables multi-use of time (e.g., walking, cycling/health, mobile work in public transport), and more time-sovereignty to use time of travelling.
In our case study this hypothesis were adopted to the external conditions found in the given neighbourhood area. Density, mixed land use and sustainable transport, here in our understanding enabling design concepts of a sustainable urban form, were questioned and analysed in terms of influencing factors regarding individual time use.

4. Case Study: Fasanviertel, Vienna

Urban density is a key factor providing infrastructure, water and energy supply to people living closer together. In a case study in the city of Vienna, we explored individual time-use patterns of citizens in a participative process. Thereby, the local infrastructure and built environment formed the structural basis for our research. The aim of this step was to gather qualitative data on drivers of individual time use and to learn more about its links to urban infrastructure.

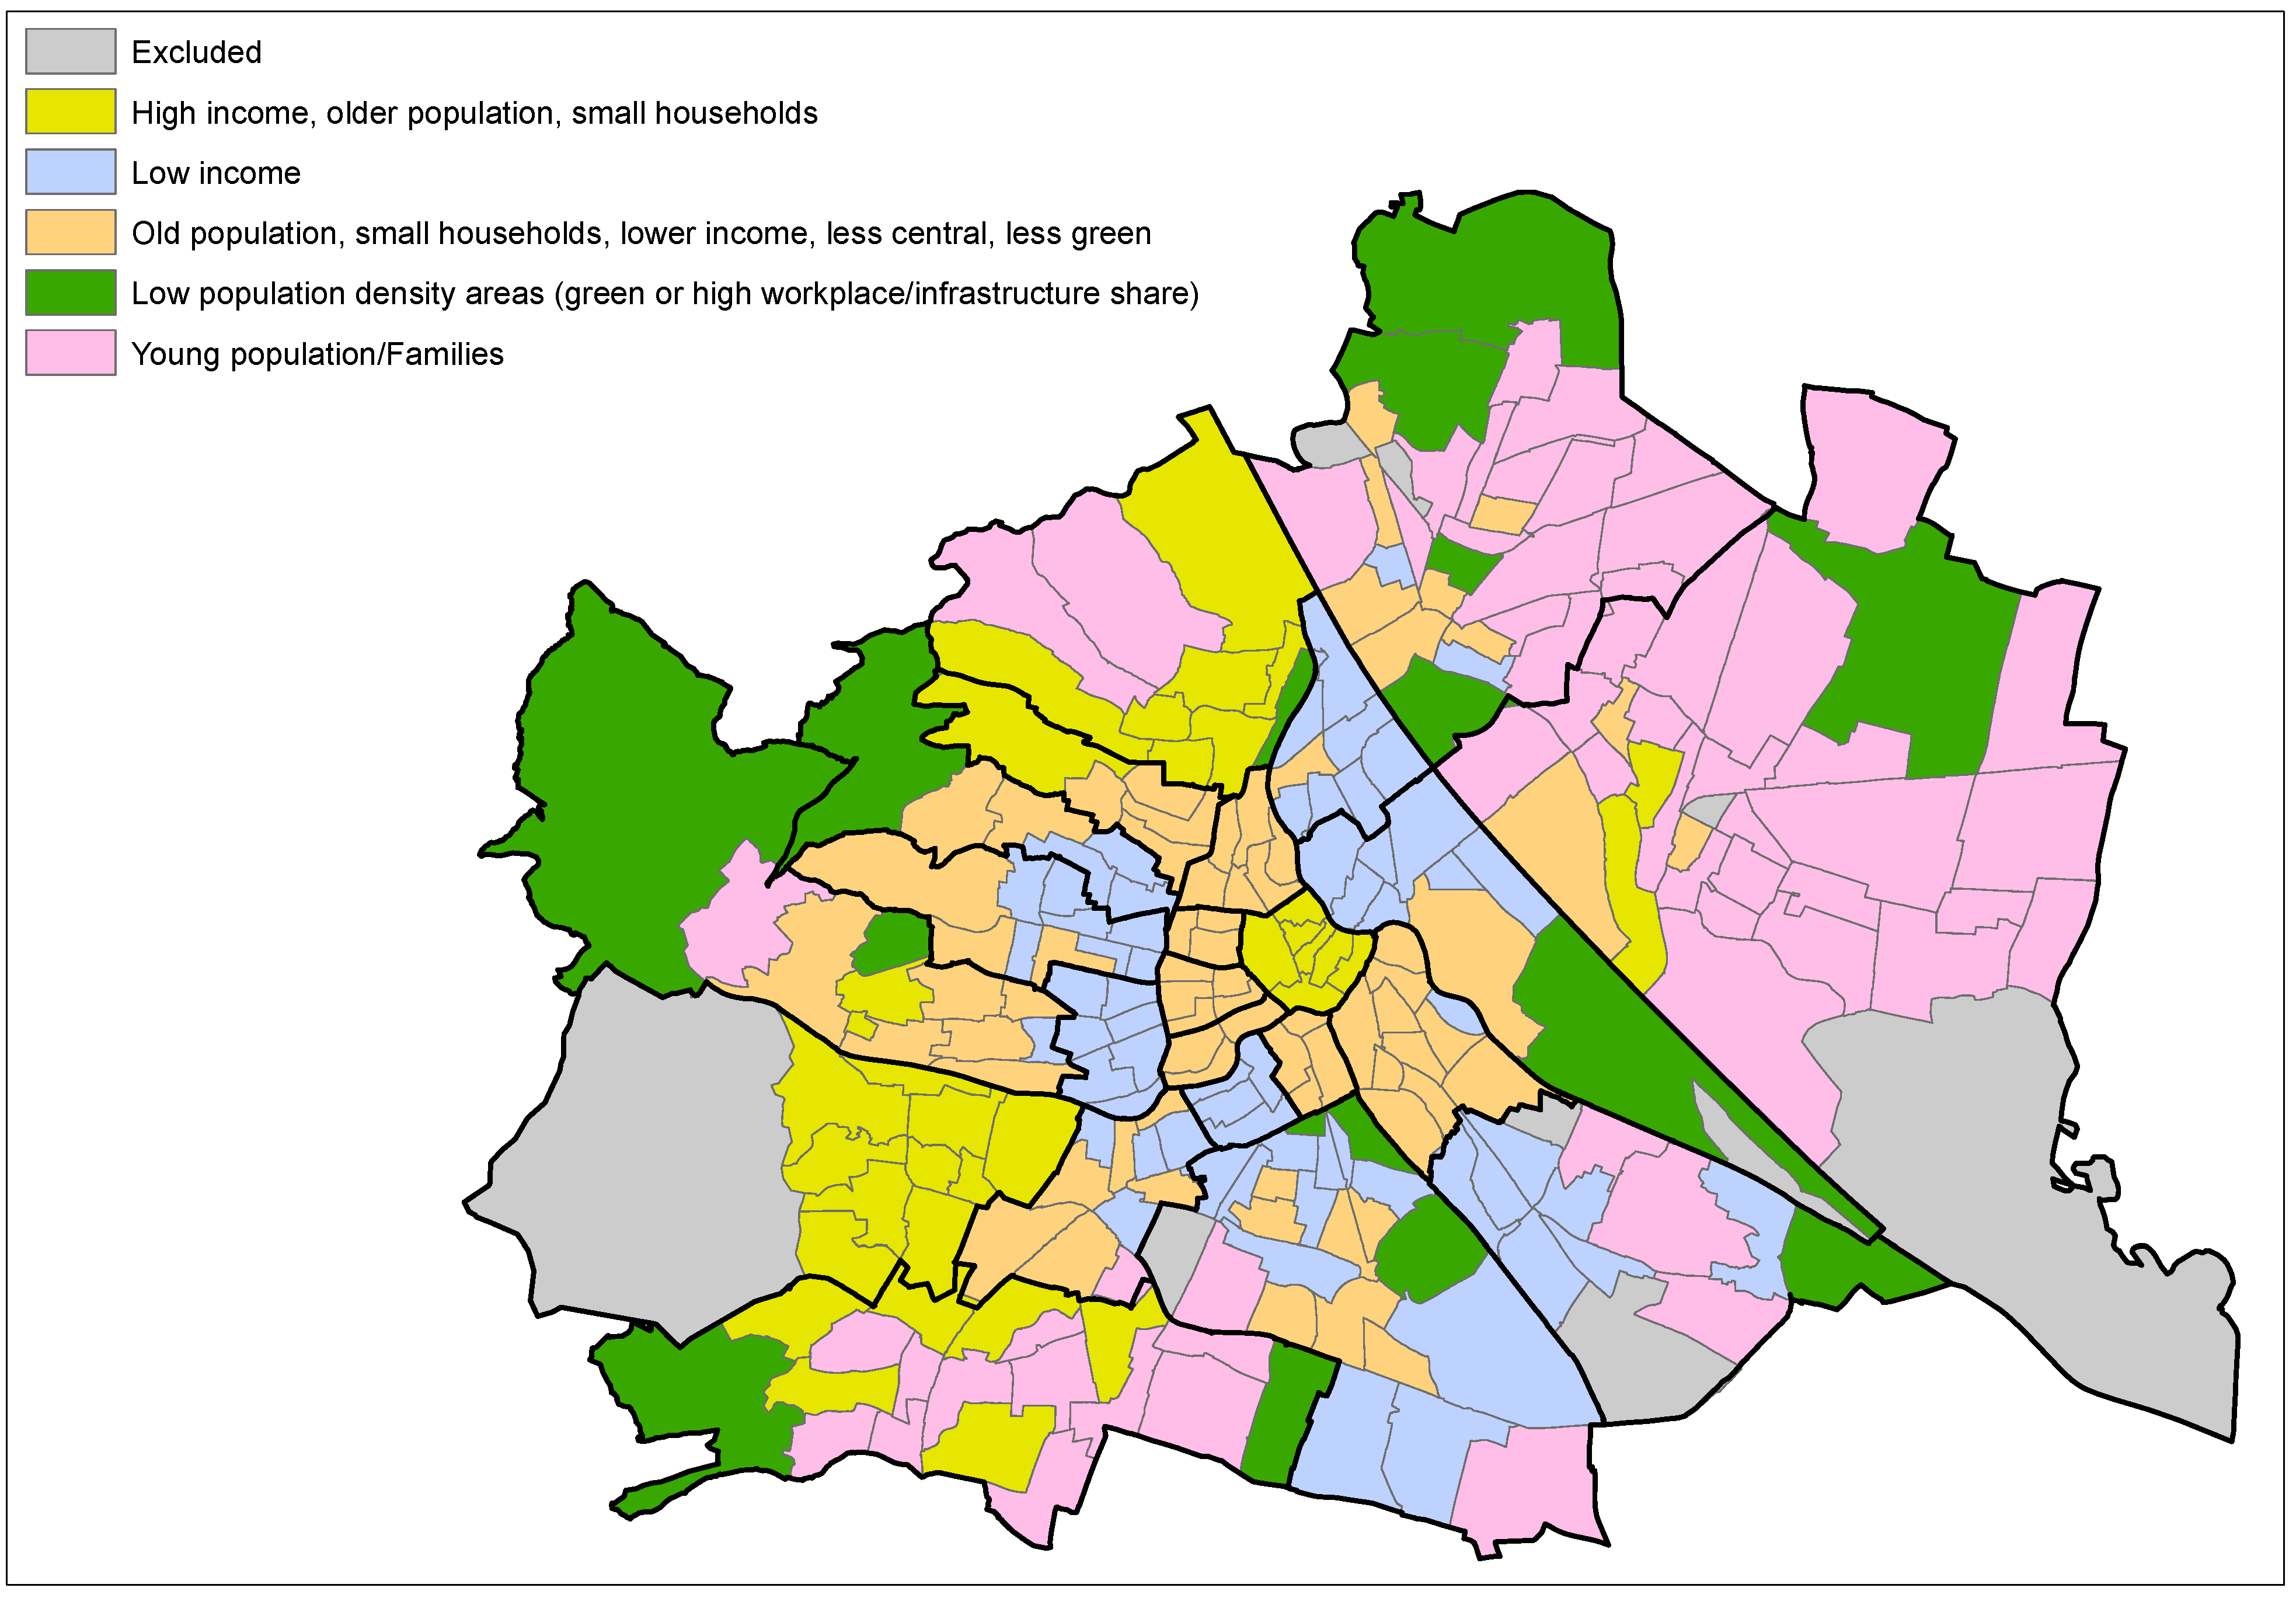
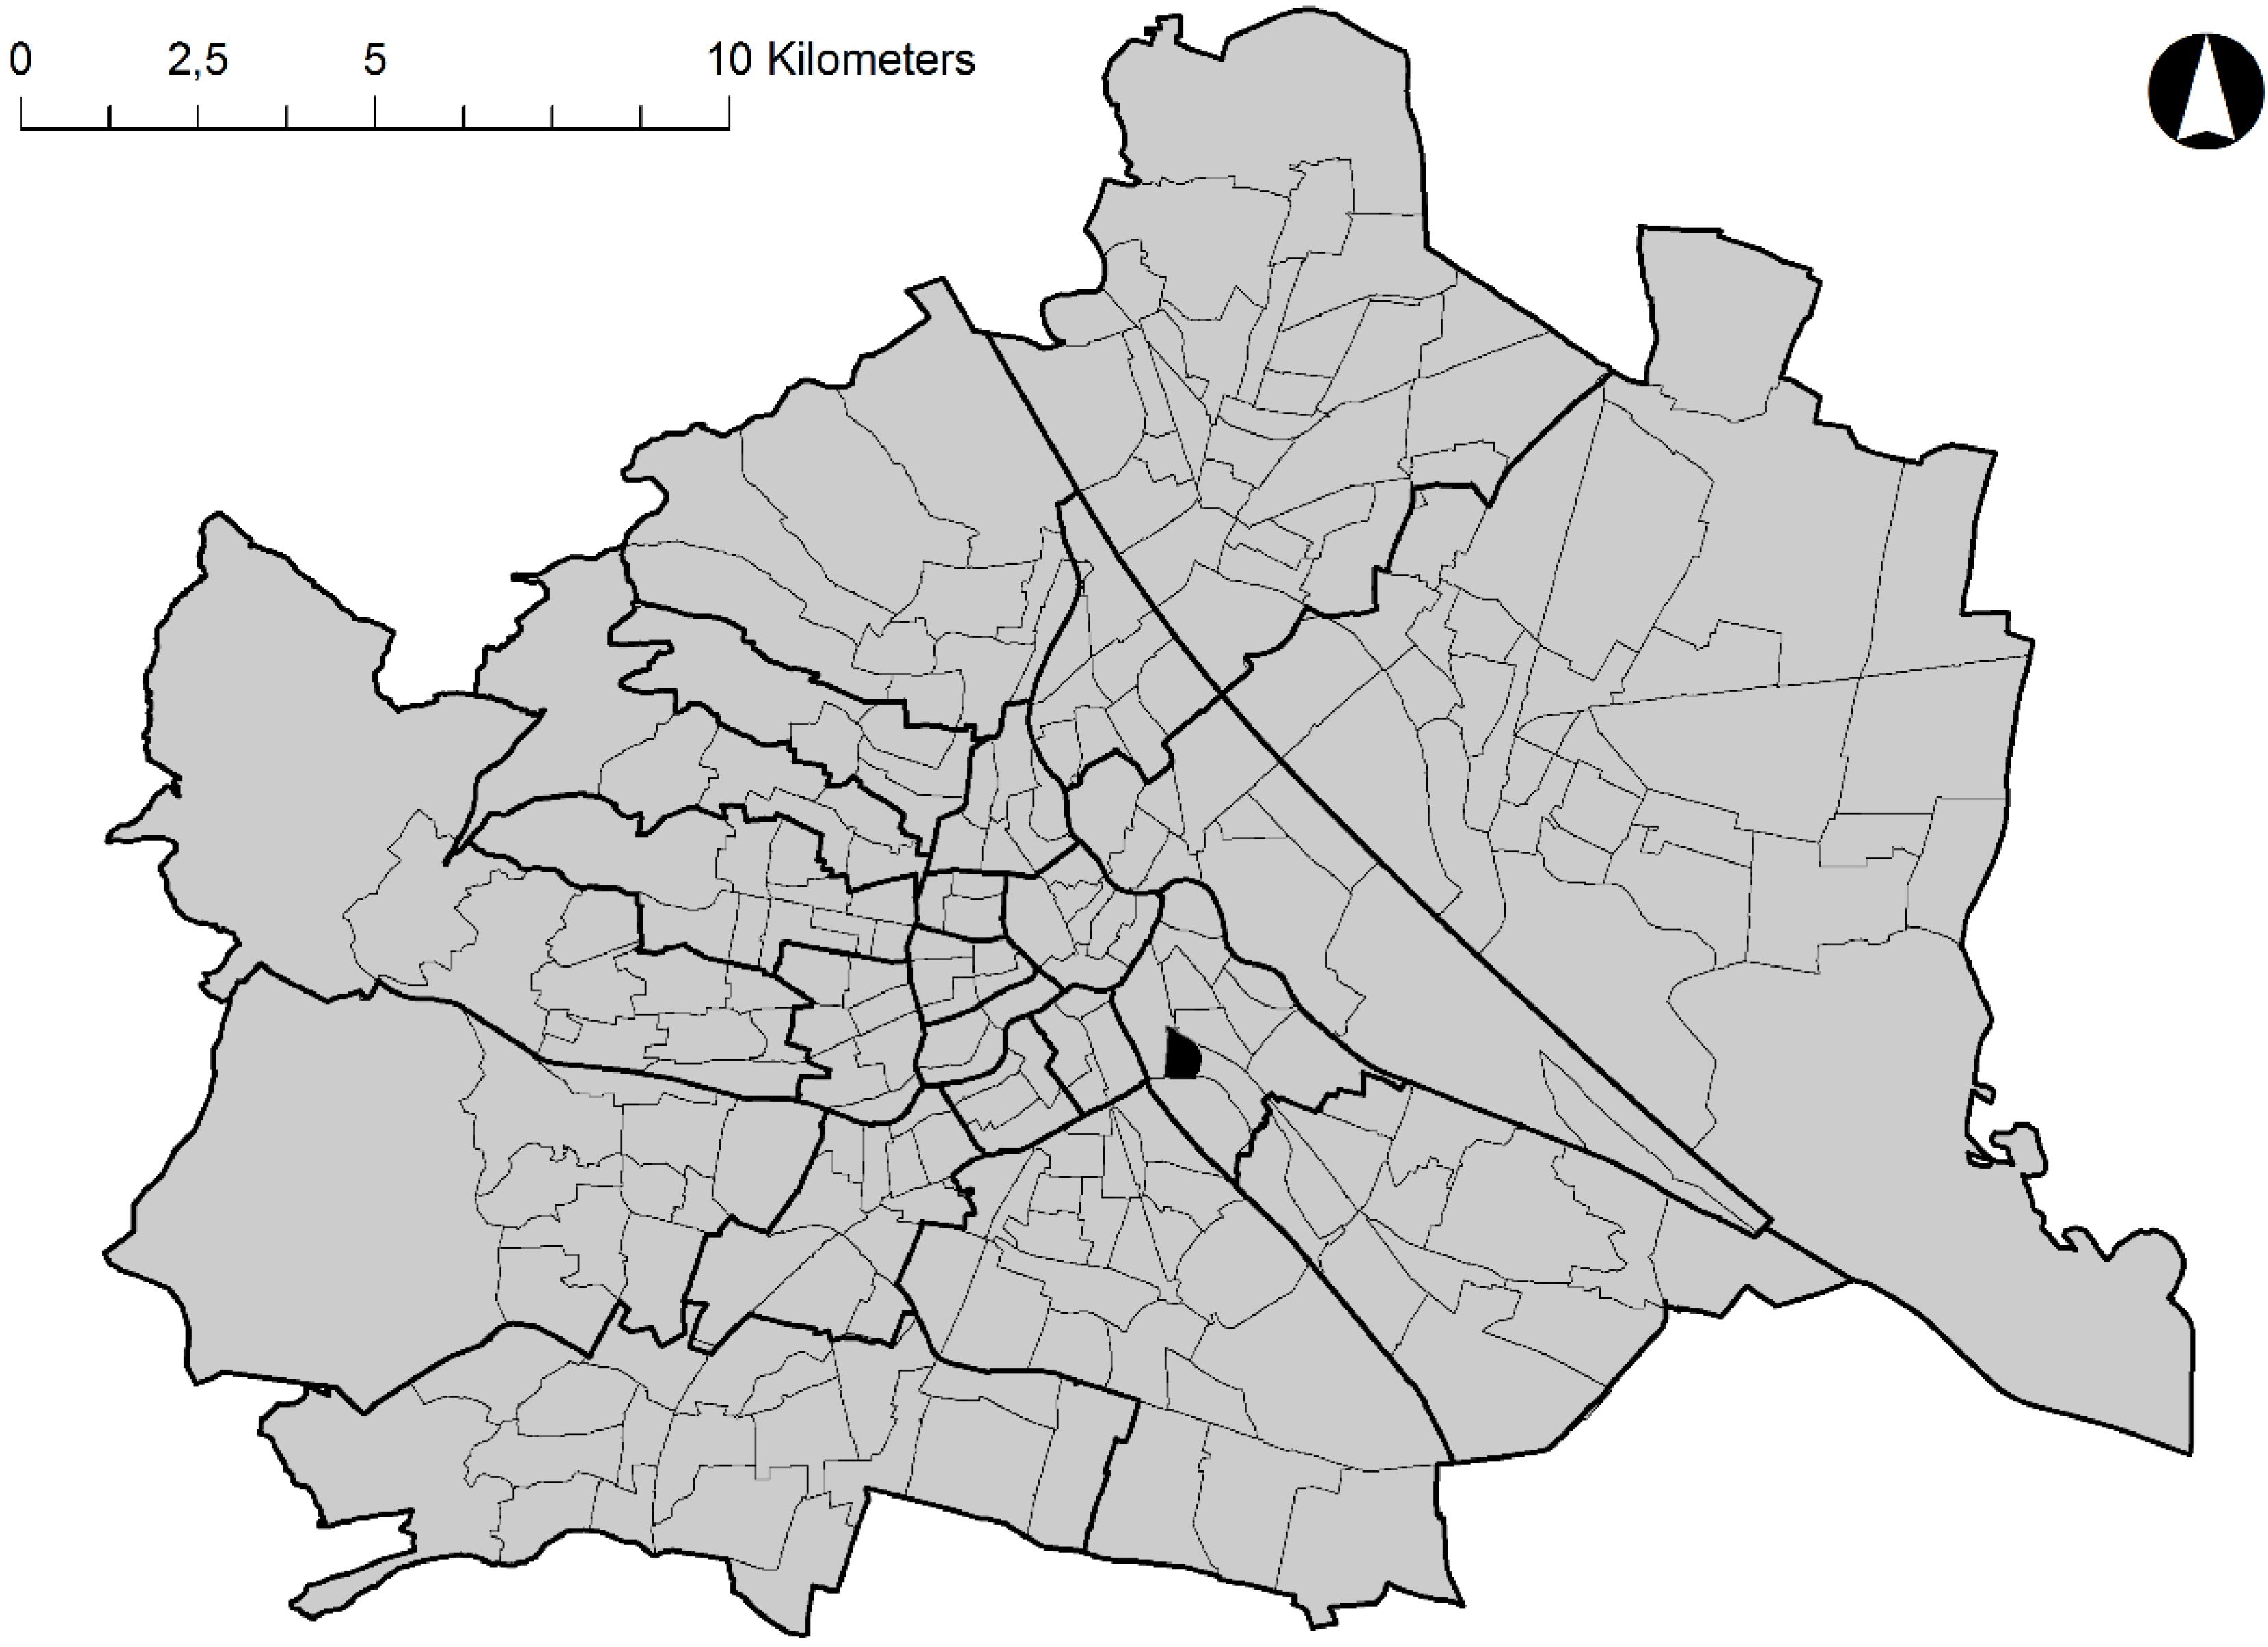
4.1. Case Study Area, Multi-Stage Selection Process

The project focus on the city of Vienna. Based on an analysis of seven groups of indicators shown in Table 3 in each of Vienna’s 250 neighbourhood areas (“Zählbezirke”) we specified our case study area.
The analysis consists of two steps: first, we conducted a factor analysis to group and reduce the indicators into main components and to reduce correlation between the indicators to a minimum for the second step. This second step involved a cluster analysis using the factor scores for each neighbourhood area and each main component.
Table 3. Indicators for selection of case study area.
PropertyIndicator
Age‰ of population ≤ 19 year/≥ 65 year
Household Size‰ of households ≤ 2 P./≥ 3 P.
Income‰ of persons with yearly income < €12,000/> €50,000
Green areaGreen area (sqm per 1000 residents)
WorkplacesNumber of workplaces per 1000 residents
Public Transport AccessNumber of public transport stops per 1000 residents (separate for sub-/railway & bus/tram)
InfrastructureNumber of supermarkets per 1000 residents
Number of schools + day-care facilities per 1000 residents
Main road km per 1000 residents
The factor analysis resulted in the following four main components or, more theoretically, typology of indicators for neighbourhood areas:
(1)
“Small households and old population”: higher representation of old residents and very low representation of young residents, high representation of small households.
(2)
“Commercial”: high per-capita number of workplaces, supermarkets, public transport stops, main road kilometres.
(3)
“Green”: high representation of green areas per capita, high per-capita number of schools/day-care facilities
(4)
“High Income”: large share of high income & low share of low income residents.
Prior to the cluster analysis, we excluded nine cells mainly because they are largely uninhabited. Table 4 gives an overview of the resulting five clusters and Figure 1 shows the classification of each cell resulting from the cluster analysis.
Table 4. Resulting clusters from the cluster analysis of neighbourhood areas in Vienna including average factor scores per cluster.
ClusterSmall Households & Old PopulationCommercialGreenHigh IncomeCluster Description
10.570.060.041.64High income, older population, small households
20.07−0.20−0.32−1.03Low income, less central, less green
30.72−0.18−0.14−0.16Old population, small households, lower income, less central, less green
4−0.041.602.34−0.26Low population density areas (green or high workplace/infrastructure share)
5−1.27−0.02−0.110.34Young population/Families
Figure 1. Classification of each neighbourhood area resulting from the cluster analysis.
Sustainability 07 08022 g001
The type of neighbourhood our case study area belongs to (cluster three, shown in orange in Figure 1) has the highest score for the factor associated with single or couple households, a high share of inhabitants aged 65 years or above and a very low share of young inhabitants aged up to 19 years. The average factor scores for the other three factors are slightly below average, indicating a generally lower share of workplaces, public transport infrastructure, shopping infrastructure, green areas, schools and day-care facilities, and high-income households.
As cluster three best represents important indicators of social change (ageing society, increase in single households) coupled with a higher share of low-income households and residences in urban renewal districts, it clearly belongs to the class of neighbourhoods presenting the greatest challenges for future development and urban planning. The result of the cluster analyses made obvious that Vienna’s third administrative district is almost entirely under this classification. Together with local experts from the Urban Renewal office, we decided to select the Fasanviertel, a small area of the inner part of this district which is just at the beginning of a revitalization process.

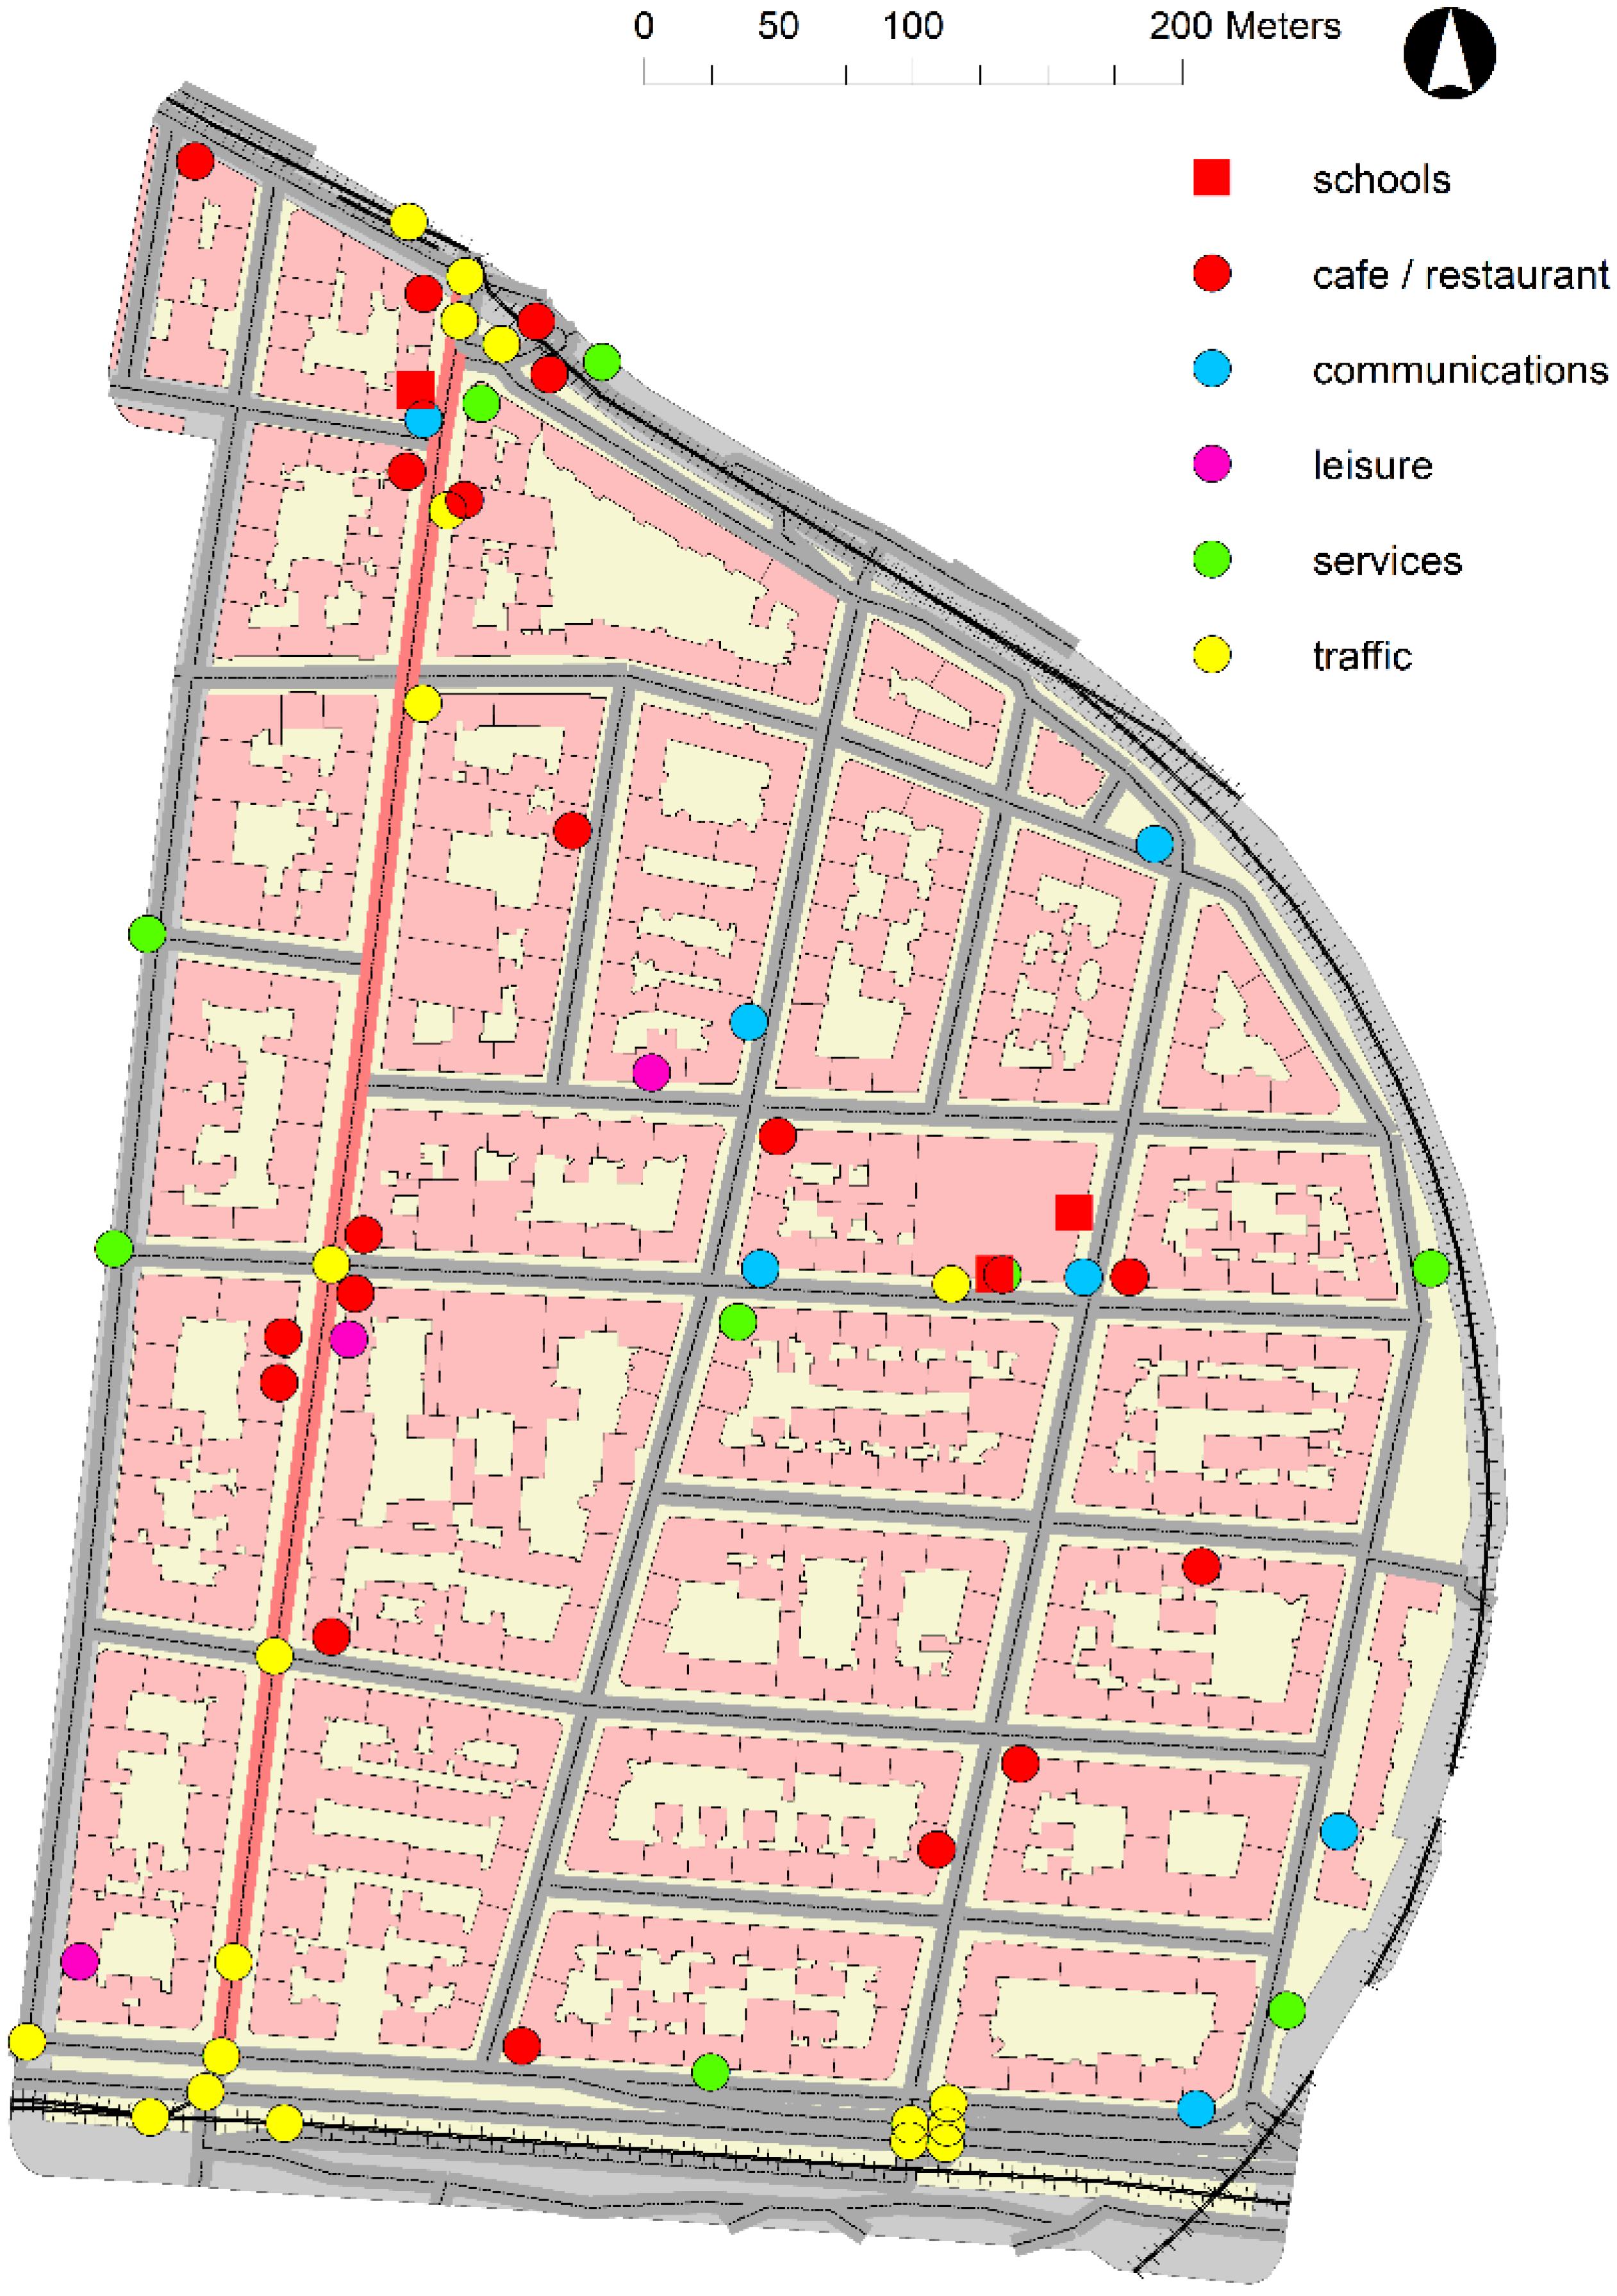
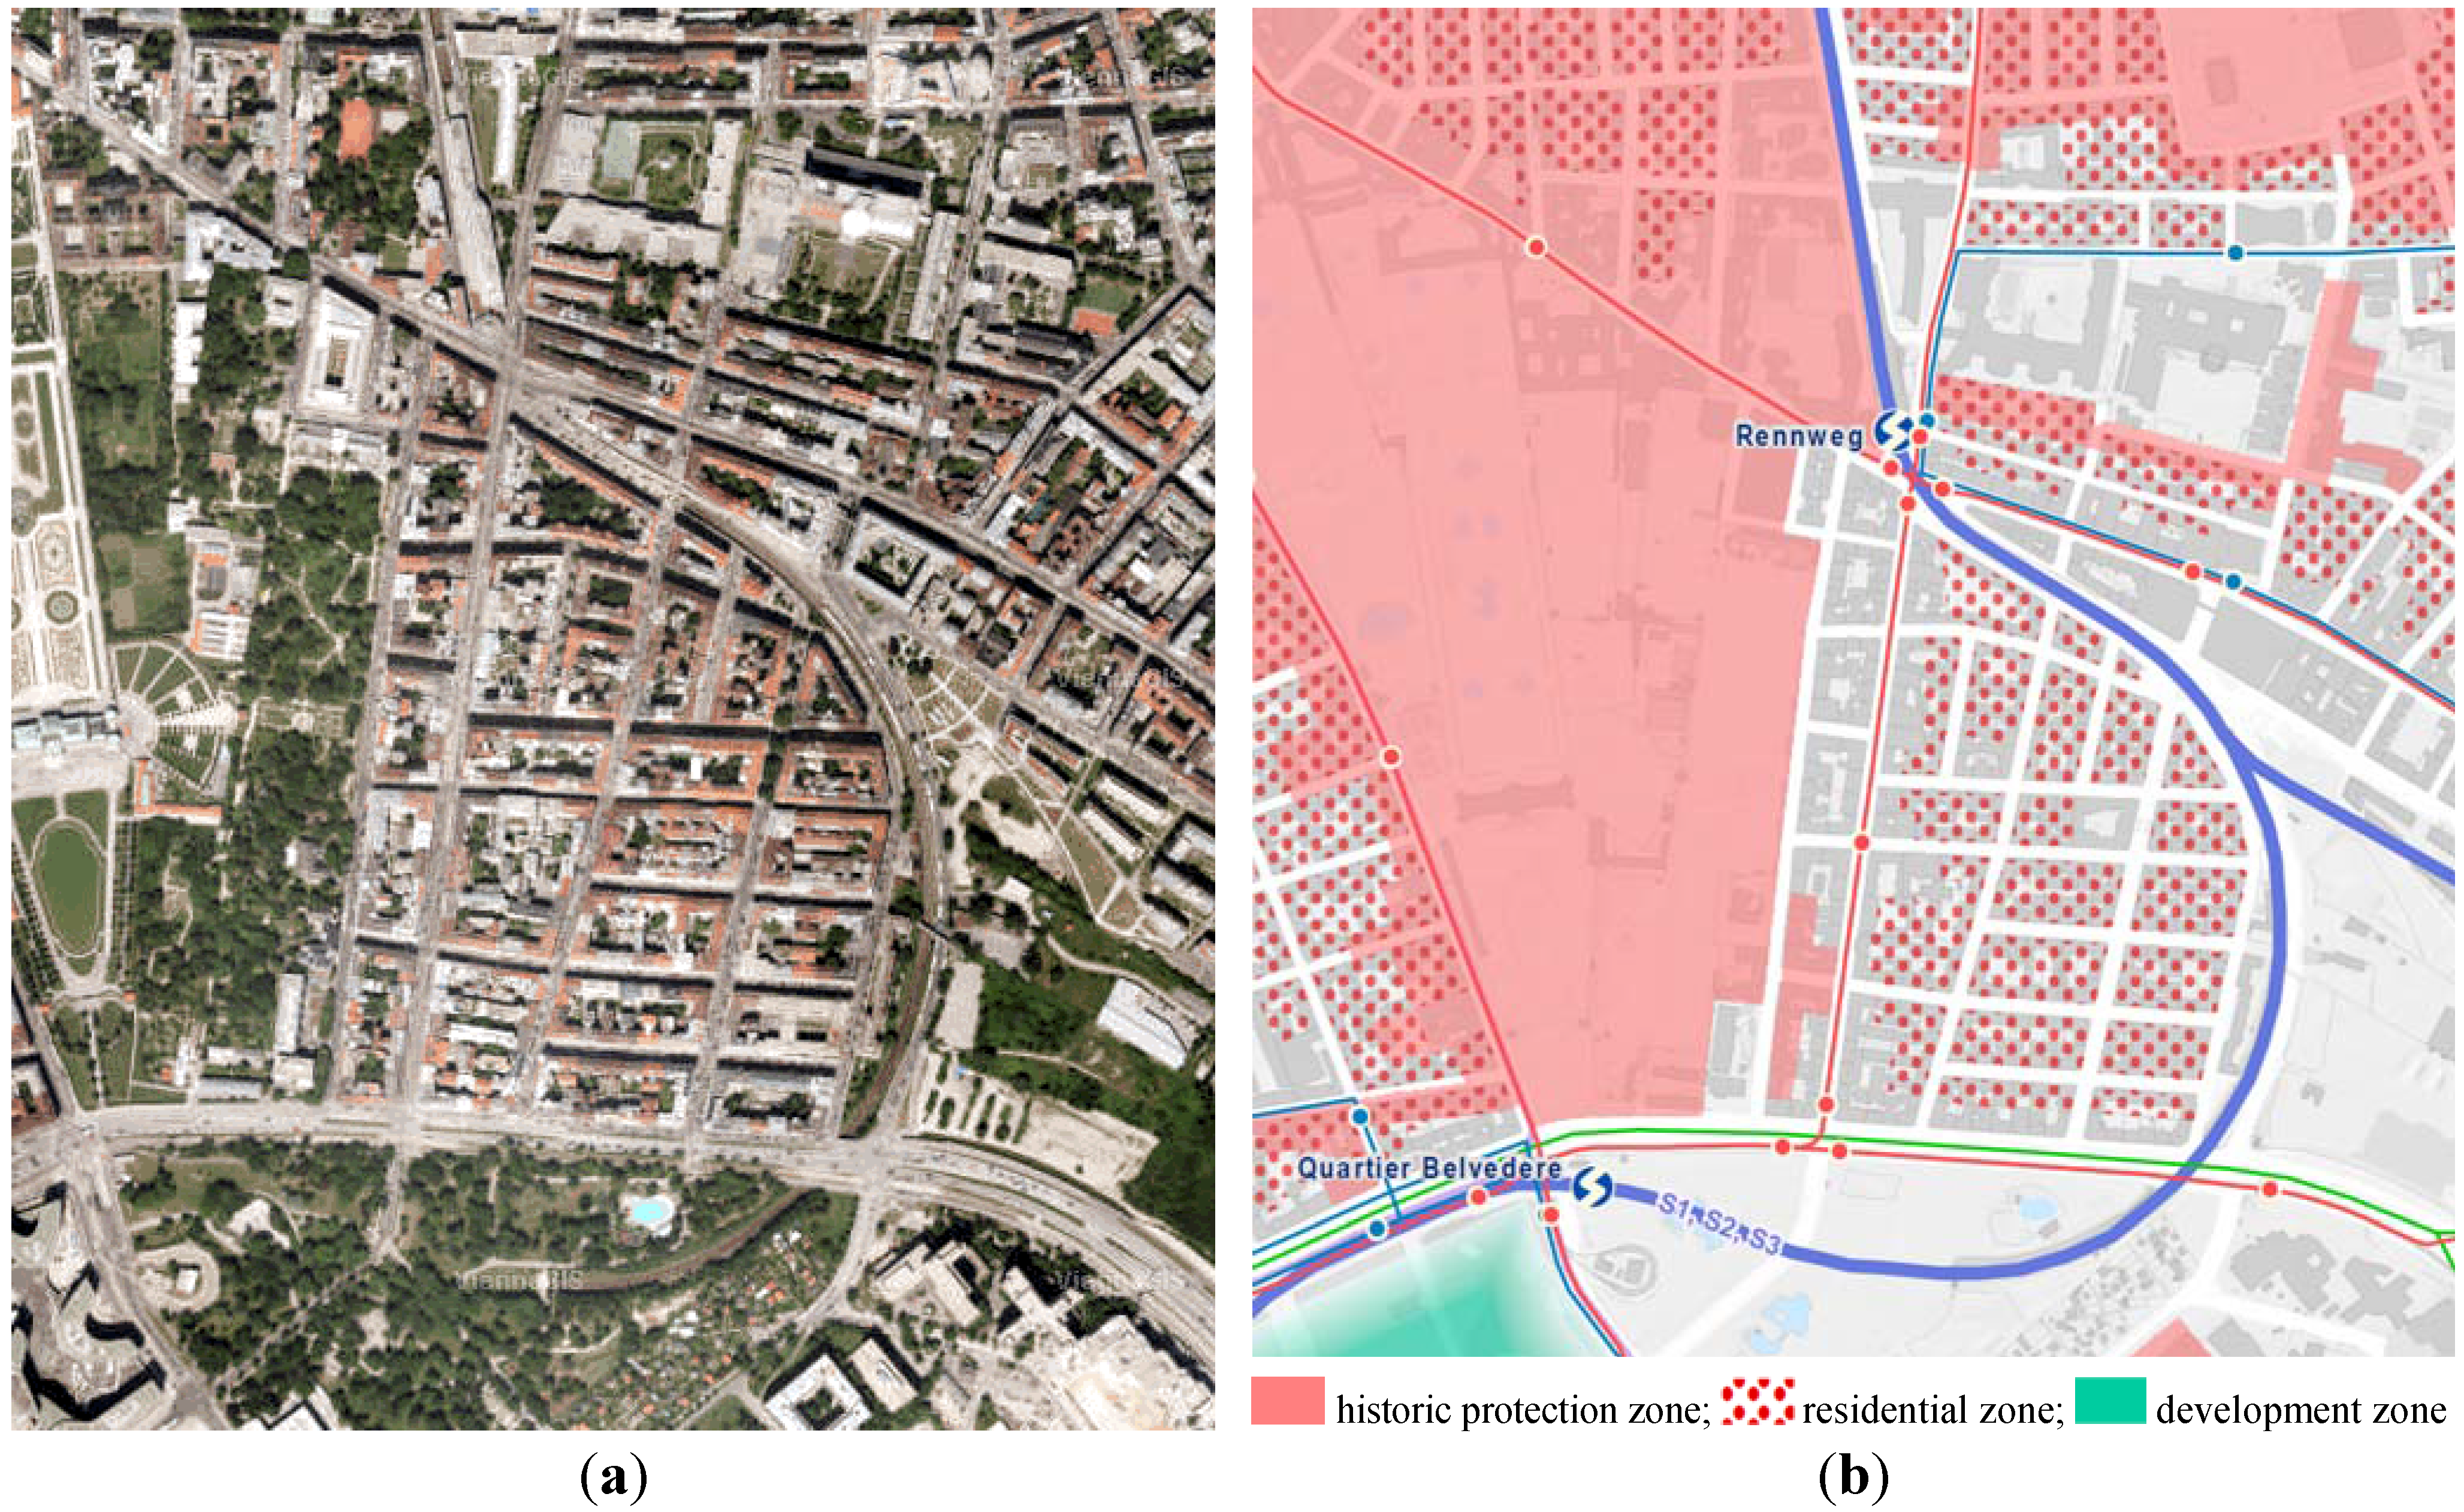
4.2. Case Study Area Fasanviertel: Urban Form and Infrastructure

Vienna’s urban form is characterized and has been structurally shaped by its long-standing historical past. Today’s city centres’ building fabric can be traced back to Roman and Medieval times. During the Founders’ Period, from post-1850 to 1914, industrialization and modernization initiated Vienna’s rapid urban expansion. The population increased from 430,000 in the middle of the 19th century to 1.6 million in 1900, and more than 2.2 million in 1918 [101]. This period, also known as Gründerzeit, shaped the city substantially. A large amount of rental housing for the working and lower middle classes emerged in the outskirts of the city. At the same time public infrastructure, a comprehensive urban transportation system, cultural buildings and schools have been constructed.
Today this areas are “potential urban renewal areas”. Beginning in the 1970s, the necessity of a renewal of the rental housing stock in the densely built up areas of the Founders’ Period became obvious. Urban Renewal offices were installed in the concerned districts to provide information and counselling on the issues of revitalization or renovation of housing and public areas.
The selected Fasanviertel is one of the densely built up areas of the Founders’ Period. A large number of the existing building stock dates from 1870 to 1914. Caused by urban growth, the Fasanviertel is now centrally located and connected to a good public transport system. Table 5 provides some basic area and population statistics for the city of Vienna in comparison with the case study area Fasanviertel while Figure 2 shows the geographical location of the study area.
Table 5. Key area and population statistics for Vienna and the case study area.
AreaPopulation (2014)Area [km²]Population density [people/km² in 2014]
Vienna1,766,746 a4154.257
Fasanviertel10,722 b0.28637,490
a Source: Statistik Austria. Population at the beginning of the year since 1981 per province [102]; b Source: Stadt Wien/MA 23—Wirtschaft, Arbeit und Statistik. Origin of Persons enrolled in Vienna per gender and counting district [103].
Figure 2. Map of Vienna showing the 23 administrative districts (bold lines), the 250 neighbourhood areas (thin lines) and the location of the study area (“Fasanviertel”).
Sustainability 07 08022 g002
Unlike other districts, the Fasanviertel is spatially isolated from its surroundings by environmental barriers. To the south a heavily used main road forms a barrier to the neighbouring park. The bastioned walls of the historically significant baroque Palaces and Gardens of Belvedere—the former summer residence of Prince Eugene (1663–1763)—form the border in the west while the tracks of a light rail system represent barriers and obstacles in the east. Only to the north is a smooth transition to neighbouring residential areas enabled through several passages and continuing streets. Figure 3a,b provide a more detailed view on the selected neighbourhood.
Figure 3. (a) Fasanviertel, Orthophoto [104]; (b) Fasanviertel, Flächenwidmung- und Bebauungsplan [104].
Sustainability 07 08022 g003
The area is most densely built-up, with more than two third small or medium sized multi-story working-class apartment blocks which were built during the Founders’ Period (Gründerzeit) or before. Only the apartment blocks facing the historic Palace Belvedere show a different view, with generously designed residential buildings for the upper-middle class, remnants of the monarchical past. The district has no green spaces or parks, but it is adjacent to two of them, the historic Gardens of Belvedere and the Schweizergarten. Public transport that connects the district with the city centre or with the main train station is very well accessible.
Shopping and retail infrastructure is well distributed, although high-quality suppliers are missing within the district. One main shopping street (Fasangasse) runs through the area vertically, with two main supermarkets, a commercial bank, a public library, some service providers and some variety of small- or medium-sized retail stores. Apart from this main shopping street, only a few shops or services are located there. Since a newly built and modern shopping centre with attractive businesses has recently been opened in immediate proximity to the case study area, this area suffers from movement of branded stores.
A public Kindergarten, one primary and one secondary school are embedded in the densely built up residential area. Leisure infrastructure such as coffee shops and restaurants are hardly available. Nevertheless, a small privately run theatre in the basement of a residential building provides some cultural activity. Overall, the district has a reasonable social and cultural infrastructure but is not one of the very vibrant city districts. Figure 4 shows private and public services and the infrastructure of the case study area.
Figure 4. Case study area Fasanviertel, urban infrastructure [105,106,107].
Sustainability 07 08022 g004
It has, however, become apparent that the district needs some support to initiate a process of revitalization or renovation of housing and public areas. This is why an urban renewal office was installed in 2013. The office has the task of initiating and coordinating activities, supporting involvement in the neighbourhood, inviting residents to participate actively in planning processes, balancing the interests of different stakeholders and organize events and exhibitions.

4.3. Participative Process

We use the participative process for many purposes; one of them is to gather qualitative data on drivers of individual time use. These data serve on the one hand as a test of the assumptions regarding time use, and on the other hand they help to complement the model. In addition, this discussions helps to improve the understanding and possible usability of the model by stakeholders.
In the case study, assessing the local infrastructure and built environment formed the basis for our participative process. In close cooperation with the urban renewal office we compiled a list of stakeholders, coming from different fields and having different demands regarding time-structures. We invited a group of twelve local representatives from administration, education, economy and neighbourhood initiatives to a series of three workshops with different elements, including time-use plans, maps and focus group discussions. The workshops took place in various locations, directly located in the urban district.
The themes of the workshops were outlined along our hypothesis how time-use patterns and urban form are related to each other (Table 2). Urban form concepts—density, mixed land use and sustainable transport—were questioned and analysed in terms of influencing factors regarding individual time use. The selected neighbourhood area Fasanviertel is one of the very densely populated areas in Vienna. It provides several offers of public and private infrastructure for mixed use, and is very well connected by public transport. Assuming that significant features of the three enabling designs concepts of a sustainable urban form are present, we focused on the question how the local infrastructure and built environment is reflected by individual time use preferences or constrains.

4.4. Results

By using qualitative interviews with representatives of important stakeholder groups, first assumptions about time-use patterns and energy use were generated. During workshops, participating experts and stakeholders could gain systematic understanding of the time-policy relevant questions in correlation with energy use.
At the first workshop we presented the project aims and an overview on time-use policies from European cities. The participants worked on drivers which determine their own time use. These drivers were discussed in the group subsequently. This focus group discussion enabled the verification of the stated drivers, as each group participant was challenging or confirming the individual statements of other discussants. The resulting comprehensive shared list of drivers of individual time use (Table 6) is the outcome of the first workshop.
It is worth highlighting that the proposed drivers of time-use activities are, except for personal time, seen in conjunction with either the accessibility or the attractiveness of local urban infrastructure. Beside this, the second important driver which was mentioned frequently was care obligations for children or elderly. In this context the social network plays an essential role, but a social public or health service infrastructure in spatial proximity to one’s home is also seen as a decisive factor.
The second workshop was focused on learning about individual time use and its link to urban infrastructure. The participants created their own time-use data for a working day and a Sunday. This insight into their own time use were a good basis to discuss the possibilities and constraints presented by the actual situation of transport and urban infrastructure in the area.
Table 6. Drivers of individual time use.
Personal TimeCommitted TimeContracted TimeFree TimeTravel Time
Personal Care & SleepHousehold & FoodFamily, Care and SupportEmployment & StudyLeisure & Activities for society, politics, cultureTravel
agenumber of household memberscaringworking hourspersonal valuesavailability of public transport
education and information leveltype of family (single, parents, more generations)age of childrentype of profession (employed, self-employed, …)trends (social media, sports, ...)distance to working place
incomedivision of labourother persons in need of caringprofessional trainingurban facilitiesdistance to educational infrastructure
organisational competencesurban infrastructure: shopspublic services for caringuniversities/schools time-plansrecreational needsdistance to shopping facilities
personal competences/skills and abilitiesurban infrastructure: restaurantsdensity of social network lifestyleseason
personal energy level (balance)urban infrastructure: servicesaccess to information social commitmentnumber of holidays
physical abilitybusiness hoursother obligations (work, dates, …) attractiveness of the local infrastructure
In light of the discussion of urban density, the results of the workshops confirmed the importance of urban infrastructure being easily reachable and nearby. The infrastructure mentioned most was shopping facilities. In Fasanviertel, little shops are closing down and a former shopping street is not attractive enough any longer. Usually this would attract shopping activities farther away by car and more individual transport, but as a shopping mall has recently opened quite nearby that is easily reached by public transport, a negative impact on travel behaviour was possibly avoided. Nevertheless, people feel discomfort and reduced quality of life because the former shopping street has lost its vibrancy.
Infrastructure in terms of facility for children is abundant and easily reachable, as are doctors and other health services. Urban administrative infrastructure was more and more centralized during the last years. However, electronic services have increased during the same time span and the need for travelling for administrative purposes for citizens is diminishing.
What inhabitants are missing in the Fasanviertel are restaurants, cinemas and bars. People tend to travel for entertainment and socializing. As this travelling is scheduled more during night time, this leads to an increase in individual motorised transport. A need for better transport services during night time was stated.
As for the mixed land-use hypothesis, we can state that what is really missing in Fasanviertel is workplaces. The case study presents a very dense central quarter with a very mixed population living there. However, it is mostly a pure residential area and people have to leave the neighbourhood area for employment. This means that many people commute to other parts of Vienna.
Time preferences in the workshop were mostly linked to the family/household situation: when there are more people to be cared for there is less time to diversify one’s leisure time preferences. It came as a surprise that caring for animals, especially dogs, is another factor which influences mode of travelling and choices for leisure time. The good quality of publics transport helps to choose it for daily trips. However, the fact that a person has to care for children, elderly persons or dogs often results in choosing private cars.
Fasanviertel has a lot of green areas in its surroundings, and it is easy to walk and cycle in the quarter and to the parks nearby. These options are widely used for leisure and recreational activities, but could still be enhanced with better accessibility to these green areas via cycling routes and pedestrian bridges.
The aim of the third workshop was to learn about time-use preferences of individuals and households. Discussion was directed to the questions on changes in one’s biography leading to change in time-use pattern and changes in one’s living quarter and its impacts on time use, and ended with the question of time preferences: what would you like to do with more time available?
One result of this workshop was that these questions should not only be asked from the selected representatives but of a wider range of people living in the area. The base of qualitative data, especially on questions of time-use preference, will be enlarged by a series of ongoing interviews. Furthermore, the project was presented in various contexts, which led to a series of qualitative semi-structured interviews on individual time use, time-use preferences and mobility behaviour in relation to the case study area. These interviews are not yet concluded. We expect that together with the results of these workshops they will form a coherent picture of time-use patterns and interlinkages with sustainable urban form. Finally, the collected qualitative information will be implemented in our agent-based simulation model to further explore potentials for lower energy consumption.

5. Participatory Modelling to Link Time Use and Urban Form with Energy Use

In our UTE (Urban Time and Energy: A socio-ecological model for assessing time use and energy metabolism) research project, we will enhance the previously presented research by focusing on energy use. An integrated socio-ecological simulation model is being developed to study the inter-linkages between time-use patterns and energy consumption. This section describes the methodical approach to study potential inter-linkages. The research is still ongoing and final results will be part of following publications.

5.1. Participatory Modelling: Discussing Time Use and Energy Use

In analysing changes in the use of energy in the city, it is important to take into account that these changes are based on human decision-making, occurring at a very local scale on a day-to-day basis. Recent developments in computational science allow for the application of numerical models for the systematic analysis and simulation of human decision-making and its direct and indirect effects. Agent-based modelling can be applied as a means for testing hypotheses about interrelations in complex human-environment systems [108,109,110] in cases where approaches limited to the analysis of social or biophysical parameters alone are insufficient. Moreover, model development provides a transdisciplinary platform for stakeholders and experts to communicate on equal footing throughout the research process. Participation of this kind is described as key to enabling social actors or social systems to learn from, or be stimulated by, a research process (e.g., [111]) and represents a core methodology of sustainability science [112].
We explore the options for a more sustainable urban development which depend on internal choices (of households) as well as on changes in the external framework conditions, such as urban infrastructure or time-policy measures. The “triangle of sustainability” [113] is a concept that helps to visualize the three corners of and the systemic links between the three aspects of sustainability. We model the households according to the three aspects as agents, who use energy (mostly transport and heating energy), have a certain income and a specific time-use pattern according to their family and work situation.
Scientific models mostly reflect theories and concepts developed within single disciplines and usually focus on ecological, social or economic aspects. To analyse socio-ecological systems and impacts of external drivers on these systems, the approaches of various disciplines are needed. Integrating different modelling approaches (agent-based, stock-flow, etc.) makes it possible to integrate social-science based approaches with concepts from the natural sciences [108]. Our model will be able to integrate data derived from participatory and social science methods in a local case study with biophysical data (e.g., built infrastructure, energy supply) and socio-economic factors (e.g., time-use patterns, energy consumption).
The integrated socio-ecological modelling approach can synthesize concepts and insights from social and natural sciences into a coherent picture and thereby help to better understand the interrelations between various drivers behind the trajectories of socio-ecological systems.

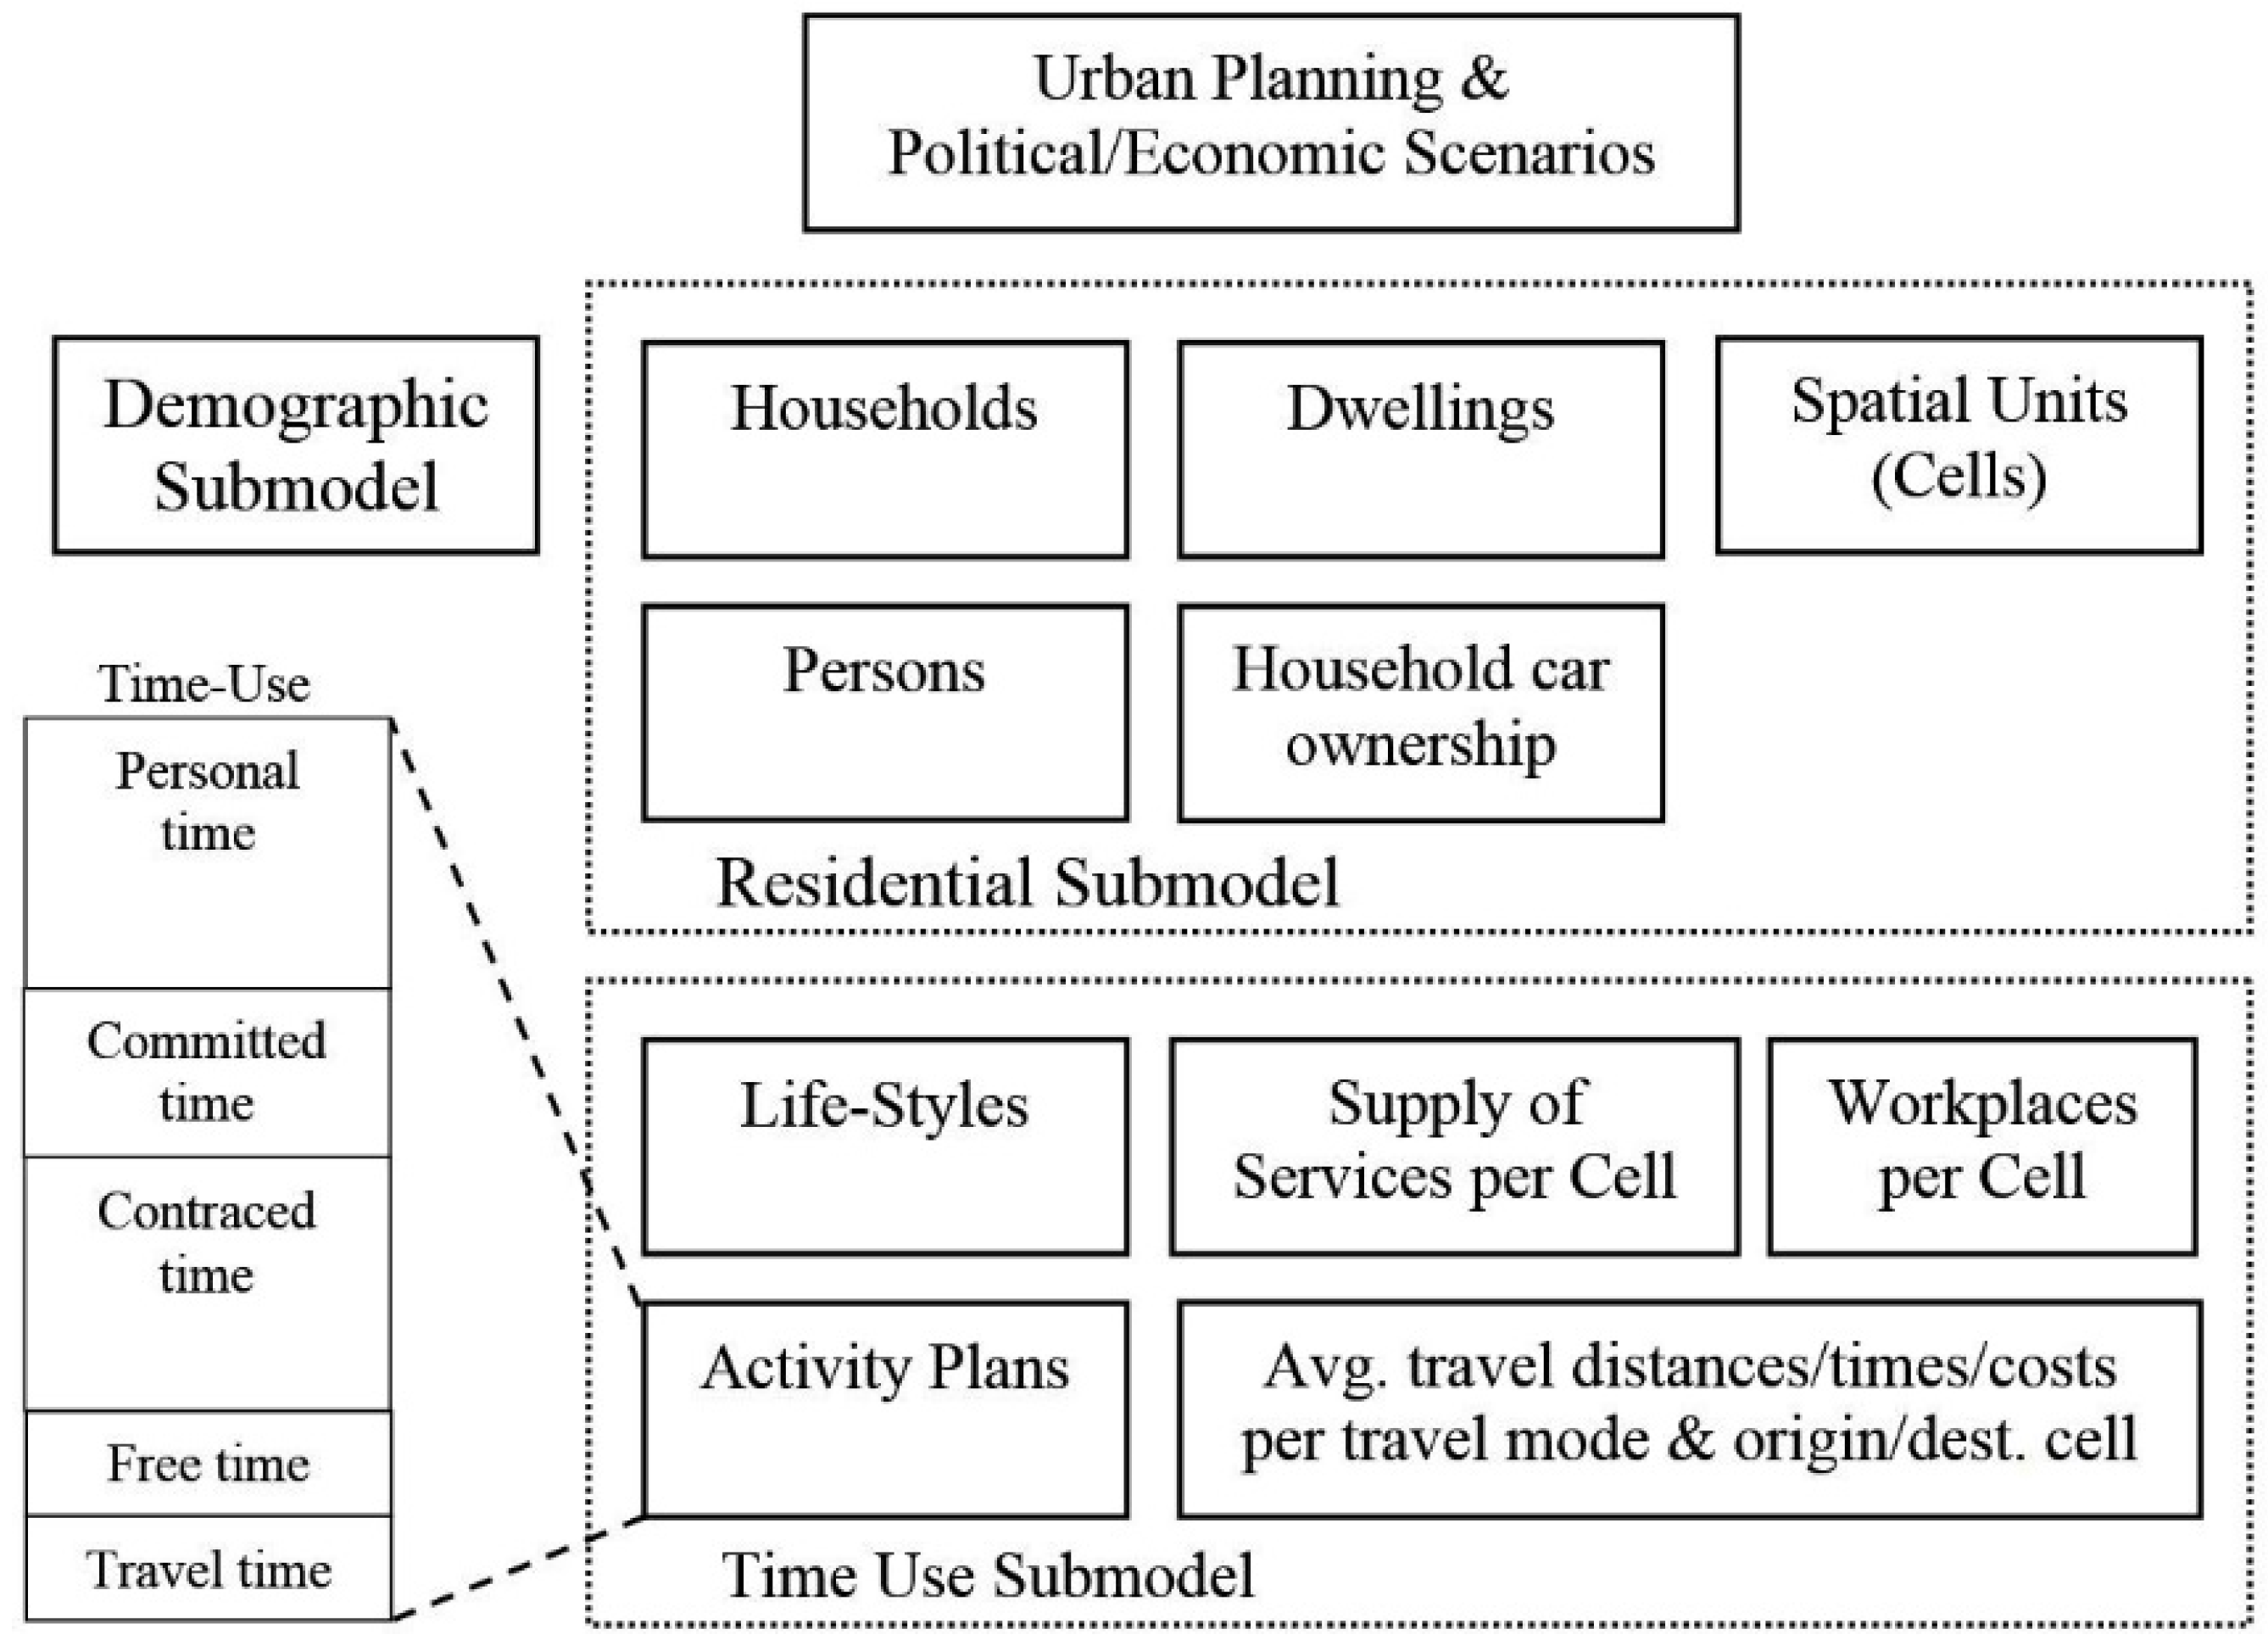
5.2. Agent-Based Model of Urban Time and Energy Use

Agent-based microsimulation models have been applied in the past mainly to simulate transportation networks, since they allow for a comprehensive, logically consistent and theoretically sound implementation of two-way interactions between land use/urban form (land development, building supply, location choices, etc.) and transportation (mode choice, travel demand, public transport accessibility, etc.) [114]. More recently, there have been efforts to extend such models into the area of urban energy modelling (UEM) [115].
The model described here builds upon a residential location decision model developed for the city of Vienna for the FP 7 project SUME (Sustainable Urban Metabolism in European cities, http://www.sume.at/) that includes land development scenarios and a demographic sub model [116]. Figure 5 shows an overview of the components of this model, which focuses on households and their residential location decisions in relation to their economic and demographic situation [117]. Based on assumptions according to their internal structure (see demographic sub model, family members, age, income) and external urban planning decisions changing infrastructure access in different areas in Vienna, households need or want to move to another place of residence (residential sub model).
Figure 5. UTE model components.
Sustainability 07 08022 g005
Scenarios of urban planning will be incorporated into the model by defining areas of urban development where transport facilities, housing or commercial buildings might be built or improved, thus providing changed transport speeds, number of dwellings, number of workplaces or direct energy requirements for heating.
A lifestyle/activity-planning module and a transport simulation complete the model to include all components identified by Miller [118] as critical for a land use and transport interaction (LUTI) model. The model will be parameterized to represent the city of Vienna to be able to apply time- and energy-use scenarios based on empirical data.
In order to incorporate household decision-making on time use (time-use sub-model) and the corresponding interactions within households, the households and their members need to be represented as active agents within the model, thus endorsing an agent-based modelling approach.
A spatially explicit distribution of households in Vienna according to their socio-economic situation forms the base data for the UTE model. Assumptions about time-use requirements of households derived from literature and to a large part from the participative modelling process as well as time-affecting services in urban areas are introduced to complement the model information.
By means of an agent-based land-use and transport simulation, it is possible to simulate the effects of a number of changes in time-use structures of private households as well as on their residential and mobility behaviour. Table 2 shows a list of possible features to draw indicators from for scenario-building, like different urban densities and resulting travel distances and times, or different building ages and renovation status resulting in diverse heating energy requirements, or different green and open space structures influencing time use for outdoor activities by the city’s inhabitants.
Consequently, the model output can be used as a base for the estimation of household heating and transportation energy use, which can be assessed through household consumption and economy-wide input/output statistics [99,119]. The interlinkages between time use and energy use will be modelled for different household types (distinguished by socio-demographic and economic status) according to the actual data of the urban model area.

5.3. Implementation in Different Types of Urban Areas

This model concept will be adapted to different types of urban areas, such as urban renewal area, new urban residential area and urban development area (see Table 7).
Table 7. Description of the typical characteristics of the three urban areas for the model.
IndicatorUrban renewal areasLarge scale residential areasUrban development areas
UrbanDevelopment structuredensely built-up area, traditional block perimeter development with narrow courtyards five to seven-storey buildings, ribbon or block perimeter developmentmoderate building density, mixed structural types
Age of the buildingsup to 50% built before 1918 (promoterism), numerous buildings from the inter- or post-war periodup to 60% built after 1965future planning
Locationinner city, centrally located, directly adjacent or close to the historic centreperiphery, suburban locationsuburb
Land use typessmall scale residential and commercial useuniformly residential arearesidential buildings, offices, commercial and educational institutions
Transport and mobility infrastructure good public transport accessibility, restricted accessibility for private vehicles (narrow traffic lanes, restricted parking areas, congestions)restricted access to public transport (limited number, intervals and directions), good accessibility for private vehicleshigh-level public transport system, good accessibility for private vehicles but with restricted areas (pedestrian zones)
Social infrastructure and serviceswell-established infrastructure, short distances (walking distance)limited social infrastructure and services (choice, long distances)good infrastructure for everyday necessities (shops, restaurants, libraries...), moderate offer of educational and public institutions
Green and open space structurebarely parks and open spacesparks or wide-open green spaces and wilderness areas in the immediate surroundingsparks or wide-open green spaces and wilderness areas in the immediate surroundings
The study brings together insights from a range of diverse subjects, combining them to develop an interdisciplinary approach to analysing links between time, space and energy use such as:
-
Local times and infrastructure (opening hours of municipal offices, public/private services and shops, hours of school and childcare facilities, etc.)
-
Urban planning and development, urban renewal (urban density, mixed land use, sustainable transport)
-
Transport and mobility (working hours, time schedules of public transportation, etc.)
-
Buildings (energy services, household preferences)
It is in the interplay of these areas that the study will investigate to what extent time-policy measures can result in added energy efficiency and altered energy consumption.
After implementing the model and using the model results, future scenarios and policy measures developed in our case study, we will design a transfer process enabling us to learn more about the model. This will primarily enhance cooperation with stakeholders and people interested in applying the model.

6. Discussion

Linking time use data with energy data and urban planning is a demanding but promising way to integrate social dimensions into the discussion on sustainable cities. The methodological challenges are based in the availability and missing connectivity of data. We owe to the good ideas of our colleagues [34,77,99] and draw from our modelling and participatory research experience [117,120,121,122,123] as well as experience in urban planning [46,47].
One of the major challenges in understanding and modelling changes in time-use patterns—i.e., bringing together time-use data with time-preference data—is the lack of studies and data on time preferences that might partly be owed to the well-known difficulties of empirically capturing preferences in general (e.g., stated vs. revealed preferences, influence of economic considerations on formation of preferences). However, there are various efforts in progress to shed light on this issue. Amongst other initiatives, we are currently conducting a series of qualitative interviews supported by the survey of relevant spatial structures and information on time use to further our understanding in that respect.
Urbanization is expected to continue at a high level with cities facing various challenges and megatrends. The case study helps to understand drivers of time-use patterns and analyse their connection to urban form as well as urban planning. The initial results show that urban infrastructure and services are crucial in terms of the way people spend their time. Urban planning measures designed in accordance with this knowledge can help to find pathways towards a city with a high quality of life and a sustainable way of using energy.
Designs for urban infrastructure which allow an urban life with lower carbon emissions are of great interest to urban planners and administration. They are involved in the knowledge production of this research as a local advisory board. We will develop scenarios for the future development of Vienna jointly. Time-use policies can be designed as a result of back-casting exercises with these experts. The city of the future with decentralized, well-mixed areas with little need for long commuting, because workplaces, educational institutions, living space and recreational space and facilities are close, can allow for a higher quality of life while at the same time countering the ever-greater acceleration of our lives, which lead to higher energy demands.

7. Conclusions

The principal outcome of the project is a model-based integrated understanding of the interrelation between time use and energy use in a city. Time-space-energy scenarios can highlight the potential of changes in time-use structures in terms of energy-use reduction. The project’s potential for impact is the development of a decision support tool which can be used by stakeholders in communal administration, urban development and planning bodies in politics and civil society. The realization of a politically useable model that can trigger and guide time-policy measures of the city’s administration and planning processes, which integrate time-policy, participatory processes and energy saving, is envisaged as a final result of this project.

Acknowledgments

This research has been supported by the Austrian Science Fund (FWF): TRP214-G17.

Author Contributions

The authors contributed equally to this work, bringing in their different expertise i.e., urban planning from Haselsteiner, modelling from Remesch, socio-ecological energy studies from Gaube, sustainable consumption and time-use studies from Smetschka, and socio-ecological time-use research from all of us.

Conflicts of Interest

The authors declare no conflict of interest.

References

  1. Bonfiglioli, S. Zeitleitplan für die Stadt Bozen; ECG European Consulting Group: Bozen, Italy, 2005. [Google Scholar]
  2. Bonfiglioli, S.; Mareggi, M.; Zedda, R.; Stadt, B. Mobilitätspakt und Zeitleitplan. Eine europäische Perspektive; Nationale Institut für Urbanistik—Südtirol INU: Rom, Germany, 2000. [Google Scholar]
  3. Stadtgemeinde Bozen. Alles eine Frage der Zeit! Die Zeitpolitik der Stadt Bozen; Stadtgemeinde Bozen: Bozen, Italy, 2006. [Google Scholar]
  4. Mairhuber, I. “Tempi della Citta”: von Italien lernen; FORBA Schriftenreihe; FORBA Forschungs- und Beratungsstelle Arbeitswelt: Wien, Austria, 2001. [Google Scholar]
  5. Henckel, D.; Eberling, M. Zeitpolitik als Kommunales Handlungsfeld. Analyse der Zeitgestaltungsprojekte des EXPO-Nordverbunds Bremen-Hamburg-Hannover; Deutsches Institut für Urbanistik: Berlin, Germany, 2000. [Google Scholar]
  6. Deutsche Gesellschaft für Zeitpolitik=(Hrsg.). Zeit für Zeitpolitik; Atlantik: Bremen, 2003. [Google Scholar]
  7. Eberling, M.; Henckel, D. Alles zu jeder Zeit?: Städte auf dem Weg zur kontinuierlichen Aktivität; Deutsches Institut für Urbanistik: Berlin, Germany, 2002; Volume Difu-Beiträge zur Stadtforschung. [Google Scholar]
  8. Boulin, J.-Y.; Mückenberger, U. Zeiten in der Stadt und Lebensqualität; Europäische Stiftung zur Verbesserung der Lebens- und Arbeitsbedingungen: Dublin, Ireland, 2000. [Google Scholar]
  9. Läpple, D.; Stohr, H. Arbeits- und Lebenswelten im Umbruch-Herausforderungen für die Entwicklung sozialer Infrastrukturen in Stadtquartier. In Zeiten und Räume der Stadt; Mückenberger, U., Läpple, D., Olssenbrügge, J., Eds.; Budrich: Opladen, Germany, 2010; pp. 27–44. [Google Scholar]
  10. Mairhuber, I.; Atzmüller, R. Machbarkeitsstudie: Möglichkeiten und Perspektiven kommunaler Zeitpolitik und Projektideen für Wien. Available online: http://www.forba.at/de/forschung/view/index.html?id=109 (accessed on 15 June 2015).
  11. Carlstein, T. Time Resources, Society and Ecology: On the Capacity for Human Interaction in Space and Time; Edward Arnold: London, UK, 1981. [Google Scholar]
  12. Fischer-Kowalski, M.; Schaffartzik, A. Arbeit, gesellschaftlicher Stoffwechsel und nachhaltige Entwicklung. In Verwerfungen moderner Arbeit. Zum Formwandel des Produktiven; Füllsack, M., Ed.; Transcript Verlag: Bielefeld, Germany, 2008; pp. 65–82. [Google Scholar]
  13. Boulin, J.Y.; Mückenberger, U. Times in the City and Quality of Life; European Foundation for the Improvement of Living and Working Conditions: Dublin, Ireland, 2005. [Google Scholar]
  14. Moe, K. S. Fertility, Time Use, and Economic Development. Rev. Econ. Dyn. 1998, 1, 699–718. [Google Scholar] [CrossRef]
  15. Garhammer, M. Arbeitszeit und Zeitwohlstand im internationalen Vergleich. WSI-Mitteilungen 2001, 54, 231–241. [Google Scholar]
  16. Garhammer, M. Arbeitszeit, Zeitnutzung von Familien und Zeitpolitiken in Europa; Technische Hochschule Nürnberg Georg Simon Ohm: Nürnberg, Germany, 2008. [Google Scholar]
  17. Mischau, A.; Oechsle, M. Arbeitszeit-Familienzeit-Lebenszeit: Verlieren wir an Balance? Vs Verlag: Wiesbaden, Germany, 2005. [Google Scholar]
  18. Schaffer, A. Women’s and Men’s Contributions to Satisfying Consumers’ Needs: A Combined Time Use and Input-Output Analysis. Econ. Syst. Res. 2007, 19, 23–36. [Google Scholar] [CrossRef]
  19. Rinderspacher, J. Zeitwohlstand. Ein Konzept für einen anderen Wohlstand der Nation; Edition Sigma: Berlin, Germany, 2002. [Google Scholar]
  20. Heitkötter, M. Aktuelle Ansätze lokaler Zeitpolitik. Zeitpolitisches Mag. 2007, 5, 1–3. [Google Scholar]
  21. Kränzl Nagel, R.; Beham, M. Zeitnot oder Zeitwohlstand in Österreichs Familien? Einfluss familialer Faktoren auf den Schulerfolg von Kindern; European Centre for Social Welfare Policy and Research: Wien, Austria, 2007; pp. 1–9. [Google Scholar]
  22. Schor, J.B. Plenitude: The New Economics of True Wealth; Penguin Press: New York, NY, USA, 2010. [Google Scholar]
  23. Sanne, C. Willing consumers- or locked-in? Policies for a sustainable consumption. Ecol. Econ. 2002, 42, 273–287. [Google Scholar] [CrossRef]
  24. Kasser, T.; Sheldon, K. M. Time Affluence as a Path toward Personal Happiness and Ethical Business Practice: Empirical Evidence from Four Studies. J. Bus. Ethics 2010, 84, 243–255. [Google Scholar] [CrossRef]
  25. De Graaf, J. Take Back Your Time. Fighting Overwork and Time Poverty in America; Berret- Koehler: San Francisco, CA, USA, 2003. [Google Scholar]
  26. Eurofound. How Are You? Quality of Life in Europe; Eurofound: Dublin, Ireland, 2010. [Google Scholar]
  27. Boulin, J.Y. As Time Goes by. A Critical Evaluation of the Foundation’s Work on Time; Office for Official Publications of the European Communities: Luxembourg, 2003. [Google Scholar]
  28. Minx, J.; Baiocchi, G. Time Use and Sustainability: An Input-Output Approach in Mixed Units. In Handbook on Input-Output Economics in Industrial Ecology; Suh, S., Ed.; Springer: Berlin, Germany; New York, NY, USA, 2010; pp. 819–846. [Google Scholar]
  29. Stahmer, C.; Ewerhart, G.; Herrchen, I. Monetäre, Physische und Zeit-Input-Output-Tabellen. Endbericht für Eurostat; Eurostat: Luxemburg, 2003. [Google Scholar]
  30. Schaffer, A. Sozioökonomische Input-Output-Tabellen für Deutschland in zeitlicher, monetärer und räumlicher Dimension. Jahrb. Für Reg. 2006, 27, 1–22. [Google Scholar] [CrossRef]
  31. Chiou, Y.S. A Time Use Survey Derived Integrative Human-Physical Household System Energy Performance Model. In Proceedings of the Passive and Low Energy Architecture Conference (PLEA 2009), Quebec City, QC, Canada, 22–24 June 2009; pp. 51–57.
  32. Vinz, D. Zeiten der Nachhaltigkeit: Perspektiven für Eine ökologische und Geschlechtergerechte Zeitpolitik; Westfälisches Dampfboot: Münster, Germany, 2005. [Google Scholar]
  33. Jalas, M. A time use perspective on the materials intensity of consumption. Ecol. Econ. 2002, 41, 109–123. [Google Scholar] [CrossRef]
  34. Jalas, M. Busy, Wise and Idle Time: A Study of the Temporalities of Consumption in the Environmental Debate: School of Economics, Diss.–Helsinki, 2006; Acta Universitatis Oeconomicae HelsingiensisA; Helsinki School of Economics: Helsinki, Finland, 2006; Volume 275. [Google Scholar]
  35. Hayden, A.; Shandra, J.M. Hours of work and the ecological footprint of nations: An exploratory analysis. Local Environ. Int. J. Justice Sustain. 2009, 14, 575–600. [Google Scholar] [CrossRef]
  36. Hägerstrand, T. What about People in Regional Science? Pap. Reg. Sci. Assoc. 1970, 24, 7–21. [Google Scholar] [CrossRef]
  37. Carlstein, T. Planung und Gesellschaft: Ein “Echtzeit”-System im Raum (Zeitgeographische Aspekte der Raumplanung). Geogr. Helvetica 1986, 41, 117–125. [Google Scholar] [CrossRef]
  38. Ellegård, K. A time-geographical approach to the study of everyday life of individuals–a challenge of complexity. GeoJournal 1999, 48, 167–175. [Google Scholar] [CrossRef]
  39. Hanson, S.; Hanson, P. Chapter 10: The Geography of Everyday Life. In Advances in Psychology; Gärling, T., Golledge, R.G., Eds.; Behavior and Environment Psychological and Geographical Approaches; Elsevier/North-Holland: Amsterdam, The Netherlands, 1993; Volume 96, pp. 249–269. [Google Scholar]
  40. Huisman, O.; Forer, P. The complexities of everyday life: Balancing practical and realistic approaches to modeling probable presence in space-time. In Proceedings of the 17th Annual Colloquium of the Spatial Information Research Centre, Dunedin, New Zealand, 24–25 November 2005; pp. 155–167.
  41. Burns, L.D. Transportation, Temporal, nd Spatial Components of Accessibility; Lexington Books: Lexington, MA, USA, 1979. [Google Scholar]
  42. Ettema, D.; Ettema, D.F.; Timmermans, H.J.P. Activity-Based Approaches to Travel Analysis; Emerald Group Publishing Limited: Bingley, UK, 1997. [Google Scholar]
  43. Wu, Y.; Miller, H.J. Computational Tools for Measuring Space-Time Accessibility within Transportation Networks with Dynamic Flow. J. Transp. Stat. 2001, 4, 1–14. [Google Scholar]
  44. Kwan, M.-P. GIS Methods in Time-Geographic Research: Geocomputation and Geovisualization of Human Activity Patterns. Geogr. Ann. 2004, 4, 267–280. [Google Scholar] [CrossRef]
  45. Miller, H. J. What about People in Geographic Information Science? Comput. Environ. Urban Syst. 2003, 27, 447–453. [Google Scholar] [CrossRef]
  46. Haselsteiner, E.; Gaube, V.; Remesch, A.; Smetschka, B.; Fischer-Kowalski, M. Urban Time and Energy (UTE). Time-space-energy Scenarios in Urban Areas. In Proceedings of the REAL CORP 2012 Re-Mixing the City, Schwechat, Austria, 14–16 May 2012; pp. 1031–1039.
  47. Rau, H.; Haselsteiner, E.; Remesch, A.; Smetschka, B.; Gaube, V. Making space for time: Comparing urban form and time use in Vienna and Dublin. Env. Plan B 2015. submitted for publication. [Google Scholar]
  48. Henckel, D.; Herkommer, B. Spaces of Variable Speed: The temporal topography of cities as an indicator for competitiveness and quality of life. In The World of Global City-Regions: An Asia-Europe Comparison; Fudan University Press: Shanghai, China, 2009. [Google Scholar]
  49. Levine, R.V. A Geography of Time: The Temporal Misadventures of a Social Psychologist, or How Every Culture Keeps Time Just a Little Bit Differently; Basic Books: New York, NY, USA, 1998. [Google Scholar]
  50. Futcher, J.A.; Mills, G. The role of urban form as an energy management parameter. Energy Policy 2013, 53, 218–228. [Google Scholar] [CrossRef]
  51. Kenworthy, J.R.; Laube, F.B.; Newman, P. An International Sourcebook of Automobile Dependence in Cities, 1960–1990; University Press of Colorado: Boulder, CO, USA, 1999. [Google Scholar]
  52. Newman, P. Transport and Energy. Transp. Eng. Plan. 2009, II, 47–86. [Google Scholar]
  53. Schafer, A.; Victor, D.G. The future mobility of the world population. Transp. Res. Part Policy Pract. 2000, 34, 171–205. [Google Scholar] [CrossRef]
  54. Lehmann, S. The Principles of Green Urbanism: Transforming the City for Sustainability; Earthscan: London, UK; Washington, DC, USA, 2010. [Google Scholar]
  55. Næss, P.; Næss, T.; Strand, A. Oslo’s Farewell to Urban Sprawl. Eur. Plan. Stud. 2011, 19, 113–139. [Google Scholar] [CrossRef]
  56. Agency, E.E.; Centre, E.C.J.R. Urban Sprawl in Europe: The Ignored Challenge; European Environment Agency: Copenhagen, Denmark, 2006. [Google Scholar]
  57. Kasanko, M.; Barredo, J. I.; Lavalle, C.; McCormick, N.; Demicheli, L.; Sagris, V.; Brezger, A. Are European cities becoming dispersed?: A comparative analysis of 15 European urban areas. Landsc. Urban Plan. 2006, 77, 111–130. [Google Scholar] [CrossRef]
  58. Weber, G. Raumplanung-eine Schlüsselkompetenz im Klimaschutz. Raumplanung und Klimawandel. Österreichisch-Deutsche Kooperation der Akademie für Raumforschung und Landesplanung (ARL) mit dem Institut für Raumplanung und Ländliche Neuordnung an der Universität für Bodenkultur (IRUB), Wien; IRUB: Wien, Austria, 2008. [Google Scholar]
  59. Knoflacher, H. Grundlagen der Verkehrs- und Siedlungsplanung: Verkehrsplanung; Böhlau Verlag: Wien, Austria, 2007. [Google Scholar]
  60. Burton, E. Measuring urban compactness in UK towns and cities. Environ. Plan. B 2002, 29, 219–250. [Google Scholar] [CrossRef]
  61. Burton, E.; Jenks, M.; Williams, K. The Compact City: A Sustainable Urban Form? Routledge: London, UK, 2003. [Google Scholar]
  62. Churchman, A. Disentangling the concept of density. J. Plan. Lit. 1999, 13, 389–411. [Google Scholar] [CrossRef]
  63. Jabareen, Y.R. Sustainable Urban Forms Their Typologies, Models, and Concepts. J. Plan. Educ. Res. 2006, 26, 38–52. [Google Scholar] [CrossRef]
  64. Alberti, M. Urban Patterns and Environmental Performance: What Do We Know? J. Plan. Educ. Res. 1999, 19, 151–163. [Google Scholar] [CrossRef]
  65. Banister, D.; Hickman, R. How to design a more sustainable and fairer built environment: Transport and communications. IEE Proc. Intell. Transp. Syst. 2006, 153, 276–291. [Google Scholar] [CrossRef]
  66. Owens, S.E. Energy, Planning and Urban Form; Pion: London, UK, 1986. [Google Scholar]
  67. Schwarz, N. Urban form revisited—Selecting indicators for characterising European cities. Landsc. Urban Plan. 2010, 96, 29–47. [Google Scholar] [CrossRef]
  68. International Organization for Standardization (ISO). ISO 37120:2014 Sustainable Development of Communities—Indicators for City Services and Quality of Life; ISO: Geneva, Switzerland, 2014. [Google Scholar]
  69. Haberl, H. The Energetic Metabolism of Societies, Part I: Accounting Concepts. J. Ind. Ecol. 2001, 5, 11–33. [Google Scholar] [CrossRef]
  70. Haberl, H. Societal Energy Metabolism and Sustainable Development. In Proceedings of the Advances in Energy Studies, Exploring Supplies, Constraints, and Strategies, 2nd International Workshop in Porto Venere, Porto Venere, Italy, 23–27 May 2000; Ulgiati, S., Brown, M.T., Giampietro, M., Herendeen, R.A., Mayumi, K., Eds.; Servici Grafici Editoriali: Padova, Italy, 2001; pp. 199–209. [Google Scholar]
  71. Lovins, A.B. Energy Strategy: The Road not Taken? Foreign Affairs: New York, NY, USA, 1976; pp. 65–96. [Google Scholar]
  72. Jochem, E.; Adegbulugbe, A.; Aebischer, B.; Bhattacharjee, S.; Gritsevich, I.; Jannuzzi, G.; Jaszay, T.; Baran Saha, B.; Worrell, E.; Fengqi, Z.; et al. Energy end-use efficiency. In UNDP World Energy Assessment; UNDP: New York, NY, USA, 2000. [Google Scholar]
  73. Vringer, K.; Blok, K. The direct and indirect energy requirements of households in the Netherlands. Energy Policy 1995, 23, 893–910. [Google Scholar] [CrossRef]
  74. Pachauri, S.; Spreng, D. Direct and indirect energy requirements of households in India. Energy Policy 2002, 30, 511–523. [Google Scholar] [CrossRef]
  75. Cohen, C.; Lenzen, M.; Schaeffer, R. Energy requirements of households in Brazil. Energy Policy 2005, 33, 555–562. [Google Scholar] [CrossRef]
  76. Wier, M.; Lenzen, M.; Munksgaard, J.; Smed, S. Effects of Household Consumption Patterns on CO2 Requirements. Econ. Syst. Res. 2001, 13, 259–274. [Google Scholar] [CrossRef]
  77. Lenzen, M.; Wier, M.; Cohen, C.; Hayami, H.; Pachauri, S.; Schaeffer, R. A comparative multivariate analysis of household energy requirements in Australia, Brazil, Denmark, India and Japan. Energy 2006, 31, 181–207. [Google Scholar] [CrossRef]
  78. Dey, C.; Berger, C.; Foran, B.; Foran, M.; Joske, R.; Lenzen, M.; Wood, R. An Australian environmental atlas: Household environmental pressure from consumption. In Water, Wind, Art and Debate: How Environmental Concerns Impact on Disciplinary Research; Birch, G., Ed.; Sydney University Press: Sydney, Australia, 2007; pp. 280–315. [Google Scholar]
  79. Weber, C. L.; Matthews, H. S. Quantifying the global and distributional aspects of American household carbon footprint. Ecol. Econ. 2008, 66, 379–391. [Google Scholar] [CrossRef]
  80. Lenzen, M.; Dey, C.; Foran, B. Energy requirements of Sydney households. Ecol. Econ. 2004, 49, 375–399. [Google Scholar] [CrossRef]
  81. Kletzan, D.; Koppl, A.; Kratena, K.; Schleicher, S.; Wuger, M. Towards sustainable consumption: Economic modelling of mobility and heating for Austria. Ecol. Econ. 2006, 57, 608–626. [Google Scholar] [CrossRef]
  82. Duchin, F. Sustainable consumption of food: a framework for analyzing scenarios about changes in diets. J. Ind. Ecol. 2005, 9, 99–114. [Google Scholar] [CrossRef]
  83. Hertwich, E.G. Consumption and the Rebound Effect: An Industrial Ecology Perspective. J. Ind. Ecol. 2005, 9, 85–98. [Google Scholar] [CrossRef]
  84. Jackson, T. Live Better by Consuming Less? Is There a “Double Dividend” in Sustainable Consumption? J. Ind. Ecol. 2005, 9, 19–36. [Google Scholar] [CrossRef]
  85. Bruckner, M. Die Rolle von Arbeitszeit und Einkommen bei Rebound-Effekten in Dematerialisierungs- und Dekarbonisierungsstrategien. Eine Literaturstudie; Social Ecology Working Paper; Institute of Social Ecology: Wien, Austria, 2008. [Google Scholar]
  86. Binswanger, M. Time-saving innovations and their impact on energy use: Some lessons from a household-production-function approach. Int. J. Energy Technol. Policy 2004, 2, 209–218. [Google Scholar] [CrossRef]
  87. Sorrell, S.; Dimitropoulos, J. The rebound effect: Microeconomic definitions, limitations and extensions. Ecol. Econ. 2008, 65, 636–649. [Google Scholar] [CrossRef]
  88. Räty, R.; Carlsson-Kanyama, A. Energy consumption by gender in some European countries. Energy Policy 2010, 38, 646–649. [Google Scholar] [CrossRef]
  89. Carlsson-Kanyama, A.; Linden, A.-L. Energy efficiency in residencies. Challenges for women and men in the North. Energy Policy 2007, 35, 2163–2172. [Google Scholar] [CrossRef]
  90. Linden, A.-L.; Carlsson-Kanyama, A.; Eriksson, B. Efficient and inefficient aspects of residential energy behaviour: What are the policy instruments for change? Energy Policy 2006, 34, 1918–1927. [Google Scholar] [CrossRef]
  91. Duchin, F. Household Lifestyles: Ideas for a Research Program; Rensselaer Working Papers in Economy; Rensselaer Polytechnik Institute: Troy, NY, USA, 2003. [Google Scholar]
  92. INFAS. Mobilität in Deutschland; INFAS: Hamburg, Germany, 2002. [Google Scholar]
  93. Graham, S.; Schandl, H.; Williams, L. J.; Foran, T. The Effects of Climate and Socio-Demographics on Direct Household Carbon Dioxide Emissions in Australia. Geogr. Res. 2013, 51, 424–438. [Google Scholar] [CrossRef]
  94. Sutcliffe, M.; Hooper, P.; Howell, R. Can Eco-Footprinting Analysis Be Used Successfully to Encourage More Sustainable Behaviour at the Household Level? Sustain. Dev. 2008, 16, 1–16. [Google Scholar] [CrossRef]
  95. Fischer-Kowalski, M.; Singh, S. J.; Ringhofer, L.; Grünbühel, C. M.; Lauk, C.; Remesch, A. Socio-metabolic transitions in indigenous communities and the crucial role of working time. A comparison of case studies. Hum. Ecol. Rev. 2011, 18, 147–158. [Google Scholar]
  96. Zheng, J.; Garrick, N.W.; Atkinson-Palombo, C.; McCahill, C.; Marshall, W. Guidelines on developing performance metrics for evaluating transportation sustainability. Res. Transp. Bus. Manag. 2013, 7, 4–13. [Google Scholar] [CrossRef]
  97. Marshall, W. E. An evaluation of livability in creating transit-enriched communities for improved regional benefits. Res. Transp. Bus. Manag. 2013, 7, 54–68. [Google Scholar] [CrossRef]
  98. Kenworthy, J.R.; Laube, F.B. Patterns of automobile dependence in cities: An international overview of key physical and economic dimensions with some implications for urban policy. Transp. Res. Part 1999, 33, 691–723. [Google Scholar] [CrossRef]
  99. Druckman, A.; Buck, I.; Hayward, B.; Jackson, T. Time, gender and carbon: A study of the carbon implications of British adults’ use of time. Ecol. Econ. 2012, 84, 153–163. [Google Scholar] [CrossRef] [Green Version]
  100. Heinonen, J.; Jalas, M.; Juntunen, J. K.; Ala-Mantila, S.; Junnila, S. Situated lifestyles: II. The impacts of urban density, housing type and motorization on the greenhouse gas emissions of the middle-income consumers in Finland. Environ. Res. Lett. 2013, 8, 035050. [Google Scholar] [CrossRef]
  101. Frantz, M.D. Capital City Cultures: Reconstructing Contemporary Europe in Vienna and Berlin; Peter Lang: New York, NY, USA, 2011. [Google Scholar]
  102. Statistik Austria Population at the beginning of the year since 1981 per province. Available online: http://www.statistik.at/wcm/idc/idcplg?IdcService=GET_NATIVE_FILE&RevisionSelectionMethod=LatestReleased&dDocName=031770 (accessed on 28 January 2015).
  103. Stadt Wien / MA 23—Wirtschaft, Arbeit und Statistik: Origin of persons enrolled in Vienna per gender and counting district. Available online: https://open.wien.gv.at/site/datensatz/?id=78ff4a79-5942-4254-ae3d-567fae3c9db7 (accessed on 28 January 2015).
  104. Stadt Wien Stadtplan, data.wien.gv.at. Available online: http://www.wien.gv.at/stadtplan (accessed on 28 January 2015).
  105. Data sources Openstreetmap. Available online: http://www.openstreetmap.org (accessed on 28 January 2015).
  106. Data sources Geofabrik.de. Available online: http://www.geofabrik.de/ (accessed on 28 January 2015).
  107. Data sources Stadt Wien MA56 Open Data Vienna—Location of Schools. Available online: https://open.wien.gv.at/site/datensatz/?id=c1ba372b-dba2-4bce-b72e-b5c832eaaf44 (accessed on 28 January 2015).
  108. Van der Leeuw, S.E. Why Model? Cybern. Syst. 2004, 35, 117–128. [Google Scholar] [CrossRef]
  109. Lawrence, D.; D’Odorico, P.; Diekmann, L.; DeLonge, M.; Das, R.; Eaton, J.M. Ecological feedbacks following deforestation create the potential for a catastrophic ecosystem shift in tropical dry forest. Proc. Natl. Acad. Sci. USA 2007, 104, 20969–20701. [Google Scholar] [CrossRef] [PubMed]
  110. Liu, J.G.; Dietz, T.; Carpenter, S.R.; Alberti, M.; Folke, C.; Moran, E.; Pell, A.N.; Deadman, P.; Kratz, T.; Lubchenco, J.; et al. Complexity of coupled human and natural systems. Science 2007, 317, 1513–1516. [Google Scholar] [CrossRef] [PubMed]
  111. Pahl-Wostl, C. Participative and Stakeholder-Based Policy Design, Evaluation and Modeling Processes. Integr. Assess. 2002, 3, 3–14. [Google Scholar] [CrossRef]
  112. Kates, R.W.; Clark, W.C.; Corell, R.; Hall, J.M.; Jaeger, C.C.; Lowe, I.; McCarthy, J.J.; Schellnhuber, H.J.; Bolin, B.; Dickson, N.M.; et al. Environment and Development: Sustainability Science. Science 2001, 292, 641–642. [Google Scholar] [CrossRef] [PubMed]
  113. Fischer-Kowalski, M.; Haberl, H.; Hüttler, W.; Payer, H.; Schandl, H.; Winiwarter, V.; Zangerl-Weisz, H. Gesellschaftlicher Stoffwechsel und Kolonisierung von Natur. Ein Versuch in Sozialer Ökologie; Gordon & Breach Fakultas: Amsterdam, The Netherlands, 1997. [Google Scholar]
  114. Miller, E.J.; Douglas Hunt, J.; Abraham, J.E.; Salvini, P.A. Microsimulating urban systems. Comput. Environ. Urban Syst. 2004, 28, 9–44. [Google Scholar] [CrossRef]
  115. Chingcuanco, F.; Miller, E.J. A microsimulation model of urban energy use: Modelling residential space heating demand in ILUTE. Comput. Environ. Urban Syst. 2012, 36, 186–194. [Google Scholar] [CrossRef]
  116. Weisz, H.; Pichler, P. P.; Steinberger, J. K.; Heinz, M.; Gaube, V.; Remesch, A. Second generation model and scenarios of the building, transportation and decision making components. Available online: http://www.sume.at/project_downloads (accessed on 16 June 2015).
  117. Gaube, V.; Remesch, A. Impact of urban planning on household’s residential decisions: An agent-based simulation model for Vienna. Environ. Model. Softw. 2013, 45, 92–103. [Google Scholar] [CrossRef]
  118. Miller, E.J. Integrated land use/transport model requirements. Handb. Transp. Geogr. Spat. Syst. 2004, 5, 147–166. Available online: http://trid.trb.org/view.aspx?id=760205 (accessed on 19 June 2015). [Google Scholar]
  119. Jalas, M. The Everyday Life Context of Increasing Energy Demands: Time Use Survey Data in a Decomposition Analysis. J. Ind. Ecol. 2005, 9, 129–145. [Google Scholar] [CrossRef]
  120. Gaube, V.; Kaiser, C.; Wildenberg, M.; Adensam, H.; Fleissner, P.; Kobler, J.; Lutz, J.; Schaumberger, A.; Schaumberger, J.; Smetschka, B.; et al. Combining agent-based and stock-flow modelling approaches in a participative analysis of the integrated land system in Reichraming, Austria. Landsc. Ecol. 2009, 24, 1149–1165. [Google Scholar] [CrossRef]
  121. Smetschka, B.; Gaube, V.; Lutz, J. Integration der Genderperspektive im Nachhaltigkeitsdreieck mittels Zeitverwendung. Jahrb. Österr. Ges. Für Agrarökon. 2009, 18, 135–148. [Google Scholar]
  122. Smetschka, B.; Gaube, V.; Lutz, J. Working Time of Farm Women and Small-Scale Sustainable Farming in Austria. In Ester Boserup’s Legacy on Sustainability; Fischer-Kowalski, M., Reenberg, A., Schaffartzik, A., Mayer, A., Eds.; Human-Environment Interactions; Springer: Berlin, Germany, 2014; pp. 221–238. [Google Scholar]
  123. Remesch, A.; Gaube, V.; Haselsteiner, E.; Smetschka, B.; Fischer-Kowalski, M. Urban time and energy: An agent-based model simulating the effects of time structures on energy consumption in Vienna. In Modeling Social Phenomena in Spatial Context; Geosimulation: Salzburg, Austria, 2013; Volume 2. [Google Scholar]

