Article

Environmental and Social Sustainability of the Proximity Waste Collection System: A Case-Study Evaluation at an Italian Local Scale

DISBeF-Department of Basic Sciences and Foundations, University of Urbino "Carlo Bo", Campus Scientifico "E. Mattei", Urbino I-61029, Italy
*
Author to whom correspondence should be addressed.
Sustainability 2015, 7(6), 7492-7511; https://doi.org/10.3390/su7067492
Submission received: 7 February 2015 / Revised: 23 May 2015 / Accepted: 1 June 2015 / Published: 11 June 2015
(This article belongs to the Special Issue Sustainability of Resources)

Abstract

:
In an urban or suburban area, the sustainability of a waste management process is expected to be closely related to the territorial context and the local citizens’ behaviour. From this perspective, the implementation of the peculiar proximity waste collection system in a small town in Central Italy (San Costanzo) was considered. As compared to the previous road collection system in the same municipality, its environmental performance in terms of Source Separation Level (SSL), Waste Generation or Collection Rate (WGR or WCR) and Interception Rate (IR) was evaluated. An original analysis of the citizens’ monthly frequency and of their participation rate both in relation to the setting out of the Unsorted Residual Waste (URW) was also carried out. Following the full implementation of the new waste collection scheme, the SSL achieved almost 79%, the WCR of the URW decreased by about 82% and the most IR values resulted above 83%. From a social point of view, the study further highlighted that, with the new waste collection scheme active, more than 50% of users were accustomed to set out the URW at most 5 times per month and the corresponding participation rate to set out the URW was around 62%.

Graphical Abstract

1. Introduction

The role of waste collection appears to be crucial within an Integrated Waste Management (IWM) approach, since the way wherewith waste materials are sorted out and collected determines which waste management options (such as materials recycling, biological or thermal treatment) are feasible with respect to economic and environmental sustainability [1]. An effective waste collection method can significantly improve the quality and quantity of recovered materials and that of compost or energy eventually generated [1,2,3]; this, in turn, can lead to less resource consumption and to a sustainable use of the landfill as the only final sink for those residual waste streams that cannot be recovered.
Over the last decade, many cities hastened to develop new separate waste collection schemes, in order to comply with the European (EU) recycling targets set in the Waste Framework Directive (WFD) [4] by 2020. Each municipality, either in Italy or in other EU countries, implemented a source sorting programme on the strength of its socio-economic conditions, the urban and territorial structure, the demography and its own legislation on the matter.
Given the lack of an international standard for solid waste composition analysis [5], a comparison among the efficiencies of the actual widely different waste collection systems appears rather difficult. Nevertheless, several studies were presented on this theme, with the common objective to contribute as decision support in the planning of a Municipal Solid Waste (MSW) source sorting system. For example, Dahlén et al. [6] conducted a study in six municipalities in southern Sweden where three different collection systems were essentially employed (kerbside collection of recyclable and biodegradable waste, kerbside collection of recyclable material, collection of recyclable waste at drop-off points). The waste material flow and the composition of each system were described through six indicators suggested by Mattsson [7]. This work showed also the apparent positive impact of weight-based billing on the amounts of residual waste and pointed out the importance of the reliability of waste composition and generation data. In 2010, Gallardo et al. [8] studied the separate collection systems in Spanish cities with a population of over 50,000 inhabitants by means of proper efficiency indicators (namely, Fractioning Rate, Separation Rate, and Quality in Container Rate). In this work, two regression models (linear and exponential), aiming at correlating the amounts of materials that were correctly separated into containers with the distance between containers and citizens, were developed. Two years later, the same research group [9] analyzed the collection systems for sorted household waste used in Spanish towns with between 5000 and 50,000 inhabitants in order to complete the overview of the current state of selective waste collection in Spain. In this study, beta regression models were performed to analyze the influence on the Separation Rate of the following variables: Inhabitants per point (people/pt), time (years), and frequency of collection (freq).
The three above-mentioned studies analyzed the efficiency of collection systems in terms of amounts of sorted and recovered waste. Environmental and economic assessments are other valuable approaches to analyze the topic [9]. For example, an interesting research project about the energetic and environmental impacts of four different hypothesized scenarios of separate collection was carried out in Italy by Consonni and Viganò [10] and Giugliano et al. [11]. In the same realistic scenarios, economic balances were defined by Massarutto et al. [12].
With peculiar regard to Italy, the willingness to achieve the national separate collection targets (35% by 2006; 45% 2008, and 65% by 2012) introduced by the Legislative Decree No. 152/2006 [13], led small towns below 5000 number of inhabitants to implement mainly the door to door collection system and the original proximity waste collection system [14,15]. The latter represents a more sophisticated variant of the traditional road collection system [16]. Actually, it is similarly characterized by road containers but with a clutched linkage to the users i.e., each collection island supports only a precise group of users.
Given the particularity of the proximity waste collection system, the present paper aimed at first assessing the environmental performance of this system based on the detailed evaluation of its temporal implementation at a significant Italian local scale. In particular, the considered case-study concerned with the municipality of San Costanzo, in the provincial territory of Pesaro-Urbino (Marche Region, Adriatic Sea side, Central Italy), where the proximity waste collection system was implemented beginning from June 2011, by replacing the previous traditional road collection system. The structures of the two consecutive collection schemes were analyzed as well as the official waste flow data of the whole six-year period 2007–2012. Thus, the environmental performance of the implemented proximity waste collection system was properly evaluated based on the comparison with the previous traditional road collection system by means of appropriate indicators as the Waste Generation or Collection Rate (WGR or WCR), the Source Separation Level (SSL) [17], and the Interception Rate (IR) [18]. In addition, an original evaluation of the San Costanzo citizens’ attitude in bringing the waste over from 2012, i.e., when the original proximity waste collection system was fully implemented, was performed in this study. Actually, given the availability of punctual computerized information on the set-outs of the Unsorted Residual Waste (URW), the number of the related set-outs per month, per week’s day and per some peculiar time frames were elaborated. By means of the above-mentioned data, a frequency class analysis and a participation rate estimation about the bringing of URW were additionally obtained with the aim to have a parameterized evaluation of the social sustainability of the implemented proximity waste collection system.

2. Material and Methods

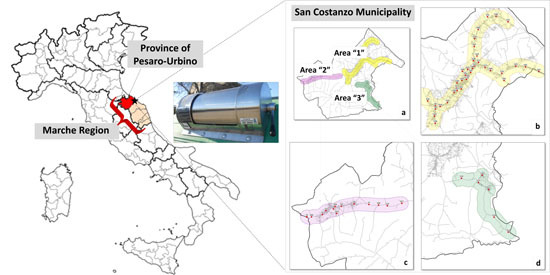
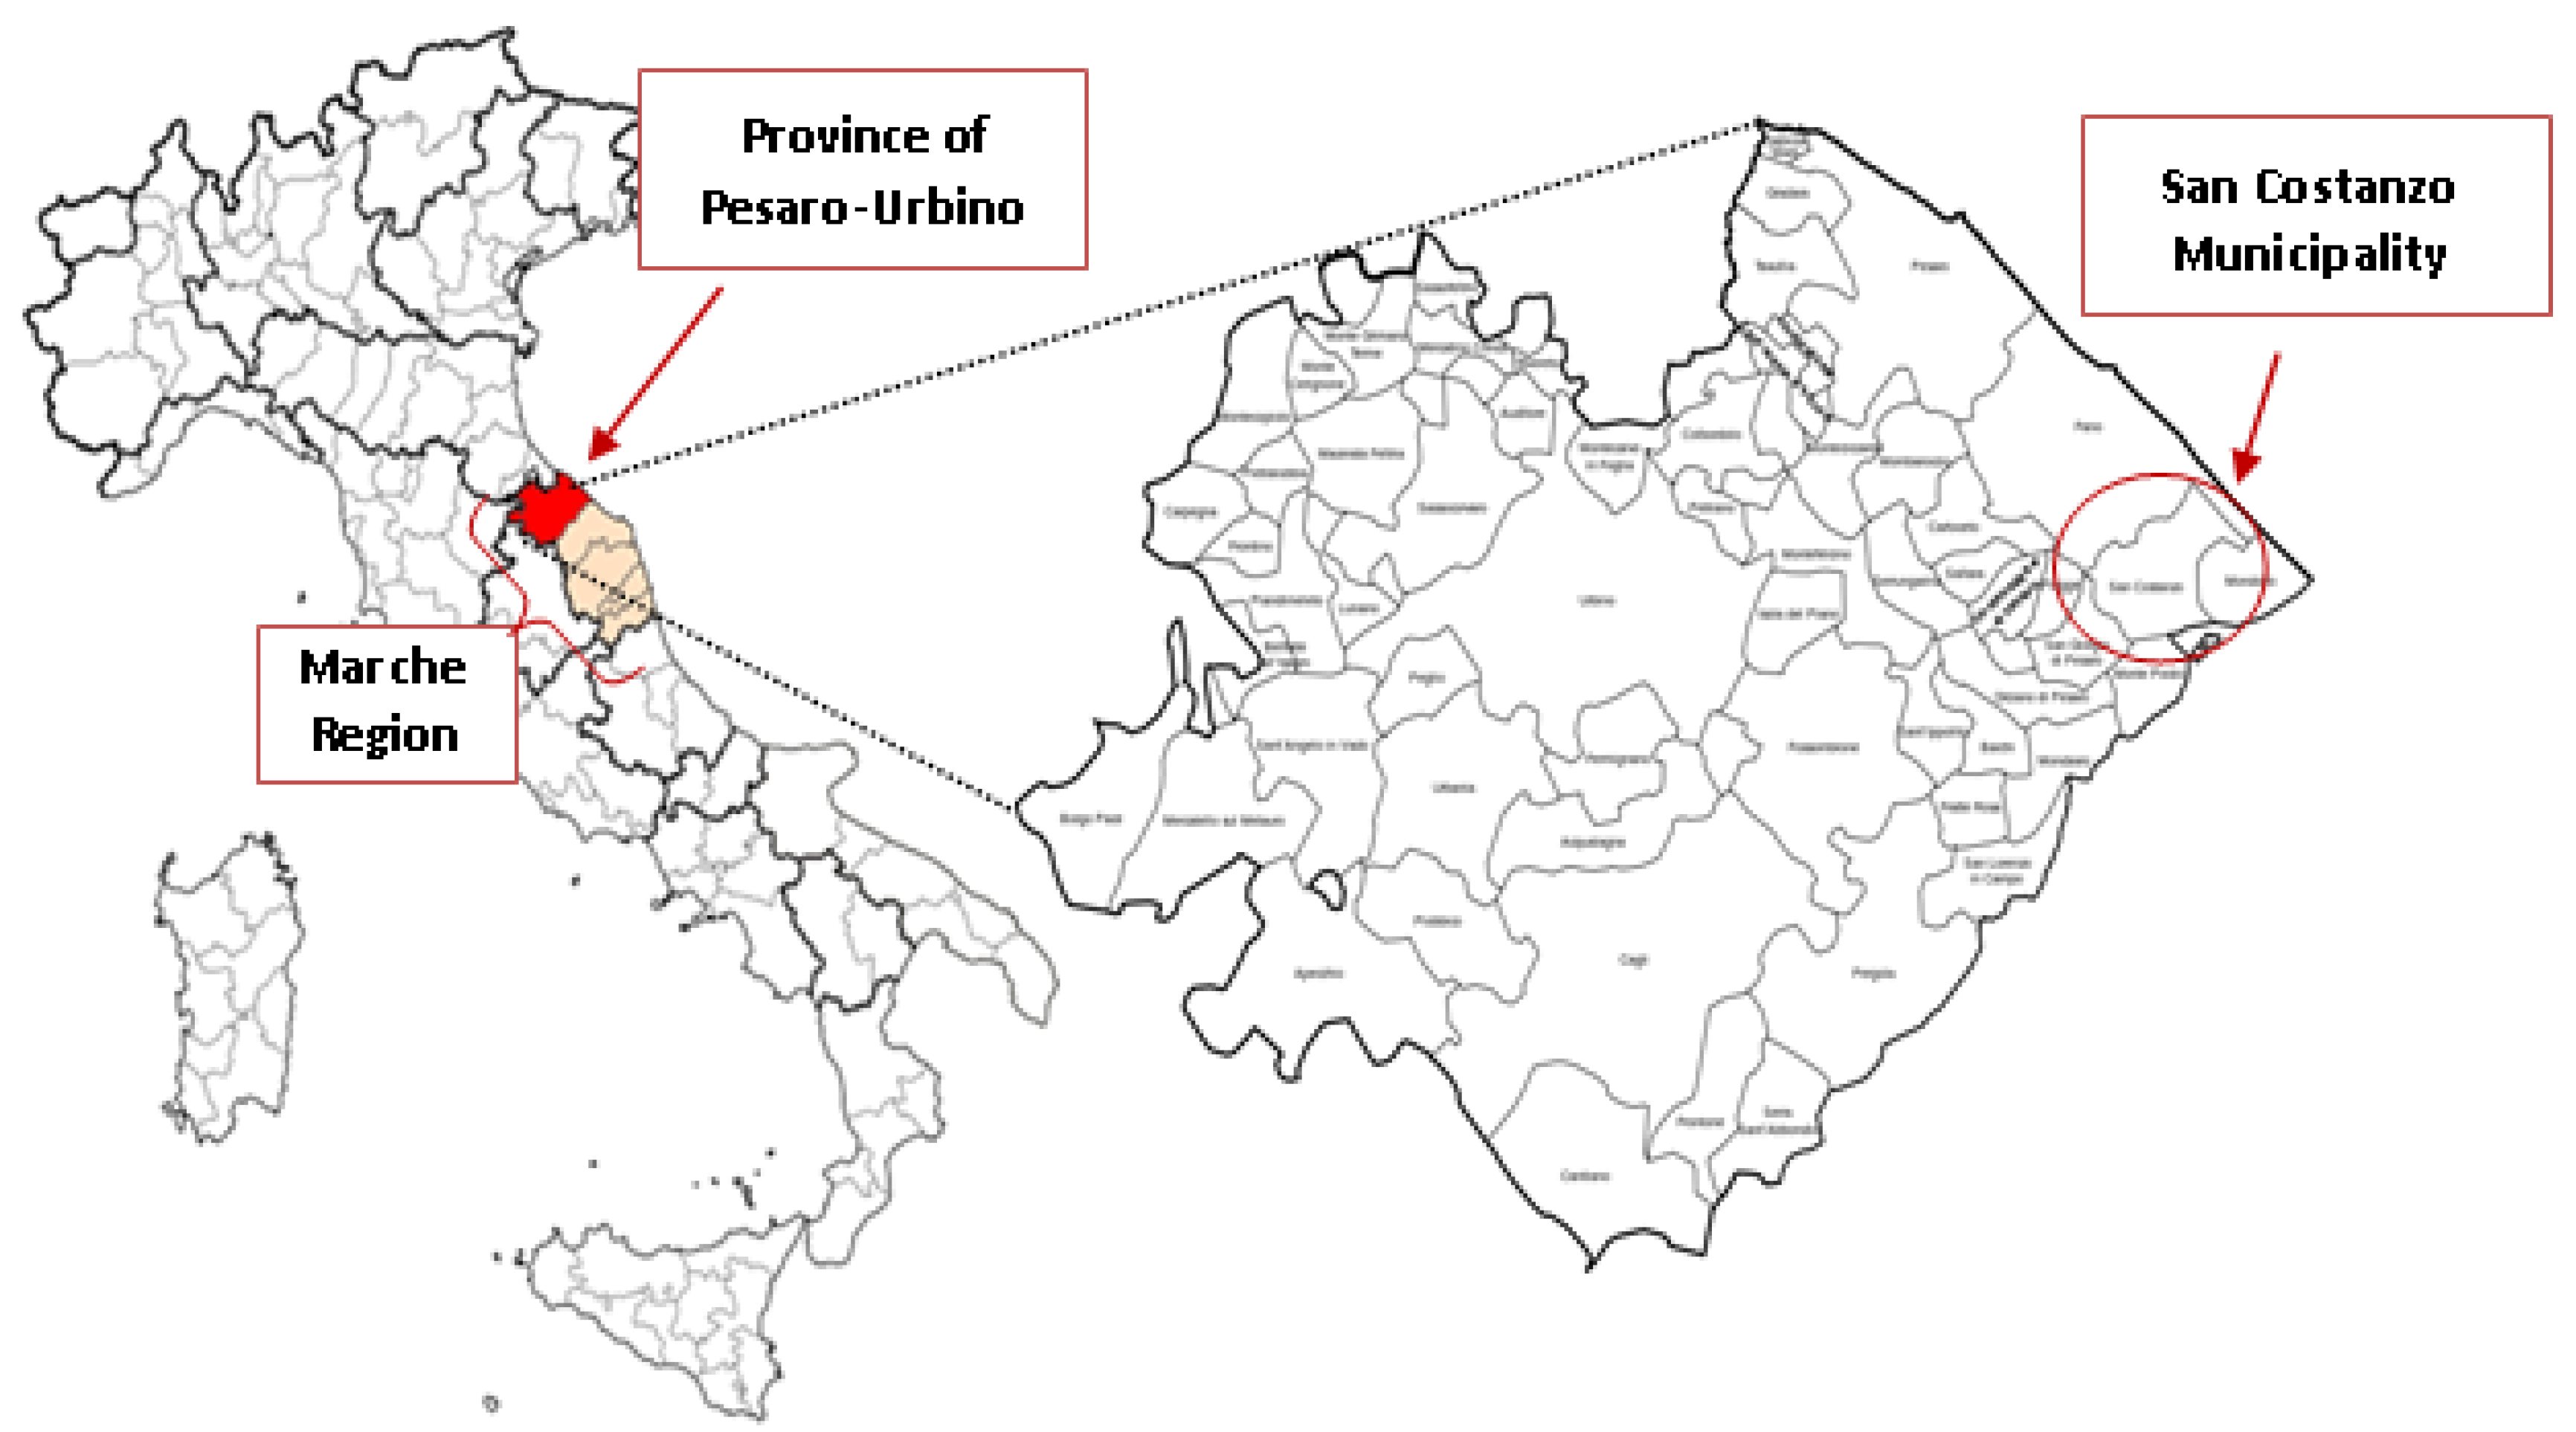
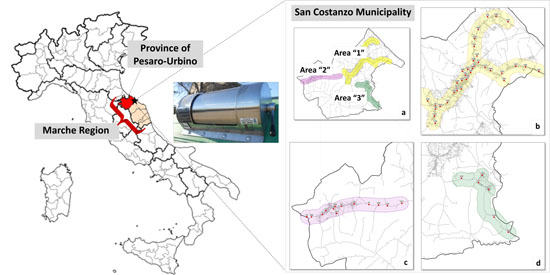
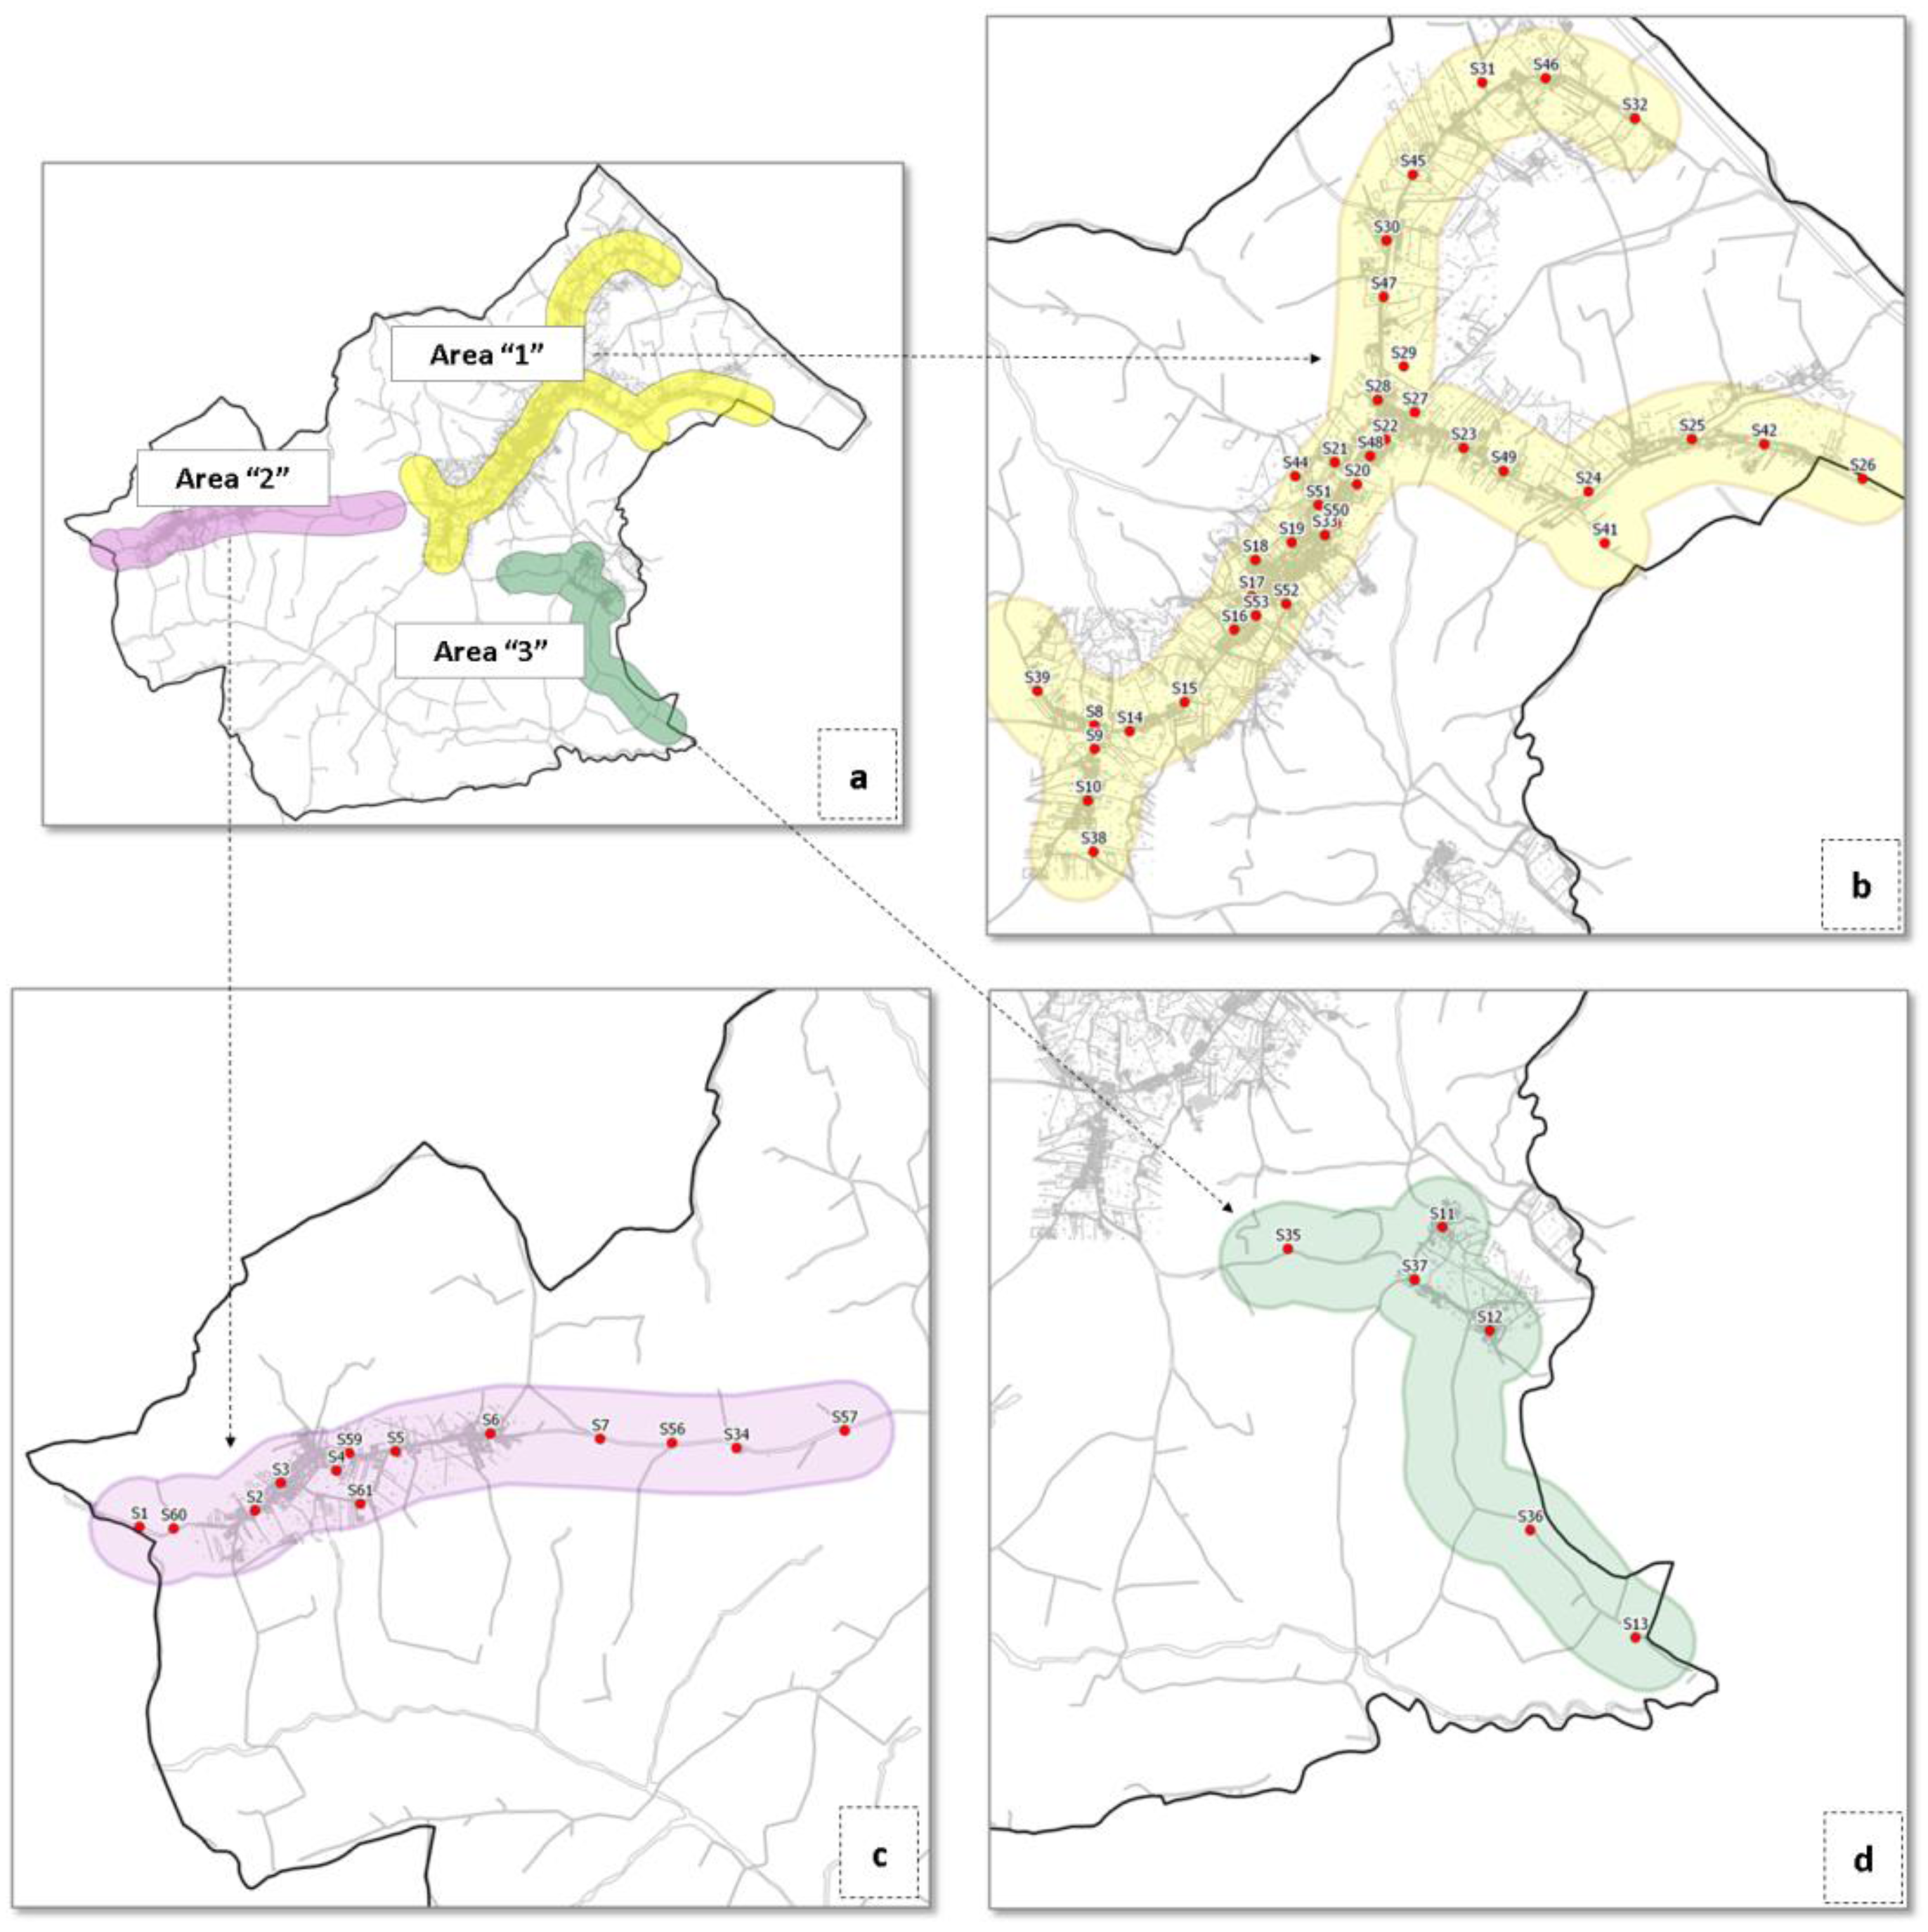
2.1. The Case-Study Area

The little town of San Costanzo is located in the eastern hilly area of Marche region (Central Italy, Adriatic Sea side), in the provincial territory of Pesaro-Urbino (Figure 1). Its total area is 4070 km2 and the main residential zones are: The centre of San Costanzo, the fractions of “Solfanuccio”, “Santa Croce” and “Santa Vittoria”, and the localities of “Cerasa”, “Croce di Cerasa”, “Stacciola” and “Le Grazie”. San Costanzo is also rather close to some big urban centres as Fano (12 km), Pesaro (30 km), and Ancona (40 km). The study area is characterized by two handicraft quarters: One is placed next to the residential zone of San Costanzo, the other is close to “Le Grazie”. They concern tailoring, wood carving, and metalworking activities. The demographic trend of San Costanzo was quite constant in the temporal range 2007–2012. The number of inhabitants was actually 4753 in 2007, 4863 in 2008, 4932 in 2009, 4976 in 2010, 4941 in 2011 and 4882 in 2012.
All the environmental hygiene services of the San Costanzo municipality are managed by the “ASET” public multi-utility group (literally, the “Azienda SErvizi sul Territorio” or, equivalently, the “Company of territorial services”).
Figure 1. Geographical position of the municipality of San Costanzo within the Marche Region. The circled area in the right-hand side represents the municipality of San Costanzo.
Sustainability 07 07492 g001

2.2. Temporal Evolution of the MSW Collection System in the Case-Study Area

Until 31 May 2011, the waste collection system in San Costanzo was the road type, which was based on the use of road containers and on the segregation of URW, plastic, glass, paper and cardboard, and household hazardous waste at the business stores. All the structural characteristics of this collection scheme are detailed in Table 1.
From December 2008 to May 2011, paper and cardboard were exceptionally collected through the door to door collection system with the principal aim of a correct source sorting of the cellulosic fraction to be sent to the proper recycling chain. Particularly, with regard to the paper fraction, the 1903 household users were supplied with red-coloured 40-l bins, while the 193 non-household users were provided with 120 or 240-l bins. The collection was carried out on the basis of a preset calendar previously sent to the same users and a biweekly collection frequency was observed. On the other hand, for the cardboard component, the local business users were equipped with 1000-l bins, to be emptied at a weekly rate. The doorstep collection produced a considerable increasing of the segregated cellulosic fraction compared to the previous system (as for example, the amount of paper and cardboard in 2008 was of 77,604 kg, raising up to 139,788 kg in 2009) and remained effective in San Costanzo until the introduction of the proximity waste collection system which occurred in June 2011.
Three other management aspects characterized the road collection system. These were all maintained within the proximity waste collection scheme which is still in force in San Costanzo.
Table 1. Structural characteristics (in terms of merceological fractions and waste receptacles) of the proximity collection scheme in comparison with the road collection scheme.
Waste FractionRoad Waste Collection SchemeProximity Waste Collection Scheme
Unsorted Residual Waste (URW)
  • 114 road bins (1800-l/2400-l/3200-l) + 11 road bins (1000-l) with three-weekly emptying frequency;
  • 60 road bins with cap-device, weekly emptying frequency;
  • 15 locked-up bins for non-recyclable dry waste, weekly emptying frequency;
  • 18 wheeled PE bins (120-l/240-l/360-l) with biweekly emptying frequency.
  • 13 locked-up bins for diapers, weekly emptying frequency.
Paper and Cardboard
  • 9 (3200-l) + 2 (2400-l) road bins with biweekly emptying frequency;
  • 39 road containers (2.4 m3/3.2 m3) with weekly emptying frequency;
Plastic and plastic packaging
  • 12 drop-off points next to big-size users with weekly emptying frequency.
  • 29 drop-off points next to big users with weekly emptying frequency
  • 14 skip containers (2.4 m3/3.2 m3) with weekly emptying frequency.
  • 42 skip containers (2.4 m3/3.2 m3) with weekly emptying frequency.
Glass
  • 14 bell-shaped containers (2–3 m3) with biweekly emptying frequency.
  • 37 bell-shaped containers (2–3 m3) with biweekly emptying frequency.
Household hazardous waste
  • 8 drop-off points for the batteries + 2 drop-off points for the expired medicines with a monthly emptying frequency.
Unchanged respect to the road collection scheme
Biowaste-------------------------
  • a 7-l under sink bin + a supply of mater-bi sacks for each household user;
  • 95 bins with a twice-a-week emptying frequency.
Garden/Yard Waste-------------------------
  • 22 locked-up bins with weekly emptying frequency.
Metals-------------------------
  • 16 locked-up bins with monthly emptying frequency.
Namely:
  • A collection centre of source-segregated waste in Fano: This very large waste centre is generally open 07:45–12:30 a.m. on Tuesdays, Thursdays, Fridays and Saturdays, whereas 13:15–18:00 p.m. is the opening time on Mondays and Wednesdays. Citizens may bring a wide range of waste types to this recycling station by segregating them previously at their own homes. The following materials may be accepted: Paper and cardboard, plastic, glass, steel, aluminium, vegetable oils, mineral oils, batteries, expired drugs, toxic and flammable waste (T/F) as, for example, spray nozzles, electric and electronic equipment, consumable office supplies, wood and pruning residues and discarded clothes. Once collected, the different waste types are sent to the proper treatment facilities for the recovery or the correct disposal;
  • A requested kerbside collection scheme for bulky waste at single or multi-family housing: Items such as discarded furniture, white goods, bathroom furniture, pruning waste and other household waste that are not suitable to be thrown into the road containers or to be brought to the collection center, due to their size and nature, are generally treated through this system;
  • Landfilling of the URW at the “Fano” sanitary landfill for non-hazardous waste, which is owned and operated by the “ASET” group itself.

2.3. The Introduction of the Proximity Waste Collection System

The implementation of the proximity collection system led to a substantial modification of the environmental hygiene service active in the case-study municipality including a widespread availability of waste containers on the territory. In terms of waste fractions, the new system was conceived in order to collect three significant fractions more than the previous one, i.e., biowaste, garden/yard waste and metals. Furthermore, all the waste containers were territorially organized to constitute collection islands and a new cap-shaped device for the collection of the URW was introduced (see the next two paragraphs). Table 1 provides all the structural characteristics of the new collection scheme in relation to the receptacles of waste (bins, containers, and sacks) as comparison with the previous road collection system. As mentioned above, the collection center of Fano for source-segregated waste as well as the requested kerbside collection of bulky waste held steady in this new phase.
An unequivocal strong point of the proximity collection system in San Costanzo was represented by the information and awareness campaign realized by the local administration. Generally, the launch of any new waste collection scheme is always associated with a critical phase because of the poor aptitude of the citizens to change their routine behaviours. Strategically, the public authorities take care of information and awareness programmes in order to instruct and help citizens in their new role.
The highest segregation efficiencies are, in fact, strictly related to a high level of information and to a regular follow-up of the citizen misusing of the system. The awareness programmes [19] can be carried out with several tools: Pamphlets are very common and immediate communication vehicles. Posters, TV spots, homepages and local newspapers are also useful means of informing the citizenry.
The most important thing is that the adopted communication media adopts the greatest possible number of people throughout an easily comprehensible language.
The highest segregation efficiencies are, in fact, strictly related to a high level of information and to a regular follow-up of the citizen’ misuses of the system. The awareness programmes [19] can be carried out with several tools: Pamphlets are very common and immediate communication vehicles, posters, TV spots, homepages and local newspapers are also useful means of informing the citizenry. The most important thing is that the adopted communication media adopts the greatest possible number of people throughout an easily comprehensible language.
In San Costanzo, the new proximity scheme was advertised by means of pamphlets and posters. The goal was that the citizens realized the importance of modifying their daily habits in order to become active protagonists of the new source-segregated waste collection scheme, rather than behaving as simple users of the service. The motto was the Italian translation of the following sentence: “Together we can make the difference”. Particularly, a detailed pamphlet, complete with a dedicated glossary and exact instructions for the correct segregation of all the waste categories, was distributed to all the families. By means of another pamphlet, a precise map of all the ecological islands was provided. Furthermore, all the citizens were invited to public meetings scheduled on purpose by the municipal administration and the “ASET” group.

2.3.1. Collection Islands

The introduction of the proximity waste collection system required the realization of 40 collection islands (or drop-off points) convenient to the placement of pools of waste containers. These areas were mainly located within or next to residential zones. Each of them was adjusted to the number of potential users and in some places a higher number of containers for the collection of the same material was provided.
Generally, each collection island was structured as follows: A bin for paper and cardboard, a bin for plastic, a bell-shaped bin for glass, a bin for metals, two wheeled bins for the collection of biowaste, and an innovative container for the URW.
In the more attended collection islands, a container for pruning residues, a bin for the old clothes, and some wheeled and locked up bins for diapers were also made available to the citizens. In order to guarantee a comfortable service to the families living outside the residential areas, further containers for the collection of the URW and the biowaste were placed along the main streets. As far as the inhabitants of the more isolated rural housings are concerned, they have to bring their rubbish to the nearest collection island. The lack of convenience is balanced by allowances on the MSW fees.

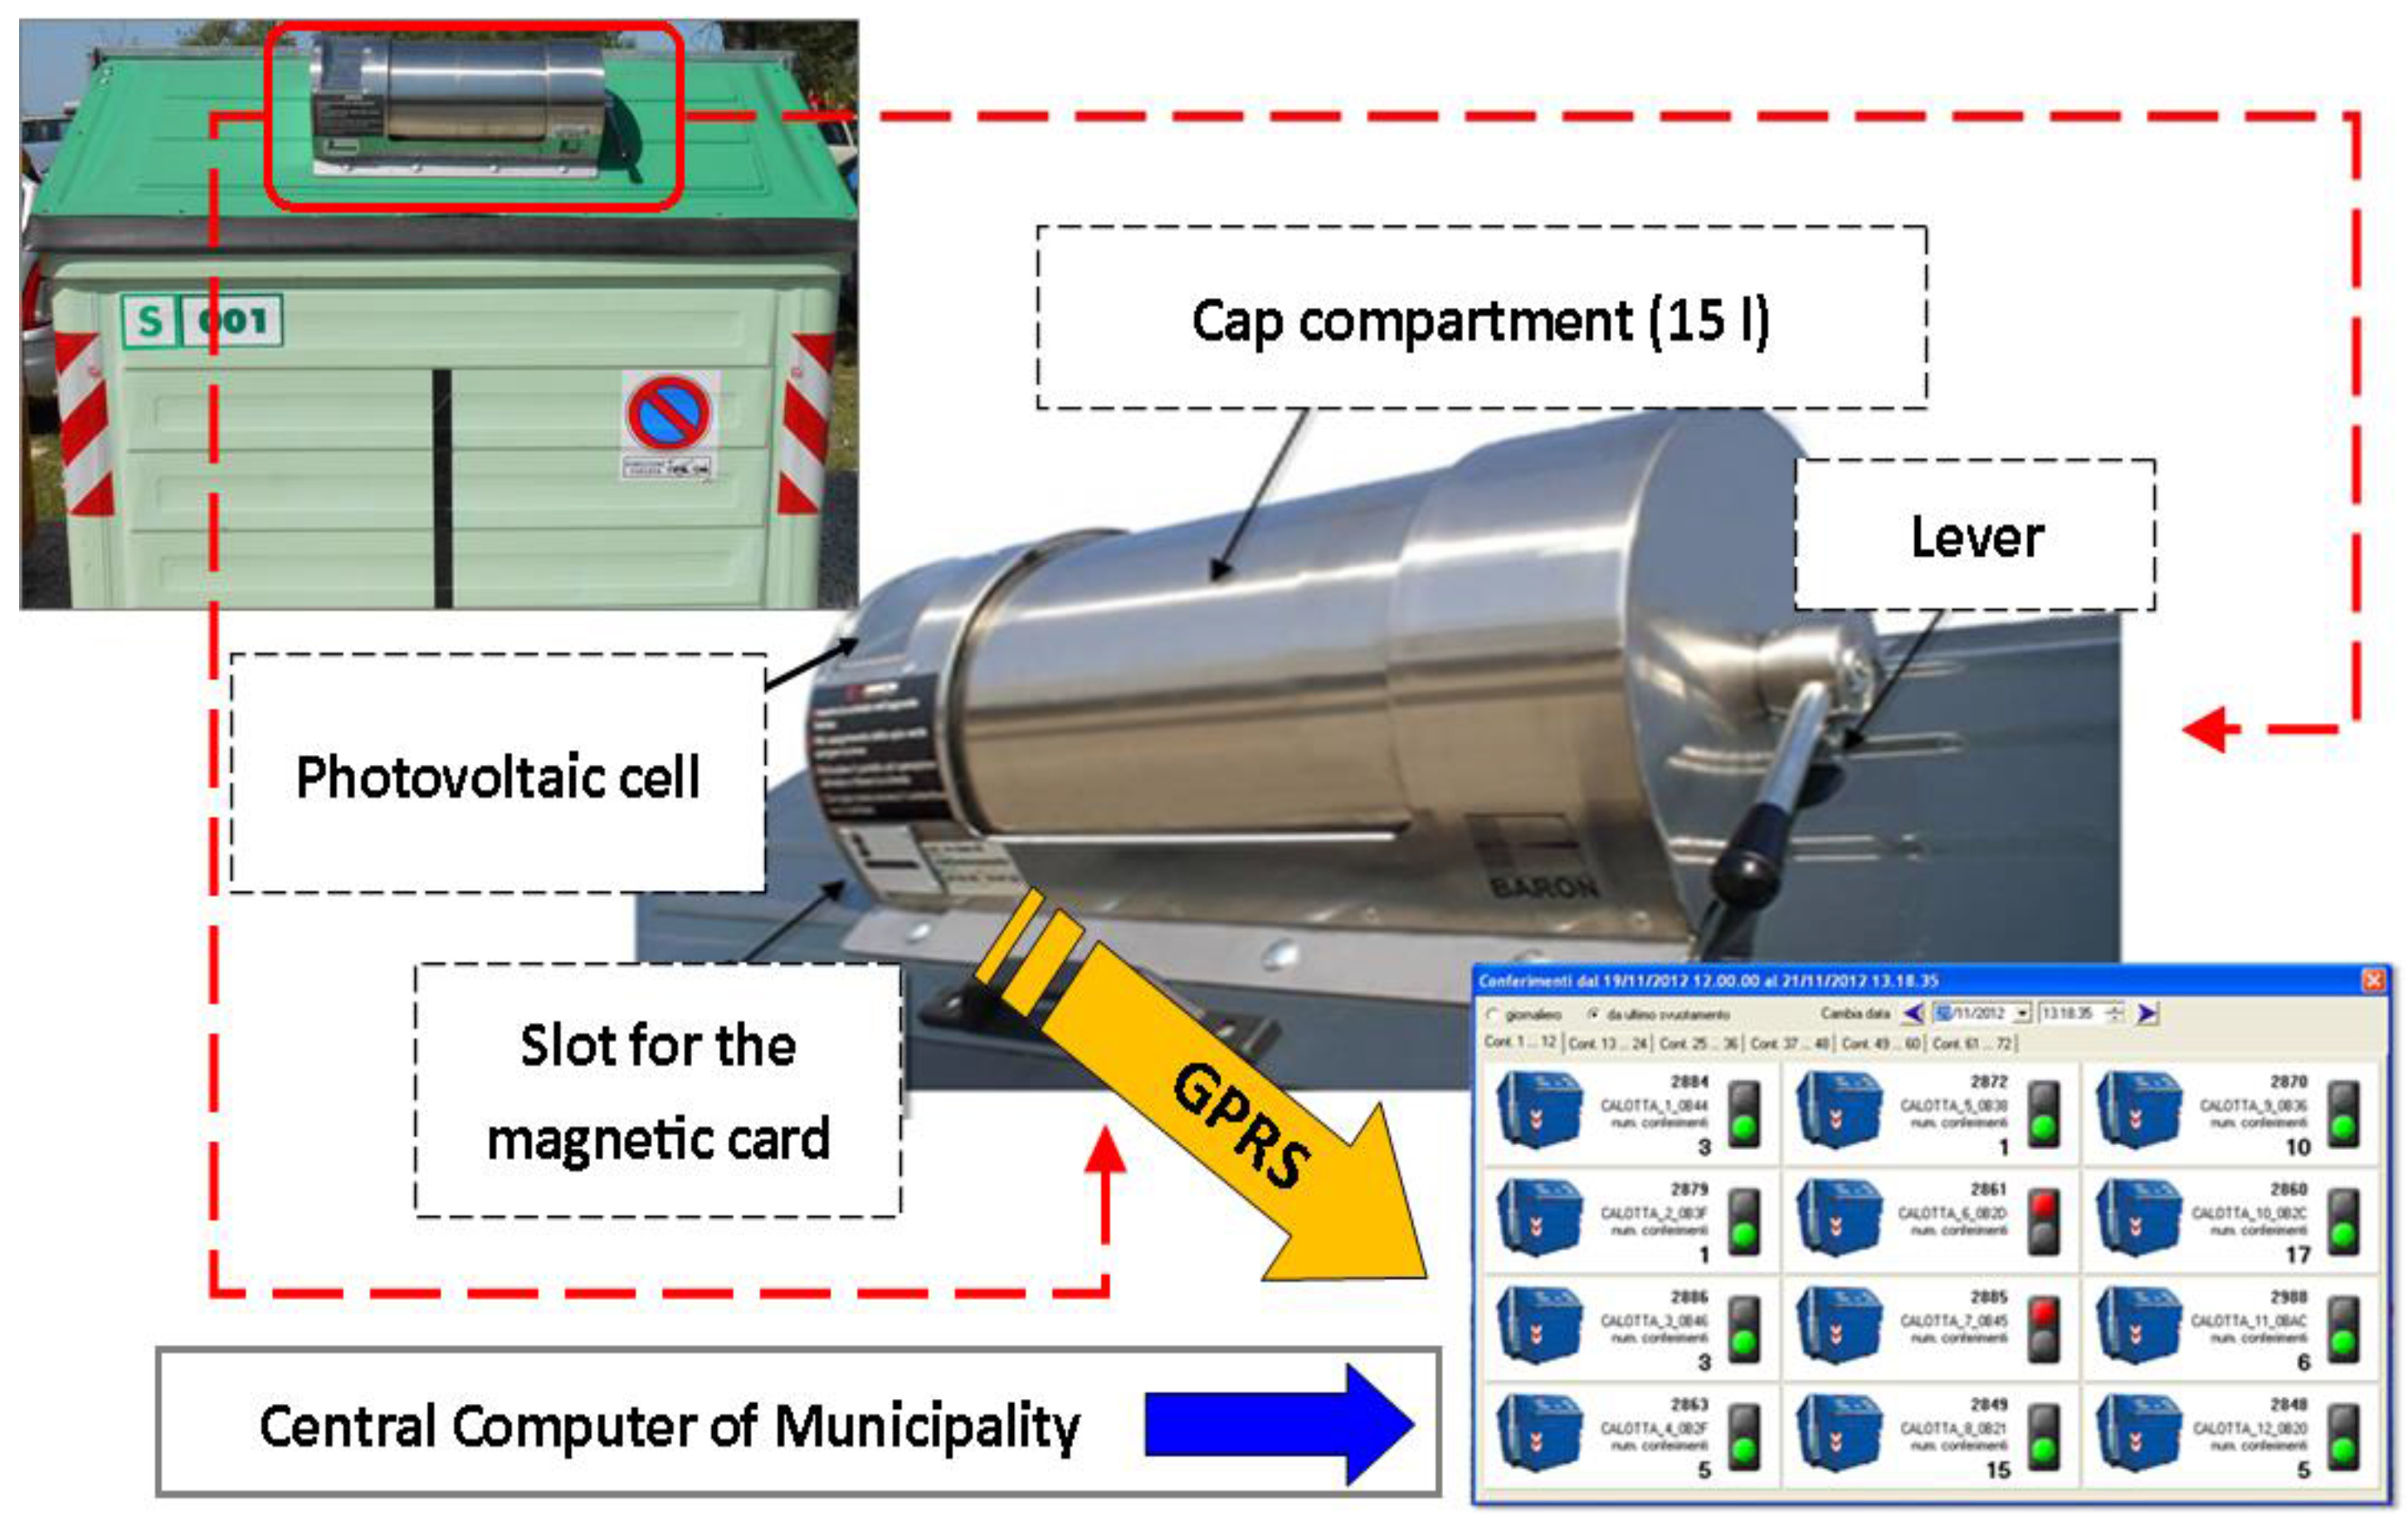
2.3.2. Device for the URW

The cap-shaped devices (Baron S.R.L., Italy) for the limited inserting of the URW were installed on top of the earlier four-wheeled containers (Figure 2). The lids were hinged to prevent alternative introductions of waste. Anyway, the possibility for the citizen to bring the waste at the most convenient times was preserved. Introducing the cap on the wheeled bin for the collection of the URW aimed mainly at the reduction of dry waste. Indeed, the volumetric limit leads the user to be more aware of the proper waste production and consequently to segregate waste with more participation.
Figure 2. Four-wheeled bin equipped with the cap-device for the limited inserting of the URW (upper left-hand side). Details of the cap-device (central-hand side) and real-time check screen of the set-outs (lower right-hand side).
Sustainability 07 07492 g002
The opening of the cap takes place when a proper magnetic card is inserted to a specific slot. The card is univocally connected to each singular user of the case-study municipality by means of an identification code (ID user). In this specific case-study, the term “users” is to indicate those physical and juridical persons charged by the municipality with a fee for the collection of waste in addition to all of the families, businesses, non-residents, second-home owners and holiday-home owners. Once the user is identified, a green light turns on and the opening lever is unblocked. The user can put the sack inside the cap and close it again by means of the lever. At the closing, the sack falls down inside the bin and the immediate reopening of the cap is prevented until the complete emptying of the cap by means of a blocking device. The mechanism is aimed at avoiding the introduction of two or more sacks simultaneously.
The system is energetically independent by virtue of a photovoltaic cell and a battery (Figure 2). An interesting peculiarity is the recording system of data, which memorizes the ID user, the date, and the exact time of the throwing event as well as the identification code of the cap (ID cap). At each singular opening, a 15-l volume of waste—the same volumetric capacity of the cap—is attributed to the user. A GPRS (General Packet Radio Service) device provides the transmission of all the acquired data to a central computer of the Municipality (with the possibility of scheduling the time of transmission) where a specific software receives and archives all the information (Figure 2).
Minute by minute, the check screen shows an overall view about all the caps—Each of them is geo-referenced with the corresponding number of set-outs. By selecting the singular cap, it is possible to view in detail how many and which users have thrown out the unsorted waste.

2.4. Environmental Performance of the Two Waste Collection Systems: Data Gathering and Elaboration

In the present work, the environmental efficiency of the original proximity collection system was evaluated in comparison with the previous traditional road system by means of the following specific indicators:
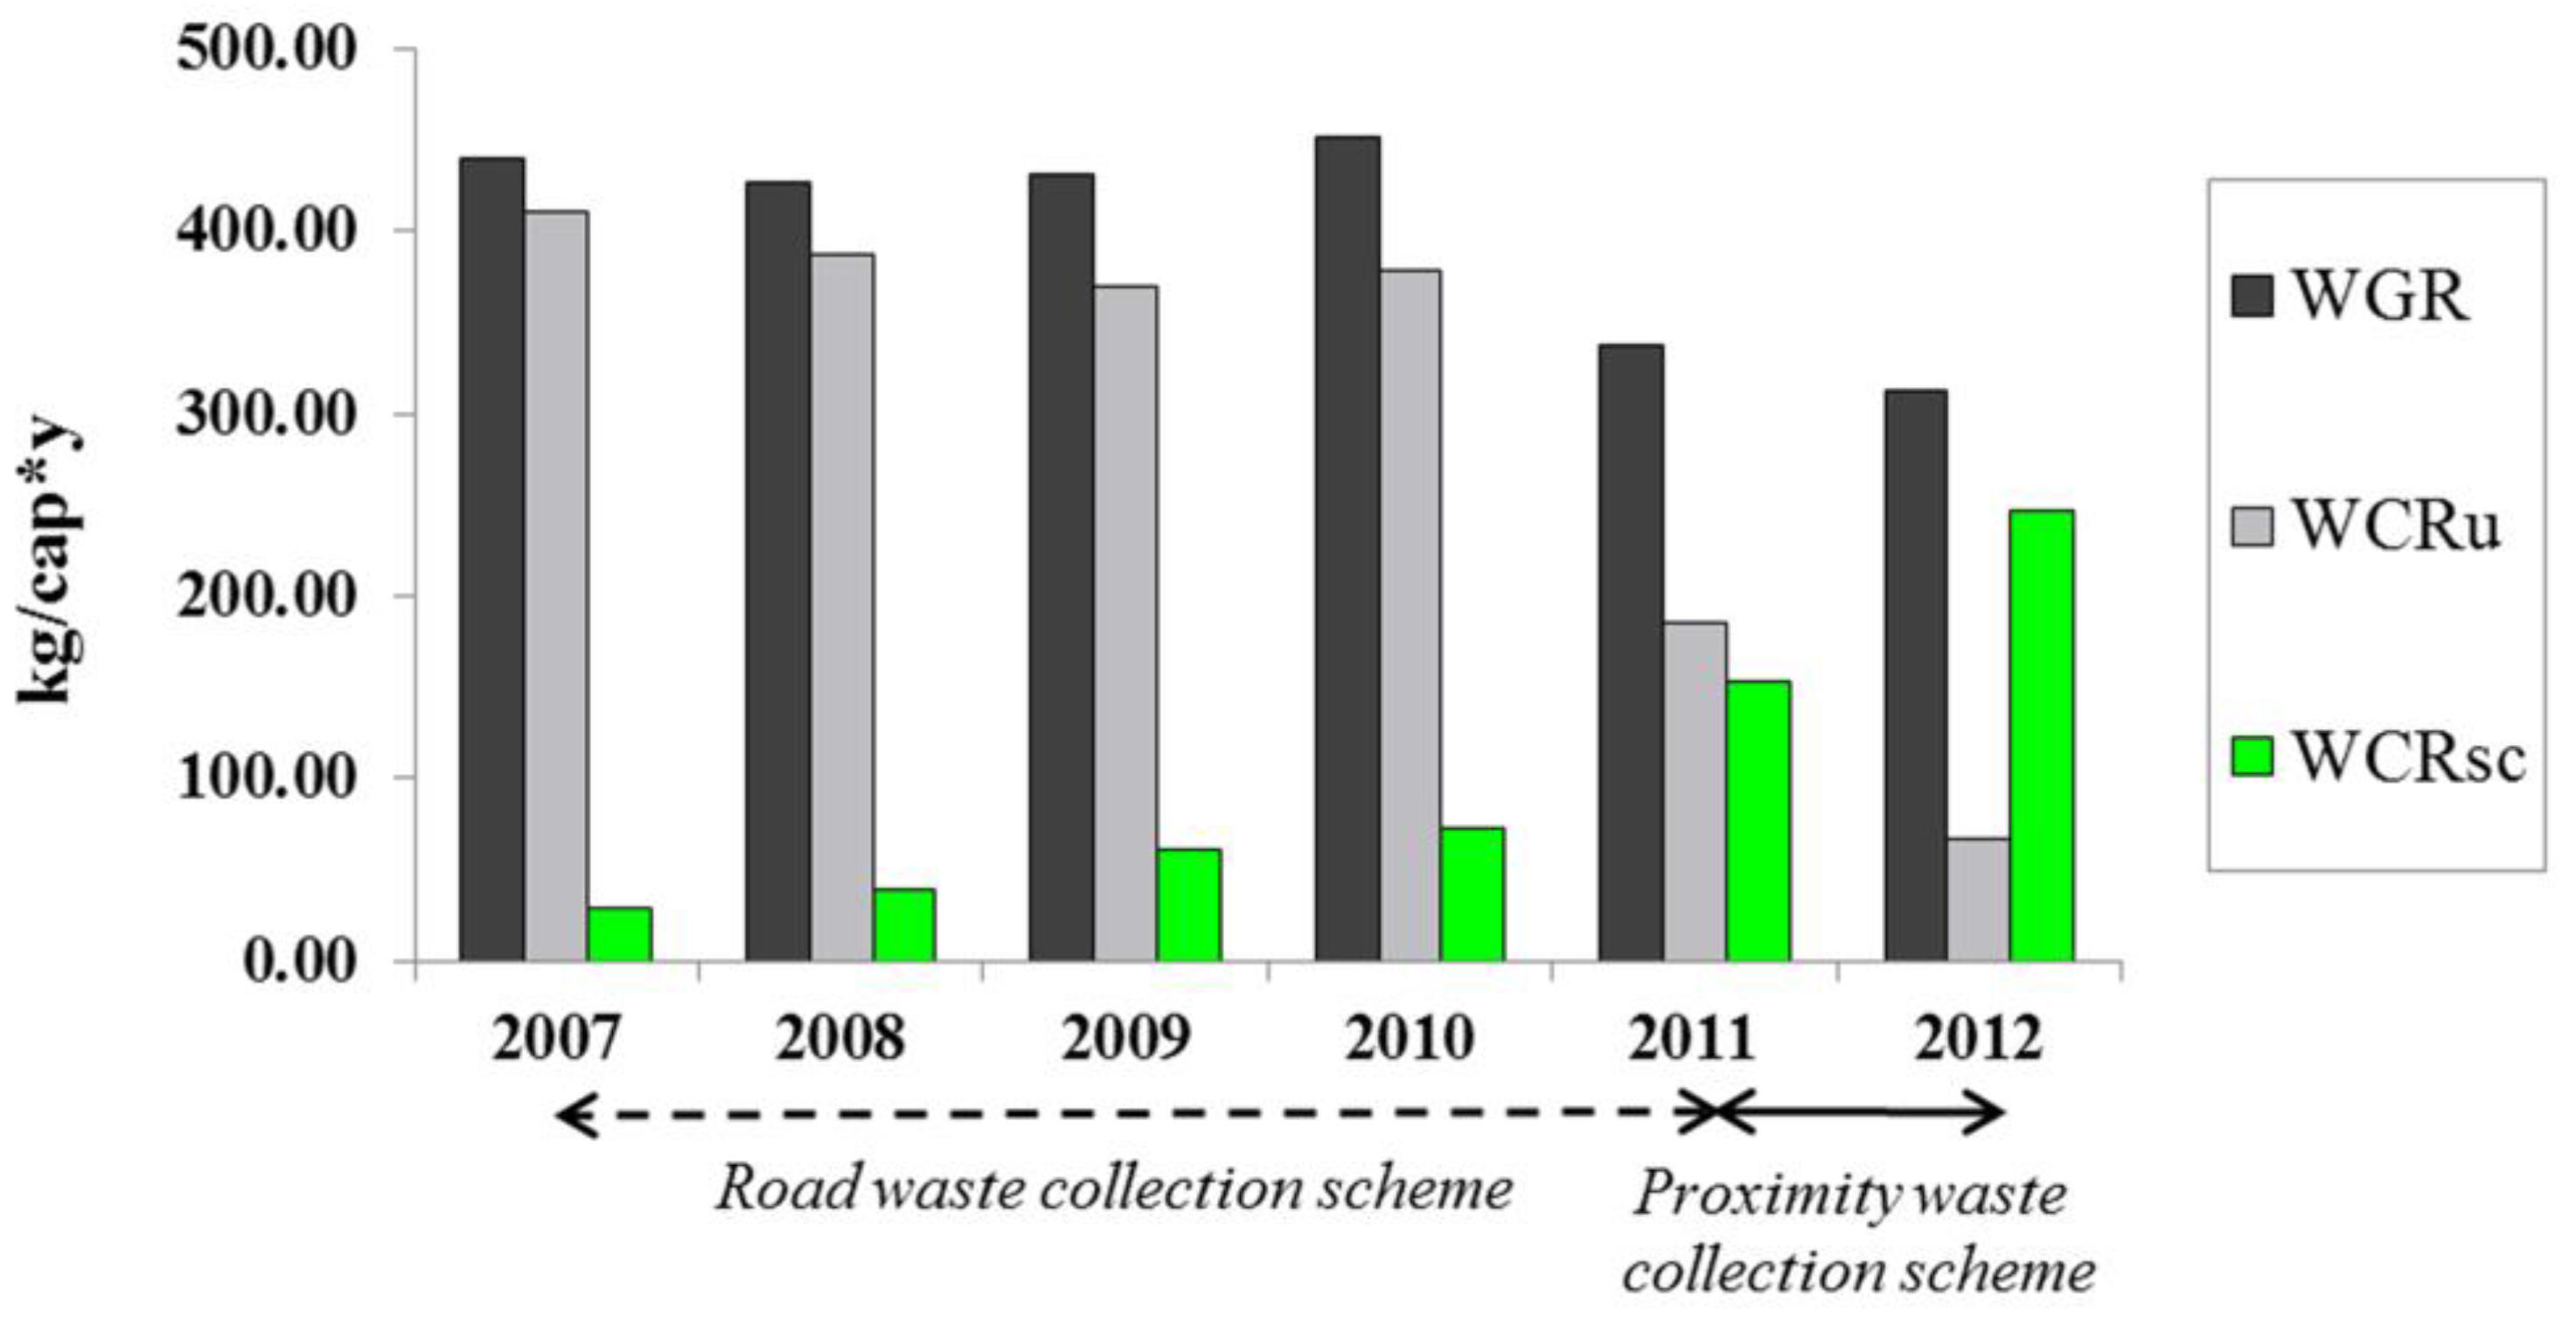
  • Waste Generation Rate (WGR) [kgwaste/capita year]
    W G R = Total   amount   of   MSW   generated   in   a   year Capita
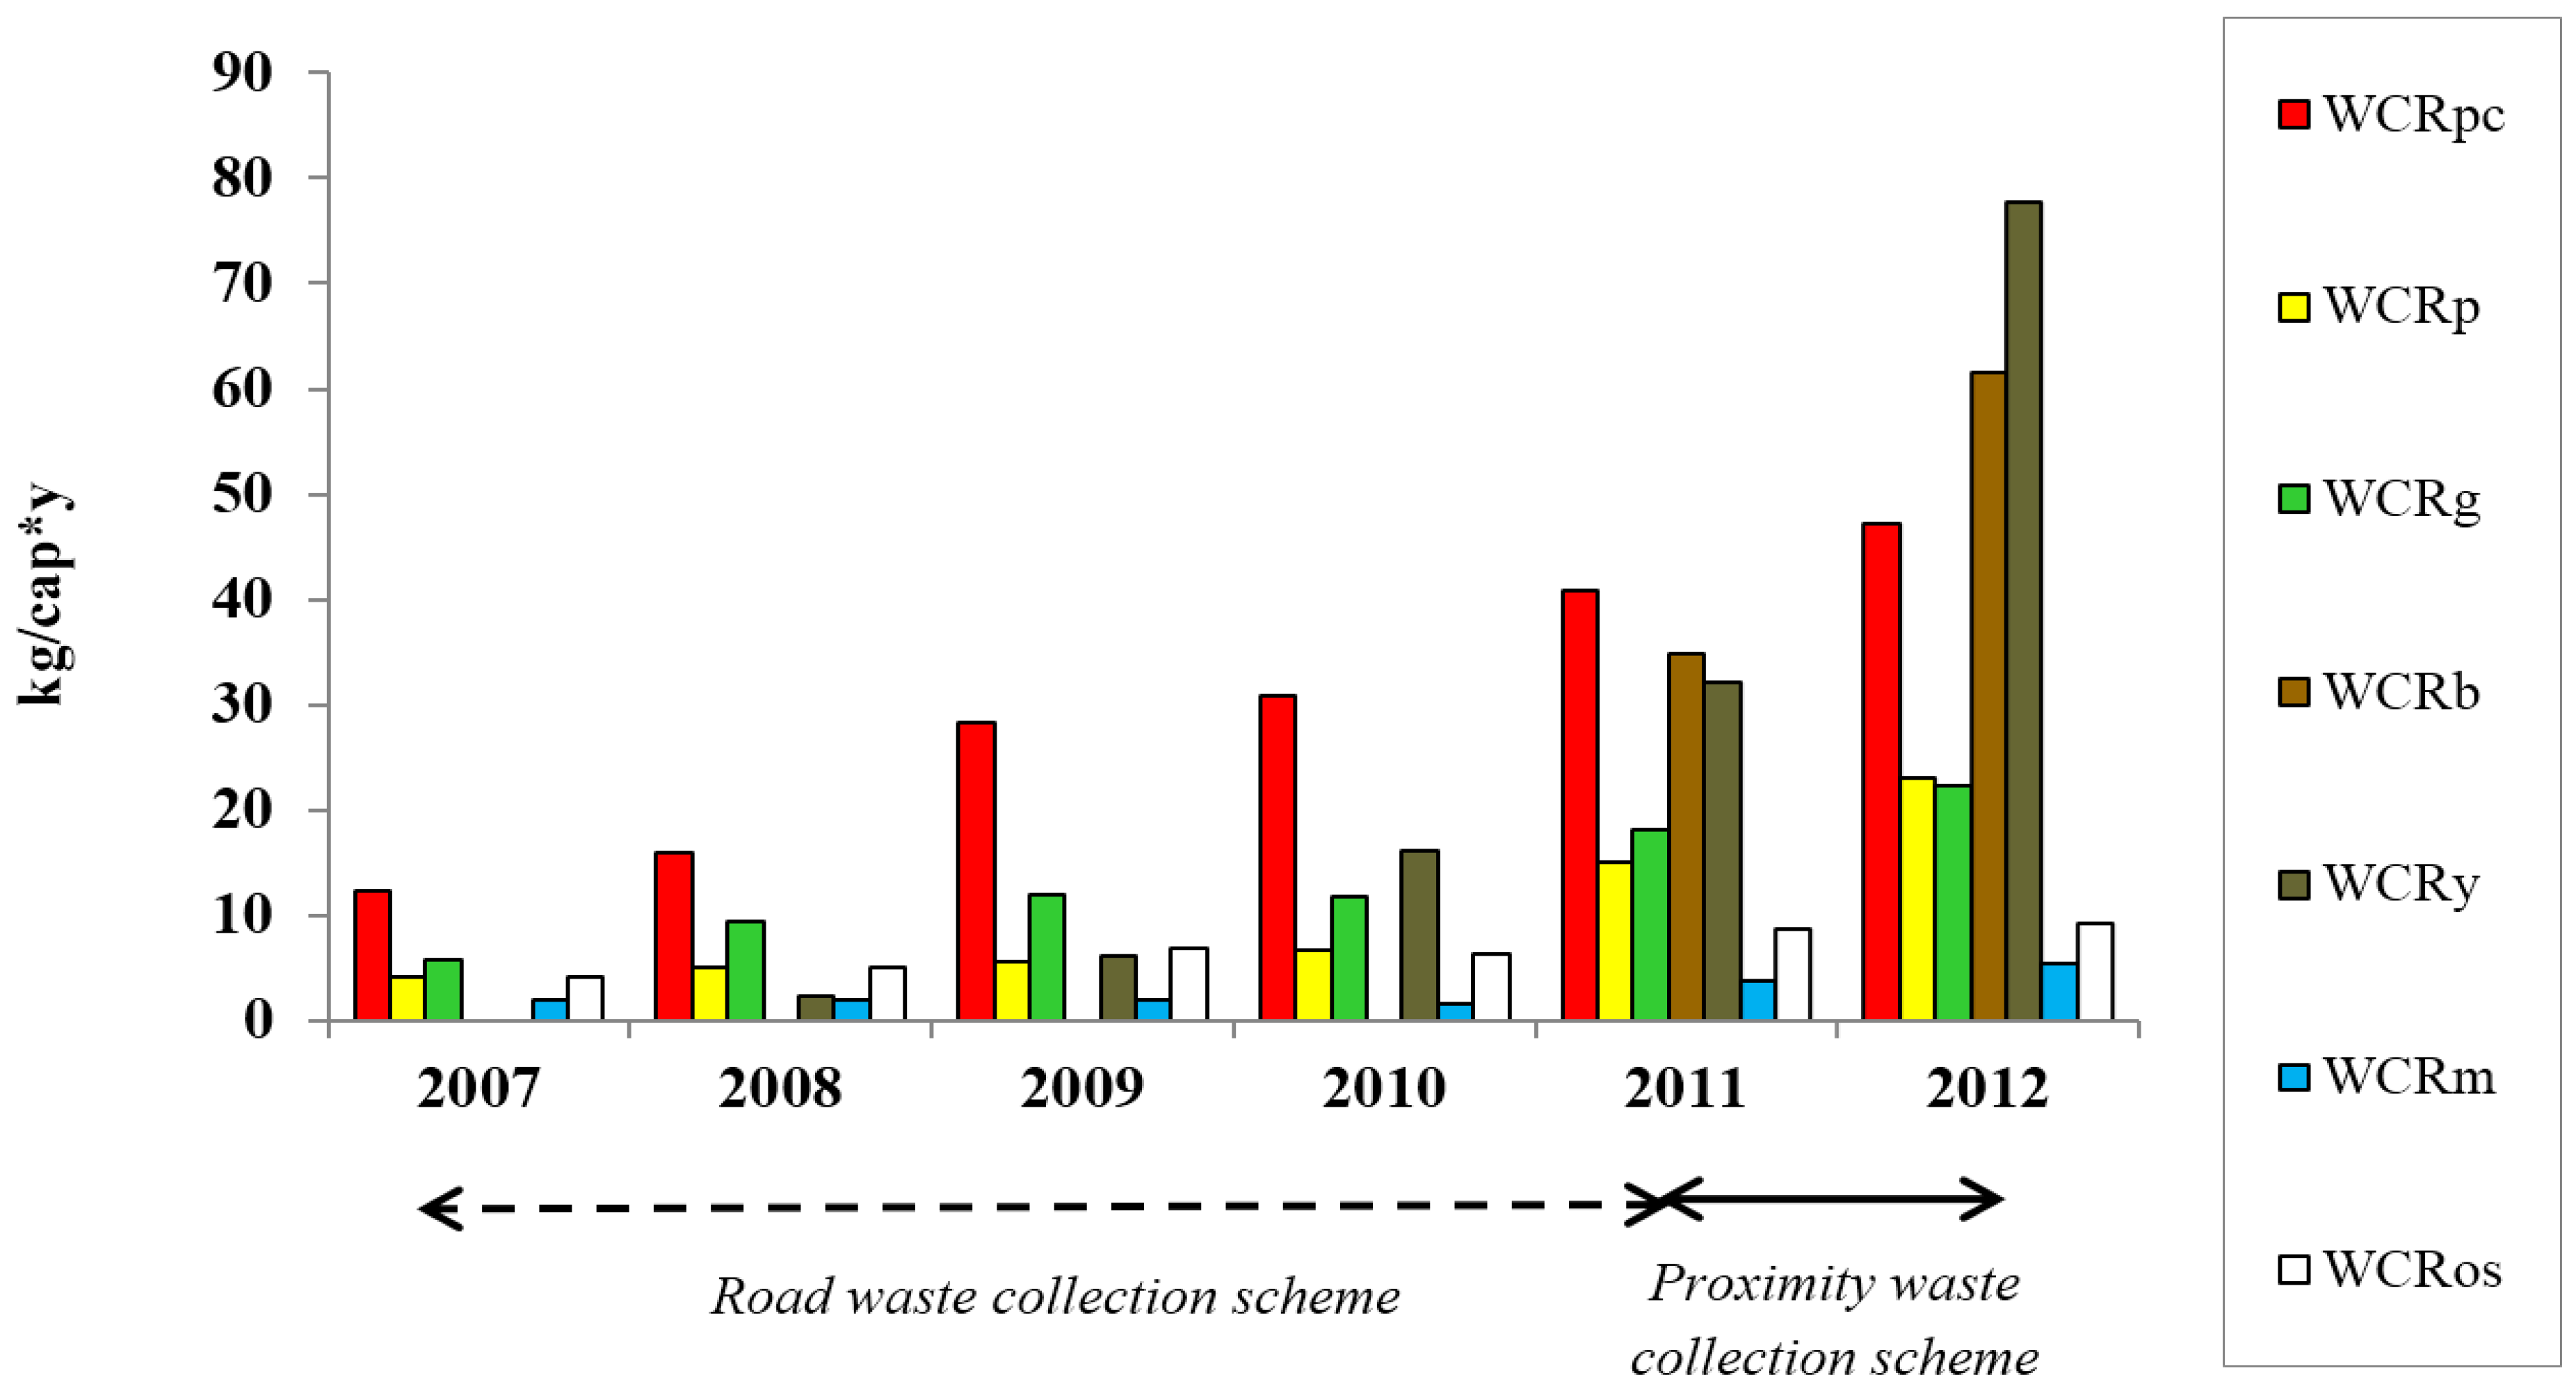
  • Waste Collection Rate (WCR) [kgwaste/capita year]
    W C R i = Amount   of   i   waste   separately   collected   in   a   year Capita
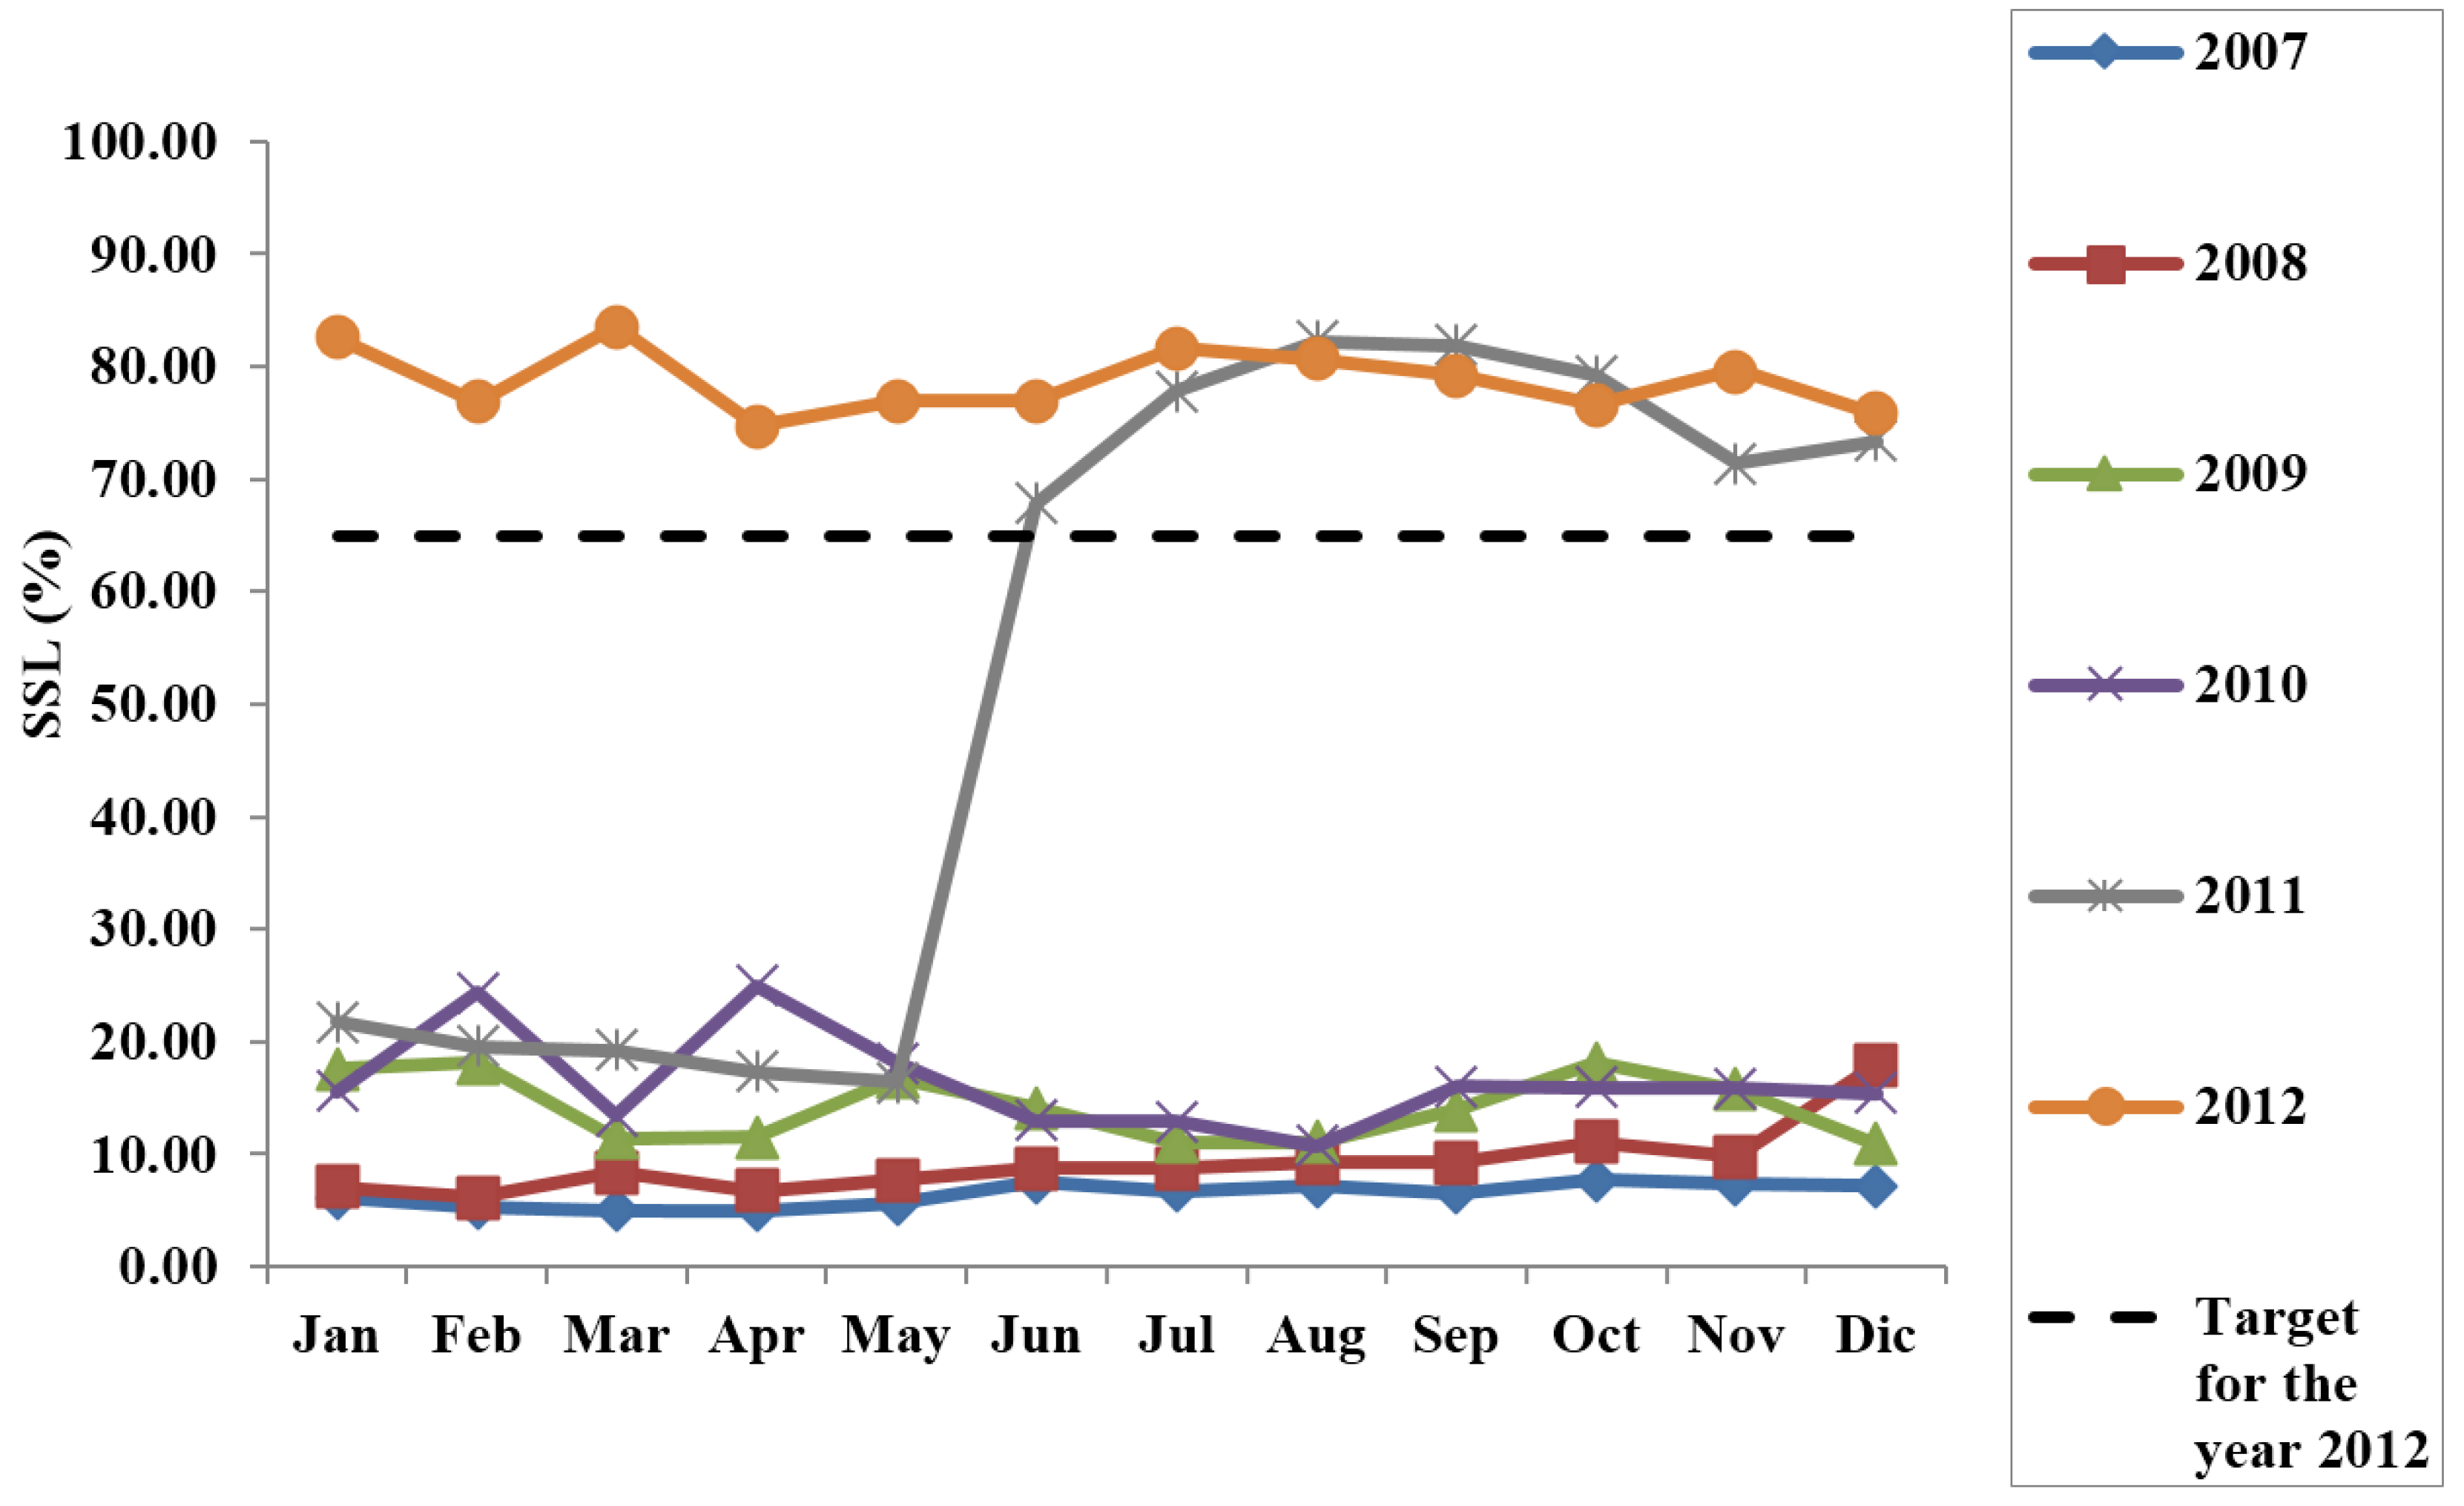
  • Source Separation Level (SSL) [% by weight]:
    S S L = Amount   of   total   waste   separately   collected   in   a   year Total   amount   of   MSW
  • Interception Rate (IR) [% by weight]:
    I R i = Amount   of   i   waste   separately   collected Total   amount   of   i   waste   estimated   at   the   source
For this purpose, the official waste flow data (provided by the “Aset” group) of the case-study municipality proved essential. They were analyzed over the six-years period 2007–2012.
The WCR was applied to both aggregated and separate levels. In fact, index i can indicate the overall amount of SC (sc), the URW (u) or each of the following source-sorted waste materials: Paper and cardboard (pc), plastic (p), glass (g), biowaste (b), garden/yard waste (y), metals (m) or another group of various materials hereinafter defined as waste otherwise specified (os). Particularly, in this last category all the waste materials which are not classifiable under the above-mentioned categories were included although they were collected in a proper segregated way (dedicated drop-off points, collection centre of source-segregated waste) for example, vegetable oils, mineral oils, batteries, expired drugs, electric and electronic equipment, consumable office supplies, and discarded clothes.
The SSL is the most widely used parameter to evaluate the efficiency of a source-sorting system for MSW. It is generally defined as the ratio between SC and MSW generated at source (frequently referred as Gross Waste) although, in Italy, the calculation method can be different depending on the Regions [20]. In this work, the MSW amount is considered as the sum of SC and URW [17].
As referred by Dahlen [21] the SSL can also be determined at separate levels, i.e., for the singular source-sorted materials. Particularly, the ratio between the amount of a singular waste that is intercepted through SC and its potential amount at source, is best known as Separation Rate (SRi) [8] or, as hereinabove defined, Interception Rate (IRi) [18], (where the index i is to indicate each of the individual source-sorted waste materials including, paper and cardboard (pc), plastic (p), glass (g), biowaste (b), garden/yard waste (y), metals (m) or waste otherwise specified (os)). This fundamental parameter can be estimated only by means of the compositional analysis on the URW flow, which is proper to identify the percents of recyclable material that are not selected through the SC. In fact, by summing the amount of the material i which is mingled with the URW amount to the corresponding material amount which is correctly segregated, it is possible to have an estimation of the whole amount of the i waste generated at source and, therefore, to obtain the IRi for the different waste materials. For this case-study, three compositional analyses of three different samples of URW were considered including one sample collected at the end of December 2009 and the other at the end of April 2011, respectively. The third one was picked up at the end of October 2012. In order to compare the two collection systems from the point of view of the IR, the average values between the IRi of the month of December 2009 and those estimated for the month of April 2011 were assumed as representative for the road collection system whilst the IR values of October 2012 were associated with the proximity system.

2.5. URW Sorting: Data Gathering and Elaboration

The peculiar software monitoring the status of the cap-shaped devices allows the digital storage of all data connected to the singular set-outs, namely, ID cap-devices, ID users, dates, and time. Given the usability of these information, a detailed analysis of the San Costanzo citizens’ behavior in setting out the URW was realized.
To this aim, the three most highly populated areas of the case-study territory have been identified and named Area “1”, Area “2” and Area “3” (Figure 3a).
Figure 3. Municipality of San Costanzo (a) the three differently coloured areas (Area “1” (b); Area “2” (c); Area “3” (d)) are representative of the main residential zones where the majority of the cap-shaped devices (red points) are located.
Sustainability 07 07492 g003
Area “1” (Figure 3b) includes all the residential zone of San Costanzo and the fractions of “Solfanuccio”, “Santa Croce” and “Santa Vittoria”. Area “2” (Figure 3c) is comprehensive of the localities of “Cerasa”, “Croce di Cerasa” and the residential buildings located along the county road “S.P.16”. Area “3” (Figure 3d) covers the fractions of “Stacciola” and “Le Grazie” and the residential buildings located along the county road “S.P.154”.
Therefore, all the cap-devices placed within the boundaries of the three reference areas were pinpointed and the correlated set-outs for the 2012 year were tracked down in the digital archive. Fifty-six of the sixty existing caps resulted in being included in the areas and were allocated (Figure 3) within the maps of the three reference areas by means of the open-source software QGIS 1.7.4 (Quantum-Geographic Information System). The four containers ruled out were considered not relevant because of their location in fringe and poorly populated zones.
Once defined, the digital data of interest were exported in Excel worksheets in the form of matrices having the following structure: A number of rows exactly coinciding with the number of the set-outs and four columns containing respectively date, time, ID user, and ID cap-device of each singular bringing event. Therefore, the monthly set-outs as well as the set-outs per week’s day and their occurrence at some defined time frames were derived.
By using the “pivot table” tool in the Excel spreadsheet, the number of set-outs per each ID user, month by month were even counted. Consequently, a reliable categorization of the users in terms of frequency rates was obtained for the whole study area as for the three above-mentioned subareas. Additionally, given the detail about the total number of users (those receiving the fee for the waste collection) in the San Costanzo municipality in the year 2012, a specific and original participation rate dealing with the setting out of the URW was calculated for the complete case study area. Following the model suggested by Woodard et al. [22] on the participation rate by households towards recyclable materials in UK countries in particular, this new specific participation rate was uniquely referred to by the URW. It was calculated as the ratio between the average number of users actively placing out the URW at least once in a month of 2012 and the resulting total number of users of the San Costanzo municipality for the same year.

3. Results and Discussion

3.1. Environmental Performance Evaluation

3.1.1. Waste Generation Rate (WGR) and Waste Collection Rates (WCRi)

During the first four years of the observed period (Figure 4), the per capita generation of MSW (WGR) was almost constant with values as 439.46 kgwaste/capita year in 2007, 426.75 kgwaste/capita year in 2008, 431.10 kgwaste/capita year in 2009, and 452.07 kgwaste/capita year in 2010. A notable decrease of the WGR values occurred in the last two-year period considered: 338.13 kgwaste/capita year and 313.09 kgwaste/capita year were generated in 2011 and 2012, respectively.
Given the demographic stability of San Costanzo in the whole period 2007–2012, the change of tendency is to be ascribed to the considerable reduction of MSW recorded in the last years as plausible effect of the implemented proximity waste collection system. Particularly, the overall amount of MSW was reduced by approximately 25.7% in 2011 (1,670,686 kg of total MSW) and 32.0% in 2012 (1,528,488 kg of total MSW) with respect to the year 2010 (2,429,523 kg of total MSW).
Figure 4. Per capita generation (kg/(cap year)) of MSW (WGR) and per capita collection (kg/(cap year)) of URW (WCRu) and SC (WCRsc).
Sustainability 07 07492 g004
As predicted, the decrease of the MSW amount in the two-year period 2011-2012 was in turn determined by a remarkable variation of the corresponding URW and SC flows (Figure 4). In fact, the WCRu (Figure 4) appears significantly reduced for both years, being 184.86 kgwaste/capita year and 66.60 kgwaste/capita year for the values of 2011 and 2012, respectively. On the other hand, a considerable increase of the WCRsc values is recorded: 153.27 kgwaste/capita year is the value achieved in 2011 while, 246.49 kgwaste/capita year is the value for the 2012 year. Anyway, the clear inversion tendency in the way of bringing waste on the side of citizens rises unequivocally in 2012: Only for this year, the WCRsc is highly exceeding the WCRu, like it should be aimed at in an efficient Integrated Waste Management System (IWMS).
The WCR of the singular waste materials (Figure 5) clarify which waste fractions contributed to the enhancement of the source-sorting activity. Beyond the increase of the WCRpc, WCRp, WCRg, WCRm, WCRos, and WCRy, the proximity waste collection system determined the separate collection of another important refuse: the biowaste. The amounts of biowaste and of garden/yard waste appear to be the most abundant components of the SC of 2012, followed by paper and cardboard, plastic and glass.
Figure 5. Per capita collection (WCR) (kg/(cap year)) of: Paper and cardboard (WCRpc), plastic (WCRp), glass (WCRg), biowaste (WCRb), garden/yard waste (WCRy), metals (WCRm), waste otherwise specified (WCRos).
Sustainability 07 07492 g005

3.1.2. Source Separation Level (SSL) Results

The SSL (Figure 6) achieved in the year 2011 (45.3%) is noticeably higher than the past years (2007–2010), when the values were always below 17%. Nevertheless, the first SSL value consistent with the legislative target can only be recorded starting from the year 2012. The important increasing of the SSL in 2011 is essentially due to some practical aspects of the structural reorganization occurring within the waste collection system in that year. Indeed, the peculiar cap-shaped device seems to have indeed produced a real inhibitory effect on the aptitude of the citizens to indiscriminately throw their refuse in the URW bins, with a consequent reduction of the URW amount. Furthermore, a more widespread availability of proper bins (collection islands) for a greater number of recyclable fractions evidently improved the quantity of source-sorted waste materials. Thus, the SC amount resulted in a notable increase in 2011.
The incisive role of the proximity collection scheme is better highlighted by the monthly trends of the SSL (Figure 7).
Figure 6. Source Separation Level (SSL) results during the surveying period (2007–2012).
Sustainability 07 07492 g006
The monthly average values of the SSL in the four-year period 2007–2010 fall into the range 6.4%–16.4%. Conversely, the curve related to the 2011 year shows the coexistence of two different monthly trends in the same year: The first can be identified from January to May with a monthly average value quite homogenous with the previous ones, i.e., 18.9% while, the second accrues from June—just the beginning of the implementation of the proximity waste collection system—to December, with a monthly average value of 75.1%. The enhancement led by the new system, in terms of SSL, lingers on also over the whole 2012 year: The related monthly average value is 78.7%, which is a value far above the target of 65% fixed by the legislation for the same year.

3.1.3. Interception Rates (IRi) in the San Costanzo Municipality in 2007–2012

As shown in Table 2, the values of IR resulting for the month of October 2012 are all particularly high (83.23%–97.59%) except for IRos (23.86%) which is the unique waste category not separated with remarkable efficiency although that is probably due to the same assorted nature of the waste category. The IR of the plastic is 61%, a value sensibly lower than the others but considerably higher than that achieved with the road collection system.
Figure 7. Monthly trends of the Source Separation Level (SSL) during the surveying period (2007–2012). The dotted line is to indicate the target of 65% fixed by the Italian legislation for the 2012.
Sustainability 07 07492 g007
The extremely low IR values characterizing the road collection system (Table 2) give an exact idea on how scant the recycling activity was in San Costanzo until May 2011. The only fair IR value is referred to by the glass fraction (69.25%). The IRpc and the IRp are respectively of 33.49% and 18.65% and the remaining IR values are below 10%.
Table 2. Comparison between the IRi (Interception Rate) of the two waste collection systems: For the road waste collection system the IR values of two months (December 2009, April 2011) were averaged. For IRi of the proximity waste collection system, the values of October 2012 were considered.
IRiRoad Waste Collection SystemProximity Waste Collection System
IRpc (%)33.4984.29
IRp (%)18.6561.00
IRg (%)69.2595.87
IRb (%)0.0083.23
IRy (%)6.5797.59
IRm (%)9.7688.86
IRos (%)6.5023.86

3.2. Citizen’s Behaviour in the Setting out of URW

As anticipated, the fifty-six cap-devices of the adopted zoning were allocated (Figure 3) within the three reference areas by means of the open-source software QGIS 1.7.4. Namely, thirty-seven cap-devices were found to belong to Area “1”, thirteen units to Area “2” and other six units to Area “3”. Consequently, the monthly set-outs, the set-outs per week day and their occurrence at some defined time frames were investigated for the whole municipal territory as well as for the three defined subareas (Table 3). The same approach was applied in the study of the participation frequencies by San Costanzo’s citizenry in setting out the URW (Table 4). For the surveying period, the 2012 year was selected.
Table 3. Resulting values of the number of set-outs (No.s.o.) per cap-device referring to different temporal units (months, week days, time frames). The values all refer to 2012.
Set-Outs vs. Temporal UnitArea “1”Area “2”Area “3”Total Area
No.s.o. month−1·year −1January209.27112.2364.50171.23
February161.1496.6251.83134.45
March223.41119.9267.50182.68
April219.89122.3877.33181.98
May75.4653.2337.0066.18
June65.3555.1542.5060.54
July239.05133.0078.83197.27
August233.81131.5482.00193.80
September56.5942.1522.6749.61
October222.1990.9265.83174.96
November191.6581.9257.17151.77
December193.78119.4653.00161.45
No.s.o. week’s day −1·year −1Monday310.11163.6299.17253.50
Tuesday286.54163.4694.00237.34
Wednesday296.11161.3894.83243.27
Thursday297.49177.2399.33248.34
Friday295.19161.15121.67245.48
Saturday339.22182.92111.83278.57
Sunday266.95148.7779.33219.41
No.s.o. time frame −1·year −10–2 a.m.8.004.237.007.02
2–4 a.m.2.700.620.672.00
4–6 a.m.6.703.231.175.30
6–8 a.m.133.8972.0855.17111.11
8–10 a.m.381.46201.62116.17311.29
10–12 a.m.361.57178.46125.50293.77
12 a.m.–2 p.m.230.54112.08129.17192.18
2–4 p.m.280.05171.5472.33232.61
4–6 p.m.278.14155.0065.00226.71
6–8 p.m.208.54121.7765.17173.04
8–10 p.m.157.35101.8540.33131.93
10–12 p.m.42.6536.0822.5038.96
As shown in Table 3, the highest number of monthly set-outs (No.s.o. month−1·year −1) can be observed in the summer season namely, in the months of July and August, as the effect of the expected seasonal tourism impact. On the whole, March and April were also characterized by a consistent number of monthly set-outs, followed by the autumnal and wintry months.
Otherwise, in May, June and September, extremely low values were registered. This anomaly could be explained by the occurrence of transmission/reception errors between the GPRS system of the caps and the central computer in the three above-mentioned months. In fact, the same trend appears for each of the three singular areas as for the entire case-study area. Another value significantly lower than the others arises also for the month of February 2012, although it is attributable to the historical Early 2012 European cold wave [23] that paralyzed all the municipality of San Costanzo as well as much of the European Continent.
The quantification of the number of set-outs per week day (No.s.o. week day −1·year −1) highlights a quite constant daily aptitude (Table 3) by the citizens to bring the URW to the proper container. Interestingly enough, the 14% or 15% of the No.s.o. week day −1·year −1 (based on the total of set-outs made in a week) takes place from Mondays to Fridays either in the whole case-study area or in the three areas, except for the Friday of the Area “3” when 17% of set-outs were achieved (see Table S1 in the Supplementary file for the percentage values). Generally, the Saturdays seem to be characterized by a slightly higher amount of set-outs (16%), whereas on Sundays the percentage falls down to 13% in the entire municipality as in the Areas “1” and “2” and to 11% in Area “3” (see Table S1 in the Supplementary file for the percentage values).
As far as the time frames are concerned (Table 3), the biggest part of the set-outs are distributed over the 8 a.m.–4 p.m. temporal range that is during the morning and the first hours of the afternoon. The No.s.o. time frame −1·year −1 gradually decreases after 4 p.m. until becoming an almost void percentage towards midnight (on the base of the whole of set-outs in a day). It is necessary to wait until six o’clock in the morning to observe again a significant value of set-outs (6%–8% of the total of set-outs made in a day) (see Table S1 in Supplementary file for the percentage values).
A complete overview on the citizens’ frequency in setting out the URW was derived by observing the following procedure: (1) the number of set-outs of each ID user was counted by means of the “pivot table” functionality; (2) the users with the same number of set-outs were aggregated and summed up; (3) a further aggregation of the number of users according to four different levels of frequency (1–5, 5–10, 10–20, >20 set-outs in a calendar month) was carried out and the users resulting for each level of frequency were counted. The three passages were repeated for each singular month.
By assuming that the more the number of set-outs of URW by a user, the less is his propensity to recycle, an indirect estimation of the recycling aptitude by the citizens can be gleaned by the above-described procedure. In fact, the users could be classified as high-, medium-, low- and extra low-recyclers depending on the number of their set-outs included in the four ranges 1–5, 5–10, 10–20, >20 set-outs, respectively.
The frequency rates (Table 4), were obtained by using the sums of the average annual values of users per each frequency class as base amounts. That means the users who never placed out the URW at the cap-devices were not considered, the related data being unavailable. Furthermore, it appears unlikely that a “non-user” of the cap-device might be an excellent recycler. As average annual values, in turn, the monthly values resulting from the three-steps procedure were assumed, except for the months of May, June and September because of the noticed anomalies.
Table 4. Breakdown of frequency classes in the setting out of the Unsorted Residual Waste (URW).
No. of Set-OutsArea “1”Area “2”Area “3”Total Study Area
% users recorded% users recorded% users recorded% users recorded
1–554.2464.1965.1756.52
5–1024.8121.1320.2323.94
10–2015.7110.7211.7714.64
>205.253.962.824.91
As shown in Table 4, more than fifty percent of the users set out the URW five times per month at most. The number of users effectively setting out in Area “1” accounts for 78% of the total number of users recorded for the whole municipality. Thus, it is not surprising that all the participation frequencies of the Area “1” appear quite similar to those resulting for the total study area.
A remarkable closeness among the frequency values, class by class, is appreciable also between Area “2” and the Area “3”. Namely, the percentage of “high-recyclers” was as much as 64.19% and 65.17%, respectively, for the reference year.
Finally, it can be concluded from the citizens’ behaviour analyses that a higher percentage of San Costanzo’s users behaved as “high-recyclers” during 2012 and that seems to be perfectly congruent with the brilliant SSL results achieved for the same year.
With regard to the original participation rate dealing with the setting out of the URW over a month, it turned out to be 61.67% for 2012. As for the frequency rates, the monthly average number of users who actively placed out the URW at least once in a month during 2012 was calculated by excluding the resulting values of users’ numbers for the months of May, June and September because of the noticed anomalies. This value can probably be considered slightly underestimated given that also the non-residents, the second-home owners, or the holiday-home owners were computed in the base amount value of the participation rate. Given the original version here proposed of this particular index, there are no comparison terms from literature at present.

4. Conclusions

The detailed assessment performed in this study showed how the original proximity waste collection system can play a decisive role in the increase of the SC in a given local scale and, simultaneously, on the decrease of the URW. In fact, its introduction in the municipality of San Costanzo at the end of May 2011 gave rise to immediate effects on the source-sorting activity. It is enough to notice the broad difference of the SSL value in June 2011 with the previous months: It resulted higher at about 50%. The environmental performance of the evaluated waste collection scheme is highlighted by comparing the yearly average value of SSL of the year 2010, when the road collection scheme was still active, and that of the year 2012 which was fully characterized by the presence of the proximity waste collection system. Particularly, at the end of 2010, the case-study municipality achieved an SSL of 16.2%, whilst the SSL value registered in 2012 was 78.7%, (abundantly above the Italian legislative target of 65% foreseen for the same year). This last result was achieved not only by sorting greater amounts of paper, plastic and glass but also by implementing measures to encourage the separate collection of the biowaste, as aimed at by the WFD. Another clear strengthening element was represented by the cap-shaped device for the limited volumetric inserting of the URW. Although the waste fee in San Costanzo was not volume-based, drastic reductions of the WCRu and of the WGR characterized the year 2012: In fact, their values are lower by about 82 percentage points and 30 percentage points, respectively, as compared to the year 2010. The proximity waste collection system revealed highly performance also from the point of view of the levels of the interception: The IR values achieved at the end of October 2012 resulted above 83% for most of the waste fractions.
Unfortunately, it cannot be excluded that the improvements achieved are partially due to some wrong behaviors by the citizens. With a volume-based control, people might leave the residual waste in inappropriate places or in the containers of neighboring municipalities. Similar phenomena should not surprise since they have been described also for weight-based billing in other countries [6].
Interestingly enough, this paper shows how the digitalization of all the information concerning a waste flow can offer the chance of an original methodological approach to the evaluation of the citizen’s aptitudes to recycle, i.e., of the social sustainability of a waste collection model, that is a worldwide resonant issue. About 97,000 set-outs and the related digital data registered and archived—By means of GPRS—from the cap-shaped devices (all referring to 2012) were examined and processed in this work with the purpose to investigate: (1) the monthly trends of set-outs; (2) which day of the week is favourite for citizens to sort refuse; (3) which time frame within the day is the most suitable for citizens to bring the waste out. Particularly, the possibility to count exactly the number of set-outs by each user led to reliable estimations of the frequency rates and of the participation rates in placing out the URW on a monthly basis, suggesting that a similar assessment procedure could be extended to all waste categories. This last aspect appears quite relevant since that, up to now, on the base of the scientific literature on the topic, the preferred form of observing these behavioural patterns has always been by directly surveying the households or the users [22] or by submitting questionnaires, via postal or face-to-face, i.e., by questionable methods given that people’s claims do not always reflect their actions [24,25]. Referring to the currently reported case study, the estimations performed within the frequency analysis of the San Costanzo population, have shown that about the 57% of users of the total area usually set out the URW five times per month at most beginning from the implementation of the proximity waste collection system, by highlighting indirectly their marked tendency to recycle. In fact, it seems reasonable to consider a user as a “high-recycler” when able to reduce the production of URW and the related set-outs.
Conclusively, the introduction of a control mechanism and the digitalization of all the information concerning a waste flow within a waste collection system could address the following advantages: (1) an inhibitory effect on the waste producer who acquires greater sensibility on his refuse; (2) a pathway to measure reliably the participation rate and the frequency rates of the citizens in placing each kind of waste out; (3) the possibility of a better planning of the route of the collection trucks and of a wiser scheduling of its rounds through the analyses of set-outs’ trends. All these aspects could synergistically contribute to improve the environmental and social sustainability of the waste collection process of an IWMS.

Acknowledgments

The authors wish to thank the Municipality of San Costanzo for all data of the set-outs provided; the authors are also grateful to Giuliano Tombari (at the “ASET” public multi-utility group) for providing the separate collection data and the compositional analyses.

Author Contributions

Fabio Tatàno and Manuela Carchesio conceived and organized the study. Margherita Goffi and Michele Radi contributed to the gathering of all the necessary data. Manuela Carchesio analyzed the data and wrote the paper, under the supervision of Fabio Tatàno. All authors contributed to the common critical analysis of the findings, read and approved the final manuscript.

Conflicts of Interest

The authors declare no conflict of interest.

References

  1. McDougall, F.; White, P.R.; Franke, M.; Hindle, P. Waste collection. In Integrated Solid Waste Management: A Lifecycle Inventory, 2nd ed.; Blackwell Science: Oxford, UK, 2001; pp. 193–226. [Google Scholar]
  2. Torretta, V.; Ionescu, G.; Raboni, M.; Merler, G. The mass and energy balance of an integrated solution for municipal solid waste treatment. WIT Trans. Ecol. Environ. 2014, 180, 151–161. [Google Scholar]
  3. Rada, E.C.; Ragazzi, M.; Ionescu, G.; Merler, G.; Moedinger, F.; Raboni, M. Municipal Solid Waste treatment by integrated solutions: Energy and environmental balances. Energy Procedia 2014, 50, 1037–1044. [Google Scholar] [CrossRef] [Green Version]
  4. The European Parliament; The Council of the European Union. Directive 2008/98/EC of the European Parliament and of the Council on waste and repealing certain Directives (WFD). Off. J. Eur. Union 2008, 34, 99–126. [Google Scholar]
  5. Ploechl, C.; Dobson, G.; Buell, U. A Class of its Own—Standardization of Solid Waste Analyses in the EU. In Waste Management World; International Solid Waste Association: Wien, Austria, 2003; pp. 32–40. [Google Scholar]
  6. Dahlén, L.; Vukicevic, S.; Meijer, J.; Lagerkvist, A. Comparison of different collection systems for sorted household waste in Sweden. Waste Manag. 2007, 27, 1298–1305. [Google Scholar] [CrossRef] [PubMed]
  7. Mattsson, C. Waste management and producer responsibility in Sweden. Licentiate thesis, Chalmers University of Technology, Gothenburg, Sweden, 2003. [Google Scholar]
  8. Gallardo, A.; Bovea, M.; Colomer, F.; Prades, M.; Carlos, M. Comparison of different collection systems for sorted household waste in Spain. Waste Manag. 2010, 30, 2430–2439. [Google Scholar] [CrossRef] [PubMed]
  9. Gallardo, A.; Bovea, M.; Colomer, F.; Prades, M. Analysis of collection systems for sorted household waste in Spain. Waste Manag. 2012, 32, 1623–1633. [Google Scholar] [CrossRef] [PubMed]
  10. Consonni, S.; Viganò, F. Material and energy recovery in integrated waste management systems: The potential for energy recovery. Waste Manag. 2011, 31, 2074–2084. [Google Scholar] [CrossRef] [PubMed]
  11. Giugliano, M.; Cernuschi, S.; Grosso, M.; Rigamonti, L. Material and energy recovery in integrated waste management systems. An evaluation based on life cycle assessment. Waste Manag. 2011, 31, 2092–2101. [Google Scholar] [CrossRef] [PubMed]
  12. Massarutto, A.; de Carli, A.; Graffi, M. Material and energy recovery in integrated waste management systems: A life-cycle costing approach. Waste Manag. 2011, 31, 2102–2111. [Google Scholar]
  13. Environmental Framework Regulation, Annex of the Italian Official Gazette No. 88; Legislative Decree No. 152; Official Gazette of the Italian Republic: Rome, Italy, 2006. (In Italian)
  14. Sanchenko, Y. Italian Best Practices in Waste Management. Transnational Workshop on Zero Waste Application. Available online: http://www.ecotech.cat/grecia/ (accessed on 7 April 2011).
  15. Province of Turin. Report on the Status of the Waste Management System. Available online: http://www.provincia.torino.gov.it/ambiente/file-storage/download/rifiuti/pdf/rapporto_10/Cap_2.pdf (accessed on 17 December 2013).
  16. Ranieri, E.; Rada, E.C.; Ragazzi, M.; Masi, S.; Montanaro, C. Critical analysis of the integration of residual municipal solid waste incineration and selective collection in two Italian tourist areas. Waste Manag. 2014, 32, 551–555. [Google Scholar] [CrossRef] [PubMed]
  17. Consonni, S.; Giugliano, M.; Massarutto, A.; Ragazzi, M.; Saccani, C. Material and energy recovery in integrated waste management systems: Project overview and main results. Waste Manag. 2011, 31, 2057–2065. [Google Scholar] [CrossRef] [PubMed]
  18. Bianchini, A.; Pellegrini, M.; Saccani, C. Material and energy recovery in integrated waste management systems: An Italian case study on the quality of MSW data. Waste Manag. 2011, 31, 2066–2073. [Google Scholar] [CrossRef] [PubMed]
  19. Nilsson, P.; Christensen, T.H. Waste collection: Systems and Organization. In Solid Waste Technology & Management; Christensen, T.H., Ed.; John Wiley & Sons: Chichester, UK, 2010; Volume 1, pp. 277–295. [Google Scholar]
  20. ATIA-ISWA Italia—Regione Toscana. Sistemi di Calcolo Delle Raccolte Differenziate. Available online: http://www.regione.toscana.it/-/sistemi-di-calcolo-delle-raccolte-differenziate (accessed on 7 August 2013).
  21. Dahlén, L. Household Waste Collection, Factors and Variations. Ph.D. Thesis, Department of Civil, Mining and Environmental Engineering, Division of Waste Science and Technology, University of Technology, Luleå, Sweden, 2008. [Google Scholar]
  22. Woodard, R.; Harder, M.K.; Bench, M. Participation in curbside recycling schemes and its variation with material types. Waste Manag. 2006, 26, 914–919. [Google Scholar] [CrossRef] [PubMed]
  23. World Meteorological Organization (WMO). Cold Spell in Europe and Asia in Late Winter 2011/2012, Issued by WMO Regional Climate Centres (20p.): RA II (Asia): Tokyo Climate Centre, Japan Meteorological Agency (JMA); RA VI (Europe): Pilot Regional Climate Centre, Node on Climate Monitoring (RCCCM), Lead Centre Deutscher Wetterdienst (DWD), Germany. Available online: https://www.wmo.int/pages/mediacentre/news/documents/dwd_2012_report.pdf (accessed on 29 January 2015).
  24. Tucker, P.; Speirs, D. Count me as doing my bit: An appraisal of the accuracy of waste attitude/behaviour surveys. CIWM Sci. Tech. Rev. 2003, 4, 9–18. [Google Scholar]
  25. Woolam, T.C.; Emery, A.; Griffiths, A.J.; Williams, K.P. A comparison of intended and claimed recycling behaviour to actual in a new kerbside scheme. CIWM Sci. Tech. Rev. 2003, 4, 2–9. [Google Scholar]

