
Modeling Impact of Climate Change on Water Resources and Agriculture Demand in the Volta Basin and other Basin Systems in Ghana

Abstract
:1. Introduction
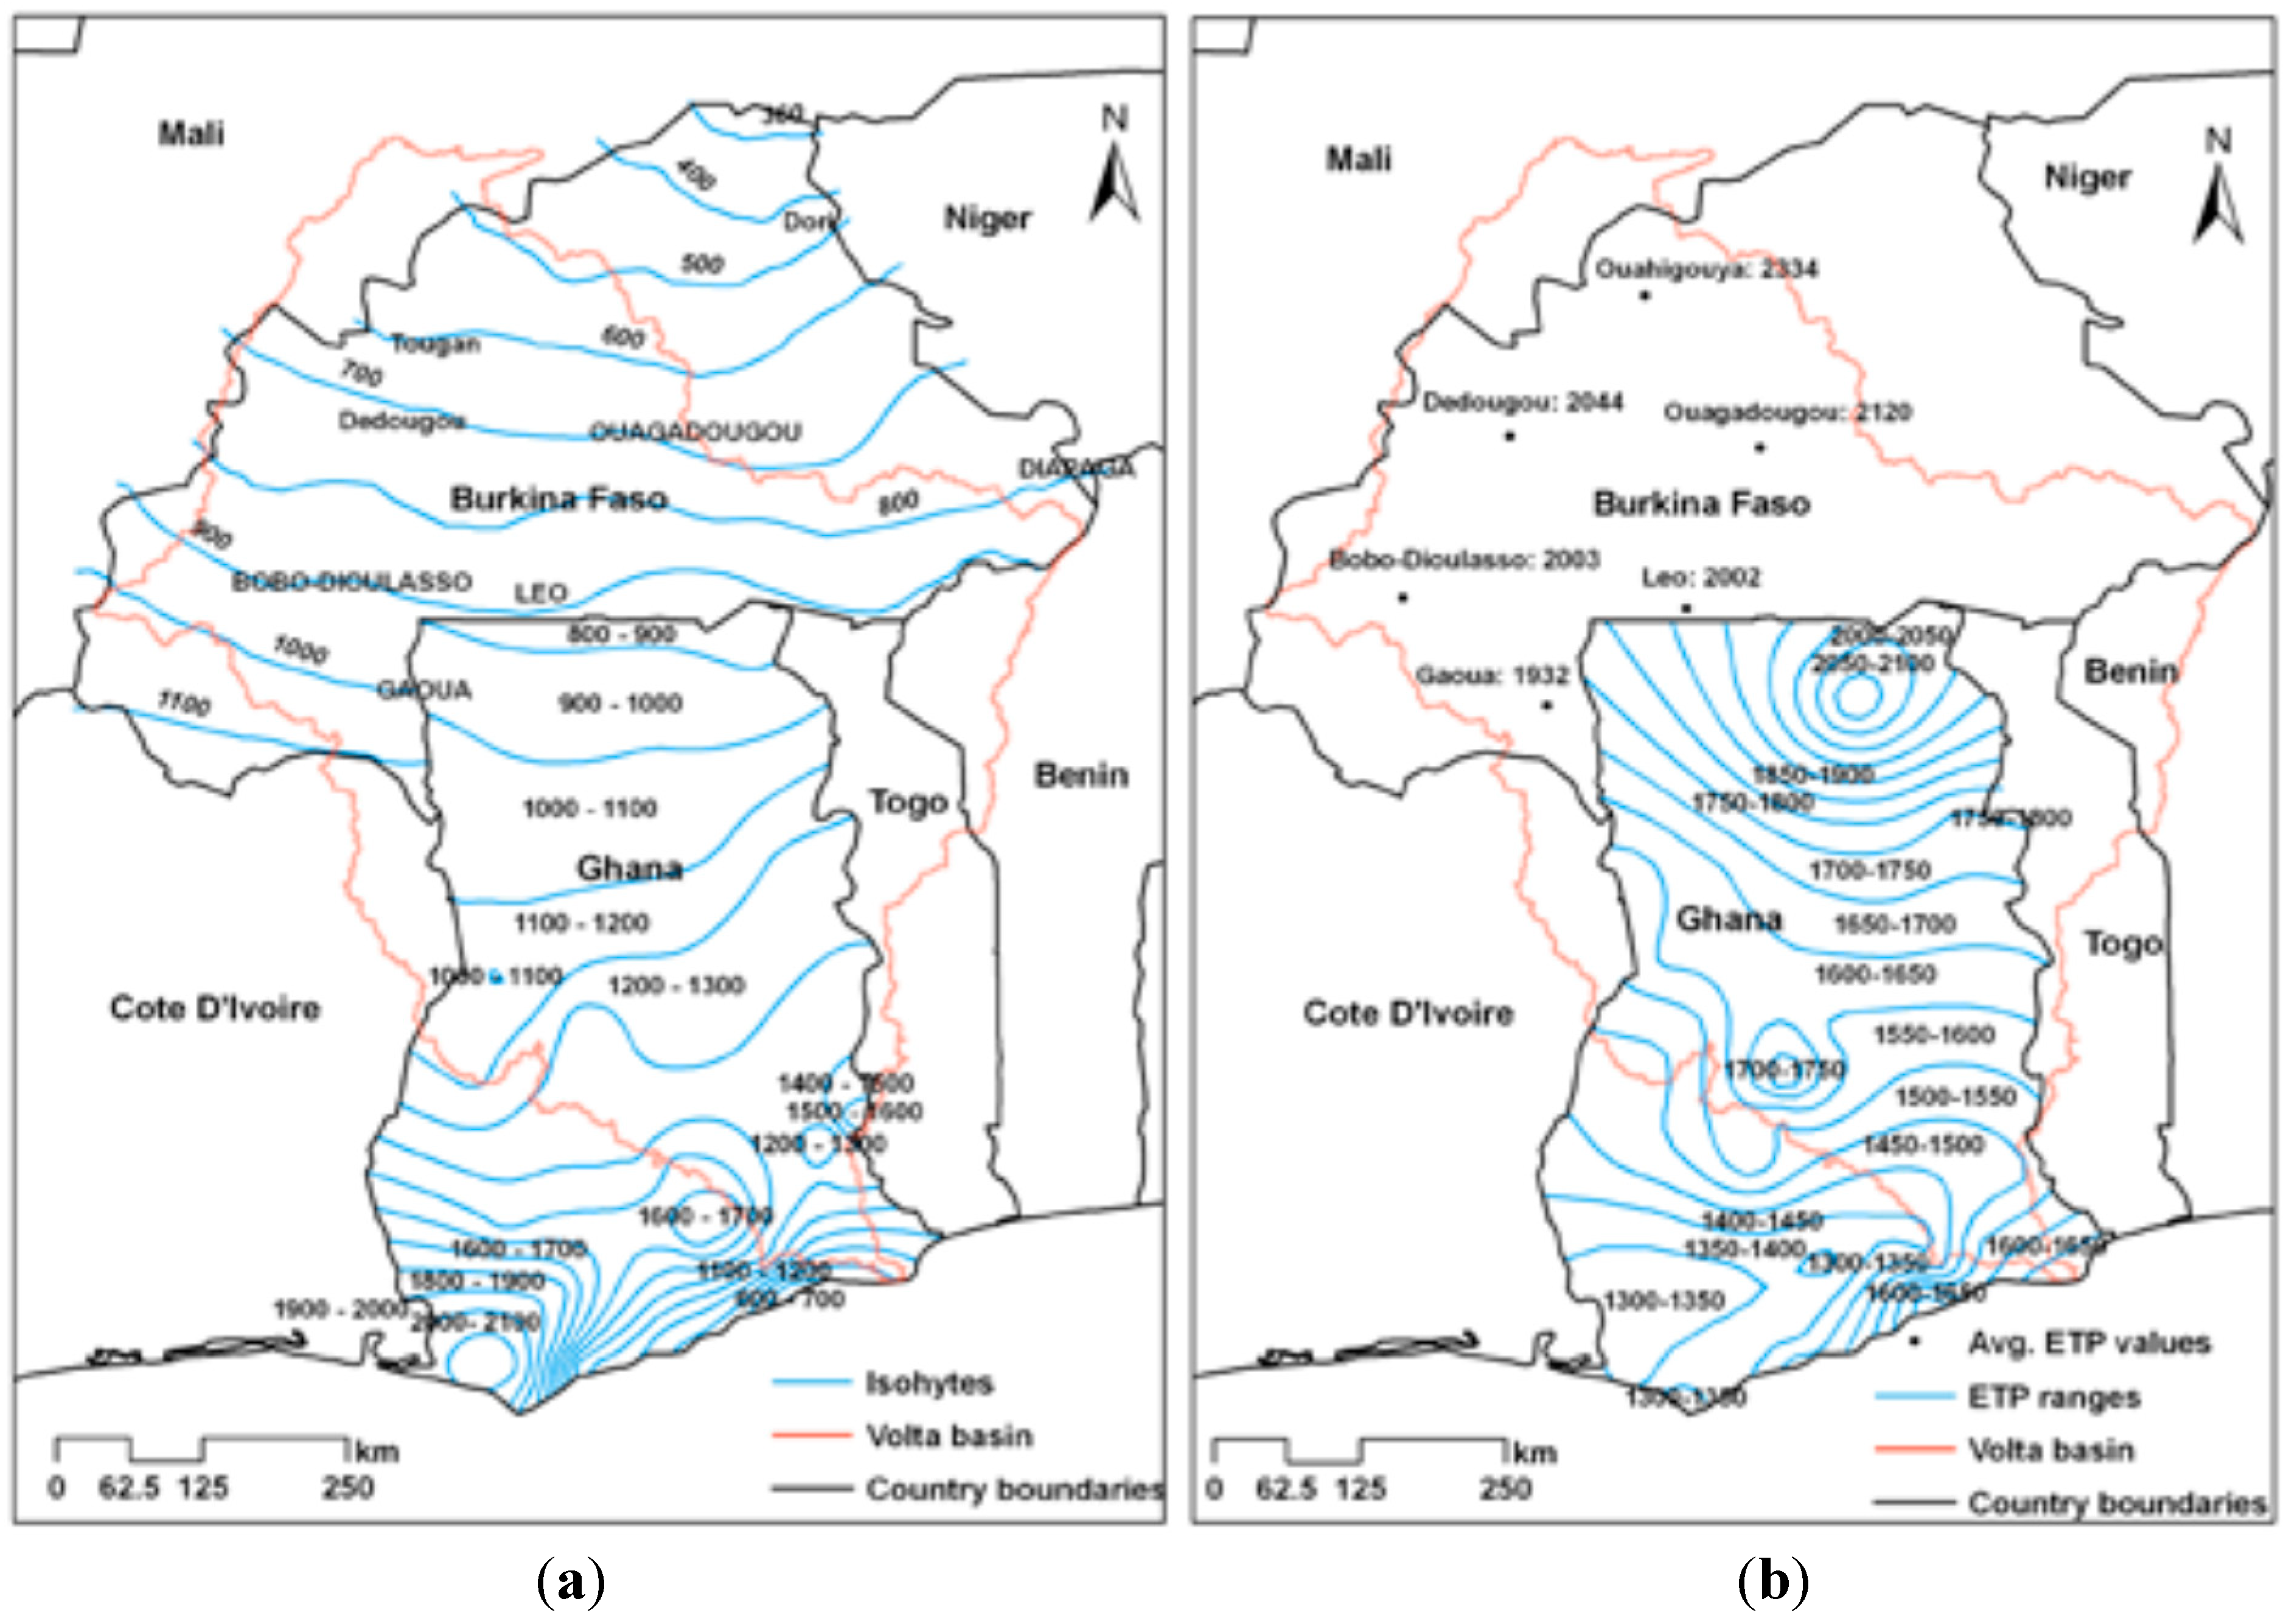
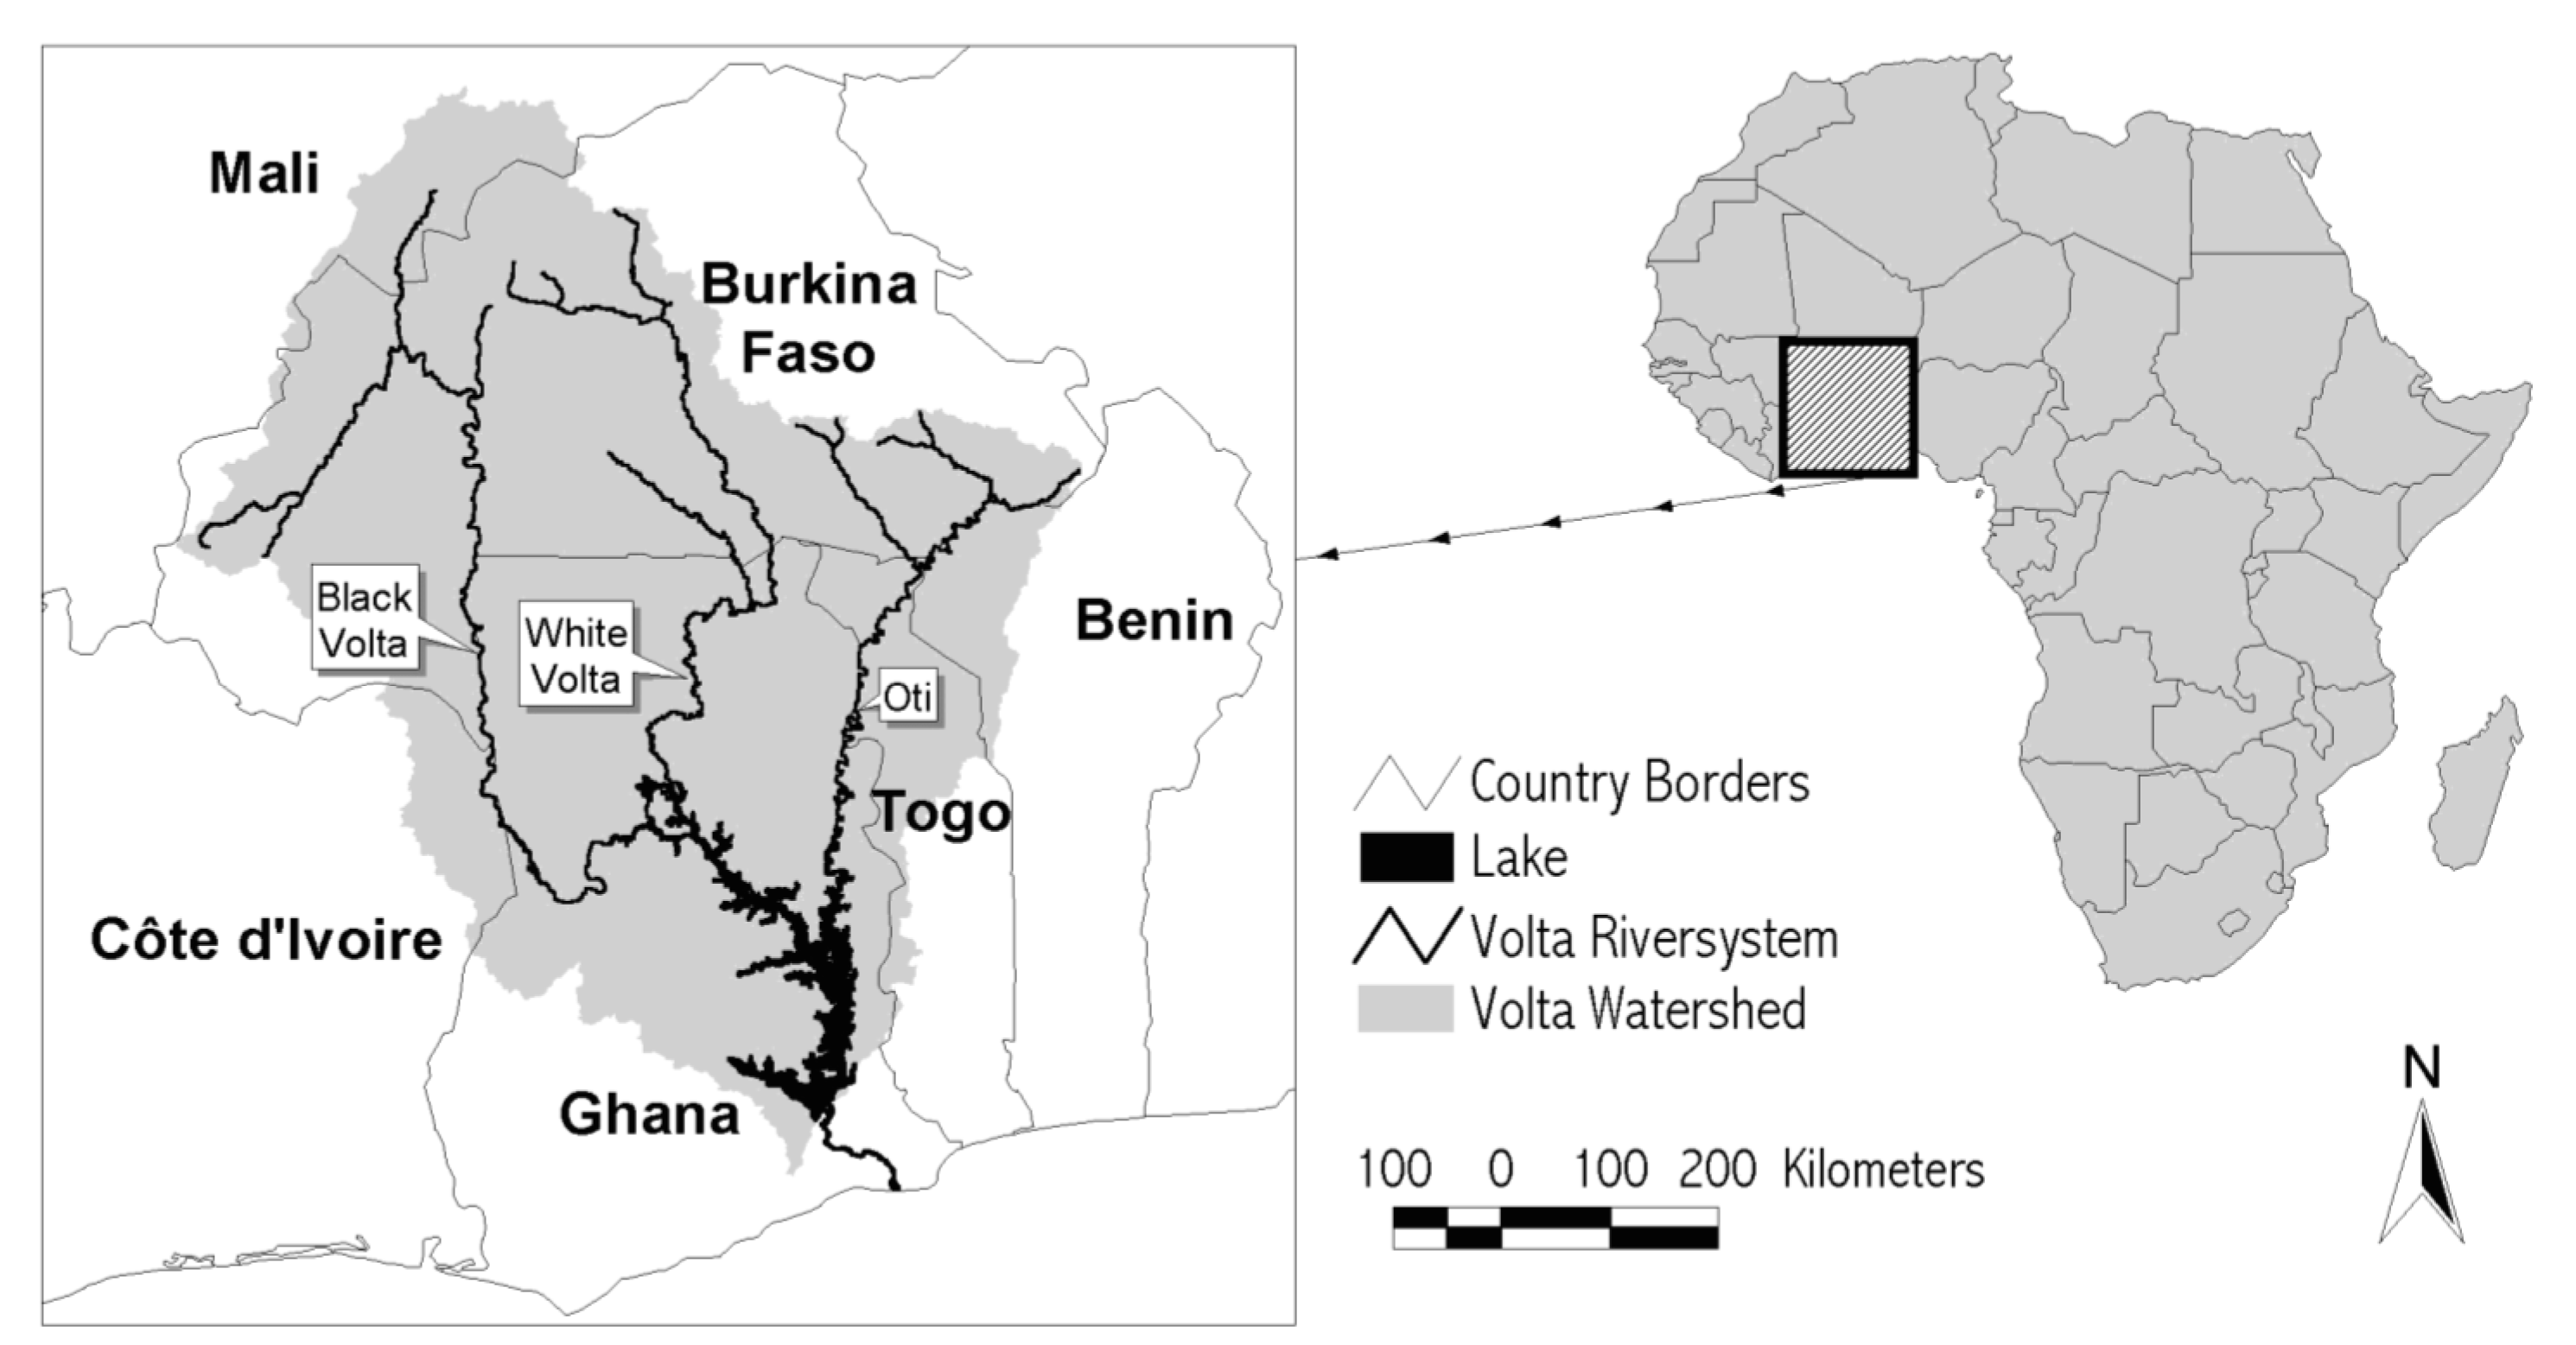
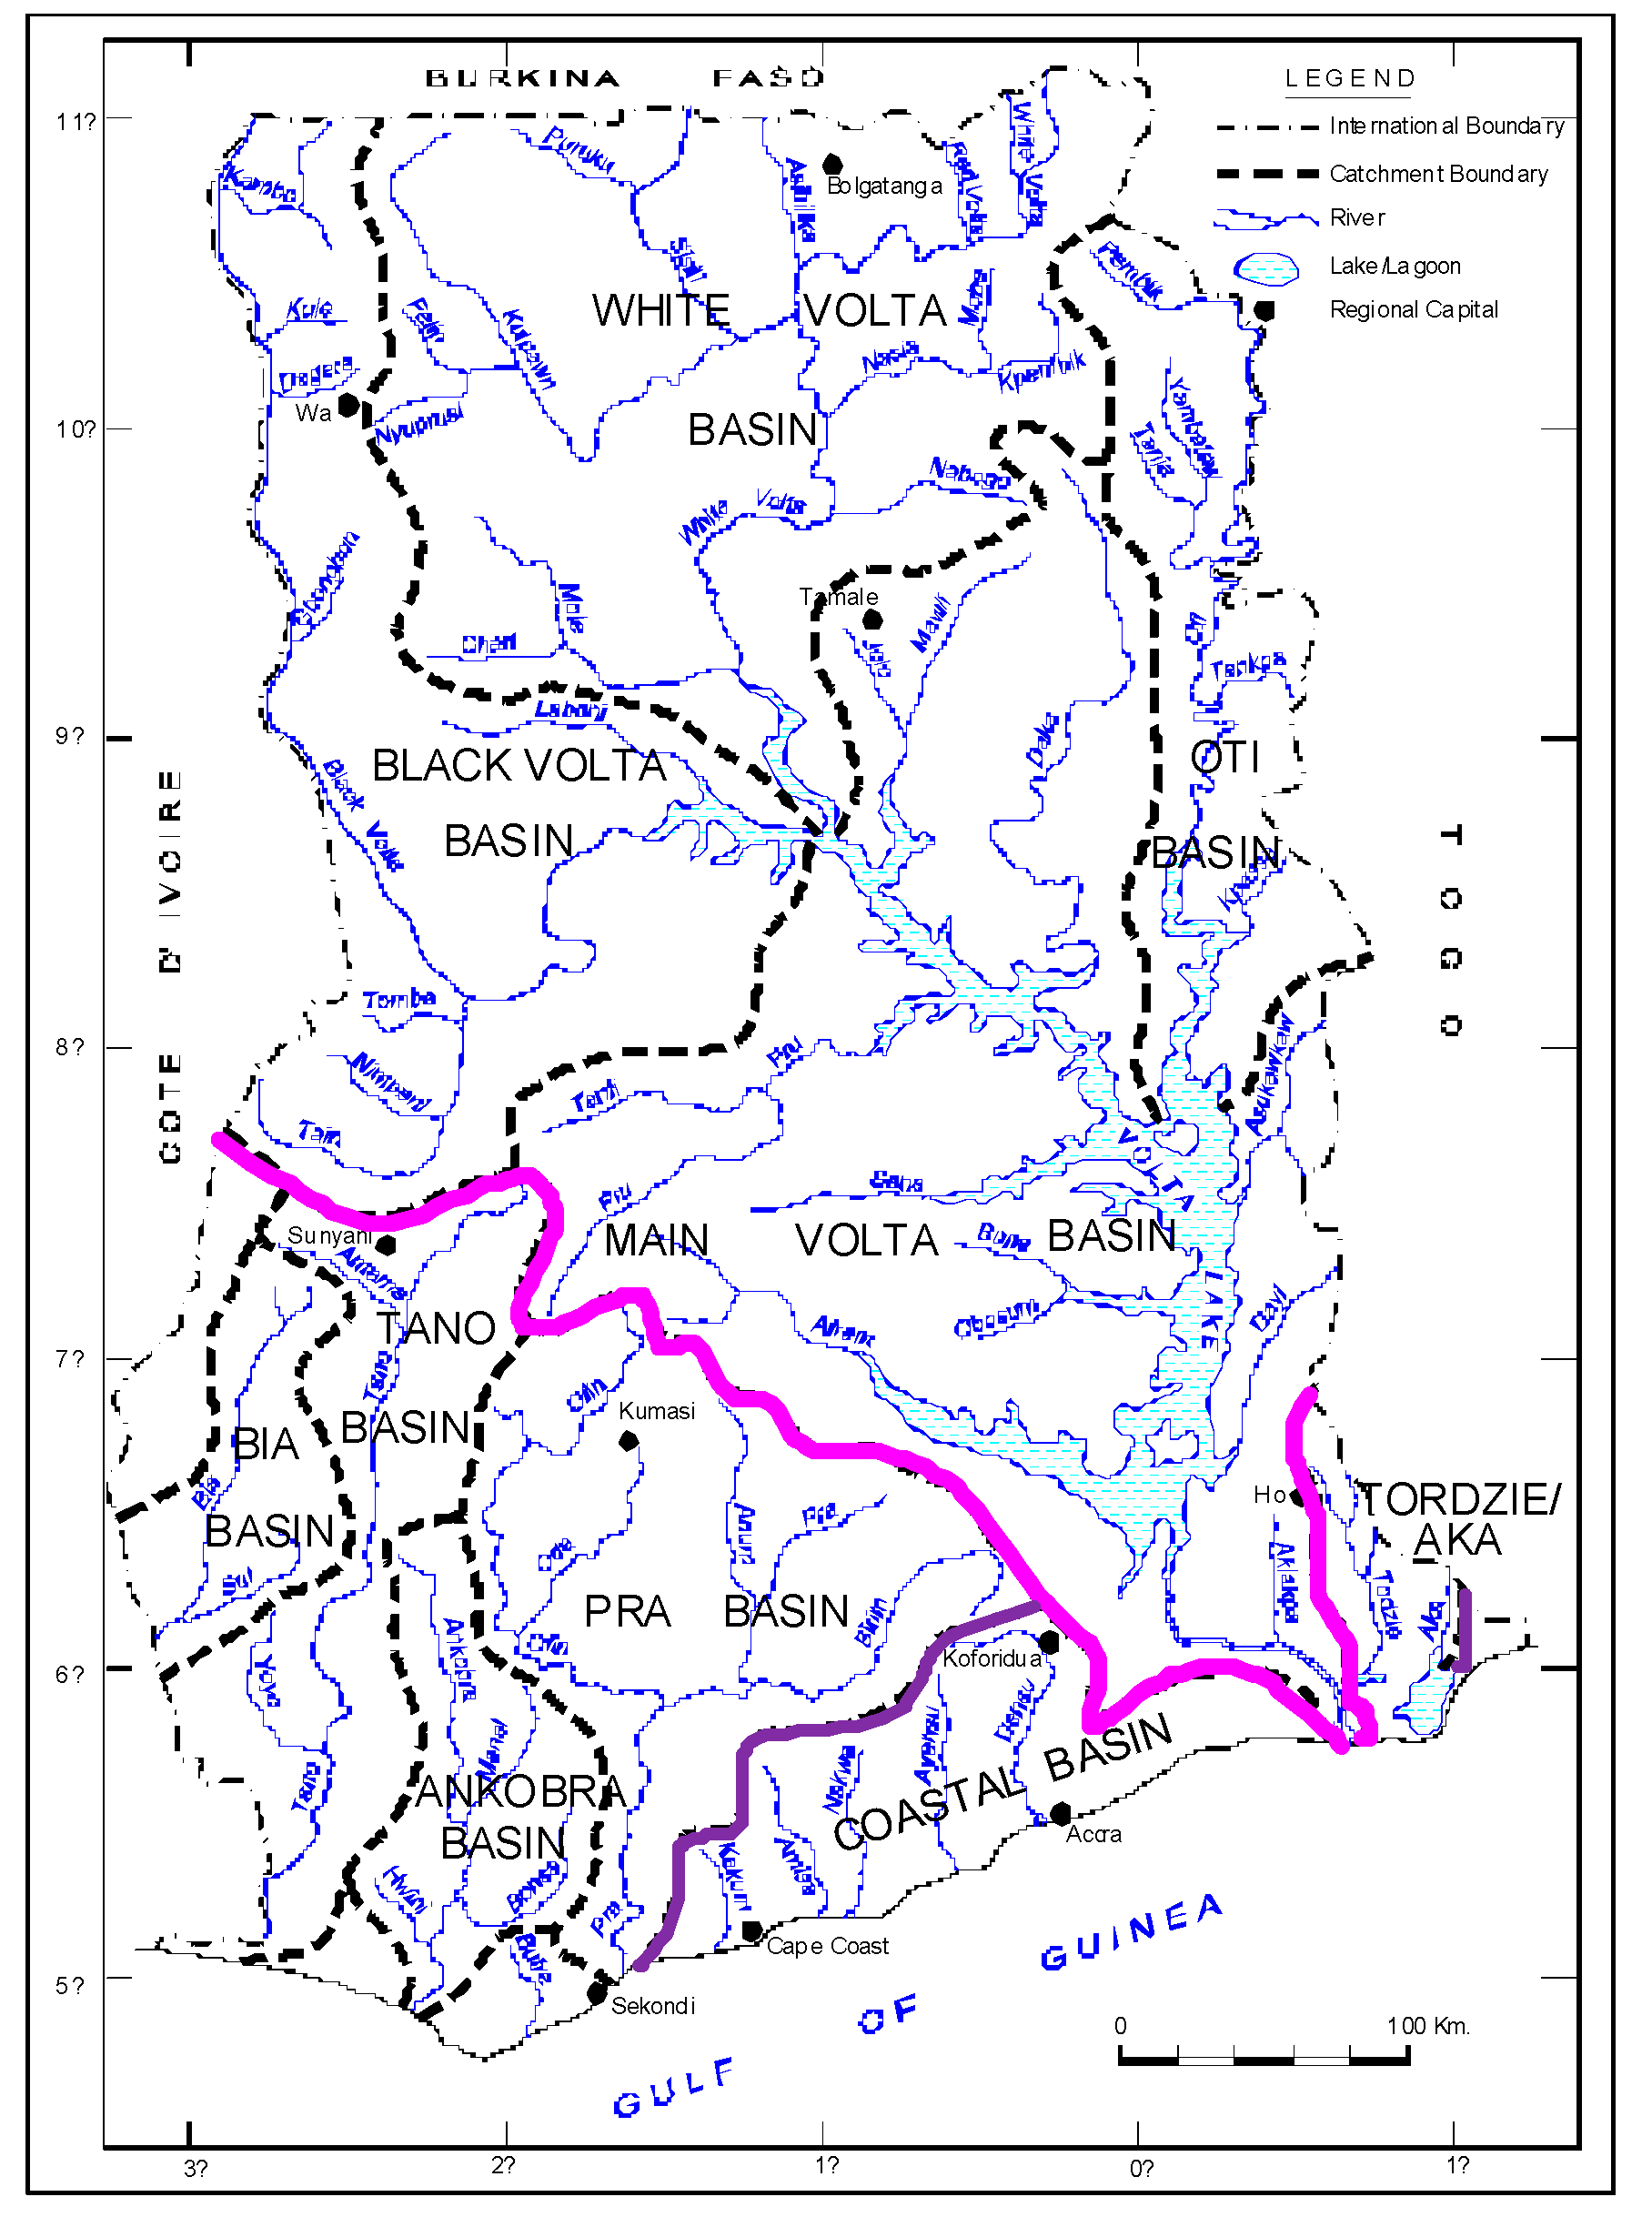
2. Study Area


| Country | Area of basin (km2) | % of basin area | % of country area |
|---|---|---|---|
| Benin | 13,590 | 3.41 | 12.1 |
| Burkina Faso | 171,105 | 42.95 | 62.4 |
| Côte d’Ivoire | 9890 | 2.48 | 3.1 |
| Ghana | 165,830 | 41.63 | 70.1 |
| Mali | 12,430 | 3.12 | 1.0 |
| Togo | 25,545 | 6.41 | 45.0 |
| Total | 398,390 | 100.00 |
| Main sub-basin | Observed mean annual flow (m3/s) |
|---|---|
| Black Volta | 200 |
| White Volta | 220 |
| Oti | 280 |
| Main Volta | 500 |
| LowerVolta (turbine flow) | 1,200 |
| Kakum | 5.8 |
| Amisa | 12.8 |
| Nakwa | 8.3 |
| Densu | 13.4 |
| Ayensu | 9.3 |
| Bia | 54.4 |
| Tano | 122.7 |
| Ankobra | 70.5 |
| Pra | 190 |

| Rank | Commodity | Production (Int’l $1000) | Production (MT) |
|---|---|---|---|
| 1 | Yams | 1,605,618 | 6,295,453 |
| 2 | Cassava | 1,487,644 | 14,240,867 |
| 3 | Plantains | 747,344 | 3,619,834 |
| 4 | Cocoa beans | 726,962 | 700,020 |
| 5 | Taro | 275,638 | 1,299,645 |
| 6 | Groundnuts | 197,370 | 465,103 |
| 7 | Rice, paddy | 126,387 | 463,975 |
| 8 | Maize | 126,063 | 1,683,984 |
| 9 | Tomatoes | 118,445 | 320,500 |
| 10 | Oranges | 115,955 | 600,000 |
3. Methodology
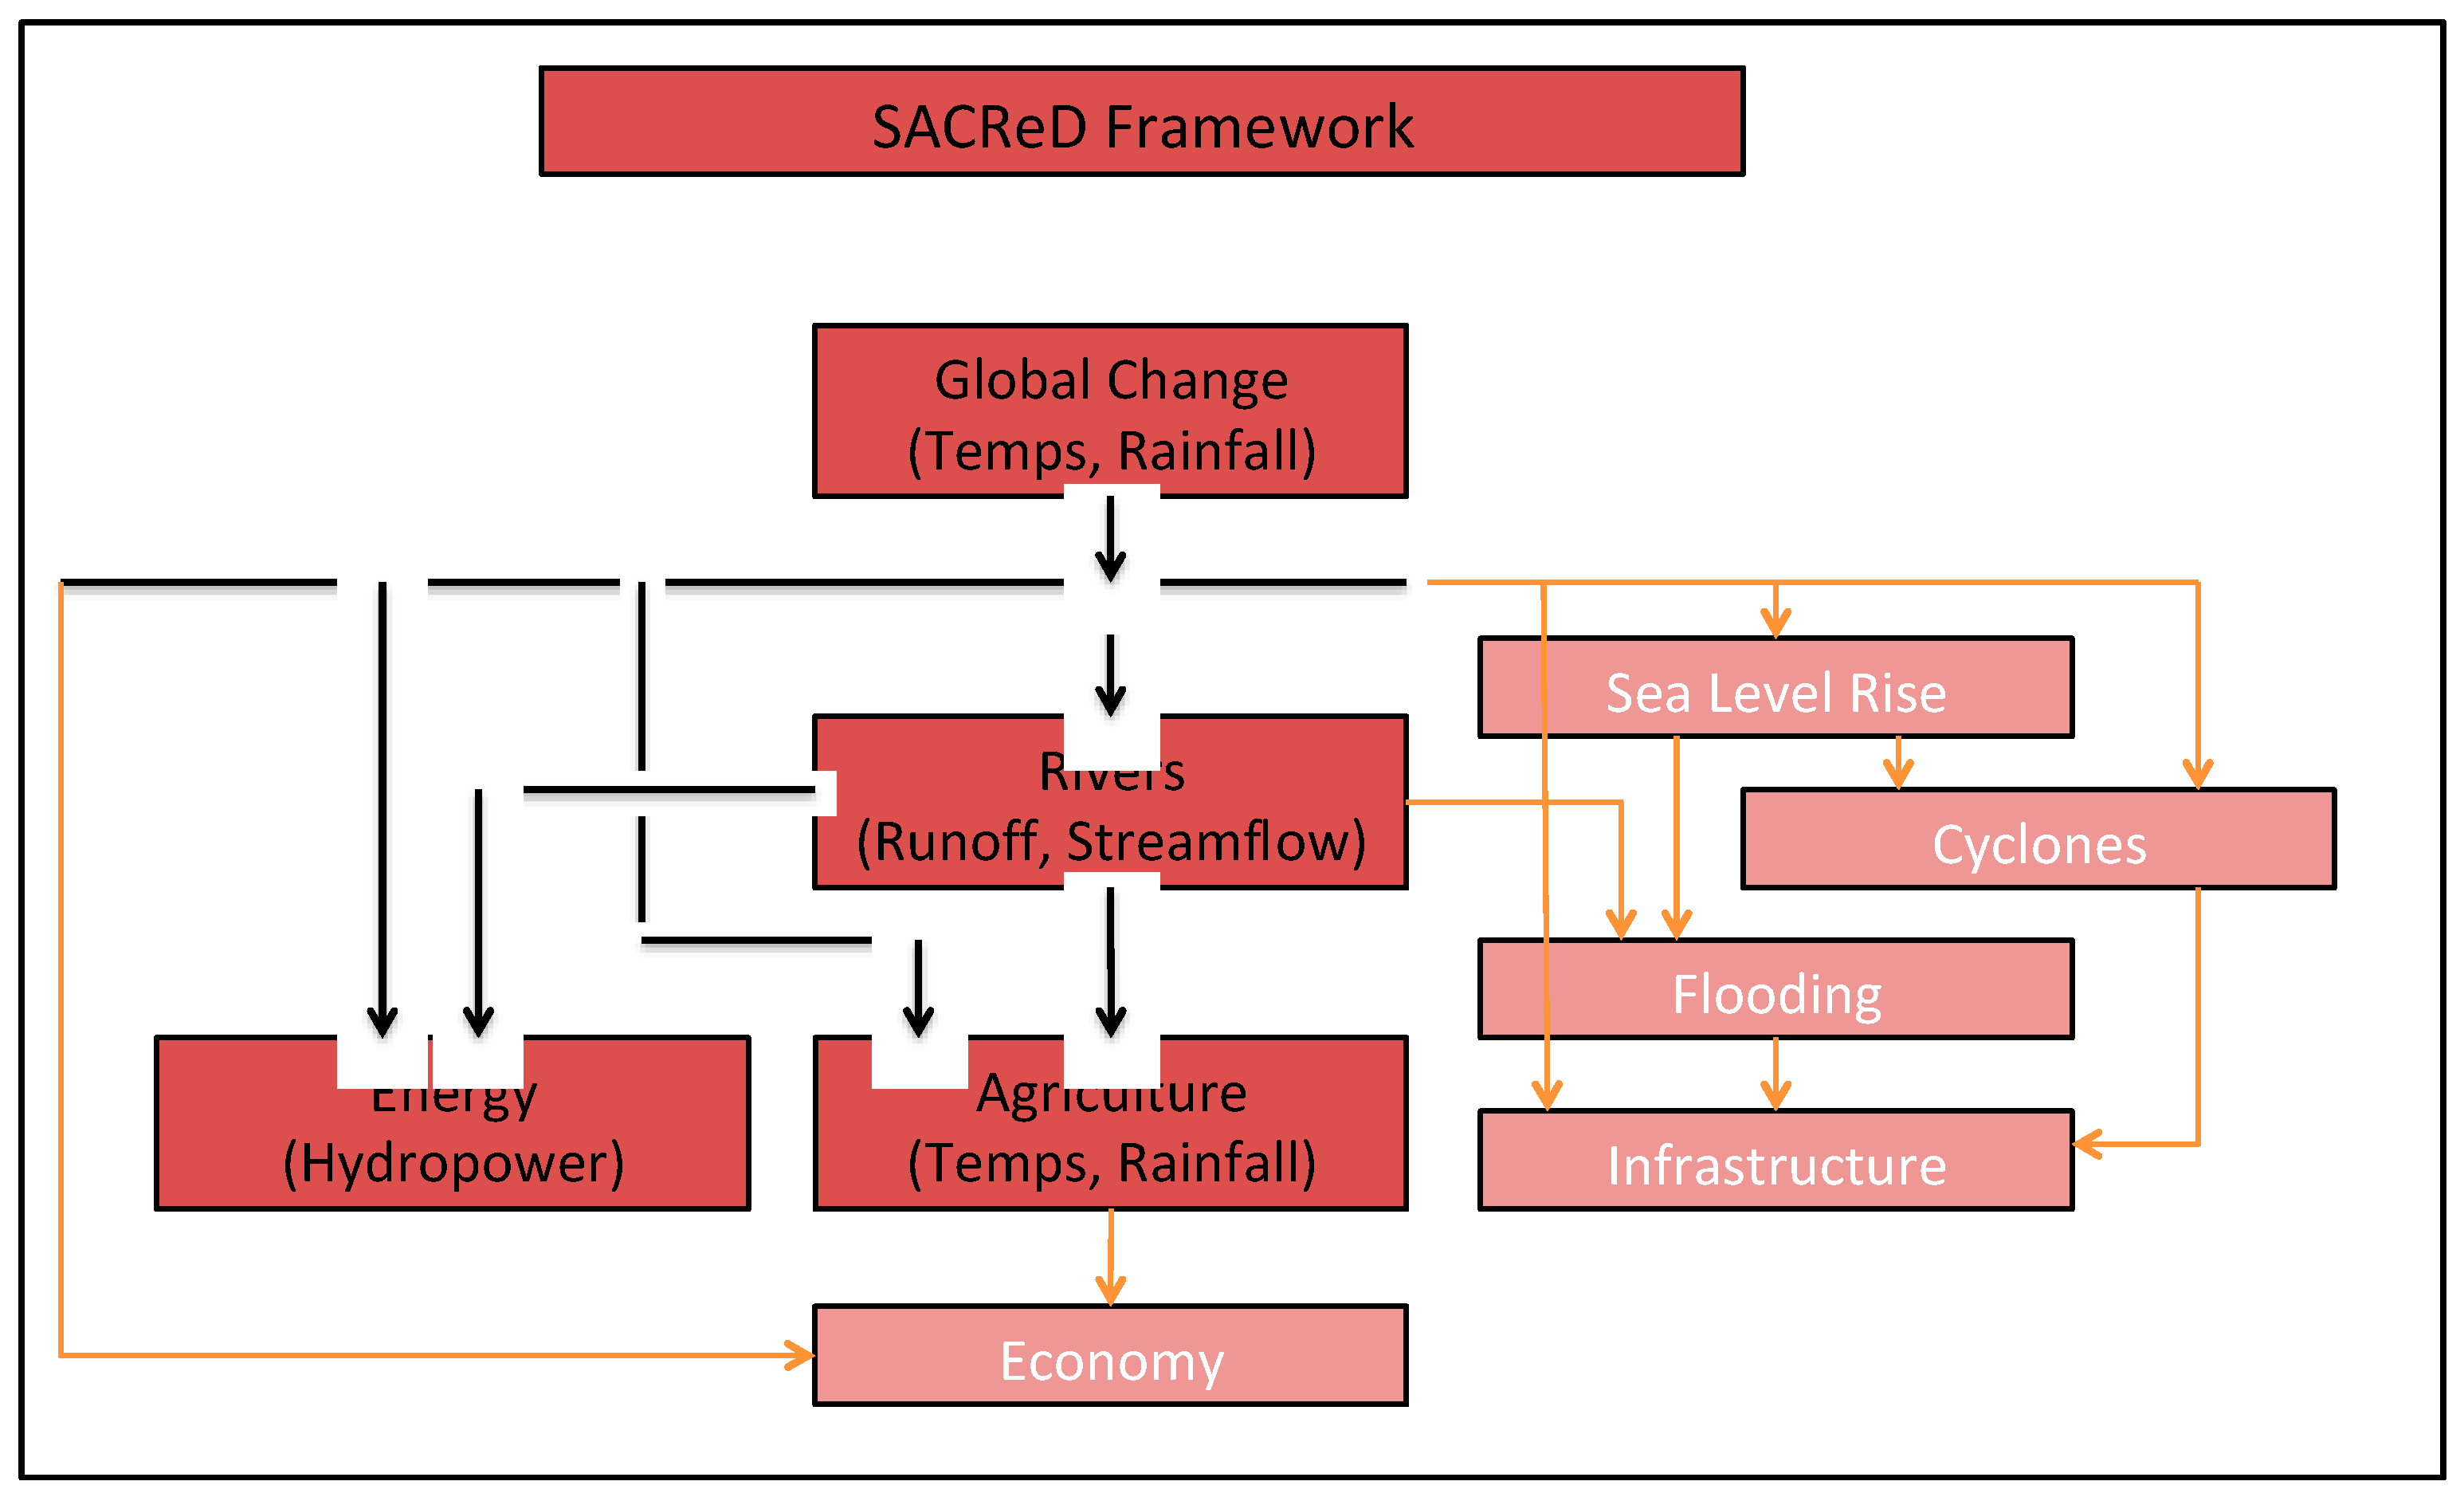
3.1. SACReD
3.2. Catchment Delineations

3.3. Climate Change Scenarios
3.4. Runoff (CliRun)
3.5. Irrigation Demand (AquaCrop)
3.6. WEAP
3.7. Municipal demand
| Year | Litres per capita per day (lpcd)demand |
|---|---|
| 2010 | 60 |
| 2015 | 70 |
| 2020 | 80 |
| 2025 | 90 |
| 2030 | 100 |
| 2035 | 105 |
| 2040 | 110 |
| 2045 | 115 |
| 2050 | 120 |
3.8. Hydropower
4. Results and Discussion
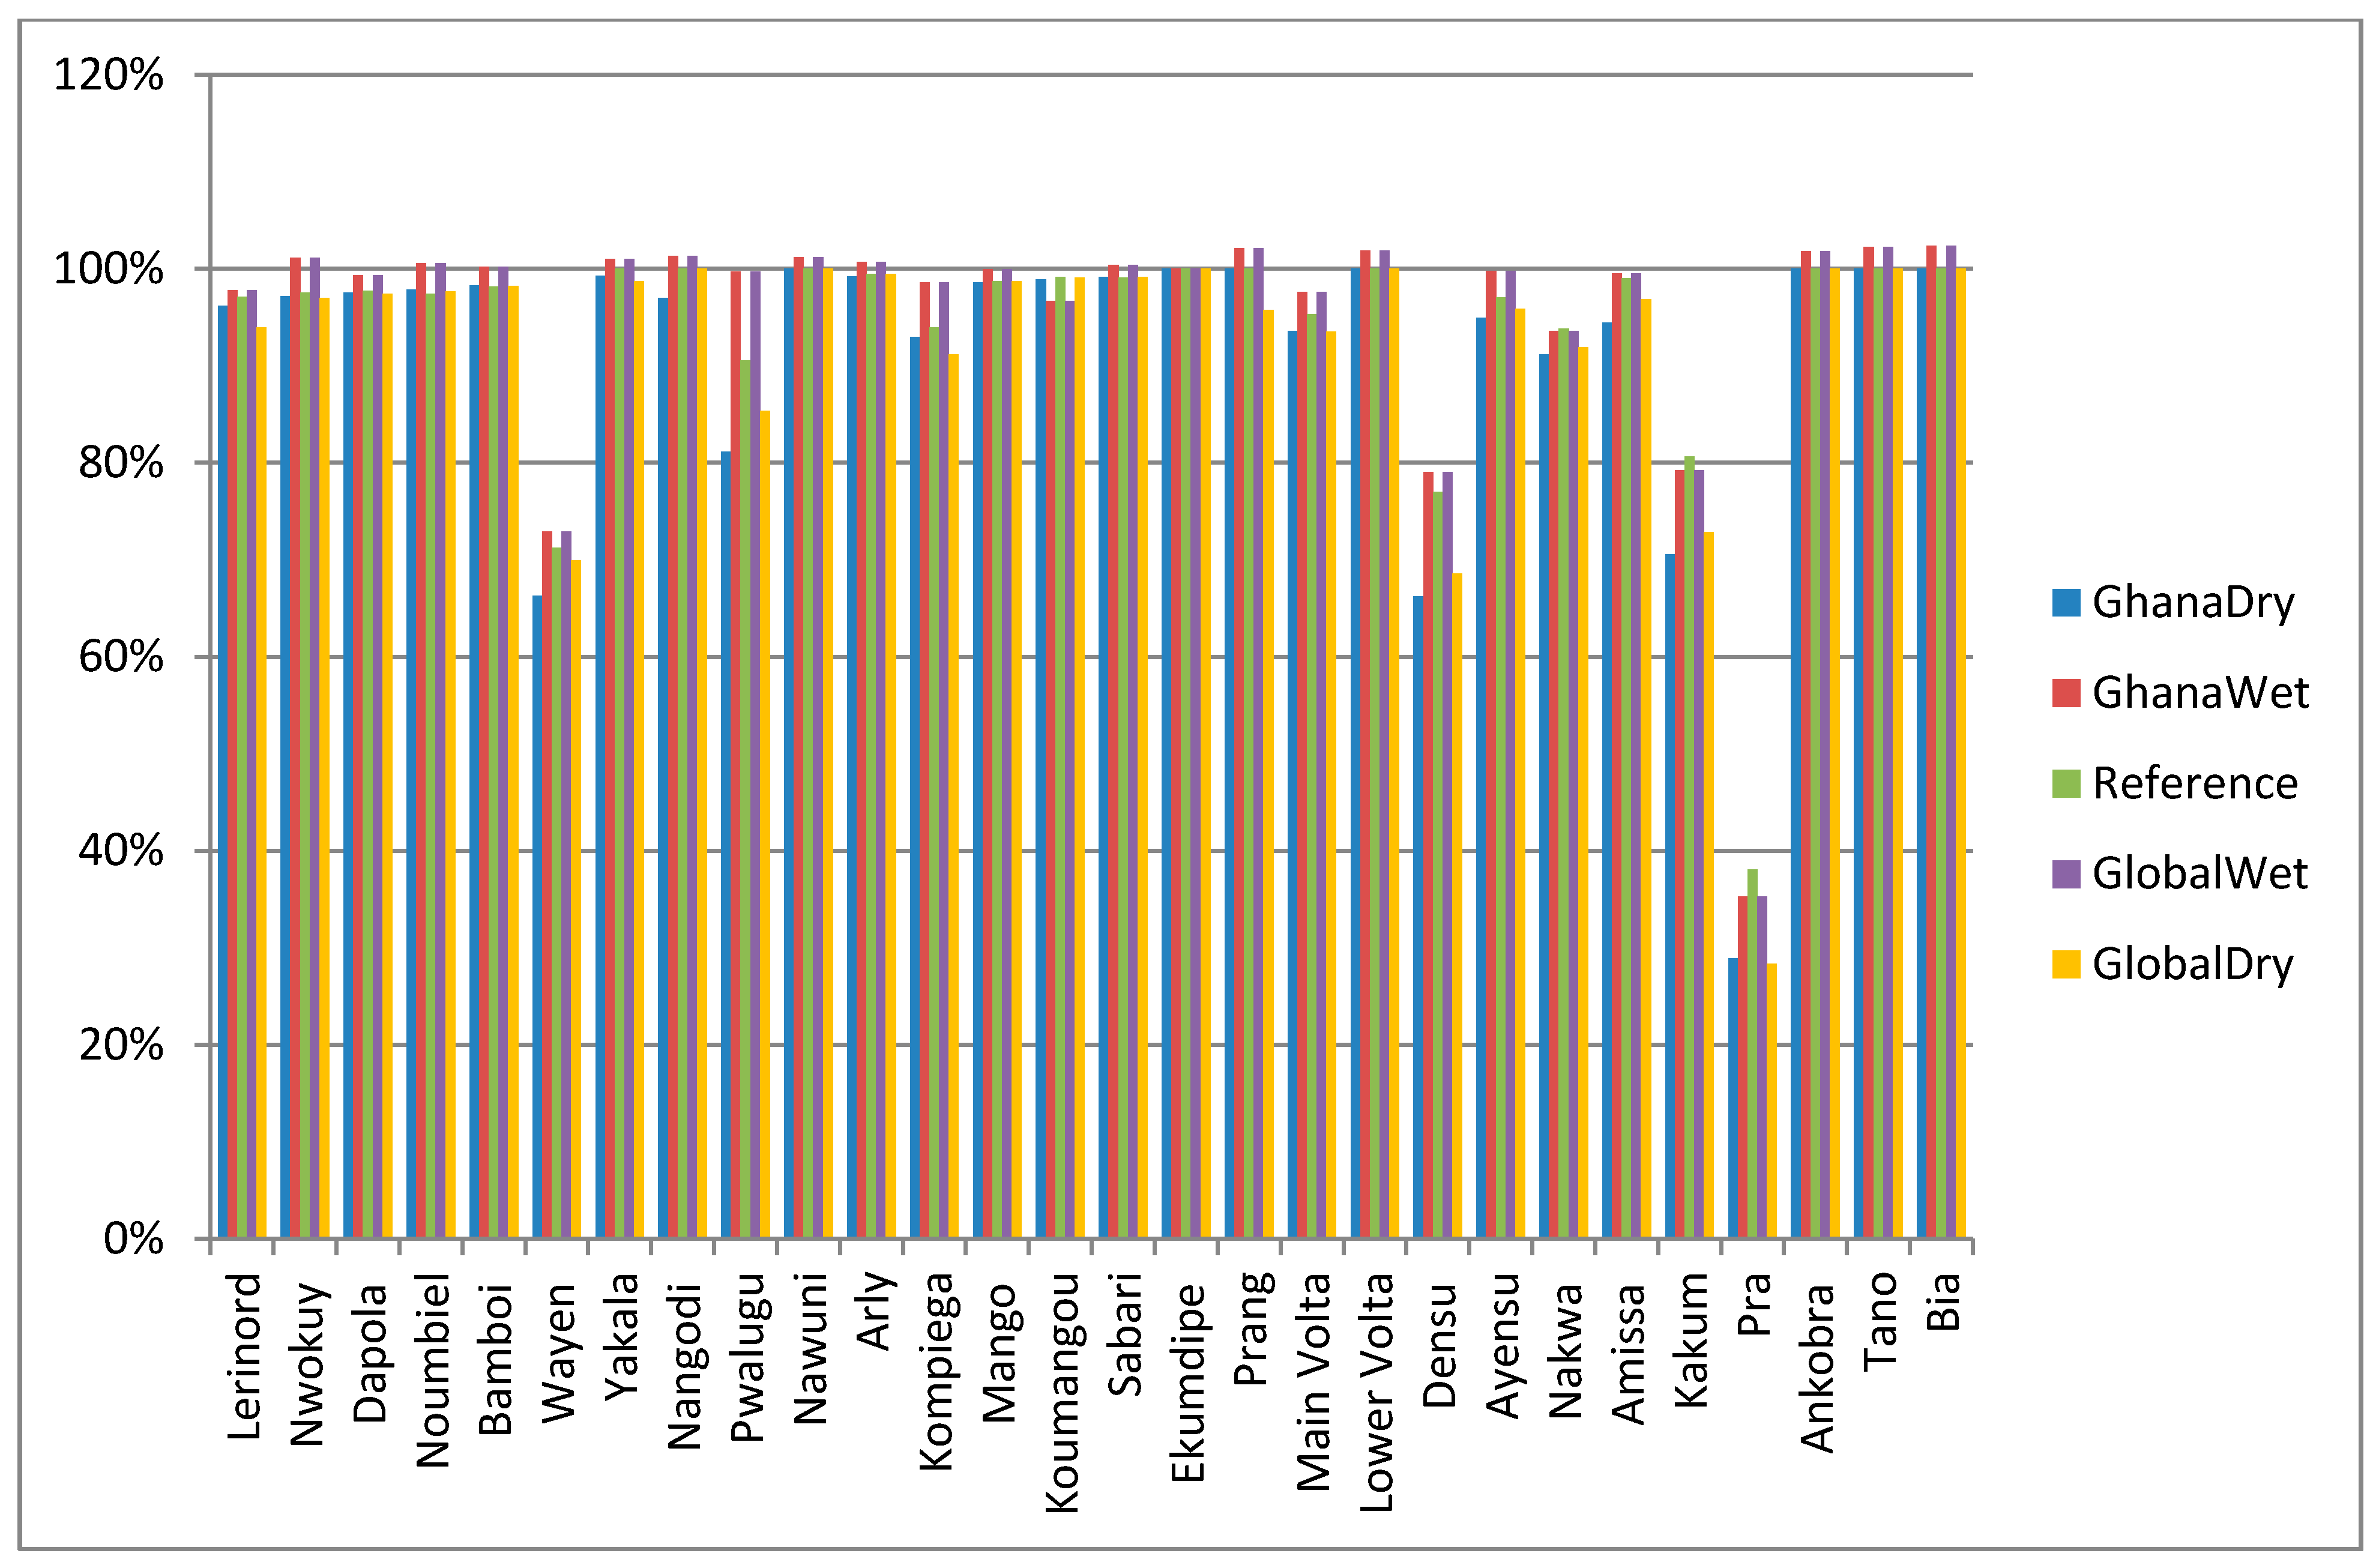
4.1. Impact of Climate Change on Catchment Runoff
| Main sub-basin | Catchment | Percent change from the Reference scenario | |||
|---|---|---|---|---|---|
| Ghana Dry scenario | Ghana Wet scenario | Global Wet scenario | Global Dry scenario | ||
| Black Volta | Lerinord | −8.5 | 1.0 | 11.8 | −1.8 |
| Nwokuy | −16.5 | −1.9 | 2.2 | −5.8 | |
| Dapola | −11.1 | −1.7 | 4.9 | −4.3 | |
| Noumbiel | −9.7 | −4.9 | 1.0 | −7.2 | |
| Bamboi | −8.0 | 3.3 | 1.0 | −8.2 | |
| Sub-basin level | −10.6 | −0.5 | 3.6 | −5.7 | |
| WhiteVolta | Wayen | −7.5 | −0.3 | 13.2 | −0.9 |
| Yakala | −9.5 | 0.5 | 6.7 | −2.0 | |
| Nangodi | −10.1 | 0.5 | 5.3 | −2.6 | |
| Pwalugu | −9.7 | −0.1 | 2.0 | −3.3 | |
| Nawuni | −8.9 | 0.2 | 0.7 | −5.4 | |
| Sub-basin level | −8.9 | 0.2 | 4.1 | −3.7 | |
| Oti | Arly | −8.6 | 3.4 | −1.0 | −0.7 |
| Kompienga | −9.9 | 0.8 | 4.0 | −2.2 | |
| Mango | −8.2 | 3.3 | 0.9 | −1.4 | |
| Koumangou | −9.7 | 3.5 | −0.4 | −1.9 | |
| Sabari | −9.0 | 2.5 | −0.5 | −4.1 | |
| Ekumdipe | −8.3 | 2.8 | −0.4 | −7.3 | |
| Sub-basin level | −8.8 | 2.9 | 0.3 | −2.8 | |
| MainVolta | Prang | −7.5 | 9.5 | 0.5 | −9.5 |
| Senchi | −7.5 | 6.2 | −0.5 | −9.1 | |
| Sub-basin level | −7.5 | 6.5 | −0.4 | −9.1 | |
| Lower Volta | Delta | −9.1 | 7.8 | 0.9 | −10.1 |
| Densu | Densu | −18.8 | 35.7 | −2.8 | −17.3 |
| Ayensu | Ayensu | −16.2 | 35.4 | −1.9 | −14.3 |
| Nakwa | Nakwa | −31.1 | 71.7 | 12.9 | −17.8 |
| Amissa | Amissa | −21.3 | 60.6 | −0.8 | −18.6 |
| Kakum | Kakum | −20.3 | 81.1 | 4.1 | −17.8 |
| Pra | Pra | −25.9 | 60.9 | −12.2 | −34.4 |
| Ankobra | Ankobra | −22.8 | 71.6 | −4.6 | −21.5 |
| Tano | Tano | −26.0 | 32.4 | −12.8 | −30.6 |
| Bia | Bia | −12.7 | 13.2 | −4.3 | −15.1 |
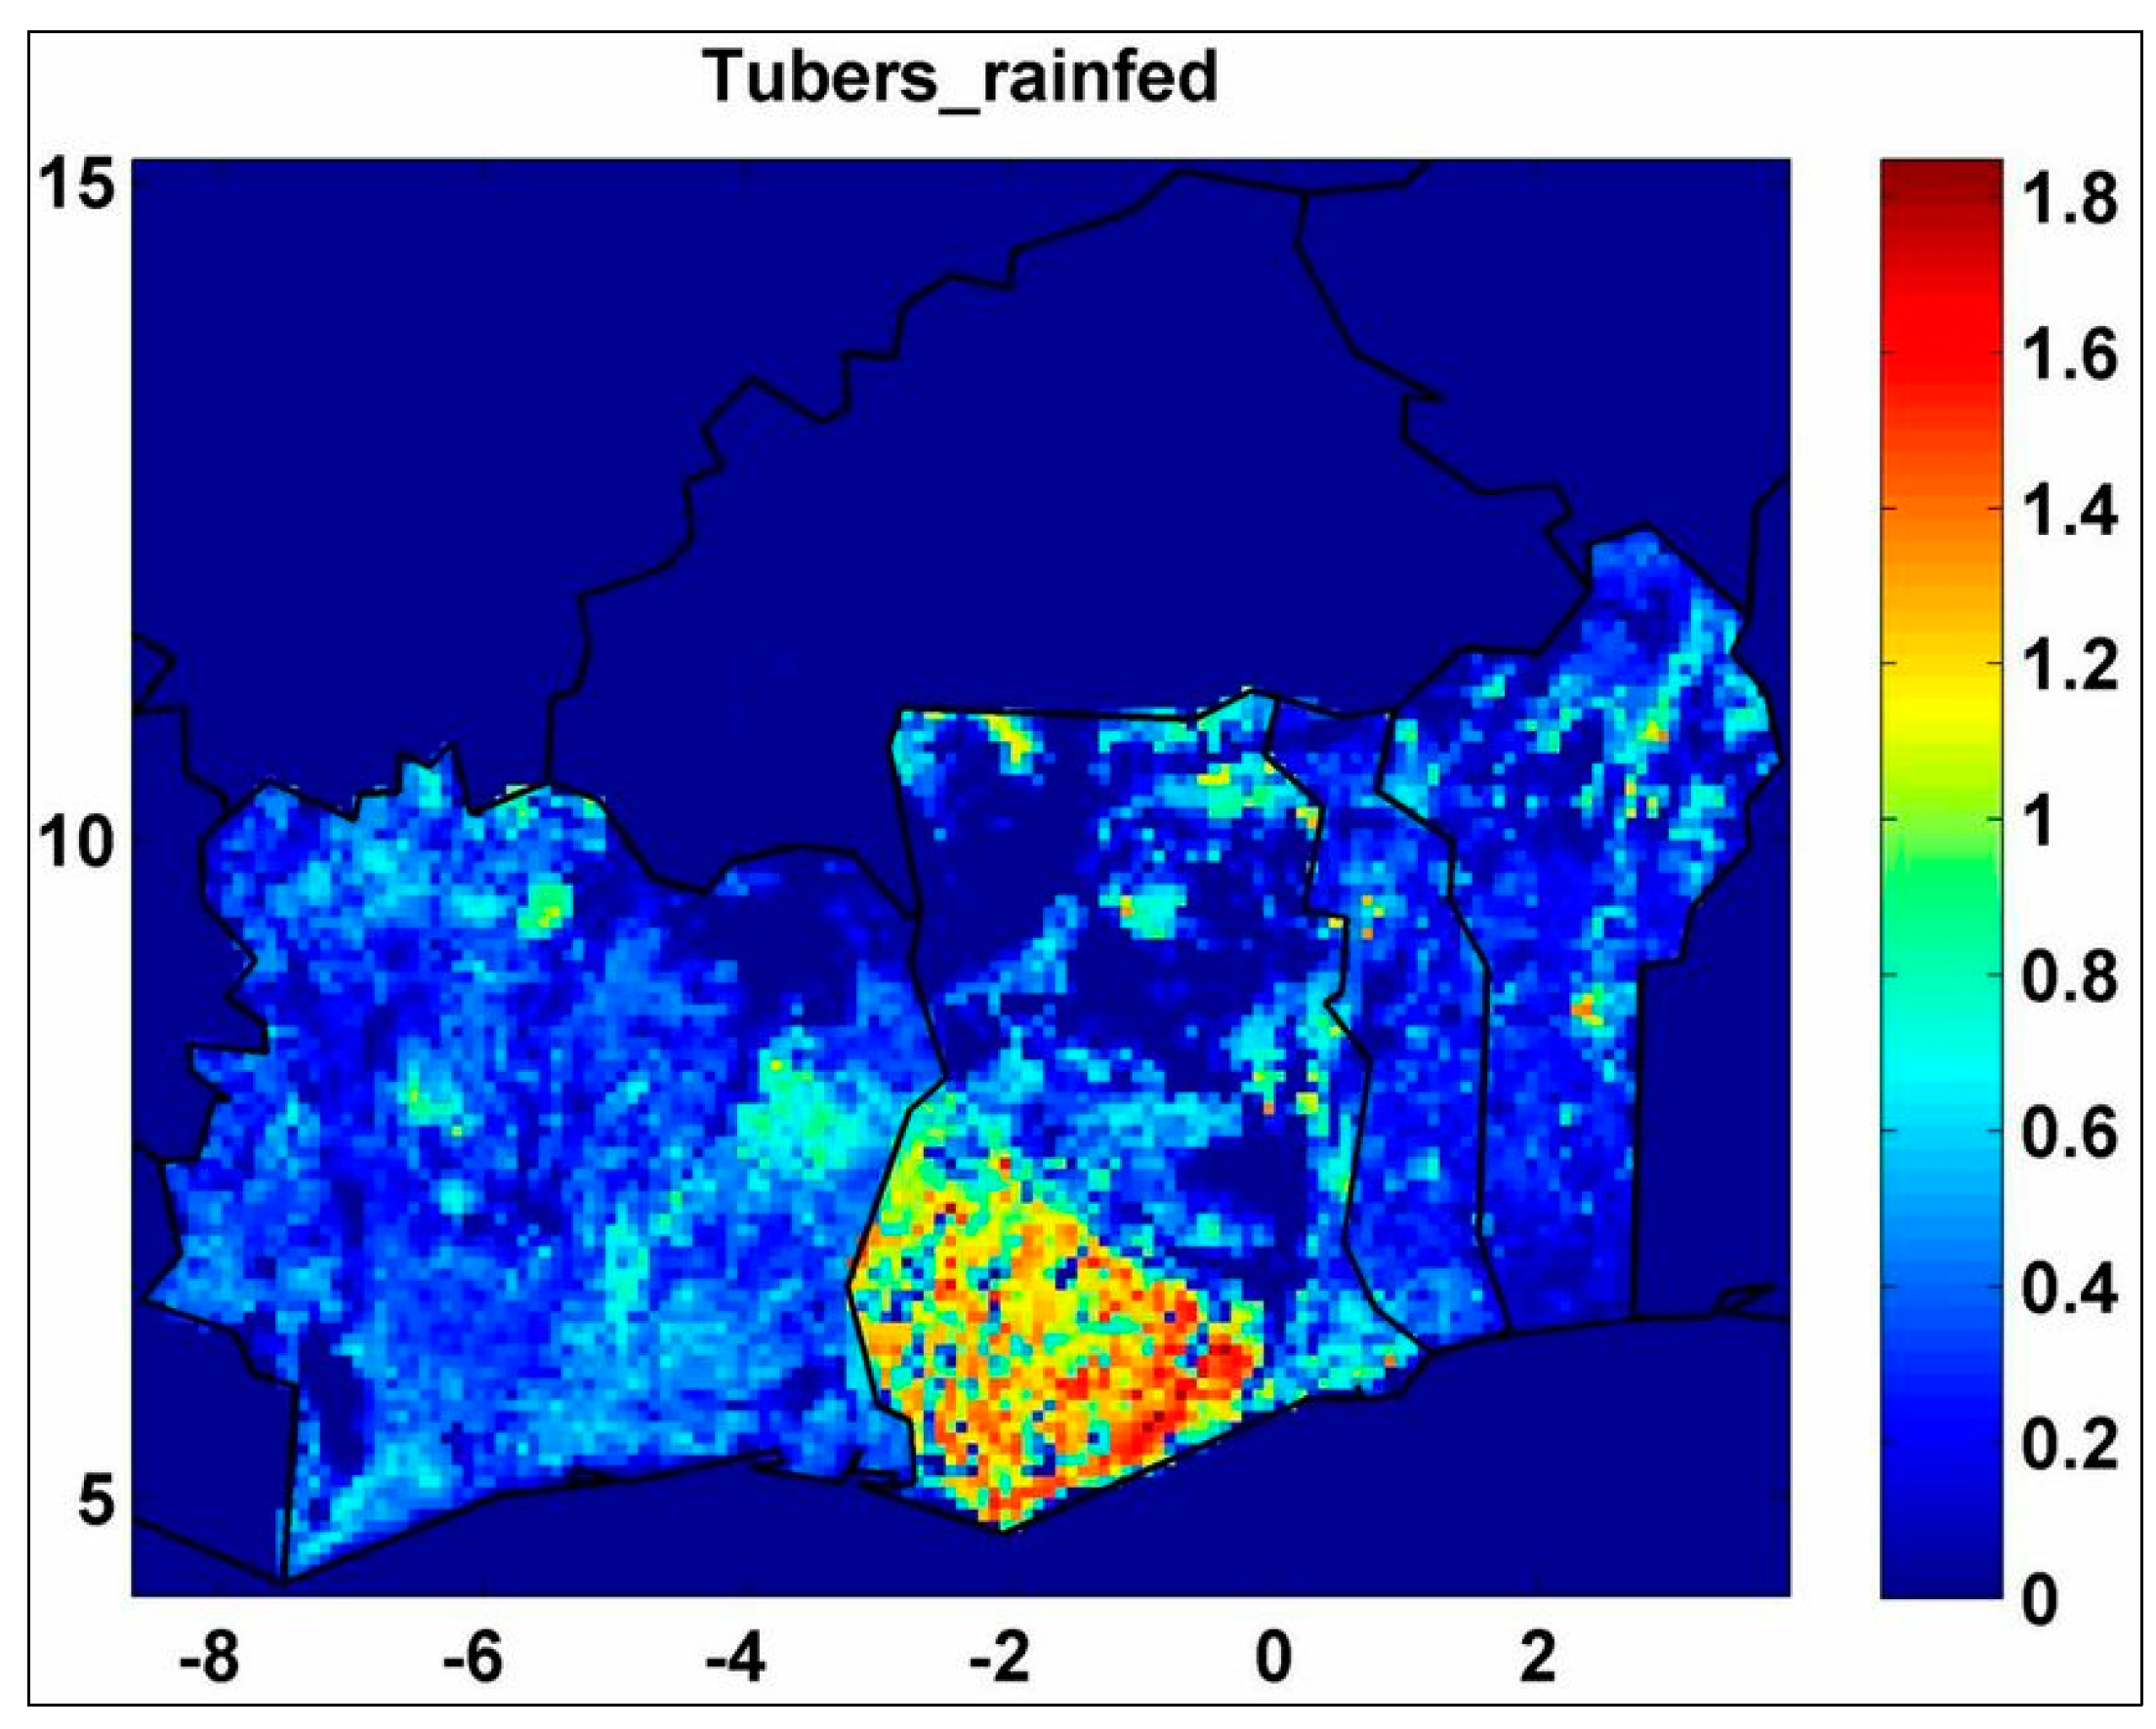
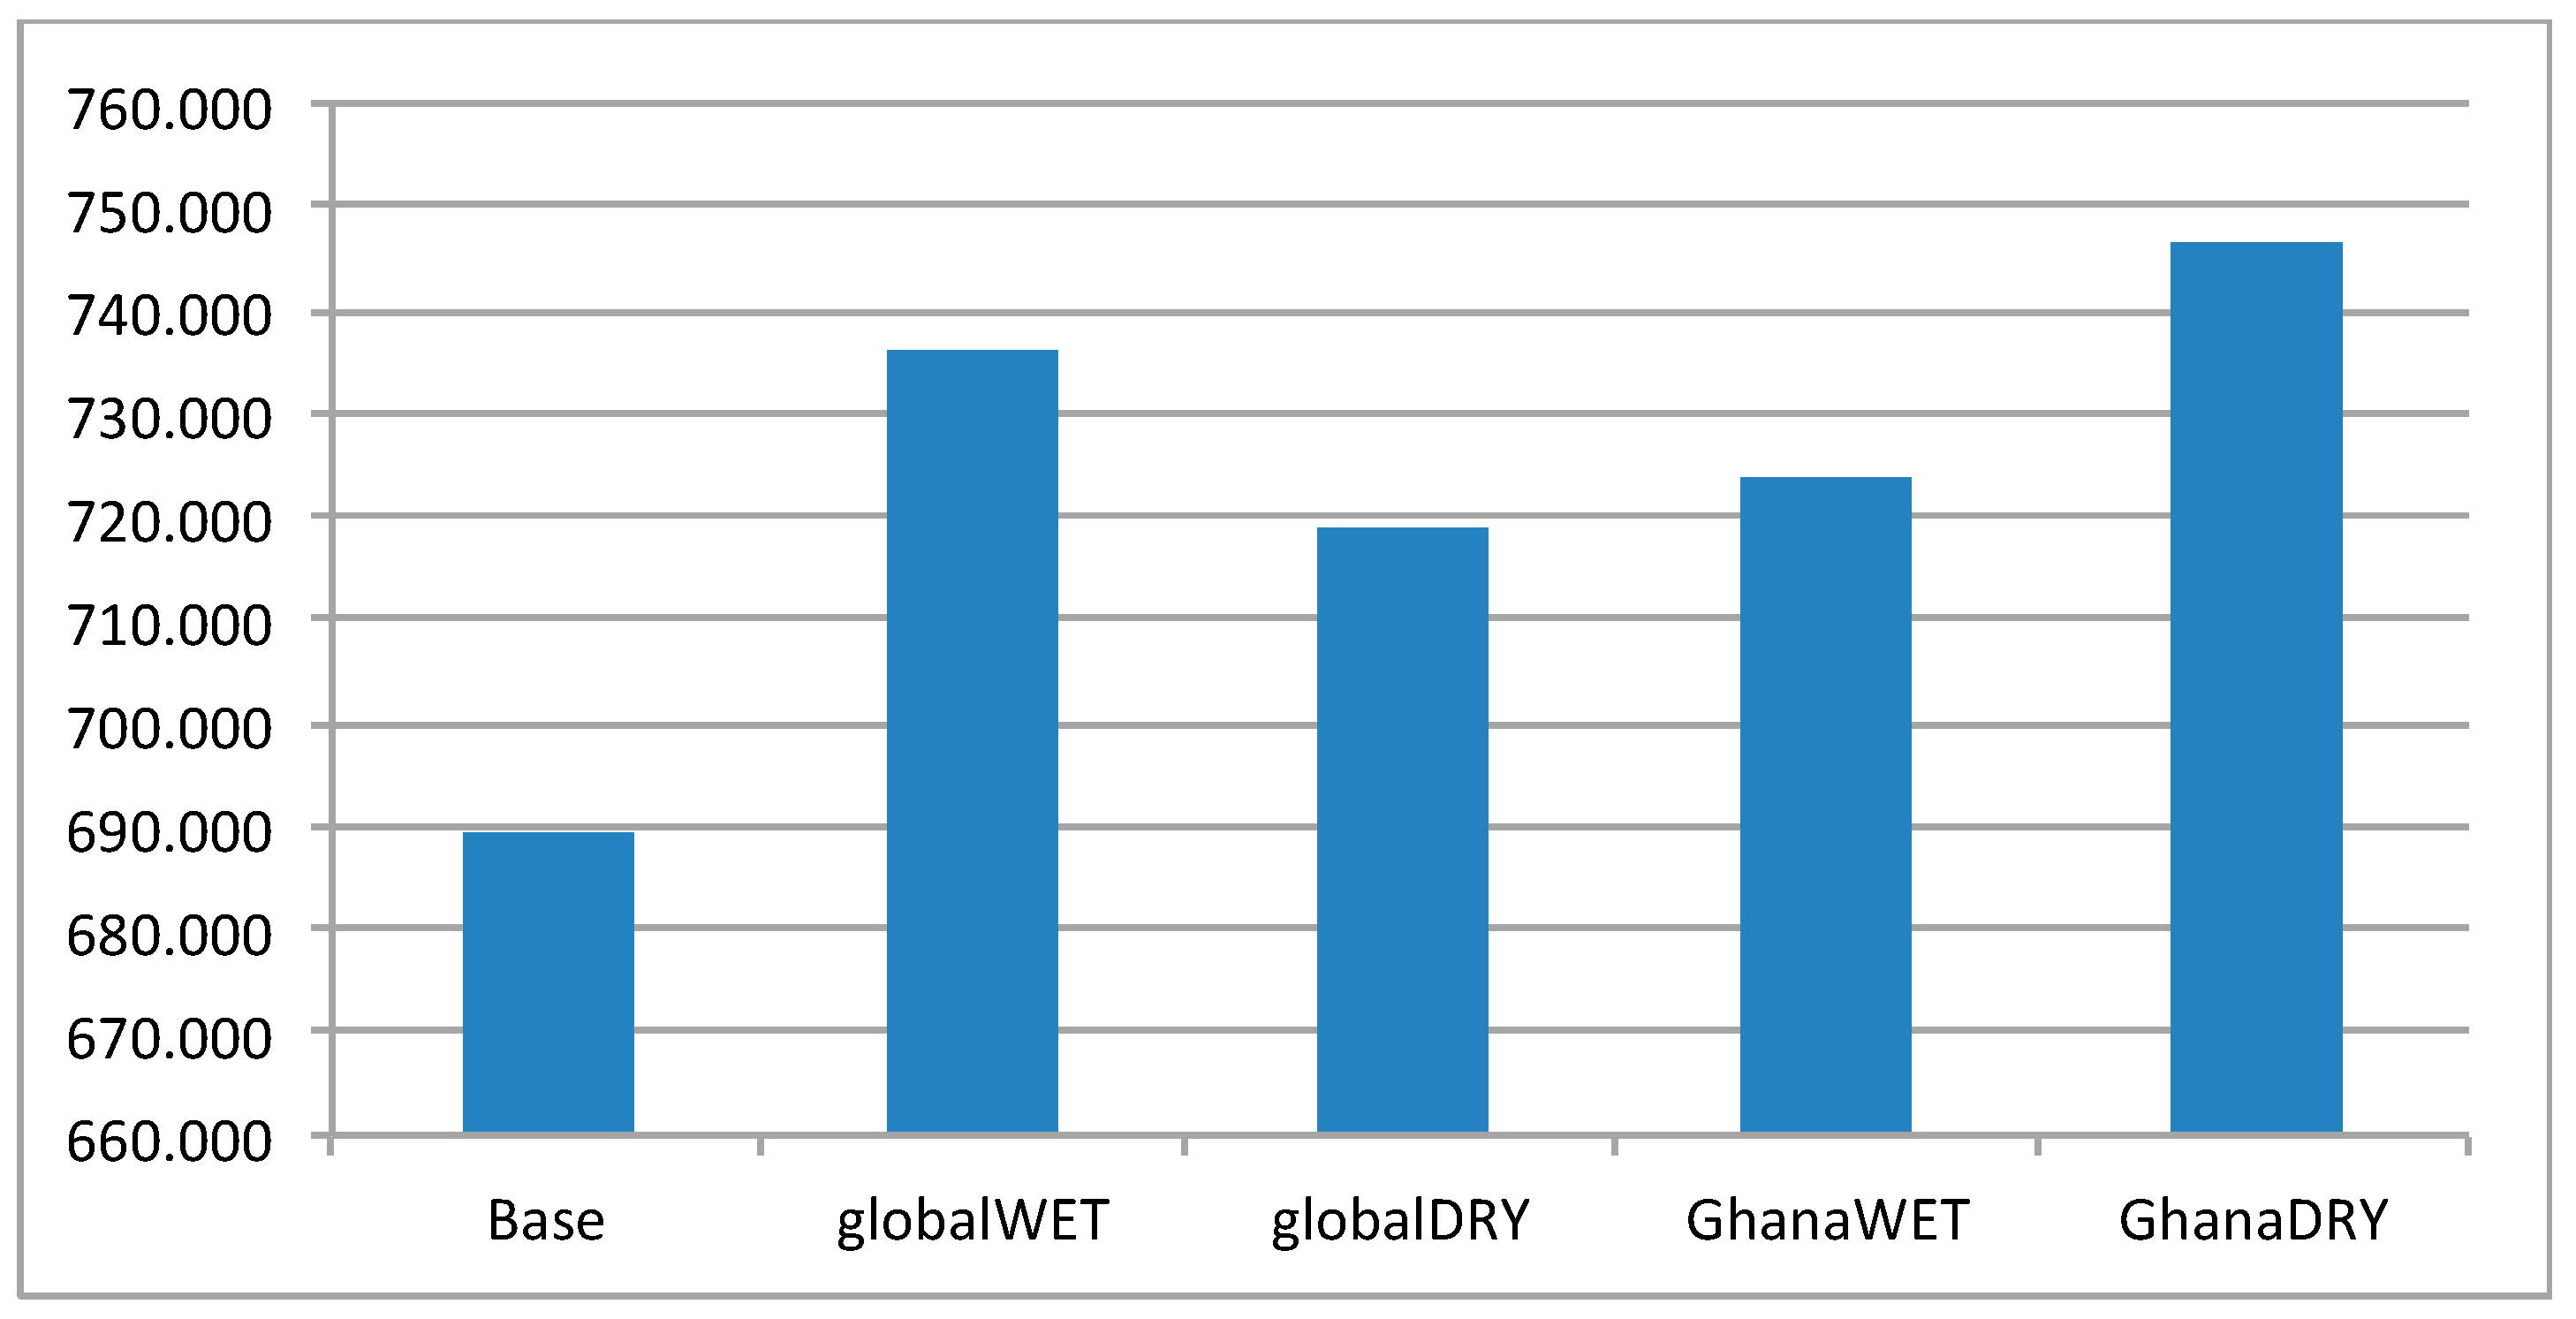
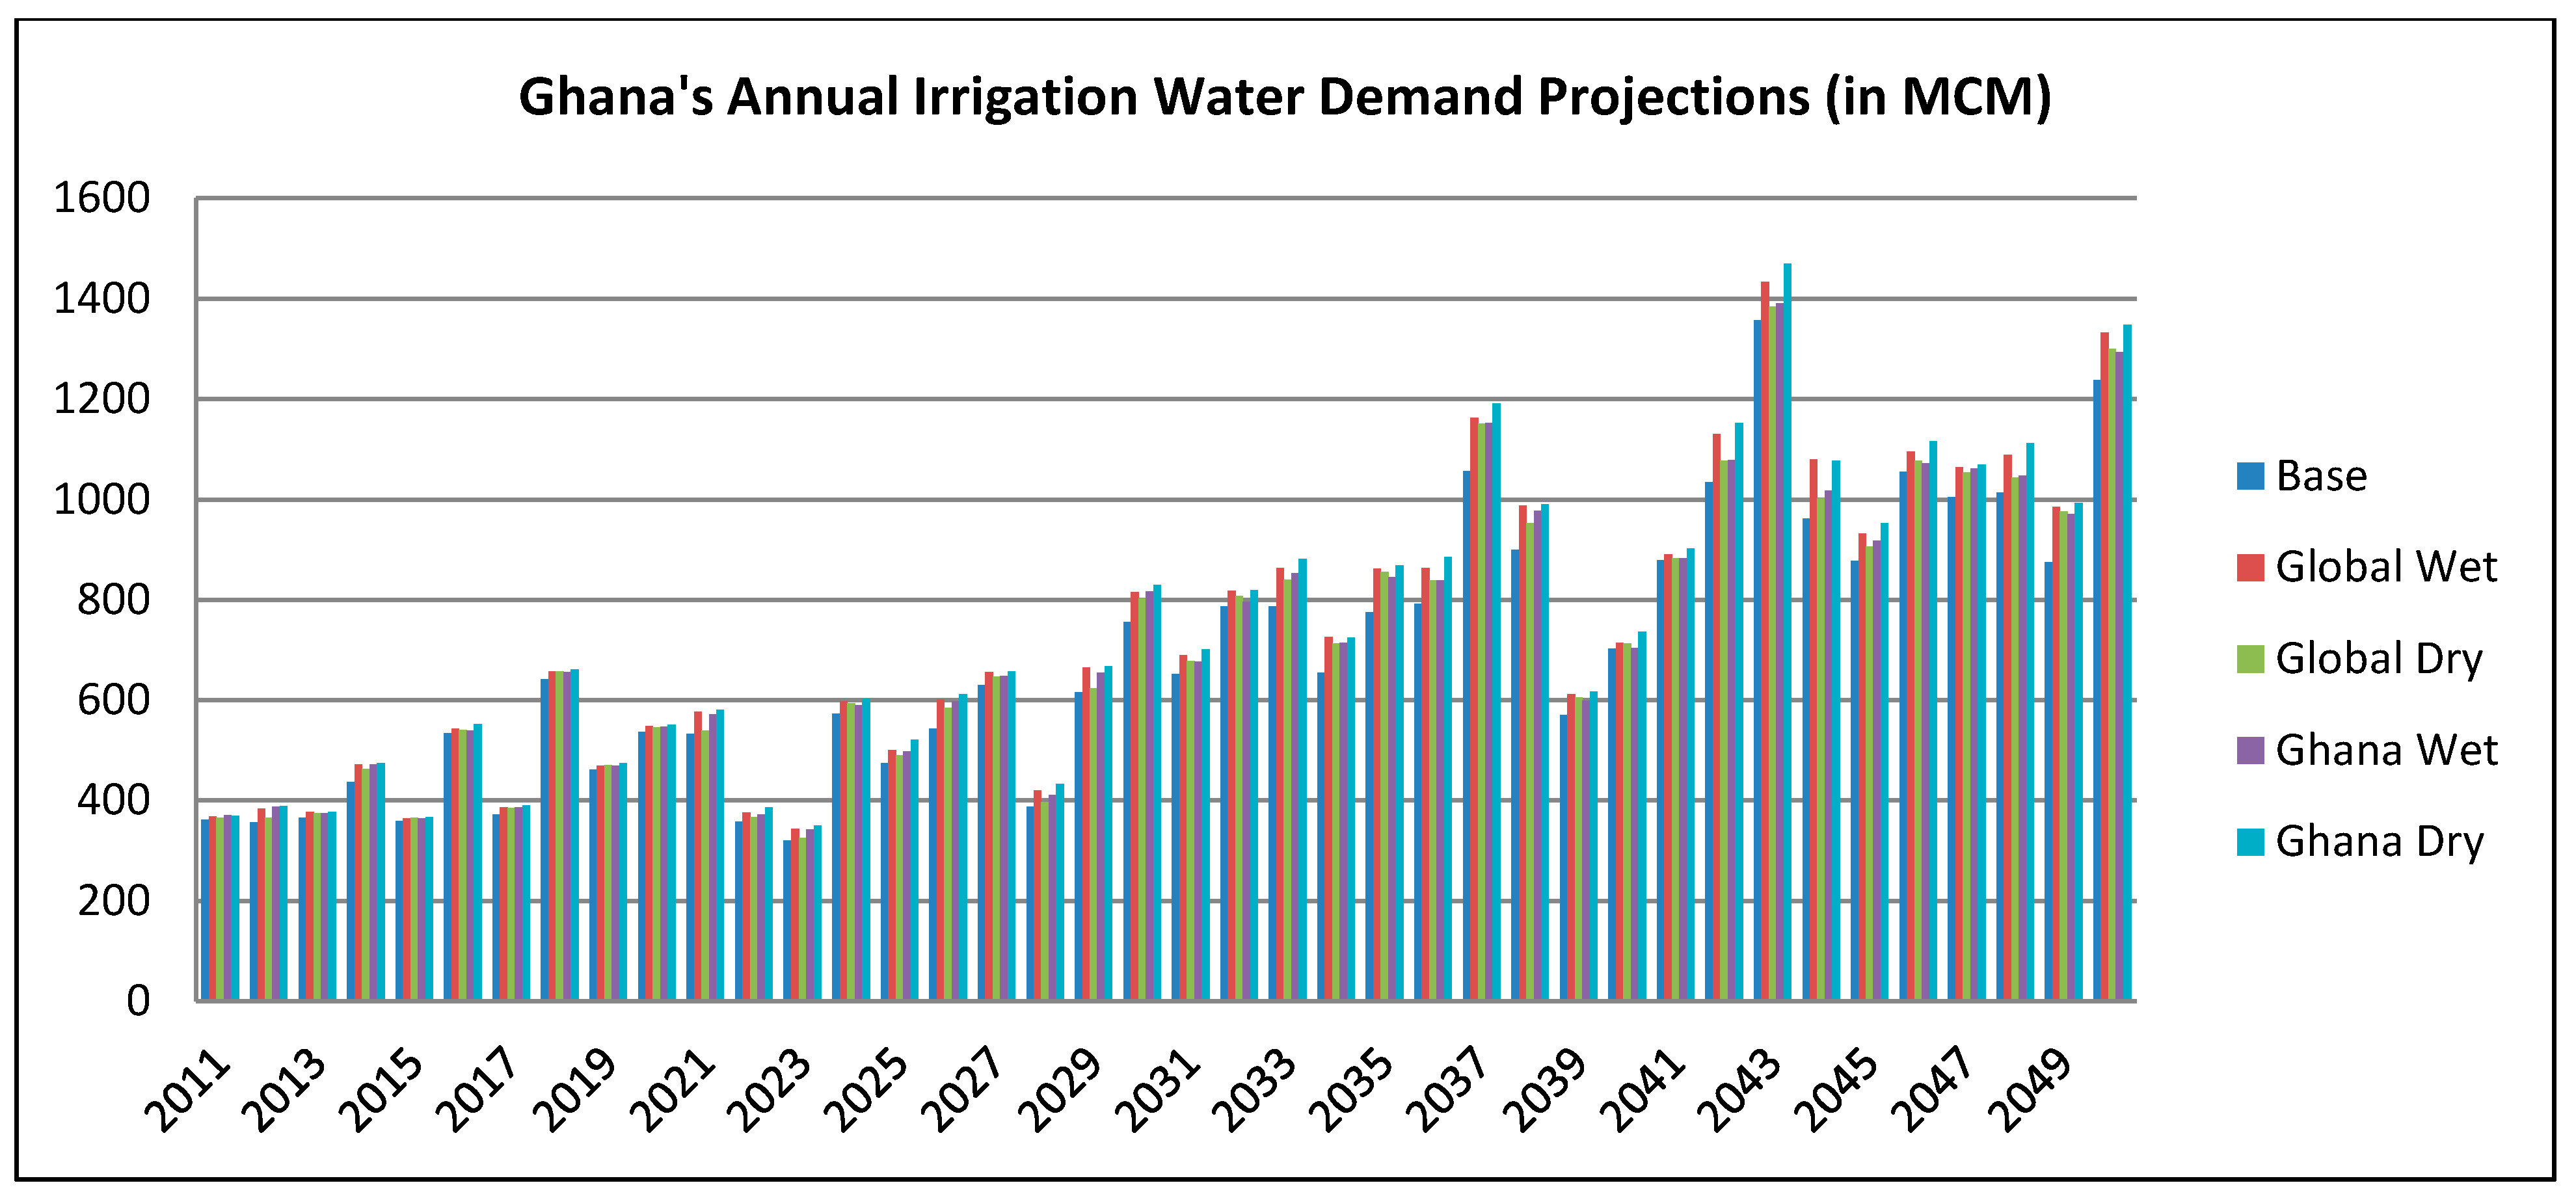
4.2. Impact of Climate Change on Irrigation Demand

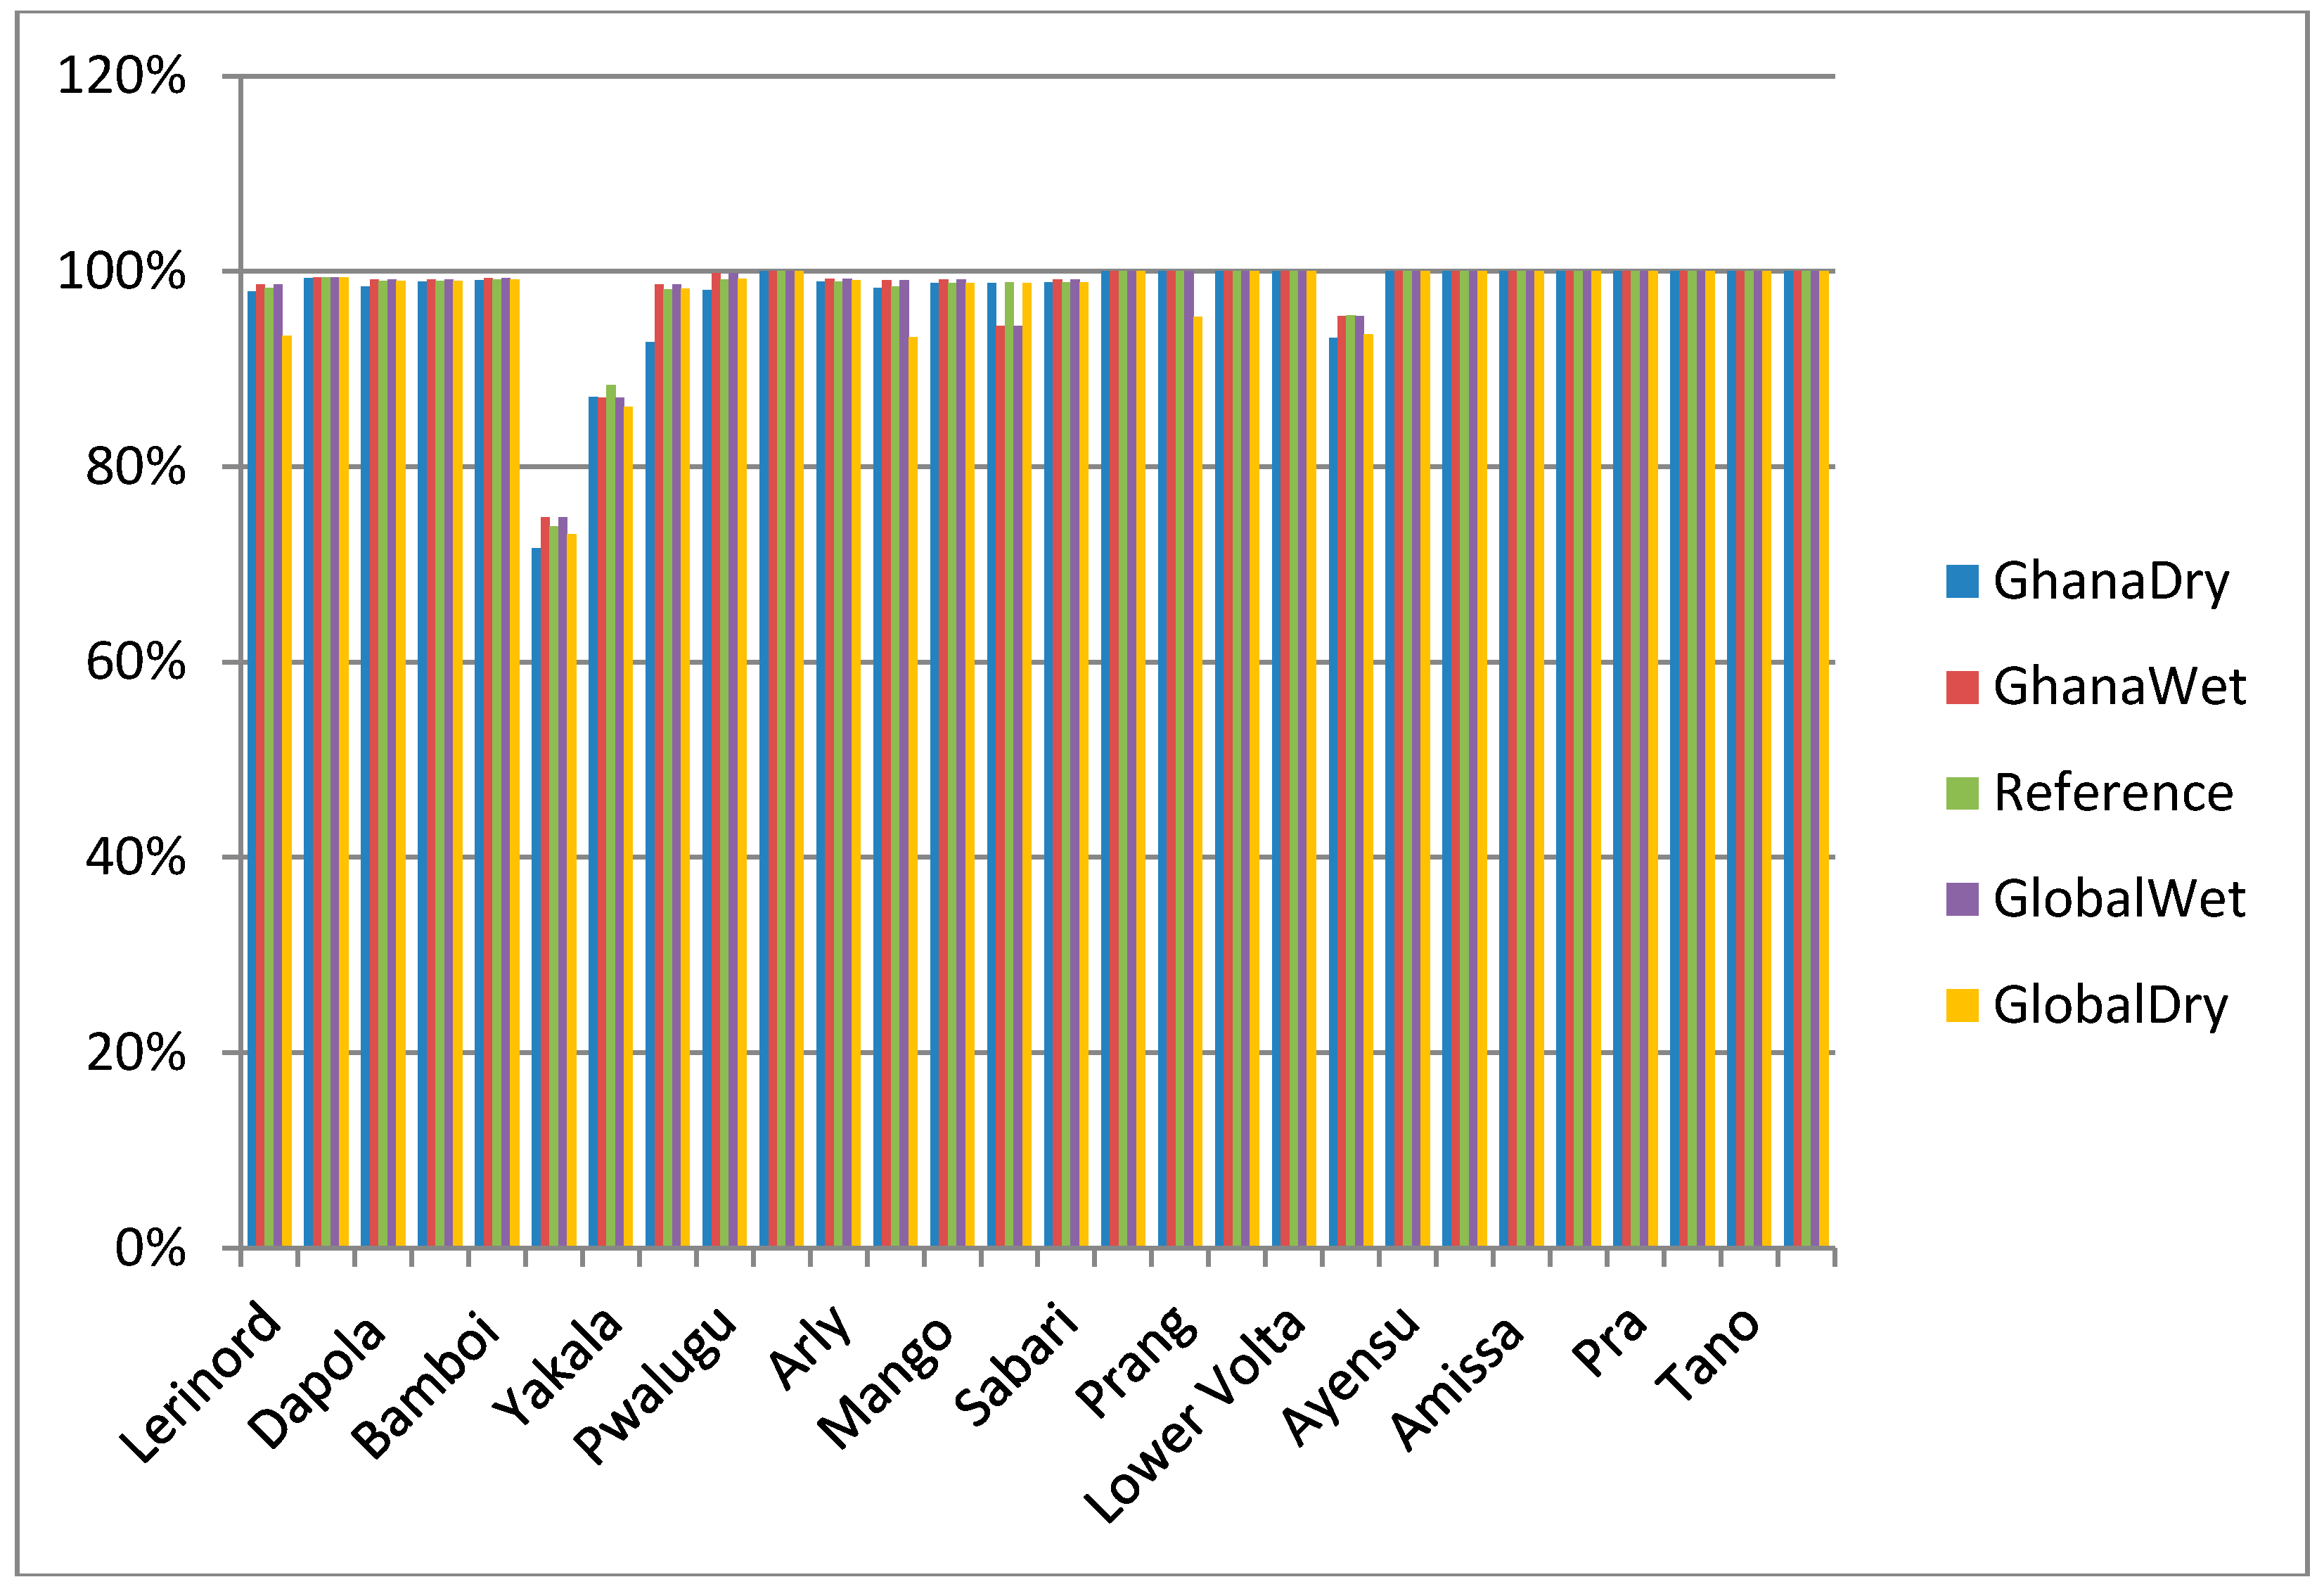
4.3. Impact of Climate Change on Municipal Demand Coverage
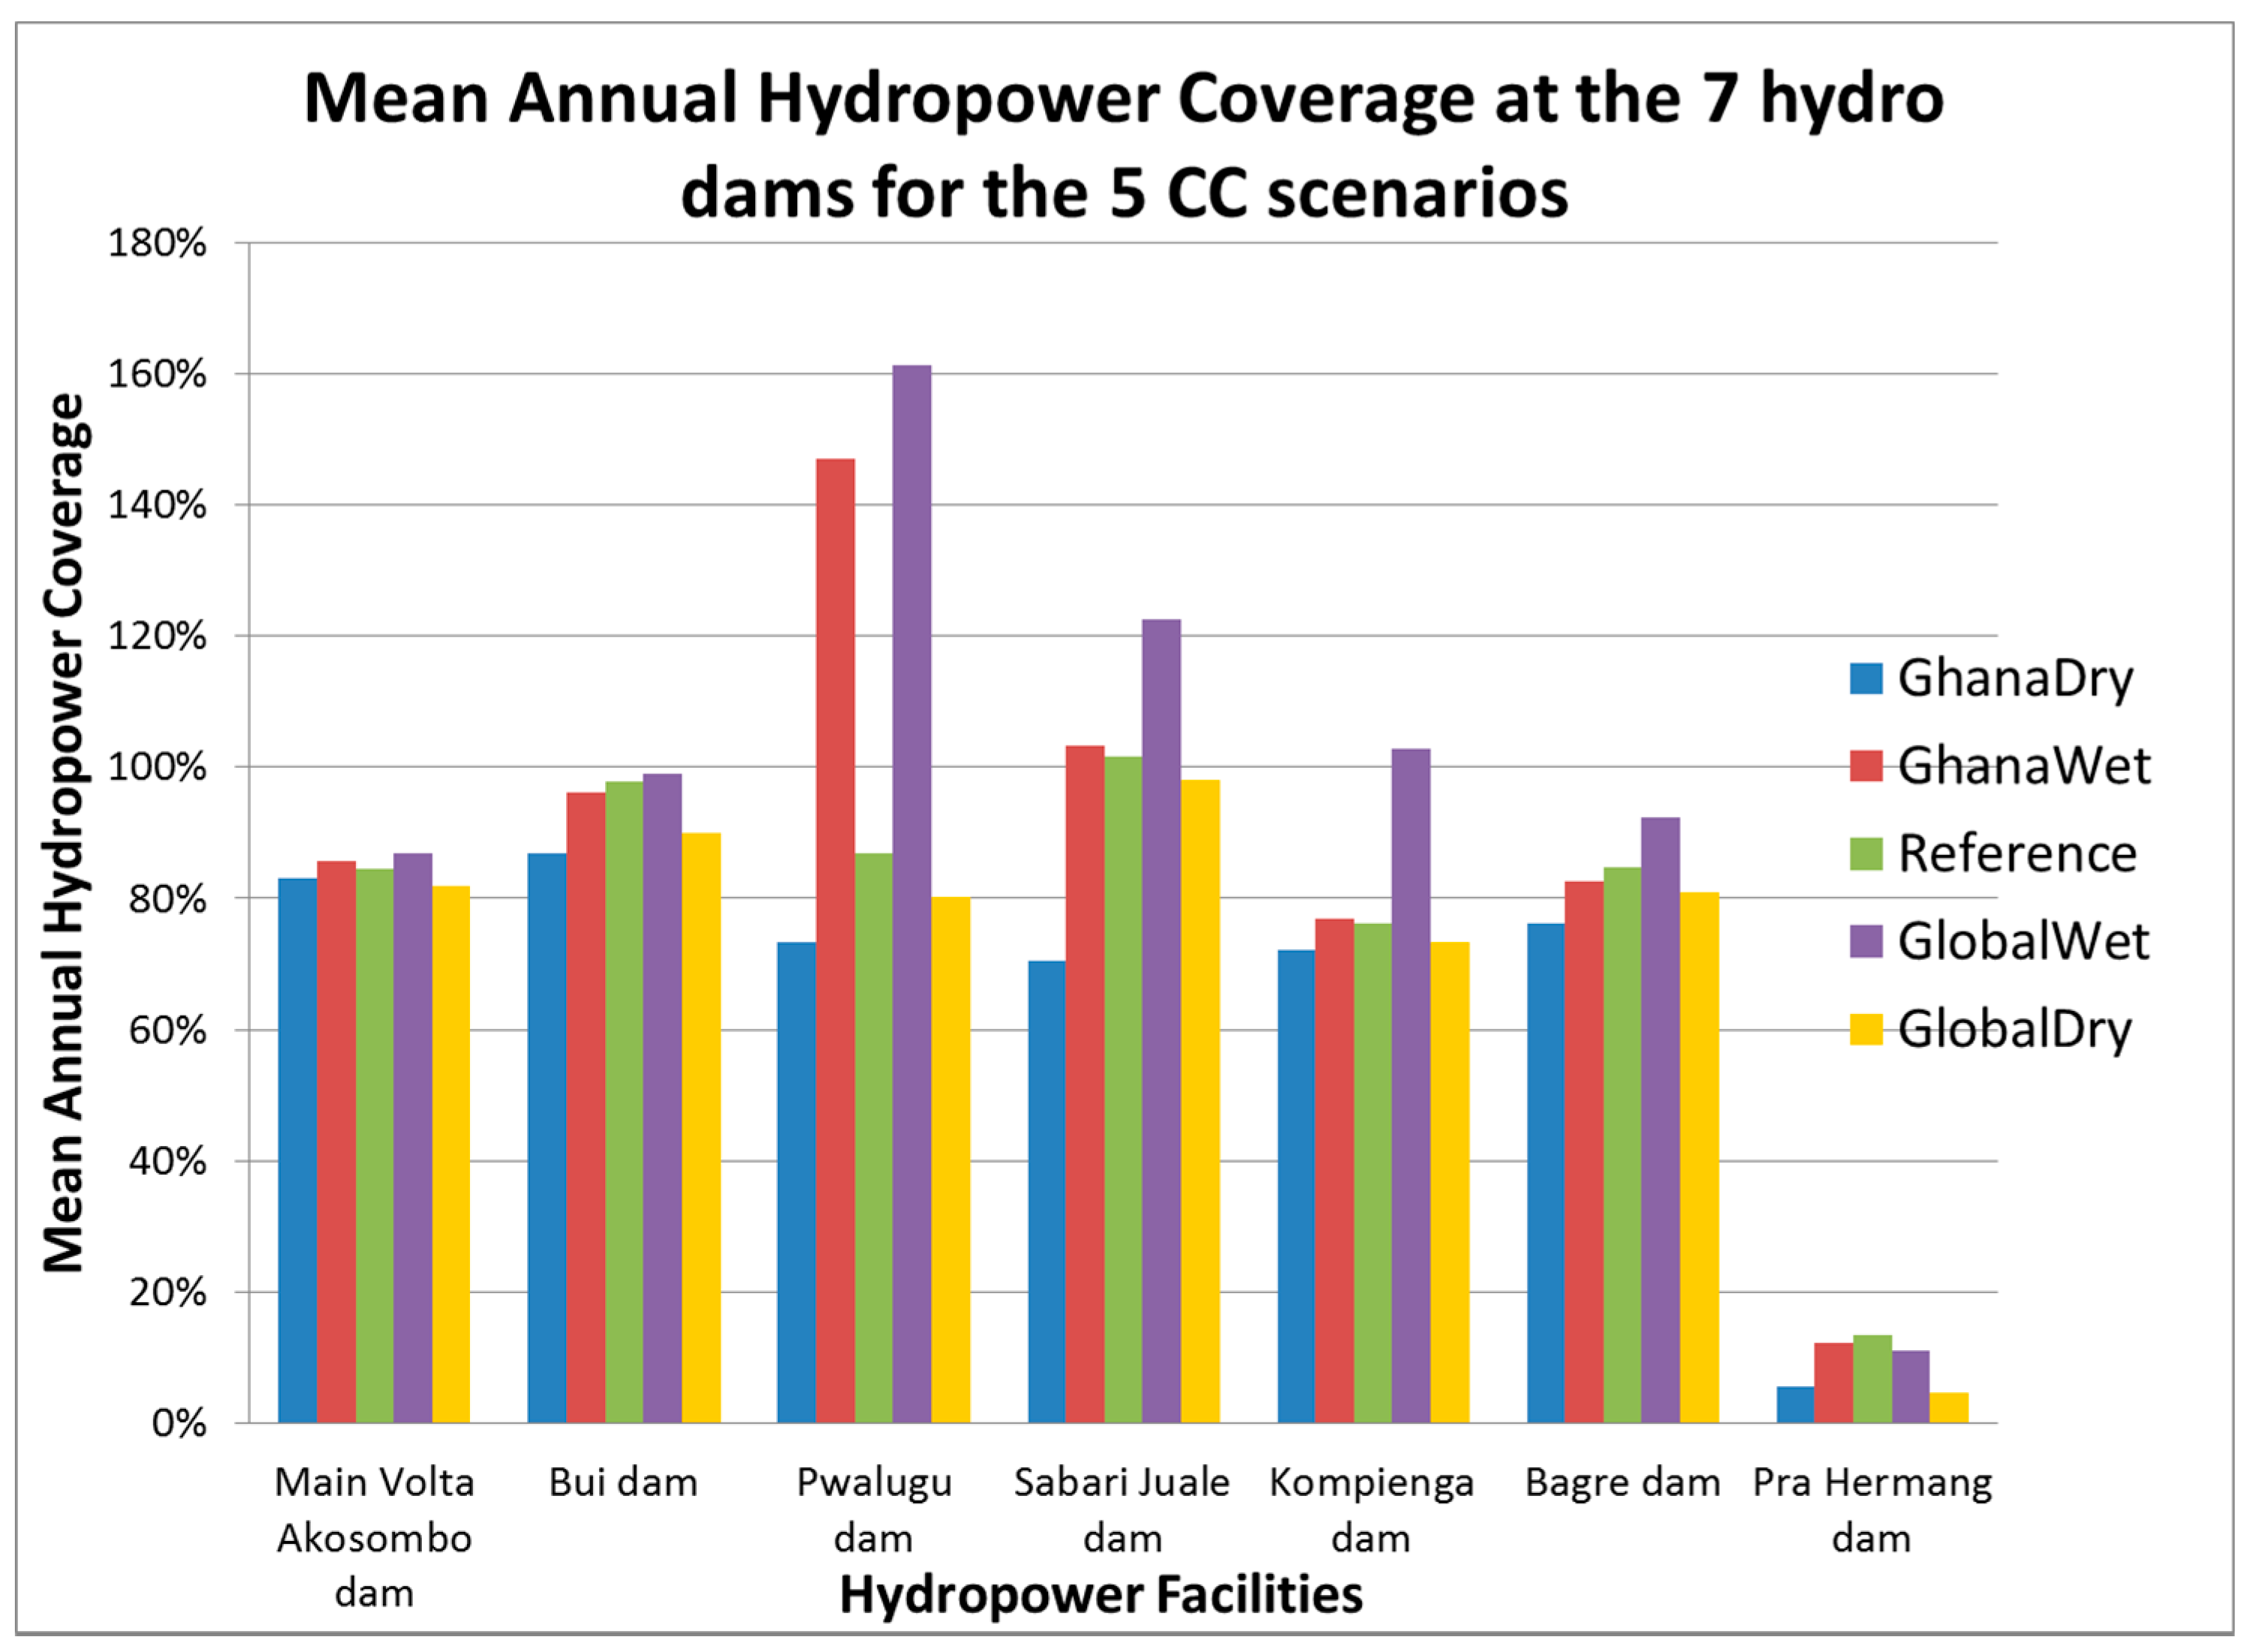
4.4. Impact of Climate Change on Hydropower Production

5. Conclusions
Acknowledgments
Author Contributions
Conflicts of Interest
References
- Van de Giesen, N.; Andreini, M.; van Edig, A.; Vlek, P. Competition for Water Resources of the Volta Basin. Available online: http://armspark.msem.univ-montp2.fr/bfpvolta/admin/biblio/competition%20Volta_basin.pdf (accessed on 20 May 2013).
- Amisigo, B.A.; van de Giesen, N.C. Using a spatio-temporal dynamic state-space model with the EM algorithm to patch gaps in daily river flow series. Hydrol. Earth Syst. Sci. 2005, 9, 209–224. [Google Scholar]
- Kristensen, P.; Means, R.; Arndt, C.; Willenbockel, D.; Strzepek, K.; Fathelrahman, E.; Nicholls, R.; Wright, L.; Fant, C.; Chinowsky, P.; et al. The Economics of Adaptation to Climate Change; Synthesis Report; World Bank: Washington DC, USA, 2010; pp. 47–53. [Google Scholar]
- De Pinto, A.; Demirag, U.; Haruna, A.; Koo, J.; Asamoah, M. Climate Change, Agriculture and Food Crop Production in Ghana. Available online: http://www.ifpri.org/sites/default/files/publications/gssppn3.pdf (accessed on 13 June 2013).
- Onibon, H. Global Environment Facility, Addressing Transboundary Concerns in the Volta River Basin and its Downstream Coastal Area. December 2008. Available online: http://www.gefweb.org (accessed on 13 June 2013).
- De Condappa, D.; Chaponnière, A.; Lemoalle, J. Decision-support Tool for Water Allocation in the Volta Basin. In Volta Basin Focal Project Report No 10. 2008; IMWI: Colombo, Sri Lanka, 2008. [Google Scholar]
- McCartney, M.; Forkuor, G.; Sood, A.; Amisigo, B.; Hattermann, F.; andMuthuwatta, L. The Water Resource Implications of Changing Climate in the Volta River Basin. Available online: http://www.iwmi.cgiar.org/Publications/IWMI_Research_Reports/PDF/PUB146/RR146.pdf (accessed on 5 June 2013).
- Ghana Climate Change Impacts, Vulnerability and Adaptation Assessments; EPA: Washington, DC, USA, 2008.
- Obuobie, E.; Kankam-Yeboah, K.; Amisigo, B.; Opoku-Ankomah, Y.; Ofori, D. Assessment of Vulnerability of River Basins in Ghana to Water Stress Conditions under Climate Change. J. Water Climate Chang. 2012. [Google Scholar] [CrossRef]
- Strzepek, K.M.; McCluskey, A. Modeling the Impact of Climate Change on Global Hydrology and Water Availability; World Bank: Washington, DC, USA, 2010. [Google Scholar]
- Biney, C.A. The Volta Basin Authority. Available online: http://www.inbo-news.org/IMG/pdf/Volta-Basin-Authority.pdf (accessed on 23 June 2013).
- Johnston, R.; McCartney, M. Inventory of Water Storage Types in the Blue Nile and Volta River Basins. Available online: http://www.iwmi.cgiar.org/Publications/Working_Papers/working/WOR140.pdf (accessed on 5 June 2013).
- Biney, C.A. Connectivities and Linkages within the Volta Basin. Available online: http://www.gwsp.org/fileadmin/GCI_conference/Products/Pres_-_Biney_-_Connectivities.pdf (accessed on 20 June 2013).
- Opoku-Ankomah, Y.; Forson, M.A. Assessing Surface Water Resources of the South-Western and Coastal Basin Systems of Ghana. Hydrol. Sci. 1998, 43, 733–740. [Google Scholar] [CrossRef]
- FAO. AquaCrop. Available online: http://www.fao.org/nr/water/aquacrop.html (accessed on 22 June 2013).
- Ghana Water Forum (GWF). Water and Sanitation Services Delivery in a Rapidly Changing Urban Environment. Available online: https://ghanawaterforum.files.wordpress.com/2011/09/ministerial-and-dps-statement-gwf-3-for-discussion.pdf (accessed on 20 June 2013).
- Arndt, C. Climate Policy and Developing Country Interests. Available online: http://www.wider.unu.edu/publications/newsletter/articles-2015/en_GB/02-2015--CA (accessed on 15 June 2013).
- IPPC Website. http://www.ipcc-data.org/guidelines/pages/gcm_guide.html (accessed on 5 June 2013).
- Sheffield, J.; Goteli, G.; Wood, E. Global Meteorological Dataset for Surface Modeling, Princeton Datasource. Available online: http://www.princetondatasource.com (accessed on 15 May 2013).
- Strzepek, K.; Balaji, R.; Rajaram, H.; Strzepek, J. A Water Balance Model for Climate Impact Analysis of Runoff with Emphasis on Extreme Events; World Bank: Washington DC, USA, 2012. [Google Scholar]
- Strzepek, K.; McCluskey, A.; Boehlert, B.; Jacobsen, M.; Fant, C., IV. Climate Variability and Change: A Basin Scale Indicator Approach to Understanding the Risk to Water Resources Development and Management; World Bank: Washington DC, USA, 2011. [Google Scholar]
- Hunink, D. Climate Change Impact Assessment on Crop Production in Albania. Available online: http://www.futurewater.nl/wp-content/uploads/2012/03/CropImpactAssessment_Albania.pdf (accessed on 7 June 2013).
- Namara, R.E.; Horowitz, L.; Nyamadi, B.; Barry, B. Irrigation Development in Ghana: Past Experiences, Emerging Opportunities, and Future Directions. Available online: http://www.ifpri.org/sites/default/files/publications/gsspwp27.pdf (accessed on 20 June 2013).
- Gumma, M.K.; Thenkabail, P.; Hideto, F.; Nelson, A.; Dheeravath, V.; DawuniBusia., D.; Rala, A. Mapping Irrigated Areas of Ghana Using Fusion of 30 m and 250 m Resolution Remote-Sensing Data. Remote Sens. 2011, 3, 816–835. [Google Scholar] [CrossRef]
- Lamptey, D.; Nyamdi, B.; Minta, A. National Irrigation Policy, Strategies, and Regulatory Measures. Available online: http://mofa.gov.gh/site/wp-content/uploads/2011/07/GHANA-IRRIGATION-DEVELOPMENT-POLICY1.pdf (accessed on 15 June 2013).
- Zuidema, P.A. A Physiological Production Model for Cocoa (Theobroma cacao): Model Presentation, Validation and Application. Agric. Systems 2005, 84, 195–225. [Google Scholar] [CrossRef]
- Hartwell Allan, K.; Baker, J.K.; Boote, K. The CO2 fertilization effect: Higher carbohydrate production and retention as biomass and seed yield. Available online: http://www.fao.org/docrep/W5183E/w5183e06.htm (accessed on 15 May 2013).
- Stockholm Environment Institute (SEI). WEAP21. Available online: http://weap21.org/ (accessed on 15 June 2013).
- Gridded Population of the World Version 3 (GPWv3): Population Grids. Available online: http://sedac.ciesin.columbia.edu/gpw (accessed on 30 April 2013).
- Environmental Resources Management (ERM). Environmental and Social Impact Assessment Study of the Bui Hydroelectric Power Project. Available online: http://library.mampam.com/Final%20ESIA%20-%20Bui%20HEP.pdf (accessed on 30 April 2013).
- Ministry of Water Resources, Works and Housing (MWH). Information in the Southwestern and Volta Basin System (Final Report). In Water Resources Management Study: Information ‘Building Block’ Study; Accra: MWH. Ministry of Water Resources: Accra, Ghana, 1998; Volume 3. [Google Scholar]
- Volta River Authority (VRA). Akosombo Hydro Plant. Available online: http://www.vraghana.com/our_mandate/akosombo_hydro_plant.php (accessed on 30 June 2013).
© 2015 by the authors; licensee MDPI, Basel, Switzerland. This article is an open access article distributed under the terms and conditions of the Creative Commons Attribution license (http://creativecommons.org/licenses/by/4.0/).
Share and Cite
Amisigo, B.A.; McCluskey, A.; Swanson, R. Modeling Impact of Climate Change on Water Resources and Agriculture Demand in the Volta Basin and other Basin Systems in Ghana. Sustainability 2015, 7, 6957-6975. https://doi.org/10.3390/su7066957
Amisigo BA, McCluskey A, Swanson R. Modeling Impact of Climate Change on Water Resources and Agriculture Demand in the Volta Basin and other Basin Systems in Ghana. Sustainability. 2015; 7(6):6957-6975. https://doi.org/10.3390/su7066957
Chicago/Turabian StyleAmisigo, Barnabas A., Alyssa McCluskey, and Richard Swanson. 2015. "Modeling Impact of Climate Change on Water Resources and Agriculture Demand in the Volta Basin and other Basin Systems in Ghana" Sustainability 7, no. 6: 6957-6975. https://doi.org/10.3390/su7066957
APA StyleAmisigo, B. A., McCluskey, A., & Swanson, R. (2015). Modeling Impact of Climate Change on Water Resources and Agriculture Demand in the Volta Basin and other Basin Systems in Ghana. Sustainability, 7(6), 6957-6975. https://doi.org/10.3390/su7066957