Article

Who Will Use Pre-Trip Traveler Information and How Will They Respond? Insights from Zhongshan Metropolitan Area, China

1
State Key Laboratory of Ocean Engineering, Shanghai Jiao Tong University, Shanghai 200240, China
2
Key Laboratory of Road and Traffic Engineering of Ministry of Education, Tongji University, Shanghai 200092, China
3
Rotterdam School of Management, Erasmus University, 3062 PA Rotterdam, The Netherlands
*
Author to whom correspondence should be addressed.
Sustainability 2015, 7(5), 5857-5874; https://doi.org/10.3390/su7055857
Submission received: 28 December 2014 / Revised: 3 May 2015 / Accepted: 6 May 2015 / Published: 12 May 2015

Abstract

:
The Intelligent Transportation System (ITS) is able to make the transportation system safer, smoother, and more sustainable. The research and practice of pre-trip traveler information (PTI), an indispensable component of ITS, is very limited in China. With data collected from Zhongshan Metropolitan Area, China, this empirical study revealed the socio-demographics of potential PTI users and feasible travel responses in daily trips under PTI. Young-and-middle-aged, influential, and motorized males were the most potential PTI users, while unemployed young females the least. Among the motorized potential users who habitually traveled by car, the high-income sub-group was least likely to shift travel modes under PTI. The younger white-collar or blue-collar had a lower propensity to shift to bicycle, but the younger blue-collar workers were more likely to shift to walking. The low income preferred to shift to bus rather than elevated light rail due to the difference of travel cost. The findings will facilitate our understanding of the market segments and effects of PTI, improve the system design and implementation strategy, and help address urban traffic and environmental issues throughout China.

1. Introduction and Background

Since the opening up and reform from 1978, China has experienced rapid urbanization and motorization. In the last decade, motorized transportation, especially car use, is increasing fast in Chinese cities, while public transportation is developing slowly and non-motorized transportation is declining [1]. The unbalanced urban travel mode split has led to gradually severe urban traffic problems and become one of the major causes of environmental issues in China.
The Intelligent Transportation System (ITS) is able to make the transportation system safer, smoother, and more sustainable. An Advanced Traveler Information System (ATIS), constituted by two sub-systems, pre-trip traveler information (PTI) and en-route traveler information system, is an indispensable component of ITS [2]. ATIS provides travelers with necessary information and help them make better travel decisions [3]. It could effectively reduce travel time, relieve stress during congestion and alleviate travel disutility. Furthermore, it plays a crucial role in improving travel mode split and addresses urban traffic congestion [4]. Among the pre-trip and en-route traveler information, the latter is more widely researched and used. However, as demonstrated by Abdel-Aty and his colleagues [5], PTI is more effective than en-route traveler information in changing travel mode, as it plays its role before travel begins. Nowadays, ATIS is developing by leaps and bounds in China, but the research and practice of PTI in the Chinese context is still very limited. Who are the potential users of PTI? How are socio-demographic characteristics related to the acceptance and usage of PTI? What would be the users’ responses to the PTI in terms of travel mode shift during daily trips? To facilitate the system design and dissemination strategy of PTI in Chinese cities, questions associated with the market segment and feasible effects of PTI should be clearly answered.
Literature in the past two decades suggested that socio-economics of individuals and households [6], attitudes towards ATIS, and even situations of regional transport systems, are related to PTI use. Socio-economic factors of individuals and their households are likely to affect the utilization of traveler information [6,7]. Petrella and Lappin indicated that potential users in Los Angeles and Seattle tend to be male, well-educated, upper-income, employed, and 26 to 45 years of age, and were more technologically savvy than the general population [8]. Professionals and groups attaching greater importance to making an accurate choice are also found prone to acquiring traveler information [9,10]. Easy access to mobile phones or internet will potentially enhance the possibility of using traveler information [11,12]. With regard to the attitudes towards ATIS, some literature stated that the interest in ATIS is a function of complex demographics, travel behavior, attitudinal factors, and technology interest [12,13,14]. Mehndiratta et al. further characterized three market segments as the (1) control-seekers; (2) the web-heads; and (3) the segment primarily interested in ATIS [13]. Farag and Lyons revealed that social-psychological factors, including habit, attitudes, anticipated emotions, and perceived behavioral control, strongly affect the use of pre-trip public transport information [15]. The differences in transport systems are also found to partially explain the significant differences among the use of advanced traveler information across regions and countries [8,16].
Apart from identifying potential users for market segments, it is also necessary to understand the traveler behavioral consequences of using PTI in order to improve system design and implementation strategy of PTI [6]. Khattack et al. stated that automobile commuters’ in the Bay Area are more likely to change their travel patterns in response to advanced traveler information related to travel time [17]. Polak and Jones initially revealed that in addition to uni-modal pre-trip travel information, regular car users in Birmingham and Athens responded actively to multi-modal pre-trip travel information [16]. Fujiwara et al. indicated that the informed level of travel service given by pre-trip information significantly affects the departure time choice [18]. Rossetti and Lui revealed that the overall performance of the pre-trip information was very likely affected by exogenous information, as ascribed to demand formation and network topology [19]. Shiftan et al. confirmed that pre-trip travel time information has an impact on route-choice behavior and underscored that when experience seeking increases, individuals tend to prefer a route characterized by lower average but greater variance of travel time [20].
In recent years, the research on the potential users of ATIS and their travel responses to ATIS in the Chinese context has attracted increasing attention. Taking Dalian as a case city, Yang and Zhao found that income, travel cost, and having a driving license are strongly related to the use of ATIS among drivers [4]. They also revealed that age, the content of the information, and the use of a mobile phone or internet are significantly associated with the use of ATIS among public transit travelers [21]. An et al. studied commuters' travel behavior under PTI based on the combination of multi-agent and micro-simulation methods and revealed the effectiveness of the research method [22]. Based on a home-interview in the Taichung metropolitan area of Taiwan, Jou et al. underscored the important relationship between some personal and travel behavior characteristics and the propensity of travelers to switch departure time, route, or mode [23]. However, the research in China mainly focused on en-route traveler information and rarely discussed PTI. The majority of PTI-related studies were predominantly conducted in the western context and their findings are not necessarily translatable to the Chinese context.
The present paper added an extension to existing literature on the PTI-related research in the Chinese context. With data collected in Zhongshan Metropolitan Area, China in 2009, this empirical study revealed the socio-demographics of potential PTI users. Then, we chose the motorized potential users who habitually travel by car and investigated their general travel responses to PTI. Finally, focusing on the motorized potential users who were prone to change travel modes under PTI, we explored how the socio-demographics related to the mode shift in three hypothetical scenes with cluster analysis. The findings will facilitate our understanding on the market segments and feasible effects of PTI in the Chinese context, as well as improve the system design and implementation strategy. The findings will also shed light on how to enhance the effectiveness of PTI on switching motorized vehicle use to more sustainable modes, and help address the urban traffic and environmental issues in China.

2. Data and Methods

2.1. Study Area

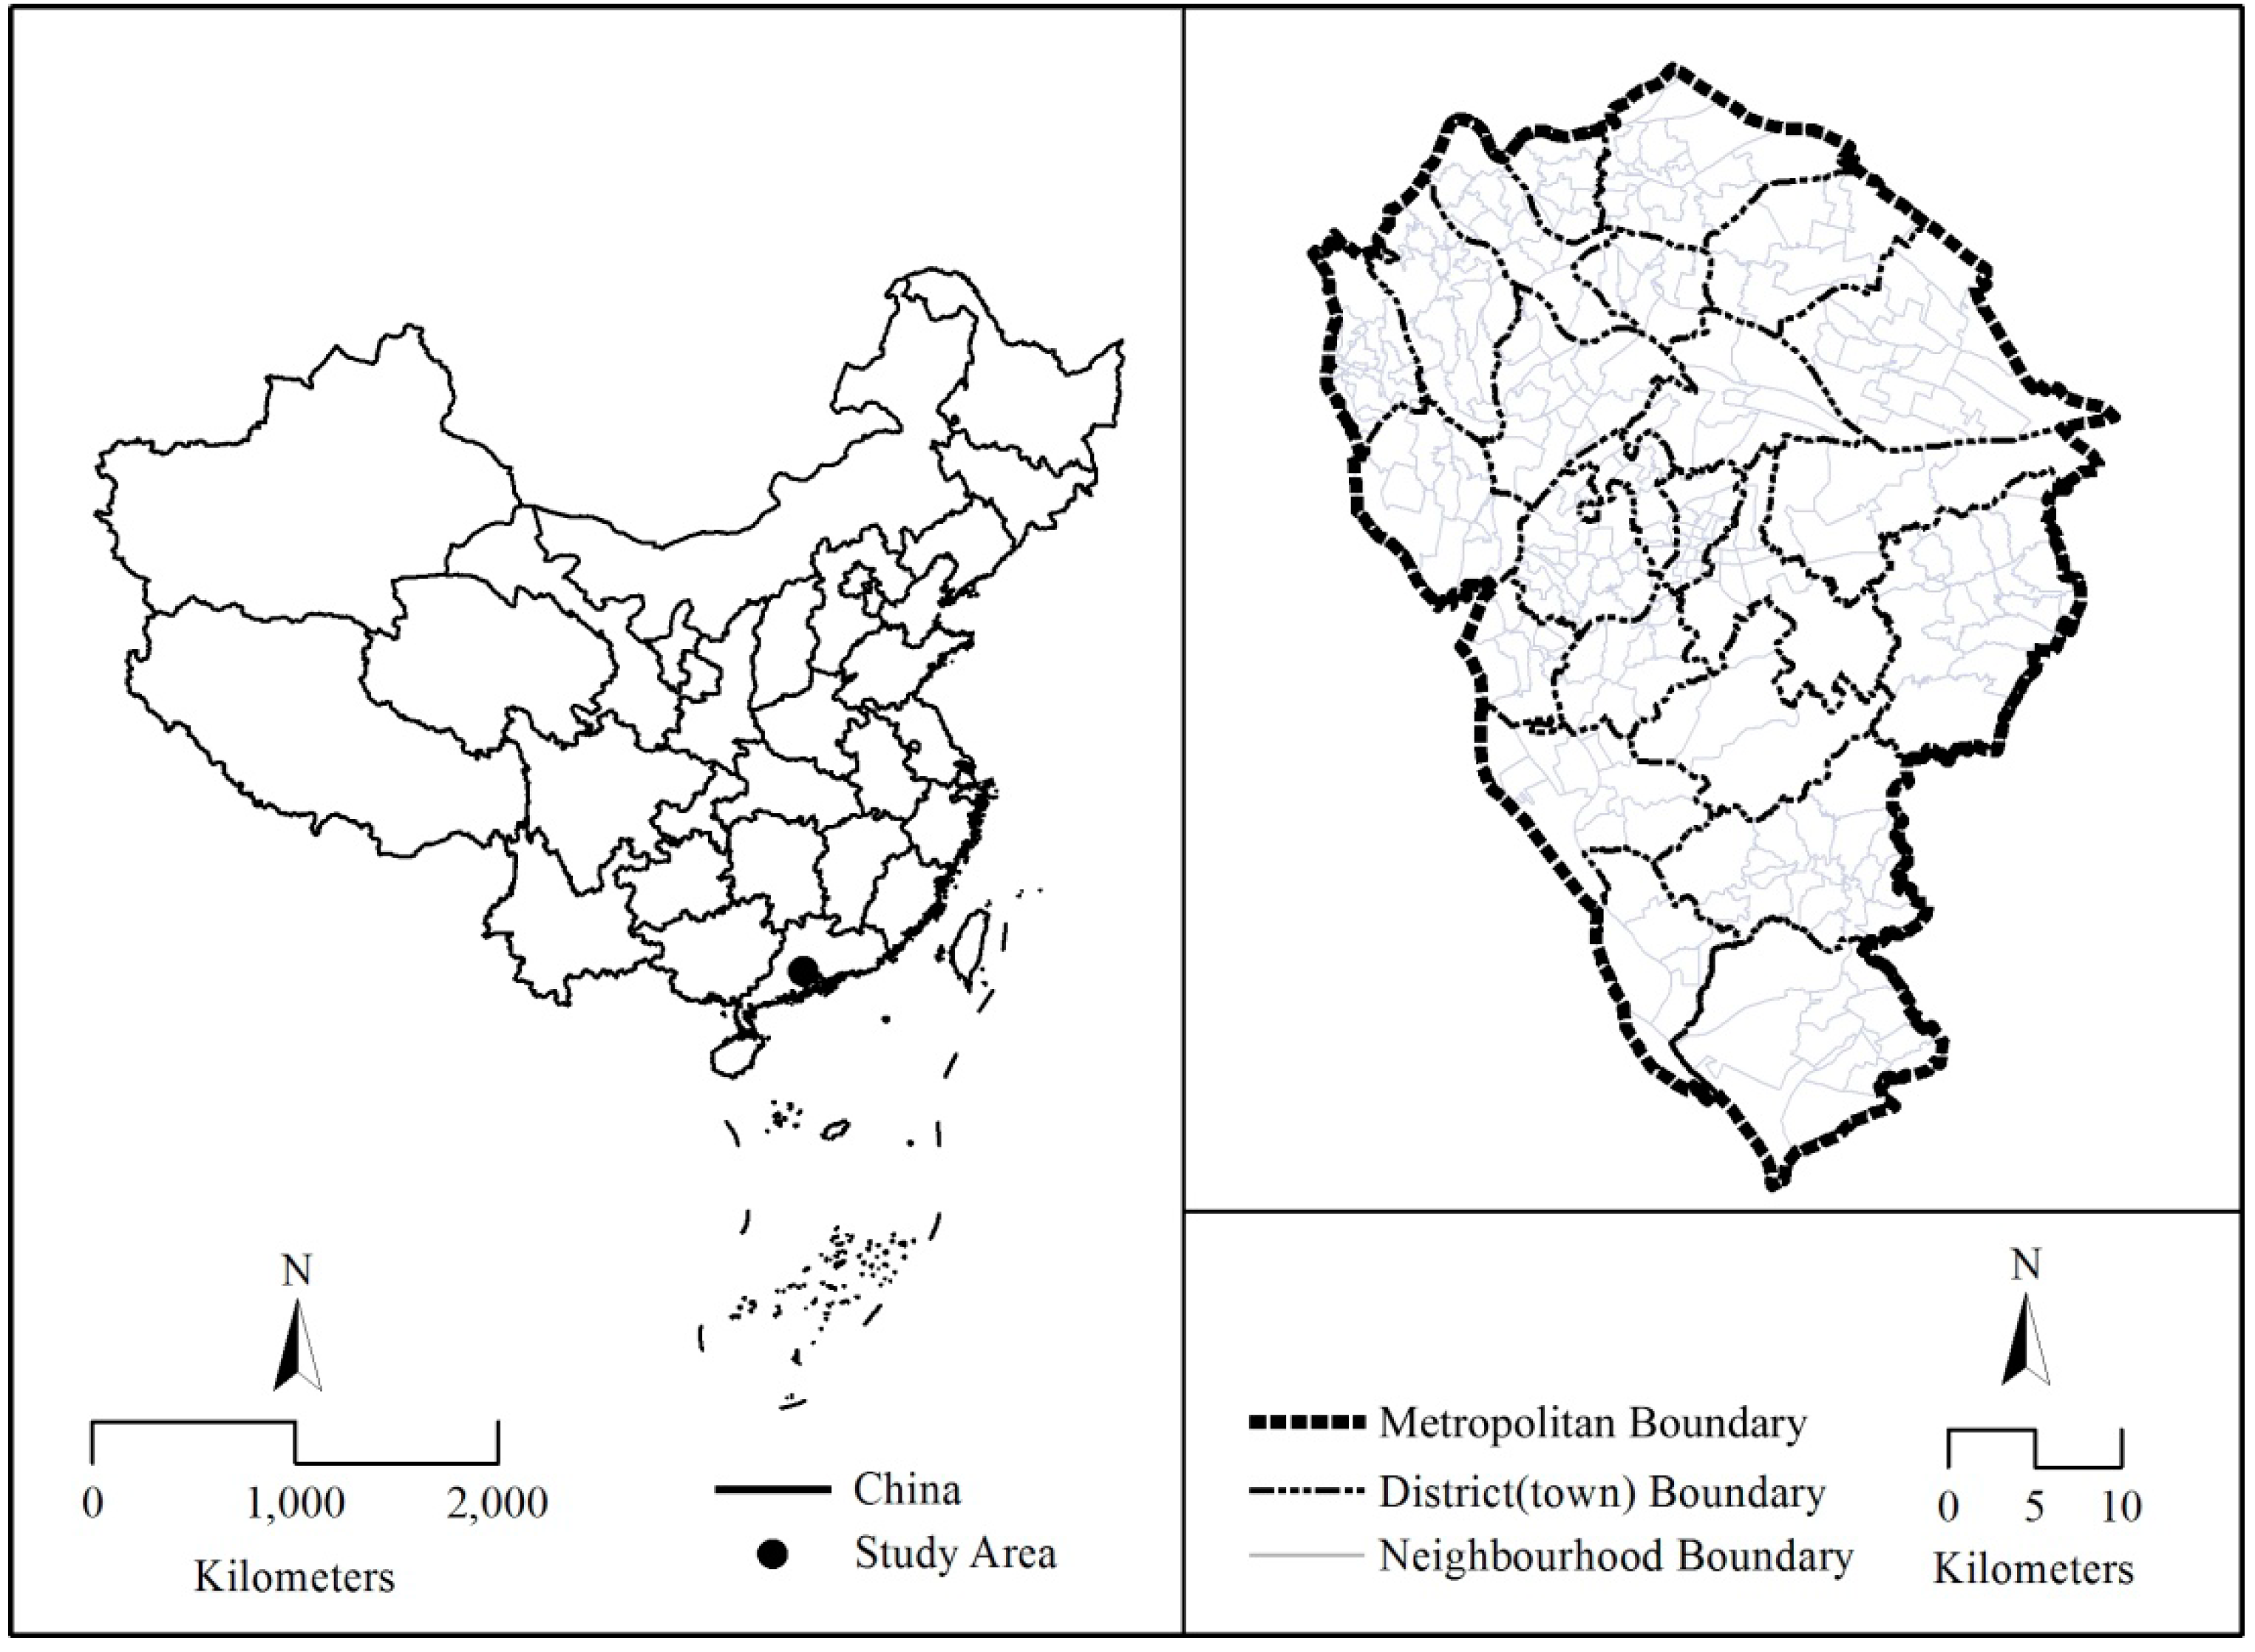
We chose the Zhongshan Metropolitan Area as our study area to examine the socio-demographics of potential PTI users and feasible travel responses under PTI in China’s medium-sized coastal cities with developed economies. Zhongshan is located in Guangdong Province of southern China, and is one of the three largest and most developed coastal urban agglomerations in China (Figure 1), Zhongshan is a medium-sized prefecture-level city with an area of 1800 km2 and a population of 3.1 million [24]. The level of urbanization, income per capita, private car ownership per household and motorcycle ownership per household in Zhongshan (up to 2012) were 1.7-, 1.8-, 1.8-, and 2.8-times China’s average, respectively [24,25]. As of the time of research data collection in 2009, the modal split of car and motorcycle in Zhongshan were 9.2% and 43.4%, respectively [26,27], covering more than half of daily trips. In China’s three largest coastal urban agglomerations, the Yangtze River Delta urban agglomerations, the Pearl River Delta urban agglomerations and the Jing-Jin-Ji urban agglomerations, there are nearly 20 medium-sized cities with similar levels of economic development, urbanization and motorization as Zhongshan. Generally, Zhongshan is representative of a medium-sized coastal city with its strong economy and high level of urbanization and motorization. In recent years, the rapidly increased vehicle use in cities like Zhongshan has led to severe urban traffic and environmental problems. However, little PTI was provided to Zhongshan’s travelers in their daily trips. To investigate the feasible effects of PTI on growing vehicle use, it is imperative to conduct PTI-related studies in China.
Figure 1. Study area. The figure on the left shows the location of Zhongshan Metropolitan Area in China and the figure on the right shows the boundary of the Zhongshan Metropolitan Area.
Sustainability 07 05857 g001

2.2. Data Collection

The data employed in this study was collected by a Traveler Information Attitude Survey (TIAS) and a Household Travel Survey (HTS) in Zhongshan on December, 2009. The HTS provided socio-demographics and a one-day travel diary of the participants, with a sample size of 25325 households (85625 participants) selected by stratified random sampling [28,29]. The TIAS was conducted in the form of a three-stage home-interview simultaneously with the HTS.
  • In Stage 1, we explained to the participants what PTI was and asked if they were prone to use it if available. The participants who were willing to use PTI were defined as potential users and selected as the TIAS participants. The sample size of TIAS was 21,602 participants.
  • In Stage 2, the motorized potential users (2229 participants) who habitually travel by car were selected. We then invited them to respond to the hypothetical PTI as shown in Table 1. We chose the motorized potential users because their possible mode shift under PTI would contribute to the reduction of auto use and help optimize the travel mode split.
  • In Stage 3, 622 participants who chose to “Change modes” in Stage 2 were selected to further respond to three different hypothetical scenes with more detailed context. In this stage, the participants were assumed to take three daily trips that required high travel time reliability. The three trips were different in terms of trip length (short, medium, and long). Before the trips, they would receive the same PTI as in Stage 2 and additional information about alternative modes differentiated from travel time and cost (Table 1). They may choose alternative modes or stick to driving a car. The travel time and cost in Stage 3 was abstracted from the HTS.

2.3. Cluster Analysis

We performed a cluster analysis of the participants in Stage 3 to examine if the socio-demographics have any underlying association with their modal shift under the PTI. Cluster analysis is able to assign observations into clusters so that observations in the same cluster are similar within a set of predetermined dimensions [30]. In this study, a K-means cluster analysis was performed. K-means cluster analysis aims to partition observations into clusters in which each observation belongs to the cluster with the nearest mean. The number of clusters was determined iteratively and heuristically based on the number and size of clusters [31]. Too few or too many clusters may not be adequate and having too few observations in a cluster is often viewed as poor clustering. We concluded five variables of participants’ socio-demographics as listed in Table 2.
Table 1. Details of the pre-trip traveler information (PTI) and alternative travel modes in Stage 2 & 3.
Details of the PTI in Stage 2 & 3
FormShort message service (SMS)
CostFree
ContentUnexpected severe traffic congestion just occurred on the route where you were going to travel through, which would cause delay and potentially make you late for the trip.
Options1 = Change departure time; 2 = Change route; 3 = Change modes;
4 = Change destination; 5 = Cancel the commute; 6 = No change.
Options in three scenes of Stage 3
SceneOptionsEstimated Travel time (min)Estimated Travel cost (Renminbi, 6.21 Renminbi ≈ 1 US Dollar )
Scene 1 (1 km)Walking150
Bicycle50
Bus102
Motorcycle or moped30.25
No change--
Scene 2 (4 km)Elevated light rail *142
Bicycle200
Bus182
Motorcycle or moped121
No change--
Scene 3 (8 km)Elevated light rail *204
Bicycle400
Bus282
Motorcycle or moped242
No change--
* Note: The elevated light rail of Zhongshan was under construction during the survey and was completed at the end of 2010. The average distance between each station is about 3–4 km, making the mode an option for medium and long distance travel. Including this mode in the survey will facilitate the understanding of car commuters’ propensity to shift to elevated light rail under PTI in the future.
Table 2. Variables used in cluster analysis.
VariableDefinition
Age (in years)1 = 18–242 = 25–343 = 35–444 = 45–595 = over 59
Occupation1 = Government administrative4 = Sales or service
2 = Enterprises and institutions5 = Manufacturing, construction or farming
3 = Self-employed6 = Others
Monthly income (in Renminbi)1 =< 3702 = 371–7703 = 771–12004 = 1201–2000
5 = 2001–30006 = 3001–40007 = 4001–50008 => 5001 and more
Monthly travel cost (in Renminbi)1 =< 502 = 51–1003 = 101–2006 = >401
4 = 201–3005 = 301–400
Weekly work hours (hours)1 =< 302 = 31–403 = 41–504 = 51–605 = >61

3. Results

3.1. Stage 1: Socio-Demographics of Potential Users of PTI

As the participants in Stage 1 were self-reported to be highly interested in PTI, even if they may not necessarily be the actual users in the future, they could very likely reflect the characteristics of potential users. A better understanding of the potential users will help to capture the socio-demographics of the most likely users and figure out the market segments. A comparative analysis of the sex, age, occupation, monthly income and habitual travel mode of the potential users and general population was carried out (Table 3). The data in the fourth columns of Table 3 shed light on how potential users resembled, or differed from, the general population in Zhongshan.
Table 3. Socio-demographics of general population and potential users.
CategoryGeneral PopulationPotential UsersDifferences Between General Population And Potential Users
Sex
Male50.42%76.45%+51.63%
Female49.58%23.55%–52.50%
Total100.00%100.00%
Age
<3034.39%22.10%–35.74%
30-5955.50%67.21%+21.10%
>=6013.40%14.32%+6.87%
Total100.00%100.00%
Occupation
Government administrative3.31%4.38%+32.63%
Enterprises and institutions18.94%24.07%+27.09%
Self-employed15.83%19.90%+25.71%
Sales or service6.50%7.27%+11.85%
Manufacturing, construction or farming20.31%23.49%+15.66%
Others6.42%7.91%+23.21%
Student11.89%0.88%–92.60%
Retiree/Unemployed16.80%12.09%–28.04%
Total100.00%100.00%
Monthly income
<1200 (Low income)43.50%32.46%–25.38%
1200–3000 (Middle income)46.75%54.18%+15.89%
>3000 (High income)9.75%13.37%+37.13%
Total100.00%100.00%
Habitual Mode of Daily Trips
Walk12.08%9.38%–22.41%
Bicycle13.69%8.56%–37.47%
Moped8.84%9.45%+6.95%
Bus5.86%4.23%–27.86%
Motorcycle46.50%52.69%+13.33%
Automobile10.45%13.42%+28.42%
Others2.58%2.27%–12.02%
Total100.00%100.00%

3.2. Stage 2: Motorized Potential Users’ Feasible Travel Responses to PTI

In Stage 2, 94.35% of 2209 motorized potential users would change travel behavior as responses to the hypothetical PTI provided to them in the survey, indicating the significant potential of PTI. Changing travel route or modes account for 42.46% and 27.66%, respectively (Figure 2), highlighting the necessity to provide relevant traveler information on route guide and alternative travel modes.
Figure 2. Travel responses of motorized potential users under PTI in Stage 2 (sample size = 2209 participants).
Sustainability 07 05857 g002

3.3. Stage 3

3.3.1. Motorized Potential Users’ Modal Shift in Three Scenes of Stage 3

In Stage 3, about 89% of 622 participants would shift to alternative travel modes in a short, medium or long distance commute. In a short distance commute, walking and motorcycle (moped) were the two major alternatives, covering 36.33% and 31.03%, respectively (Table 4). In a medium distance commute, 44.21% of the participants preferred motorcycle (moped) as an alternative (Table 4). In a long distance commute, the most feasible alternative was elevated light rail, covering nearly half of the modal shift (Table 4). Generally, the participants were less likely to shift to motorcycle (moped) in short and long distance commutes than in medium ones. The results suggested that non-motorcycle modes could potentially become automobile commuters’ prior choices to shift modes under PTI.
Table 4. Motorized potential users’ modal shift in three scenes of Stage 3.
SceneOptionsPercentage
Scene 1 (1 km)Walking36.33%
Bicycle12.22%
Bus9.00%
Motorcycle or moped31.03%
No change11.41%
Scene 2 (4 km)Elevated light rail24.44%
Bicycle5.31%
Bus14.95%
Motorcycle or moped44.21%
No change11.09%
Scene 3 (8 km)Elevated light rail48.55%
Bicycle1.45%
Bus11.74%
Motorcycle or moped27.01%
No change11.25%

3.3.2. Cluster Analysis of Motorized Potential Users Who Would Change Modes under PTI

Five clusters were finally chosen as a result of cluster analysis to best categorize all 622 participants (Table 5). Clusters A and B were both groups with high income and travel cost. Cluster A was generally younger and working less than 40 hours per week. On the contrary, Cluster B was middle-aged with more than 50 work hours per week. Different working hours were related to flexible or fixed work schedules and may impose different stress on commuting time reliability, which would lead to different responses under PTI. Thus, we named Cluster A the “high-income and short work hours” group and Cluster B the “high-income and long work hours” group. Clusters C and D were similar, being young and having middle income and average work hours. However, the major occupations of Cluster C were enterprises, institutions or government departments, whereas Cluster D occupations were manufacturing, construction, farming or others. Therefore, we labeled Cluster C the “young white-collar” group and Cluster D the “young blue-collar” group. Cluster E was the smallest group among the five and featured with low income and middle travel cost. We characterized Cluster E as the “low-income” group.
Table 5. Socio-demographics of participants’ in stage 3 across the five clusters (sample size = 622 participants).
AttributesCluster ACluster BCluster CCluster DCluster E
CategoryHigh-income easy-workingHigh-income hard-workingYoung white collarYoung blue collarLow-income
No. of participants330104848717
Age35–44 (45.15%)45–59 (38.46%)25–34 (42.86%)25–34 (52.87%)45–59 (70.59%)
Occupation (Top two categories above average are listed)Enterprises and institutions (39.09%)
Self-employed (35.45%)
Self-employed (56.73%)/
Manufacturing, construction or farming (6.73%)
Enterprises and institutions (39.29%)/
Government administrative (25.00%)
Others (82.76%) /Manufacturing, construction or farming (11.49%)Manufacturing, construction or farming (35.29%)/
Others (17.65%)
Monthly income (Renminbi)>3000 (71.52%)>3000 (54.81%)1200–3000 (57.14%)1200–3000 (55.17%)<1200 (52.94%)
Monthly travel cost (Renminbi)>300 (96.36%)>300 (77.88%)100–300 (67.86%)>300 (92.86%)100–300 (52.94%)
Weekly work hours (hrs)<40 (39.39%)>50 (48.08%)40–50 (40.48%)40–50 (60.92%)40–50 (47.06%)

3.3.3. Modal Shift across Five Clusters in Response to PTI

  • Scene 1: Short Distance Commute
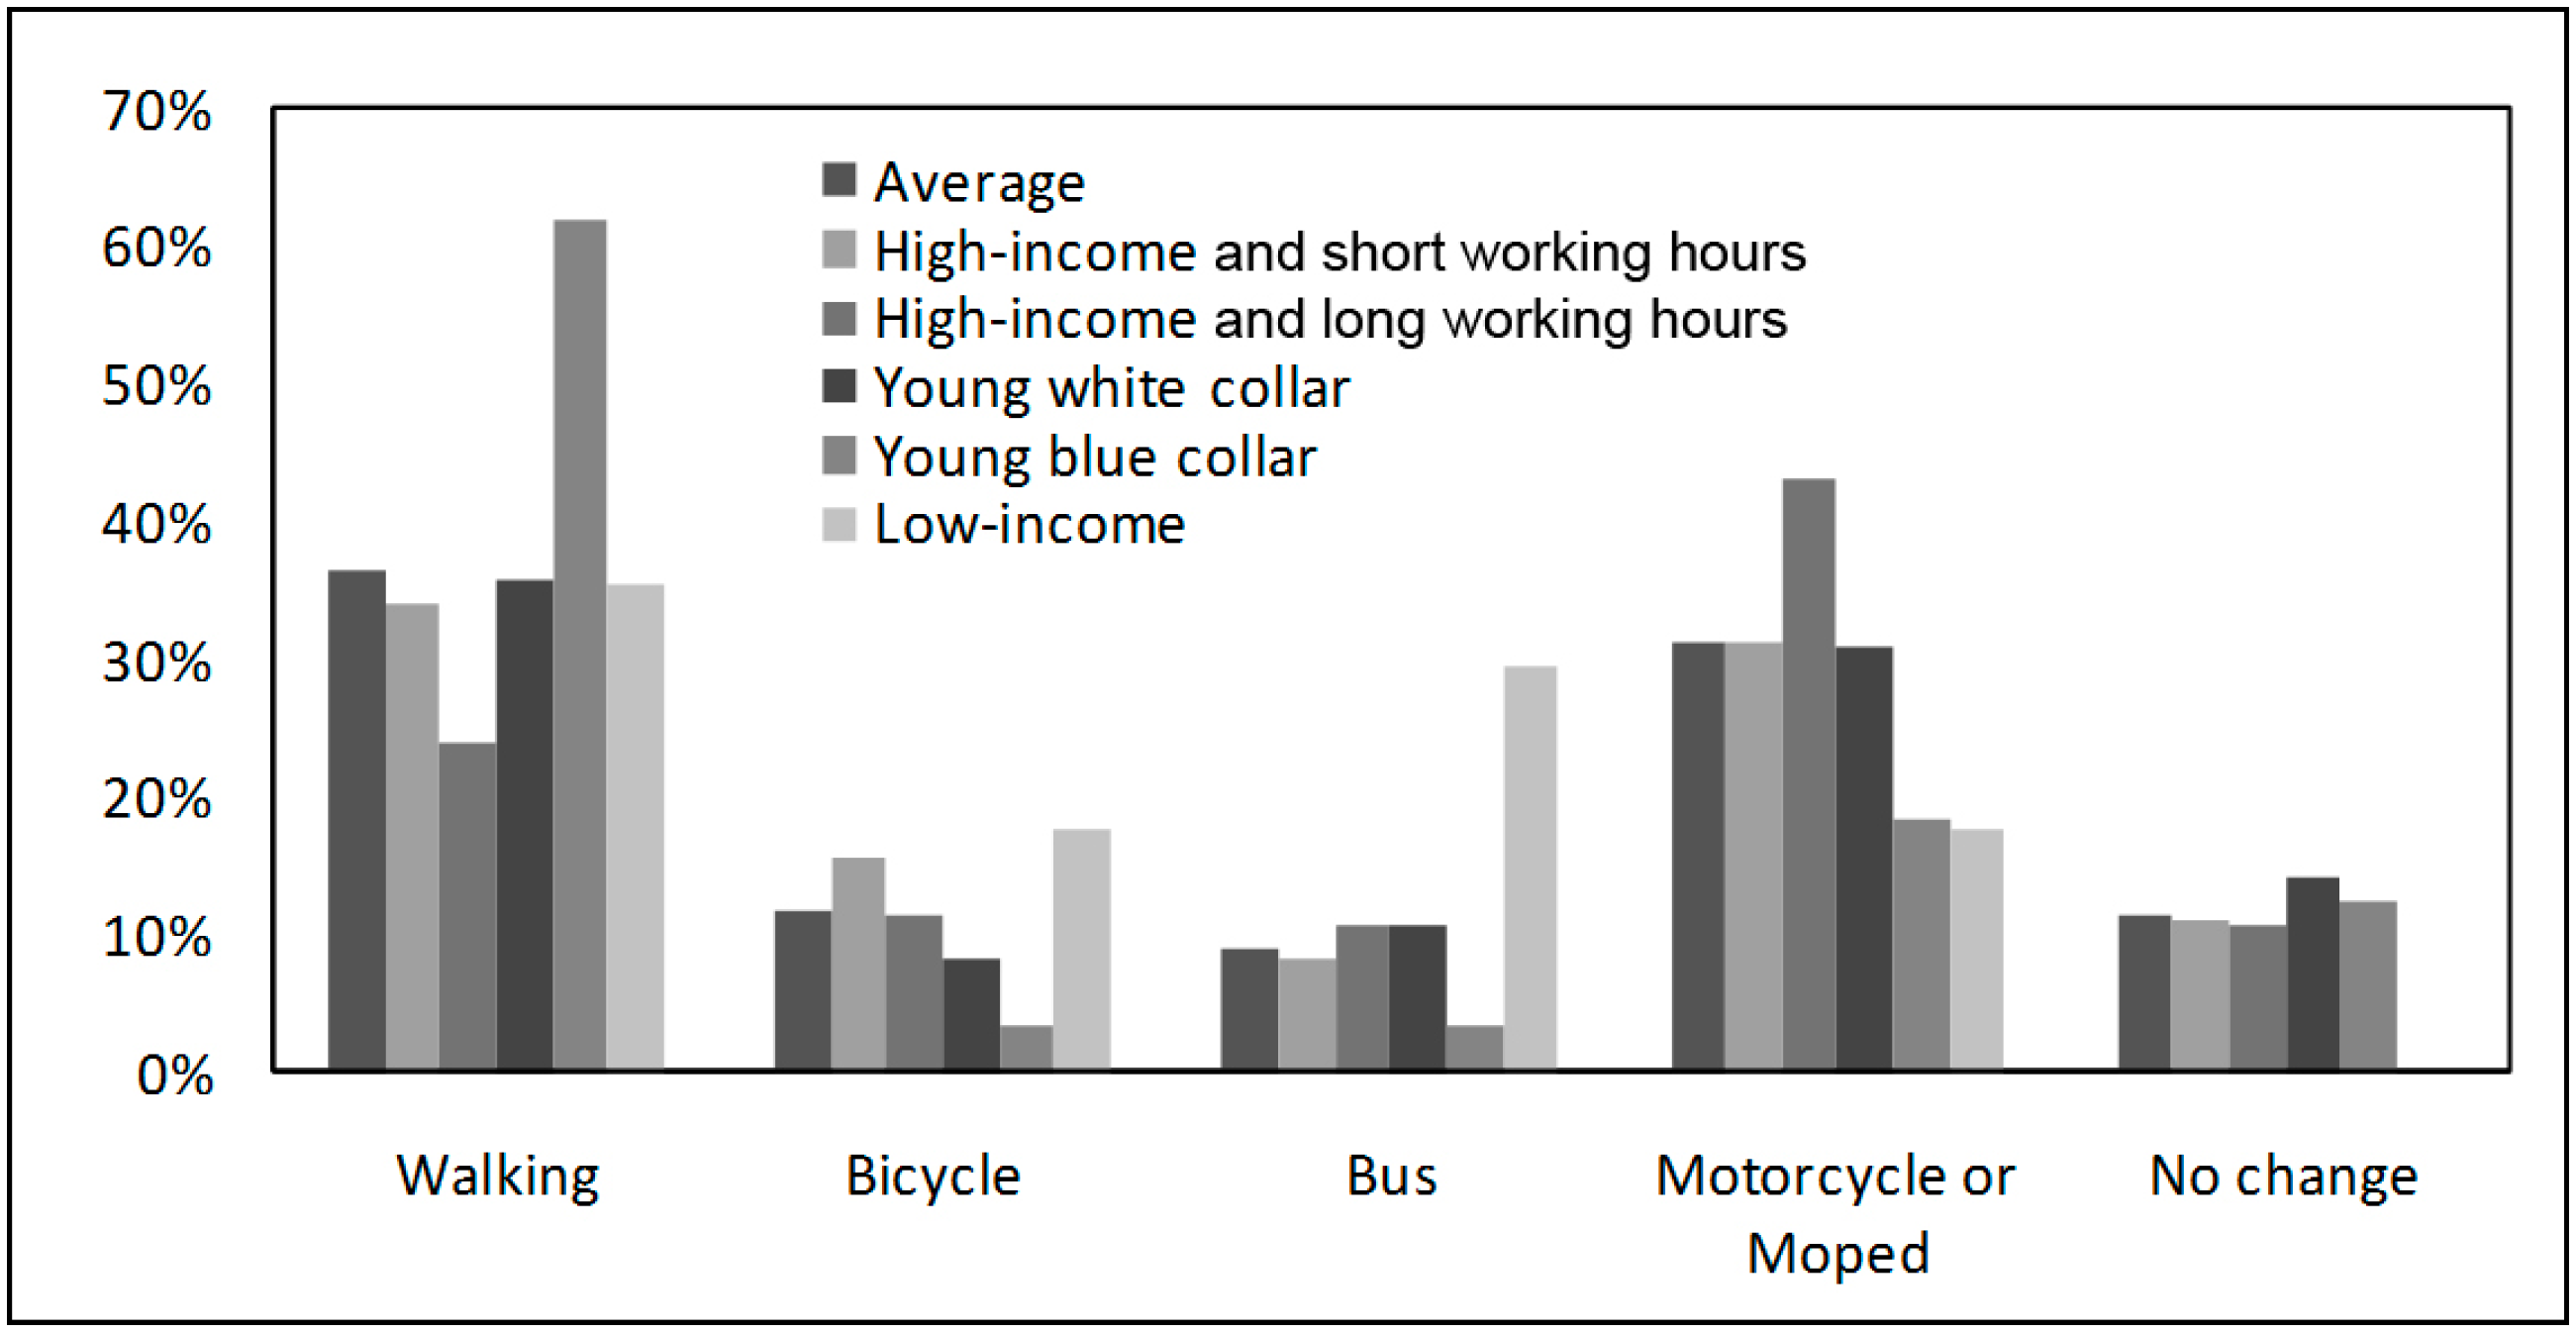
In short distance commute, the high-income, hard-working appeared to be more private motorized as they had the highest propensity to shift to motorcycle (moped) and the lowest to walking (Figure 2). The young white-collar was loyal to automobiles as they demonstrated the lowest propensity to shift modes. The young blue-collar preferred walking, as their choice rate of walking was 1.7 times the average. The low-income group favored bicycle or bus over other modes. The modal shifts of the high-income, easy-working were generally close to the average (Figure 3).
Figure 3. Modal shifts across five clusters in scene 1 (short distance).
Sustainability 07 05857 g003
  • Scene 2: Medium Distance Commute
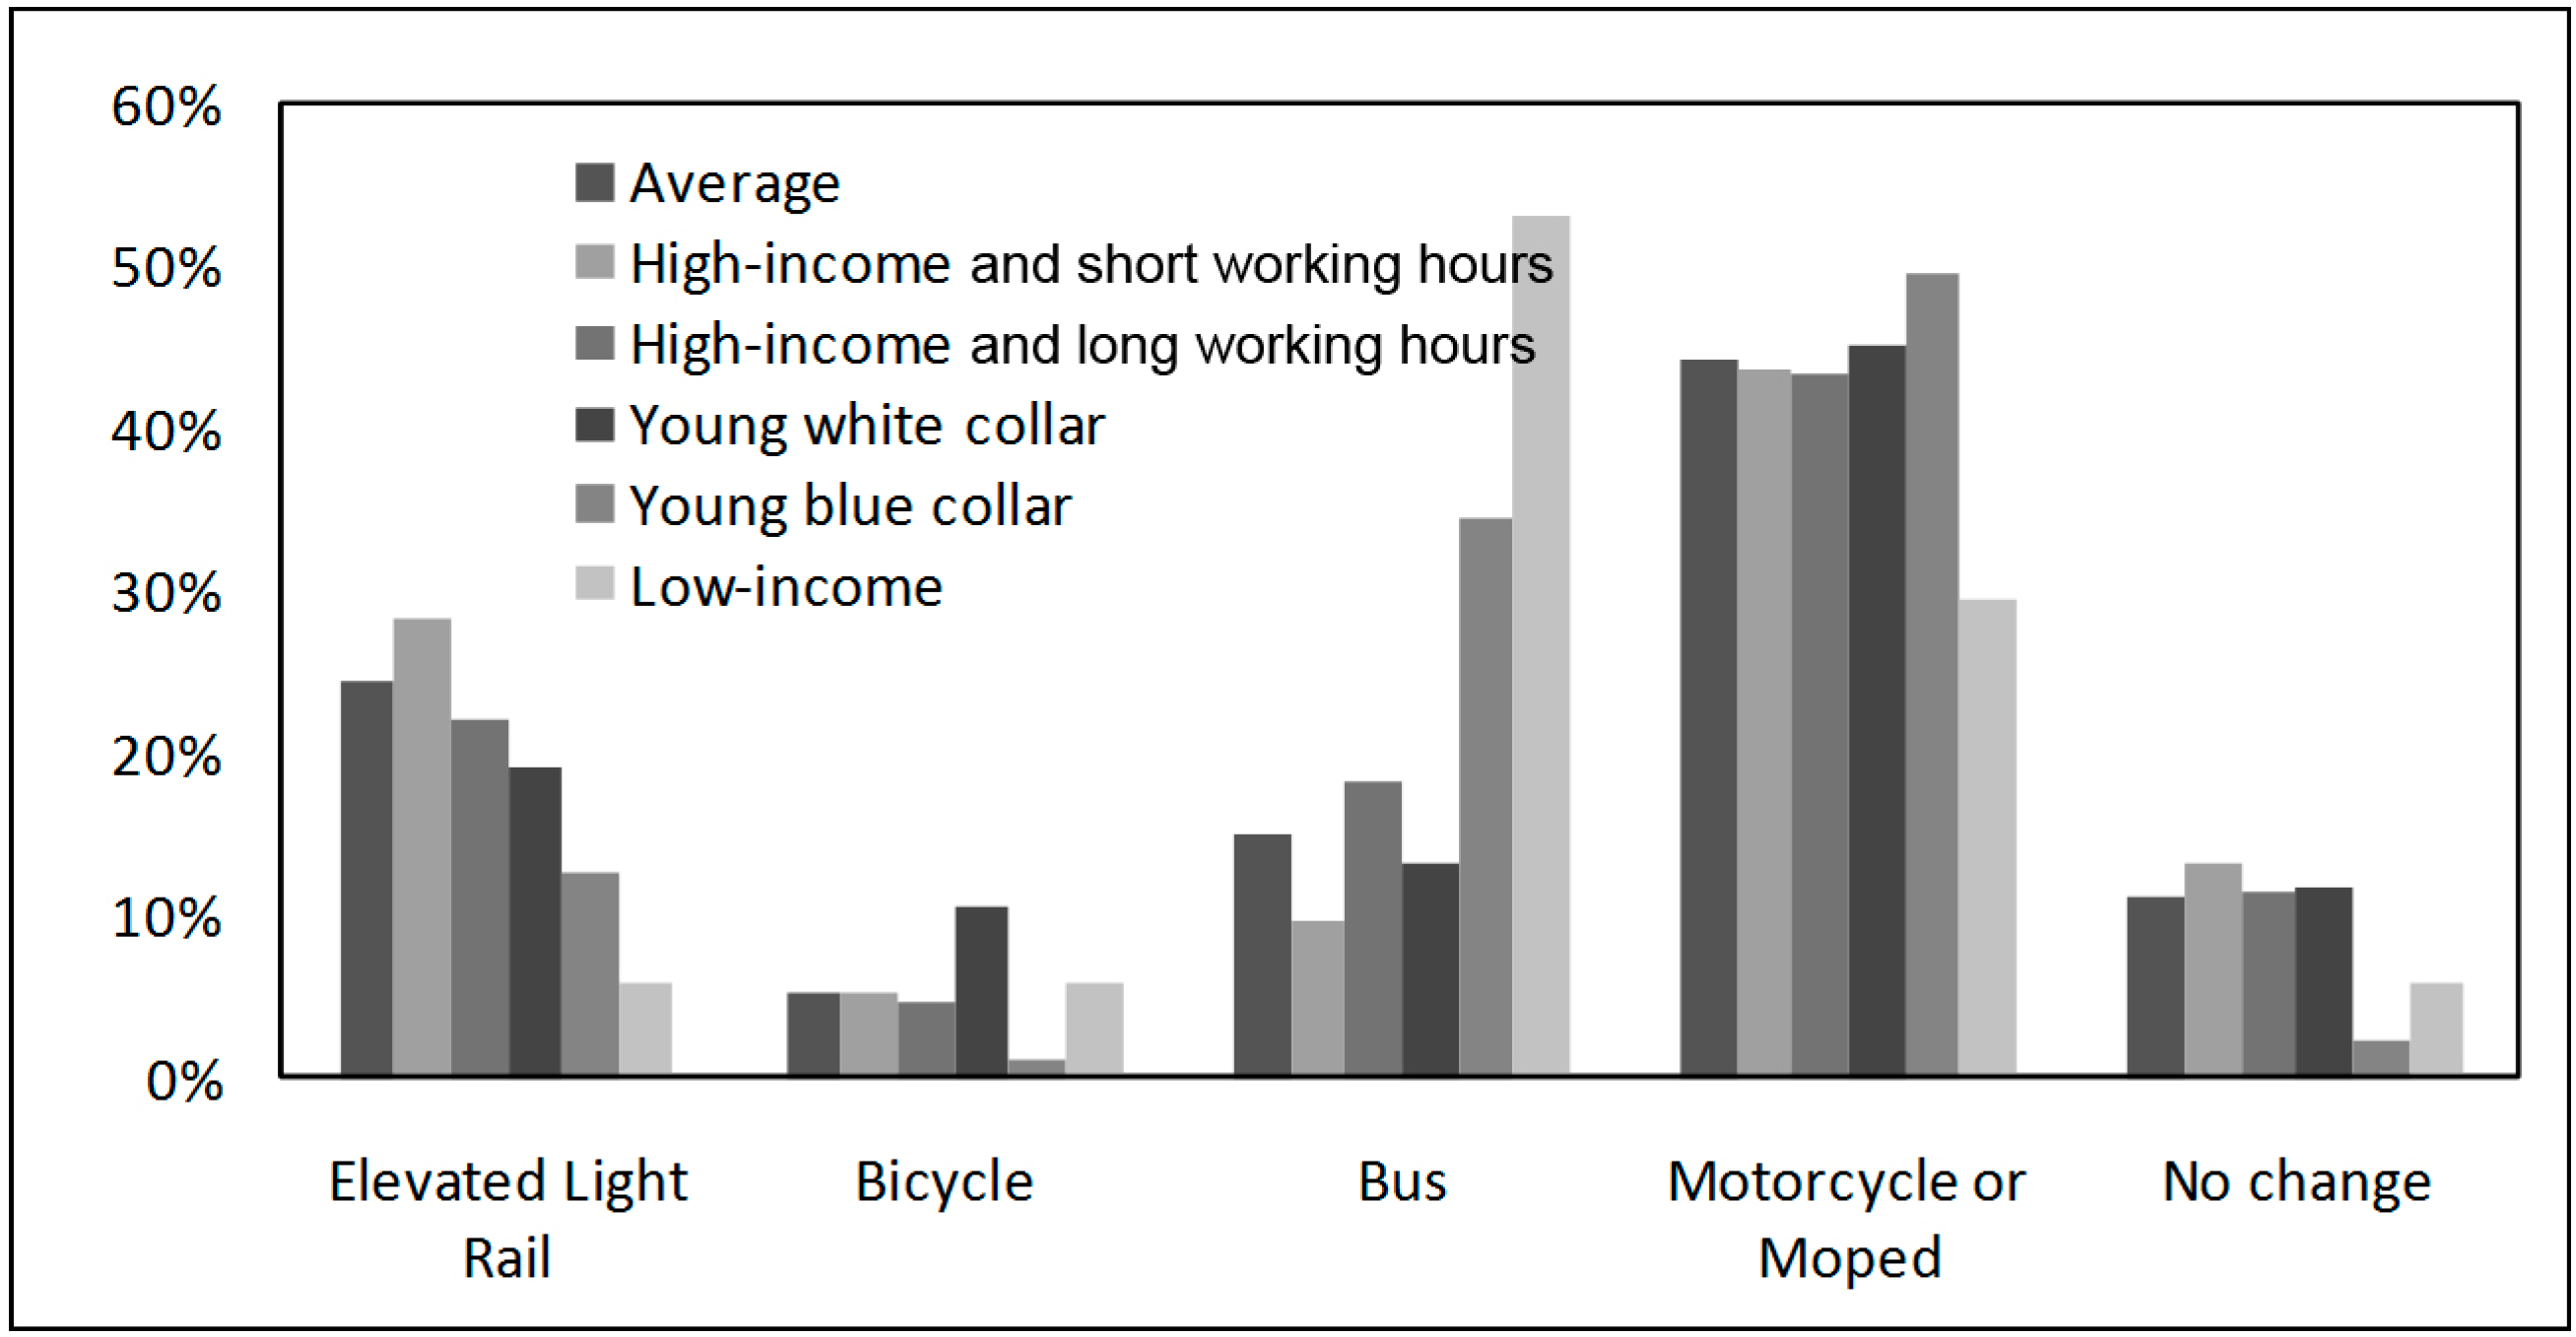
In medium distance commute, the high-income easy-working showed the highest propensity to choose elevated light rail while the lowest to bus (Figure 4). The low-income showed just the opposite with the highest propensity (3.5 times the average) to shift to bus and lowest (0.25 times the average) to elevated light rail. The young white-collar favored bicycle most, as the propensity was two times the average. The young blue-collar, contrary to their white-collar counterparts, had the least propensity (0.2 times the average) to shift to bicycle. The propensity of the high-income hard-working to shift to each mode was close to the average.
Figure 4. Modal shifts across five clusters in scene 2 (medium distance).
Sustainability 07 05857 g004
  • Scene 3: Long Distance Commute
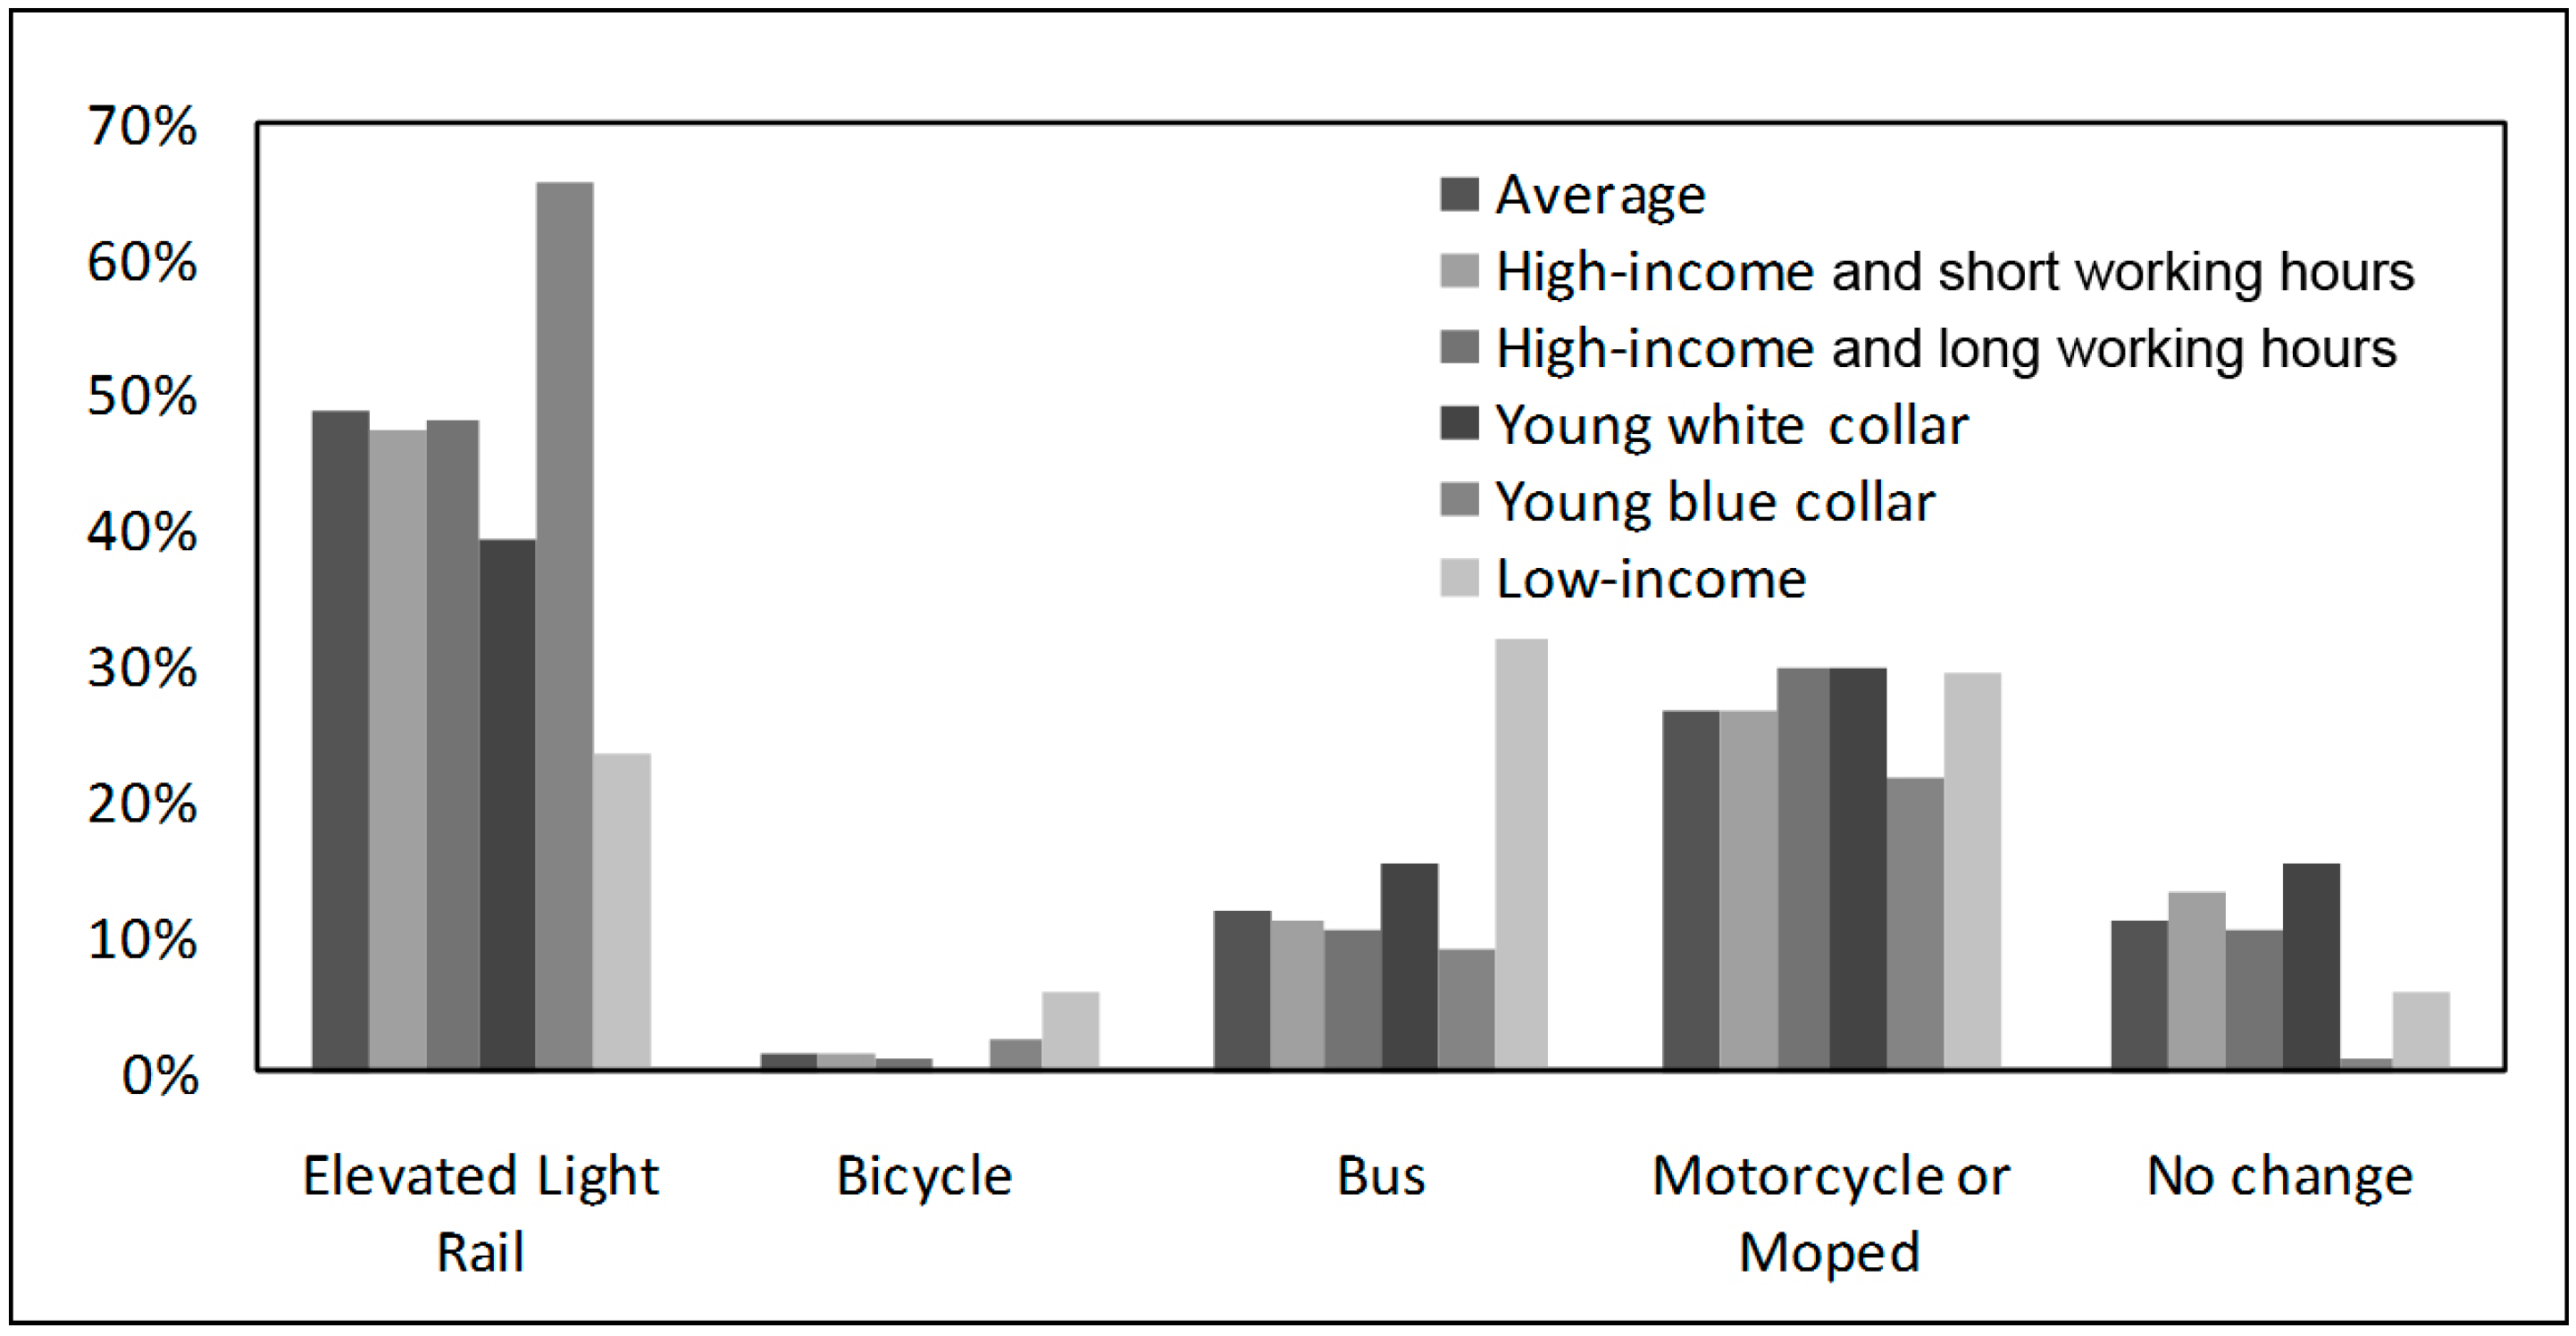
In long distance commute, the young white-collar showed the lowest propensity to shift to bicycle (Figure 5). The young blue-collar preferred elevated light rail most (1.3 times the average) and bus or motorcycle (moped) least. The modal shift of the low-income was similar to that of medium distance commute, as the propensity to shift to bus was the highest (three times the average) and to elevated light rail was the lowest (0.5 times the average). The modal shift propensity of the high-income easy-working and the high-income hard-working was close to the average.
Figure 5. Modal shifts across five clusters in scene 3 (long distance).
Sustainability 07 05857 g005

4. Discussion and Policy Implications

4.1. Identification of Potential Users’ Socio-Demographics

The results of Stage 1 indicated the characteristics of potential users’ socio-demographics from five aspects: sex, age, occupation, monthly income, and habitual travel mode. The result showed that young-to-middle-aged (25–59) and middle-to-high income males that habitually traveled by motorized modes had the highest propensity to utilize PTI. On the contrary, unemployed young (<20) females were the least potential users.
  • Sex: Males covered 76.45% of potential users, a great increase from the general population. Male users are more “wired” and technologically savvy, having higher than average Internet and mobile communications use. Therefore, males can be expected to perceive less difficulty in using PTI. It indicates that male consist of a crucial market segment of PTI in Zhongshan, consistent with findings in previous literature [3].
  • Age: The young-and-middle-aged group (age from 25 to 59) was most interested in PTI, whereas the younger group (age less than 25) was just the opposite. The age group of major potential users in Zhongshan is similar to those of actual users in Los Angeles (64%) and Seattle (54%) [8].
  • Occupation: All working groups’ propensity to utilize PTI is high, while non-working groups, such as students, retirees and the unemployed show less interest. Working groups tend to be the so-called “control seeker” segment in commute trips, who are drawn to PTI due to the desire of greater than average control over their daily trips and better knowledge of their travel times, especially in congested travel environments [13]. The possible benefit of reducing travel time and enhancing travel time reliability brought by PTI reinforces the control ability, which attracts working group as potential users.
  • Monthly Income: The propensity to utilize PTI grew simultaneously with the growth of income. The threshold is 1200 RMB, which is also the threshold of middle income in Zhongshan. According to a study also in Guangdong Province, China, travelers with middle-to-high income have higher value of travel time than low income counterparts, especially in commute trips [32]. Therefore, the middle-and-high income groups are very likely to treasure more the value of commute time, which can be enhanced by using PTI. This is in compliance with previous research findings that upper income travelers are more likely than others to use travel information [8].
  • Habitual Travel Mode: In Zhongshan, private motorized (motorcycle and automobile) commuters are more interested in PTI than non-motorized ones. In recent years, they suffered from worsening traffic congestions more often, which were related to longer commuting time and lower commuting time reliability [26]. Therefore, private motorized commuters will be more likely to benefit from PTI than non-motorized ones.

4.2. Modal Shift Characteristics by Different Clusters under PTI

Based on the analysis of modal shift characteristics of five clusters, we could preliminarily conclude that the modal shift under the PTI was associated with the socio-demographics of the participants. Among the motorized potential users, the high-income and short working hours sub-group was least likely to shift modes. The high-income and long working hours sub-group was least likely to shift to walking. The younger white-or-blue-collar sub-groups had least propensity to shift to bicycle but the younger blue-collar sub-group had a high propensity to shift to walking. The low-income sub-group preferred bus rather than elevated light rail due to the difference of travel cost between the two modes.

4.2.1. Cluster A: The High-Income and Short Working Hours

This cluster was majorly middle-aged and only attracted to bicycle or elevated light rail in short or medium distance. Otherwise, they would still favor automobile over other alternative modes. This cluster is most possibly a group with relatively high social standing and standard of living. This group has a higher than average level of car ownership [26] and driving a private car is one of the symbols of their social standing. The survey data from HTS indicated that they had a high modal split of motorized modes in commute trips. Moreover, they had short work hours, which were possibly related to flexible work schedules. That may impose less stress on commuting time reliability than the group with average-to-long work hours. Therefore, the PTI mentioned in the survey would not have significant effect on their modal shift.

4.2.2. Cluster B: The High-Income and Long Working Hours

The high-income and long working hours cluster, who were majorly middle-aged with high travel cost, were least likely to shift to walking in both three commutes. The long work hours of the group would very possible to impose more pressure on commuting time reliability than other groups. The high travel cost of this cluster indicated that (1) they were willing to pay more to guarantee the commuting time reliability; or (2) they had longer commuting distance. A shift to walking will make them spend more time on commuting, which may explains cluster B’s least propensity to shift to walking. Another possible reason was that after long working hours, they had less strength to commute home by walking.

4.2.3. Cluster C: The Young White-Collar

The cluster of young white-collar had middle income, travel cost and average work hours. They had low propensity to shift to bicycle or elevated light rail. According to a recent study, the willingness to use bicycle is an important factor for young people to own bicycles and ride a bicycle for daily commute [33]. However, the HTS survey of Zhongshan indicated that young people’s willingness to use bicycle is low [26]. That may explain why young white-collar have low propensity to shift to bicycle. The reason for the low propensity to shift to elevated light rail remains unclear and requires further study.

4.2.4. Cluster D: The Young Blue-Collar

The cluster of young blue-collar had middle income, average working hours and high travel cost. They were most likely to shift to walking and unlike to shift to bicycle or bus. The high propensity to shift to walking may reflect the physical advantage of the young blue-collar. Meanwhile, the low propensity to shift to bicycle was very likely out of the same reason as the young white-collar.

4.2.5. Cluster E: The Low-Income

The cluster of low-income, which had low income and middle travel cost, were most likely to shift to bicycle or bus and least likely to shift to elevated light rail. The travel cost of the alternative modes may be an important factor when they considered modal shift. Bicycle and bus cost less compared to the elevated light rail, making them the ideal choices for the group. Therefore, providing traveler information on bus service will be helpful to reinforce their modal shift to bus.

4.3. Policy Implications

To promote the market penetration of pre-trip traveler information among Chinese travelers, it would be necessary to have a clear understanding on the market segments. To enhance the effectiveness of pre-trip traveler information on switch motorized modes to more sustainable modes, it would be a great challenge to improve the system design and implementation strategy of pre-trip traveler information. From the discussions above, we could find out that travelers’ socio-demographics were significantly related to their usage of PTI and possible responses to PTI in commuting trips. The findings in the paper provide insights into four recommendations as below.
  • Choosing young-to-middle-aged (25–59) and middle-to-high income male that habitually traveled by motorized modes as the target groups for the market promotion of PTI.
  • Providing traveler information related to route guide and availability of alternative travel modes to general PTI users under congestions or emergencies to facilitate their change of travel route or modes.
  • Providing specific traveler information to different clusters of motorized potential users according to their different responses to PTI, so as to further encourage their compliance to the information and promote them to shift to sustainable modes.

5. Strengths and Limitations

This study has a number of strengths and limitations. In terms of the strengths, firstly, the study focused on pre-trip traveler information, which is proven to be more effective than en-route traveler information to change travel mode. Secondly, the study examined the potential users of PTI and their feasible responses to PTI in daily commutes in a developing country with rapid urbanization and motorization, which might further promote the comparative research between different contexts. In terms of the limitations, firstly, the survey data were based on self reports, and therefore, may be subject to self report bias. Secondly, the data and analysis presented in this paper were collected on Zhongshan, China; thus their application is limited to similar cities in China.

6. Conclusions

Pre-trip traveler information provides travelers with various travel information and support them to make better decisions on travel behavior. The current research and implementation of PTI in China is still very limited. Taking Zhongshan Metropolitan Area as a case, this study filled an important gap to facilitate our understanding on the socio-demographics of potential PTI users and how they will possibly respond to PTI in the Chinese context.
The result showed that young-to-middle-aged (25–59) and middle-to-high income males that habitually traveled by motorized modes had the highest propensity to utilize PTI. On the contrary, unemployed young (<20) females were the least potential users. The results also suggested that socio-demographics, like age, income, and work hours, were associated with motorized potential user’ modal shift characteristics under the PTI. Among the motorized potential users, the high-income and short working hours sub-group was lease likely to shift modes. The high-income and long working hours sub-group was least likely to shift to walking. The younger white-collar or blue-collar sub-groups had least propensity to shift to bicycle but the younger blue-collar sub-group had a high propensity to shift to walking. The low-income sub-group preferred bus rather than elevated light rail, due to the difference of travel cost between the two modes.
The findings will facilitate our understanding on the market segments and possible effects of PTI in the Chinese context, as well as improve the system design and implementation strategy. The findings will also shed light on how to enhance the effectiveness of PTI on switching motorized vehicle use to more sustainable modes and help address the urban traffic and environmental issues in China.

Acknowledgments

The authors acknowledge the financial support of Project 12&ZD203 and 14BSH032 by National Social Science Foundation of China, and Project 51308336 and 51408065 by National Natural Science Foundation of China.

Author Contributions

In this paper, Yi Zhang designed the research programs, participated in the data collection, analyzed the results, and completed the writing of the introduction, results and discussion; Xiaoguang Yang committed to the design of the survey and data collection, and the writing of corresponding parts; Qixing Liu carried out the data process and completed the writing work of corresponding parts; and Chaoyang Li conceived and developed the research ideas and led the research in general.

Conflicts of Interest

The authors declare no conflict of interest.

References

  1. Zhang, Y.; Li, Y.; Yang, X.; Liu, Q.; Li, C. Built Environment and Household Electric Bike Ownership. Transp. Res. Record: J. Transp. Res. Board 2013, 2387, 102–111. [Google Scholar] [CrossRef]
  2. Lyons, G.D. Towards integrated traveller information. Transp. Rev. 2001, 21, 217–235. [Google Scholar] [CrossRef]
  3. Chorus, C.G.; Molin, E.J.E.; van Wee, B. Use and effects of Advanced Traveller Information Services (ATIS): A review of the literature. Transp. Rev. 2006, 26, 127–149. [Google Scholar] [CrossRef]
  4. Yang, Z.; Zhao, S. Factors influencing private car travelers’ choice of atis information: A case study from Dalian. Urban Transp. China 2009, 7, 81–89. [Google Scholar]
  5. Abdel-Aty, M.A.; Vaughn, K.M.; Kitamura, R.; Jovanis, P.P.; Mannering, F.L. Models of commuters’ information use and route choice: Initial results based on a southern California commuter route choice survey. Calif. Partn. Adv. Transit Highw. (PATH). 1993. Available online: http://escholarship.org/uc/item/4d84z60v#page-6 (accessed on 11 May 2015).
  6. Schofer, J.L.; Khattak, A.; Koppelman, F.S. Behavioral issues in the design and evaluation of advanced traveler information systems. Transp. Res. Part C: Emerg. Technol. 1993, 1, 107–117. [Google Scholar] [CrossRef]
  7. Farag, S.; Lyons, G. To use or not to use? An empirical study of pre-trip public transport information for business and leisure trips and comparison with car travel. Transp. Policy 2012, 20, 82–92. [Google Scholar] [CrossRef]
  8. Petrella, M.; Lappin, J. Comparative analysis of customer response to online traffic information in two cities: Los Angeles, California, and Seattle, Washington. Transp. Res. Record: J. Transp. Res. Board 2004, 1886, 10–17. [Google Scholar] [CrossRef]
  9. Emmerink, R.H.; Nijkamp, P.; Rietveld, P.; van Ommeren, J.N. Variable message signs and radio traffic information: An integrated empirical analysis of drivers’ route choice behaviour. Transp. Res. Part A: Policy Pract. 1996, 30, 135–153. [Google Scholar] [CrossRef]
  10. Hato, E.; Taniguchi, M.; Sugie, Y.; Kuwahara, M.; Morita, H. Incorporating an information acquisition process into a route choice model with multiple information sources. Transp. Res. Part C: Emerg. Technol. 1999, 7, 109–129. [Google Scholar] [CrossRef]
  11. Khattak, A.J.; Yim, Y. Traveler response to innovative personalized demand-responsive transit in the San Francisco Bay Area. J. Urban Plan. Dev. 2004, 130, 42–55. [Google Scholar] [CrossRef]
  12. Polydoropoulou, A.; Ben-Akiva, M. The Effect of Advanced Traveler Information Systems (ATIS) on Travelers Behavior. in: Behavioral and Network Impacts of Driver Information Systems; Ashgate Publishing Company: Burlington, VT, USA, 1999. [Google Scholar]
  13. Mehndiratta, S.R.; Kemp, M.A.; Lappin, J.E.; Nierenberg, E. Likely users of advanced traveler information systems: Evidence from the Seattle Region. Transp. Res. Record: J. Transp. Res. Board 2000, 1739, 15–24. [Google Scholar] [CrossRef]
  14. Lappin, J. Advanced Traveler Information Service (ATIS): What do ATIS Customers Want? Available online: http://ntl.bts.gov/lib/17000/17100/17126/PB2000108298.pdf (accessed on 11 May 2015).
  15. Farag, S.; Lyons, G. What Affects Use of Pretrip Public Transport Information?: Empirical Results of a Qualitative Study. Transp. Res. Record: J. Transp. Res. Board 2008, 2069, 85–92. [Google Scholar] [CrossRef]
  16. Polak, J.; Jones, P. The acquisition of pre-trip information: A stated preference approach. Transportation 1993, 20, 179–198. [Google Scholar] [CrossRef]
  17. Khattak, A.; Polydoropoulou, A.; Ben-Akiva, M. Modeling revealed and stated pretrip travel response to advanced traveler information systems. Transp. Res. Record: J. Transp. Res. Board 1996, 1537, 46–54. [Google Scholar] [CrossRef]
  18. Fujiwara, A.; Sugie, Y.; Zhang, J. A survey and analysis method to evaluate influence of pre-trip information on commuter’s travel choice behaviour. In Proceedings of the Second International Conference on Transportation and Traffic Studies, Beijing, China, 31 July–2 August 2000; pp. 754–761.
  19. Rossetti, R.J.; Liu, R. An Agent-Based Approach to Assess Drivers’ Interaction with Pre-Trip Information Systems. Intell. Transport. Syst. 2005, 9, 1–10. [Google Scholar]
  20. Shiftan, Y.; Bekhor, S.; Albert, G. Route choice behaviour with pre-trip travel time information. Iet Intell. Transp. Syst. 2011, 5, 183–189. [Google Scholar] [CrossRef]
  21. Yang, Z.; Zhao, S.; Zhang, X. Influencing factors of ATIS information choice behaviors of public transit traveler. J. Transp. Syst. Eng. Inf. Technol. 2009, 9, 29–35. [Google Scholar]
  22. An, S.; Li, J.; Cui, J.-X. Research on Commuter’s Travel Behavior Faced to Multi-agent Under Pre-trip Information. China J. Highw. Transp. 2009, 22, 95–100. [Google Scholar]
  23. Jou, R.-C.; Hu, T.-Y.; Lin, C.-W. Empirical results from Taiwan and their implications for advanced traveler pretrip information systems. Transp. Res. Record: J. Transp. Res. Board 1997, 1607, 126–133. [Google Scholar] [CrossRef]
  24. Zhongshan Municipal Bureau of Statistics. Zhongshan Statistical Yearbook 2013; China Statistics Press: Beijing, China, 2013.
  25. China Statistics Bureau. China Statistical Yearbook 2013; China Statistics Press: Beijing, China, 2013.
  26. Zhongshan Municipal Bureau of Urban Planning. Zhongshan Transportation Development Planning; Zhongshan Municipal Bureau of Urban Planning: Zhongshan, China, 2010.
  27. Zhang, Y.; Wu, W.; Li, Y.; Liu, Q.; Li, C. Does the Built Environment Make a Difference? An Investigation of Household Vehicle Use in Zhongshan Metropolitan Area, China. Sustainability 2014, 6, 4910–4930. [Google Scholar] [CrossRef]
  28. Zhang, Y.; Li, Y.; Liu, Q.; Li, C. The Built Environment and Walking Activity of the Elderly: An Empirical Analysis in the Zhongshan Metropolitan Area, China. Sustainability 2014, 6, 1076–1092. [Google Scholar] [CrossRef]
  29. Zhang, Y.; Yang, X.; Li, Y.; Liu, Q.; Li, C. Household, Personal and Environmental Correlates of Rural Elderly’s Cycling Activity: Evidence from Zhongshan Metropolitan Area, China. Sustainability 2014, 6, 3599–3614. [Google Scholar] [CrossRef]
  30. Kaufman, L.; Rousseeuw, P.J. Finding Groups in Data: An Introduction to Cluster Analysis; John Wiley & Sons: Hoboken, NJ, USA, 2009; Volume 344. [Google Scholar]
  31. Lin, J.; Long, L. What neighborhood are you in? Empirical findings of relationships between household travel and neighborhood characteristics. Transportation 2008, 35, 739–758. [Google Scholar] [CrossRef]
  32. Zong, F.; Juan, Z.; Zhang, H.; Jia, H. Calculation and application of value of travel time. J. Transp. Syst. Eng. Inf. Technol. 2009, 9, 114–119. [Google Scholar]
  33. Li, Z.; Wang, W.; Yang, C.; Ragland, D.R. Bicycle commuting market analysis using attitudinal market segmentation approach. Transp. Res. Part A: Policy Pract. 2013, 47, 56–68. [Google Scholar] [CrossRef]