
Solar Photovoltaic Development in Australia—A Life Cycle Sustainability Assessment Study


Abstract
:1. Introduction
2. Case Study
3. Methodology
3.1. Environmental Life Cycle Assessment
3.2. Life Cycle Costing
3.3. Social Life Cycle Assessment
4. Results
4.1. UQ Solar LCA
4.1.1. Goal and Scope Definition
- (1)
- Location and on-plane irradiation levelThe approximate location of this system is (153°E, 27°S), and the yearly average irradiation collected by modules is 186 W/m2. Annual average power produced per area is 146.6 W/m2 [17].
- (2)
- Module-rated efficiency: 14.7% [25]
- (3)
- System’s performance ratio: 0.75 [26]
- (4)
- Time-frame of data: June 2010–June 2040
- (5)
- Expected lifetime and degradation ratio for PV and balance of system (BOS)PV module warranties: 30 years with 2% of modules repaired and 1% reject [25]Degradation ratio for PV: 0.7% per year [25]Inverters: 15 years with one repair in the lifetime [26]Electric installation: 30 years [26]Mounting structure: 30 years [26]Manufacturing plants (capital equipment): 30 years [26]
- (6)
- Average grid electricity mixAlthough UQ Solar is located in Brisbane, Australia, PV modules used are produced in China. Therefore, China average grid electricity mix (79% hard coal + 16% hydro + 3% oil + 2% nuclear) [27] is used to analyze environmental impacts generated from PV modules production, while Queensland average grid electricity mix (72% black coal + 15% natural gas + 10% coal seam methane + 1% bagasse + 1% hydro + 1% photovoltaic) [27] is used to assess other life cycle processes.
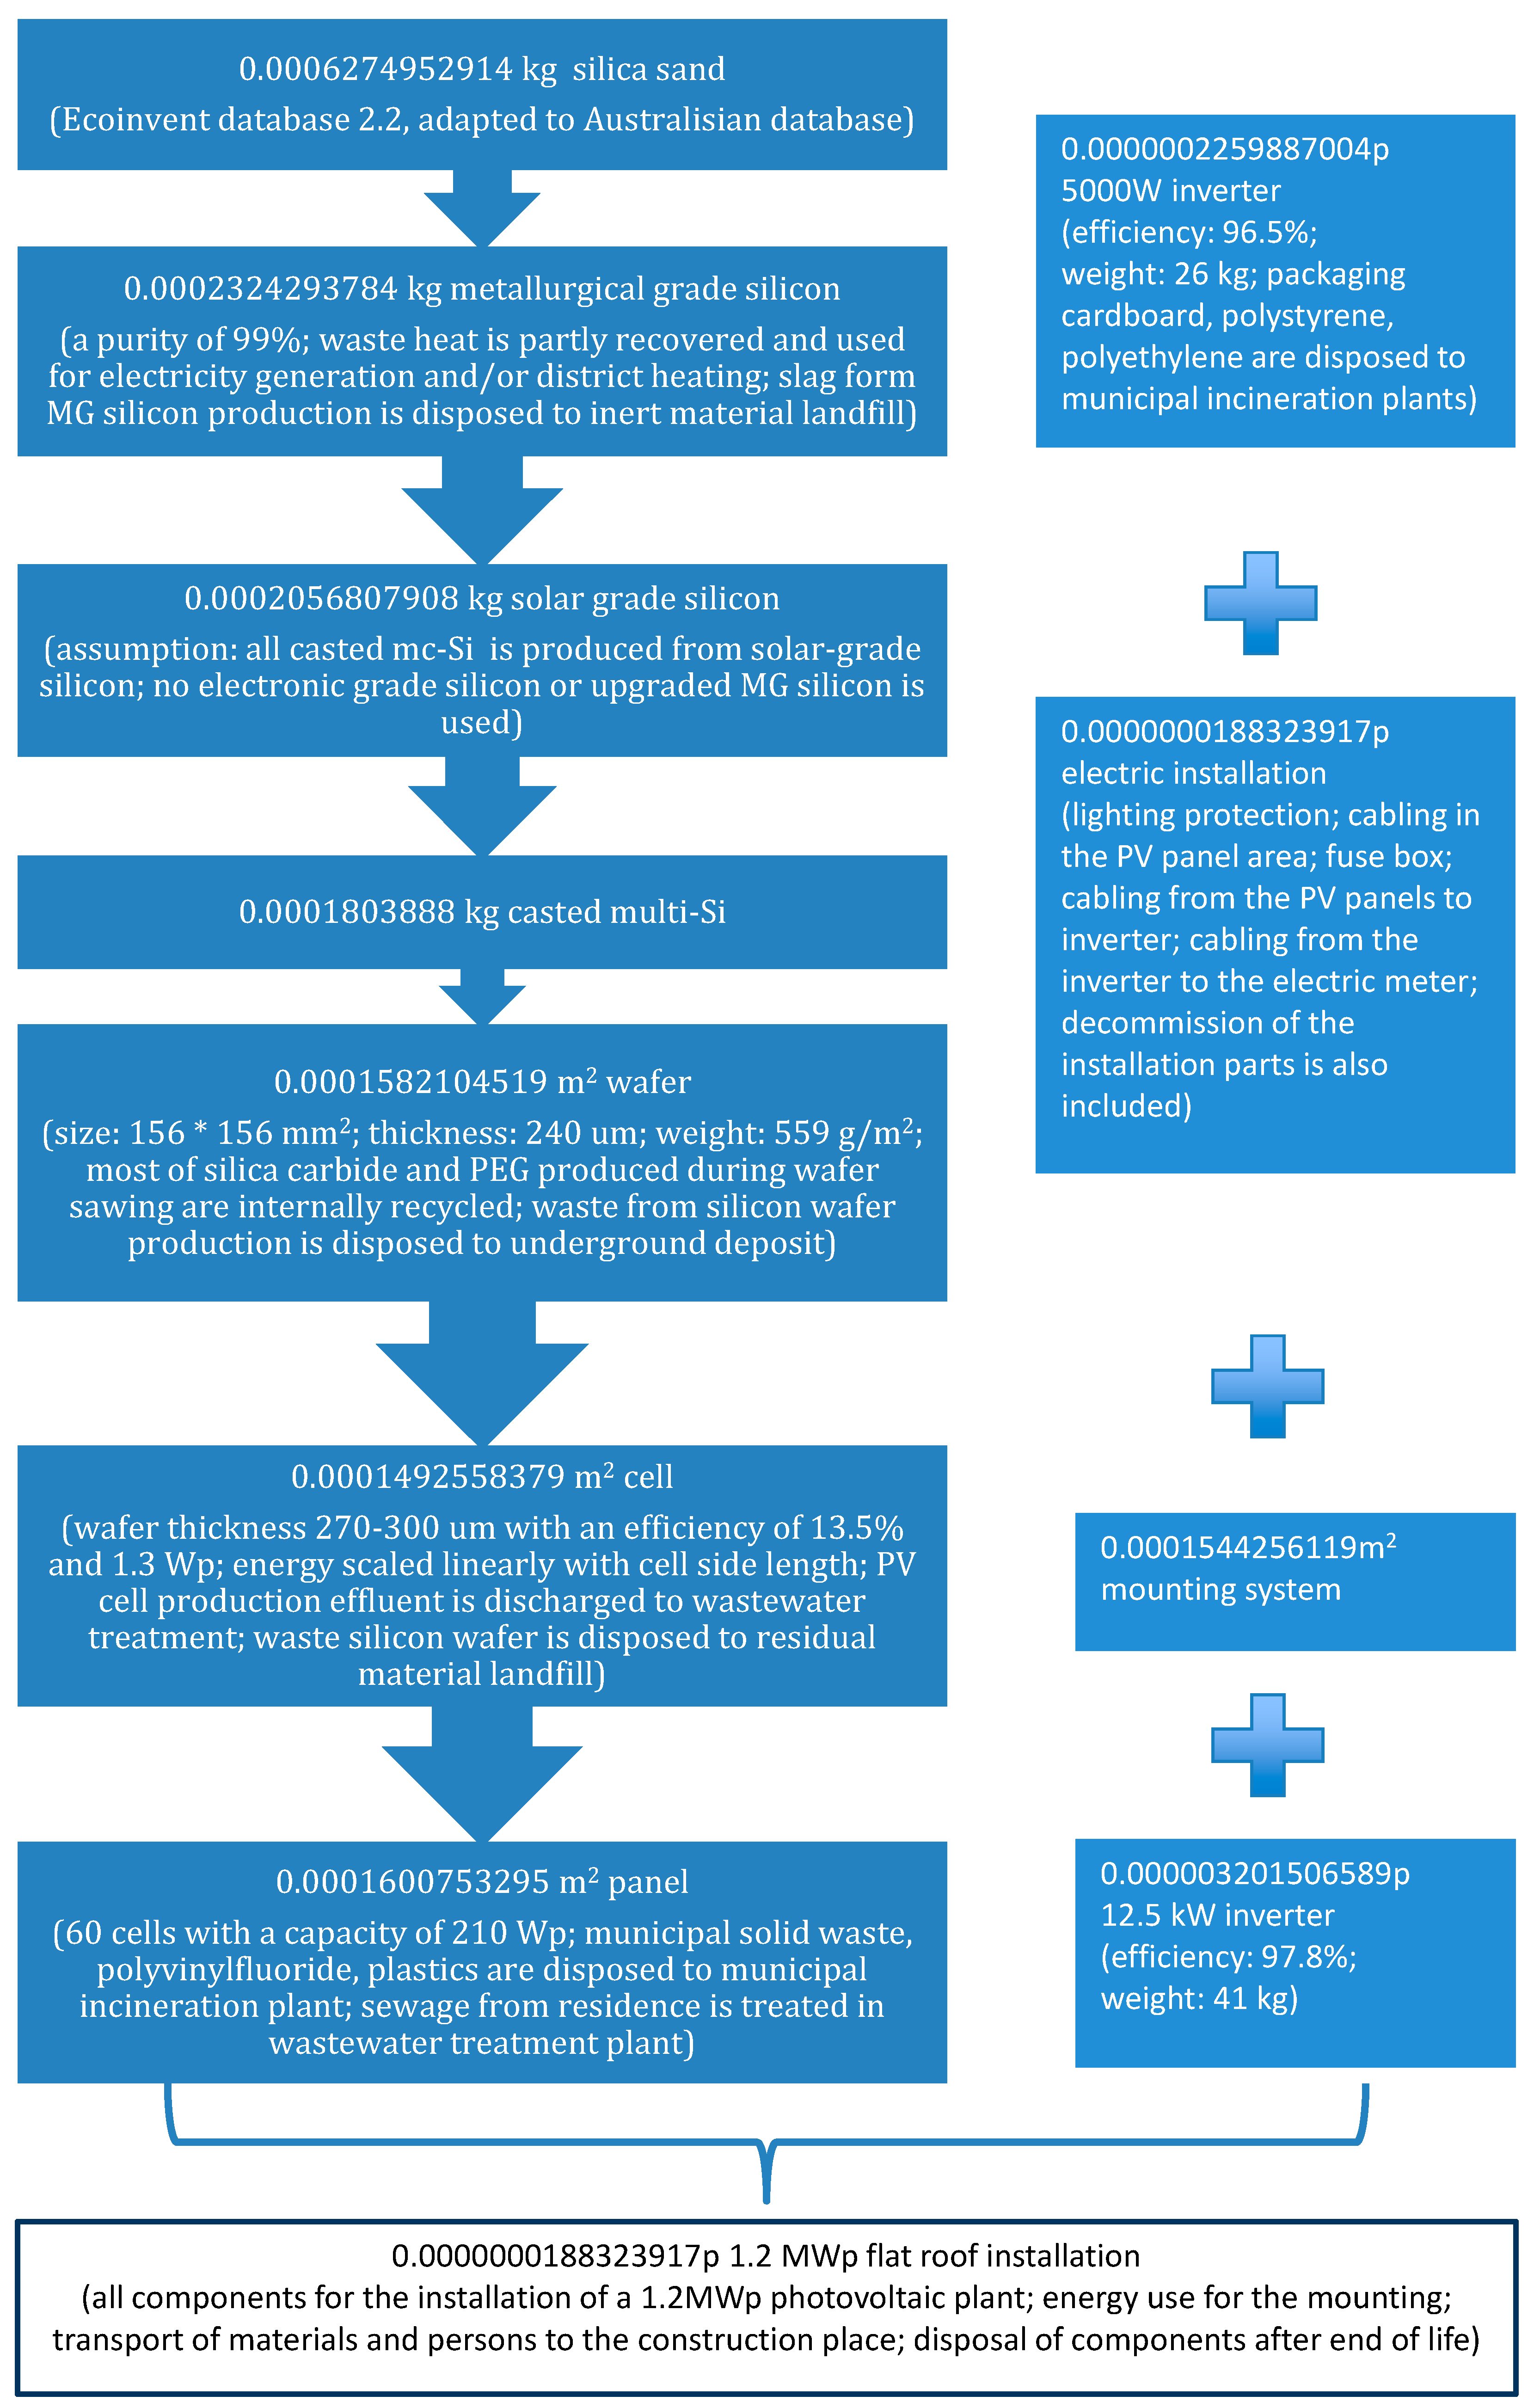
4.1.2. Life Cycle Inventory Analysis

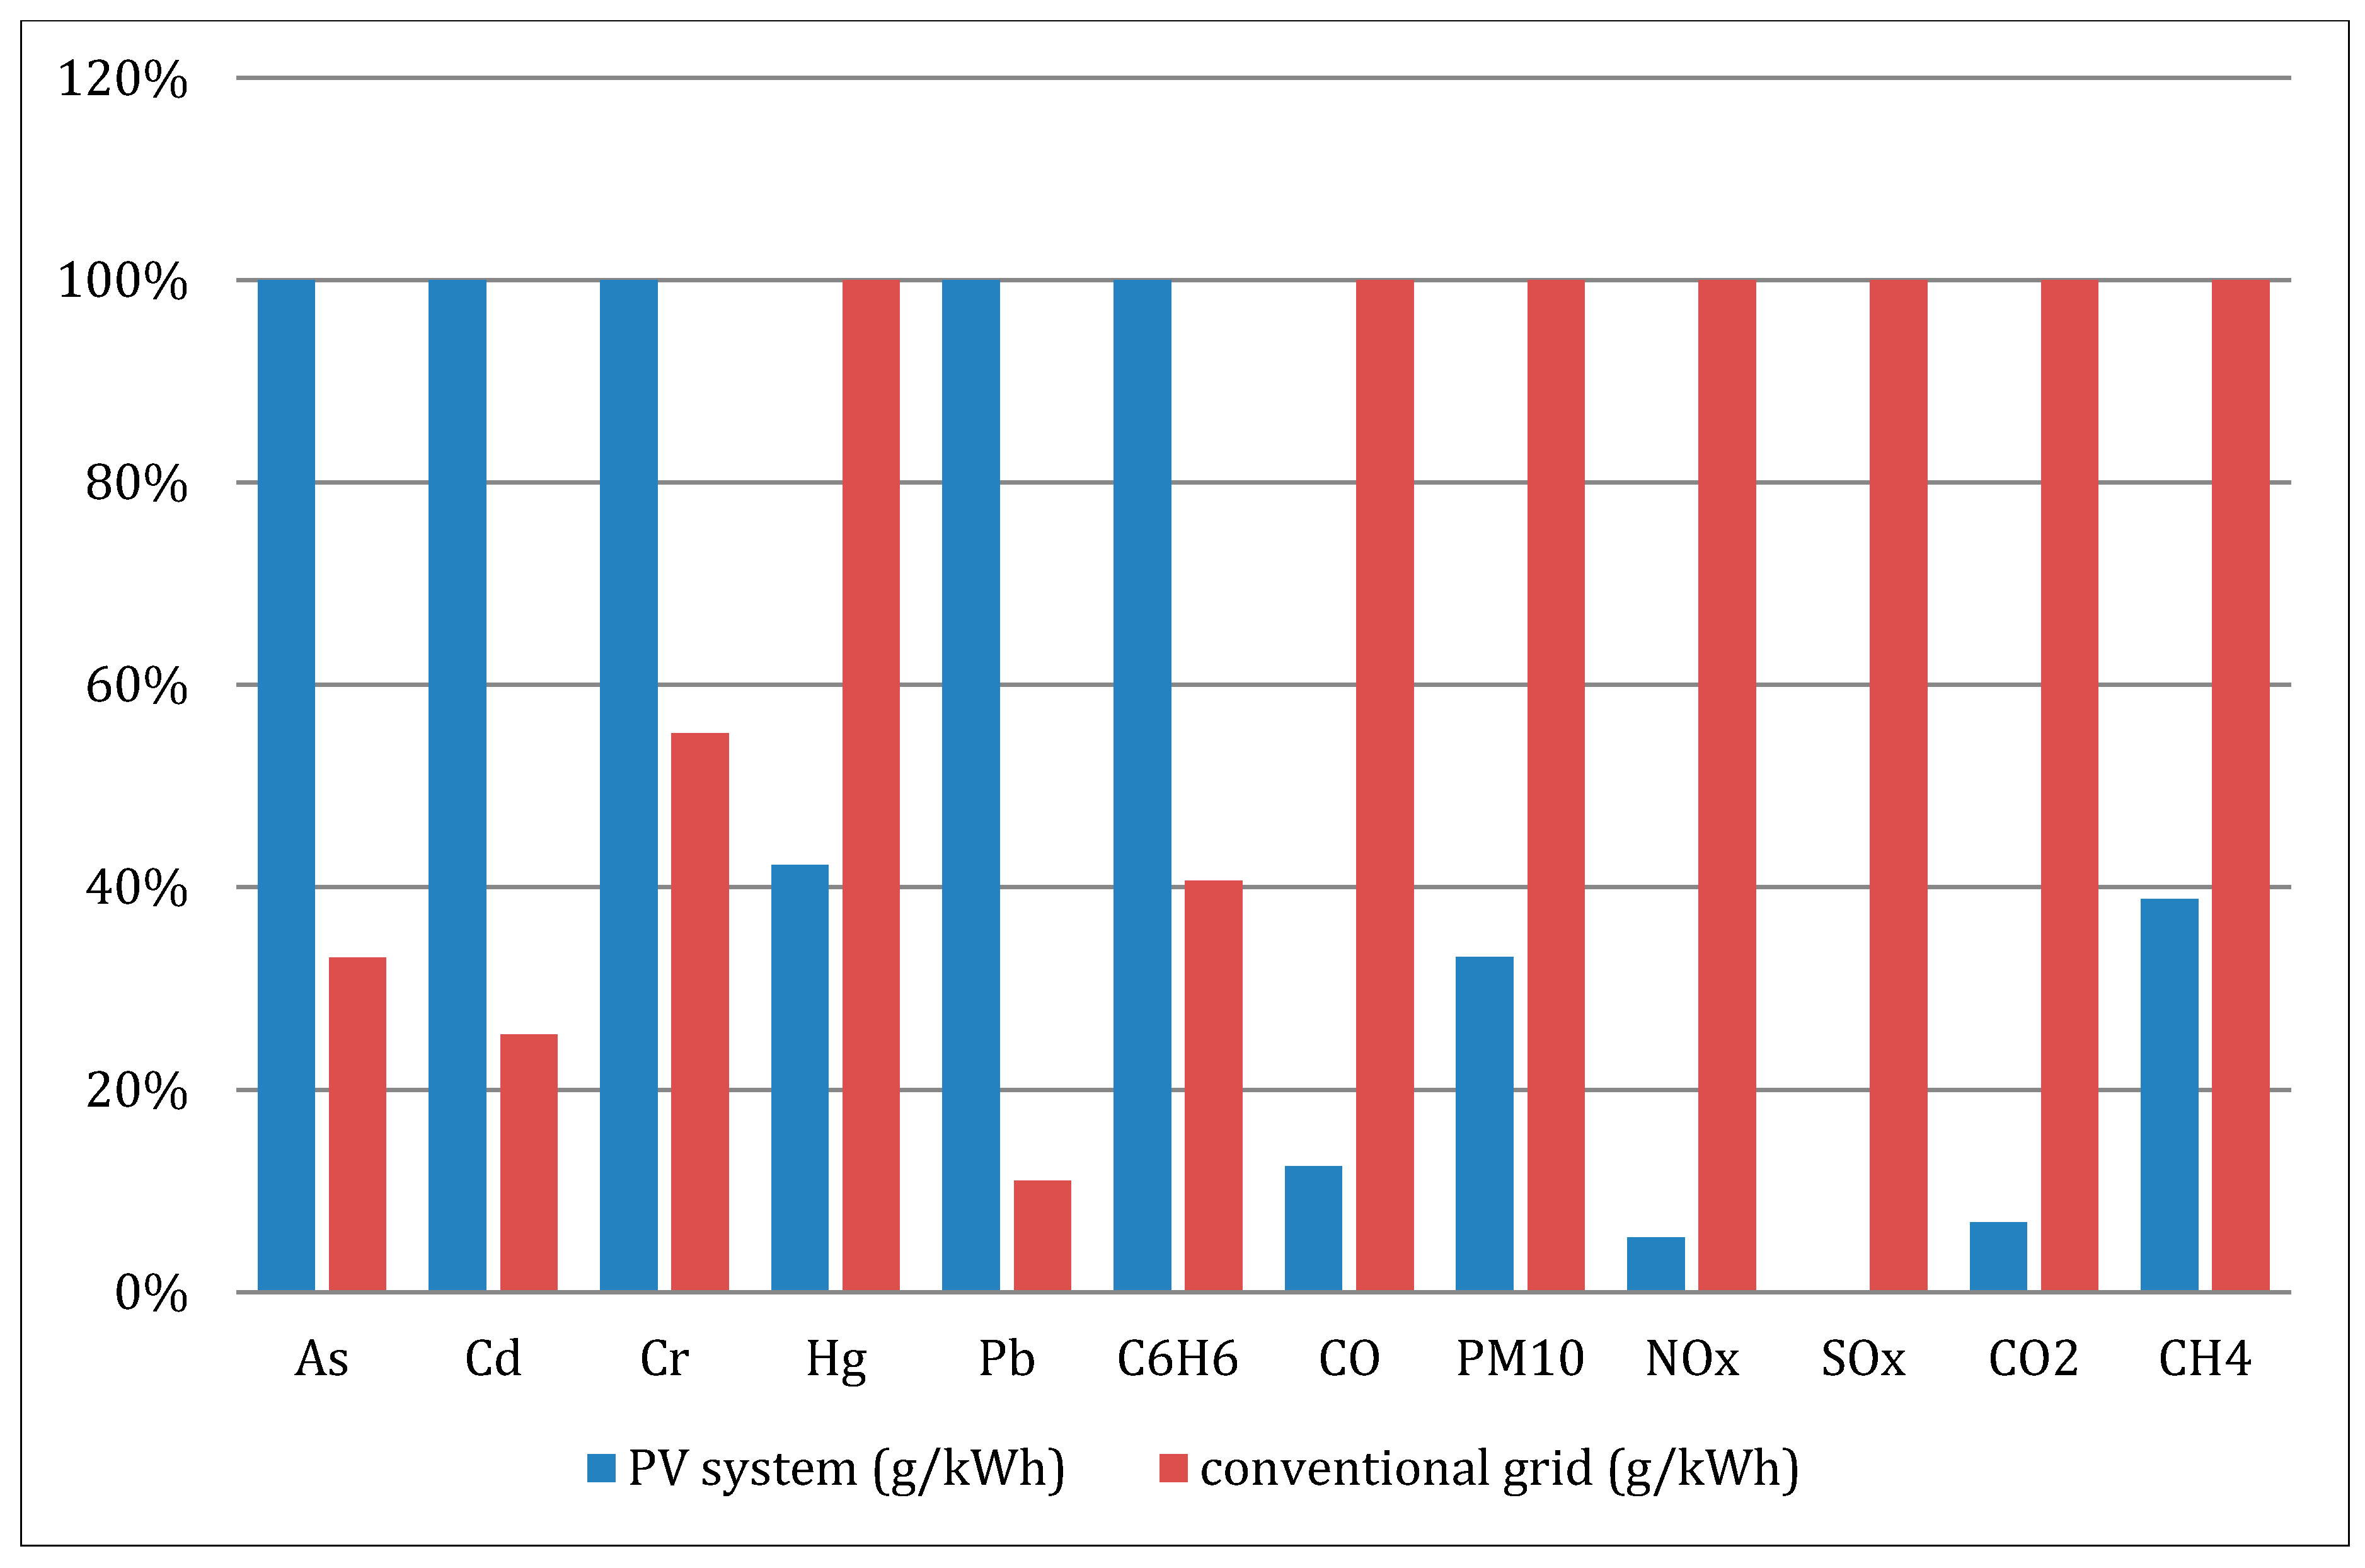
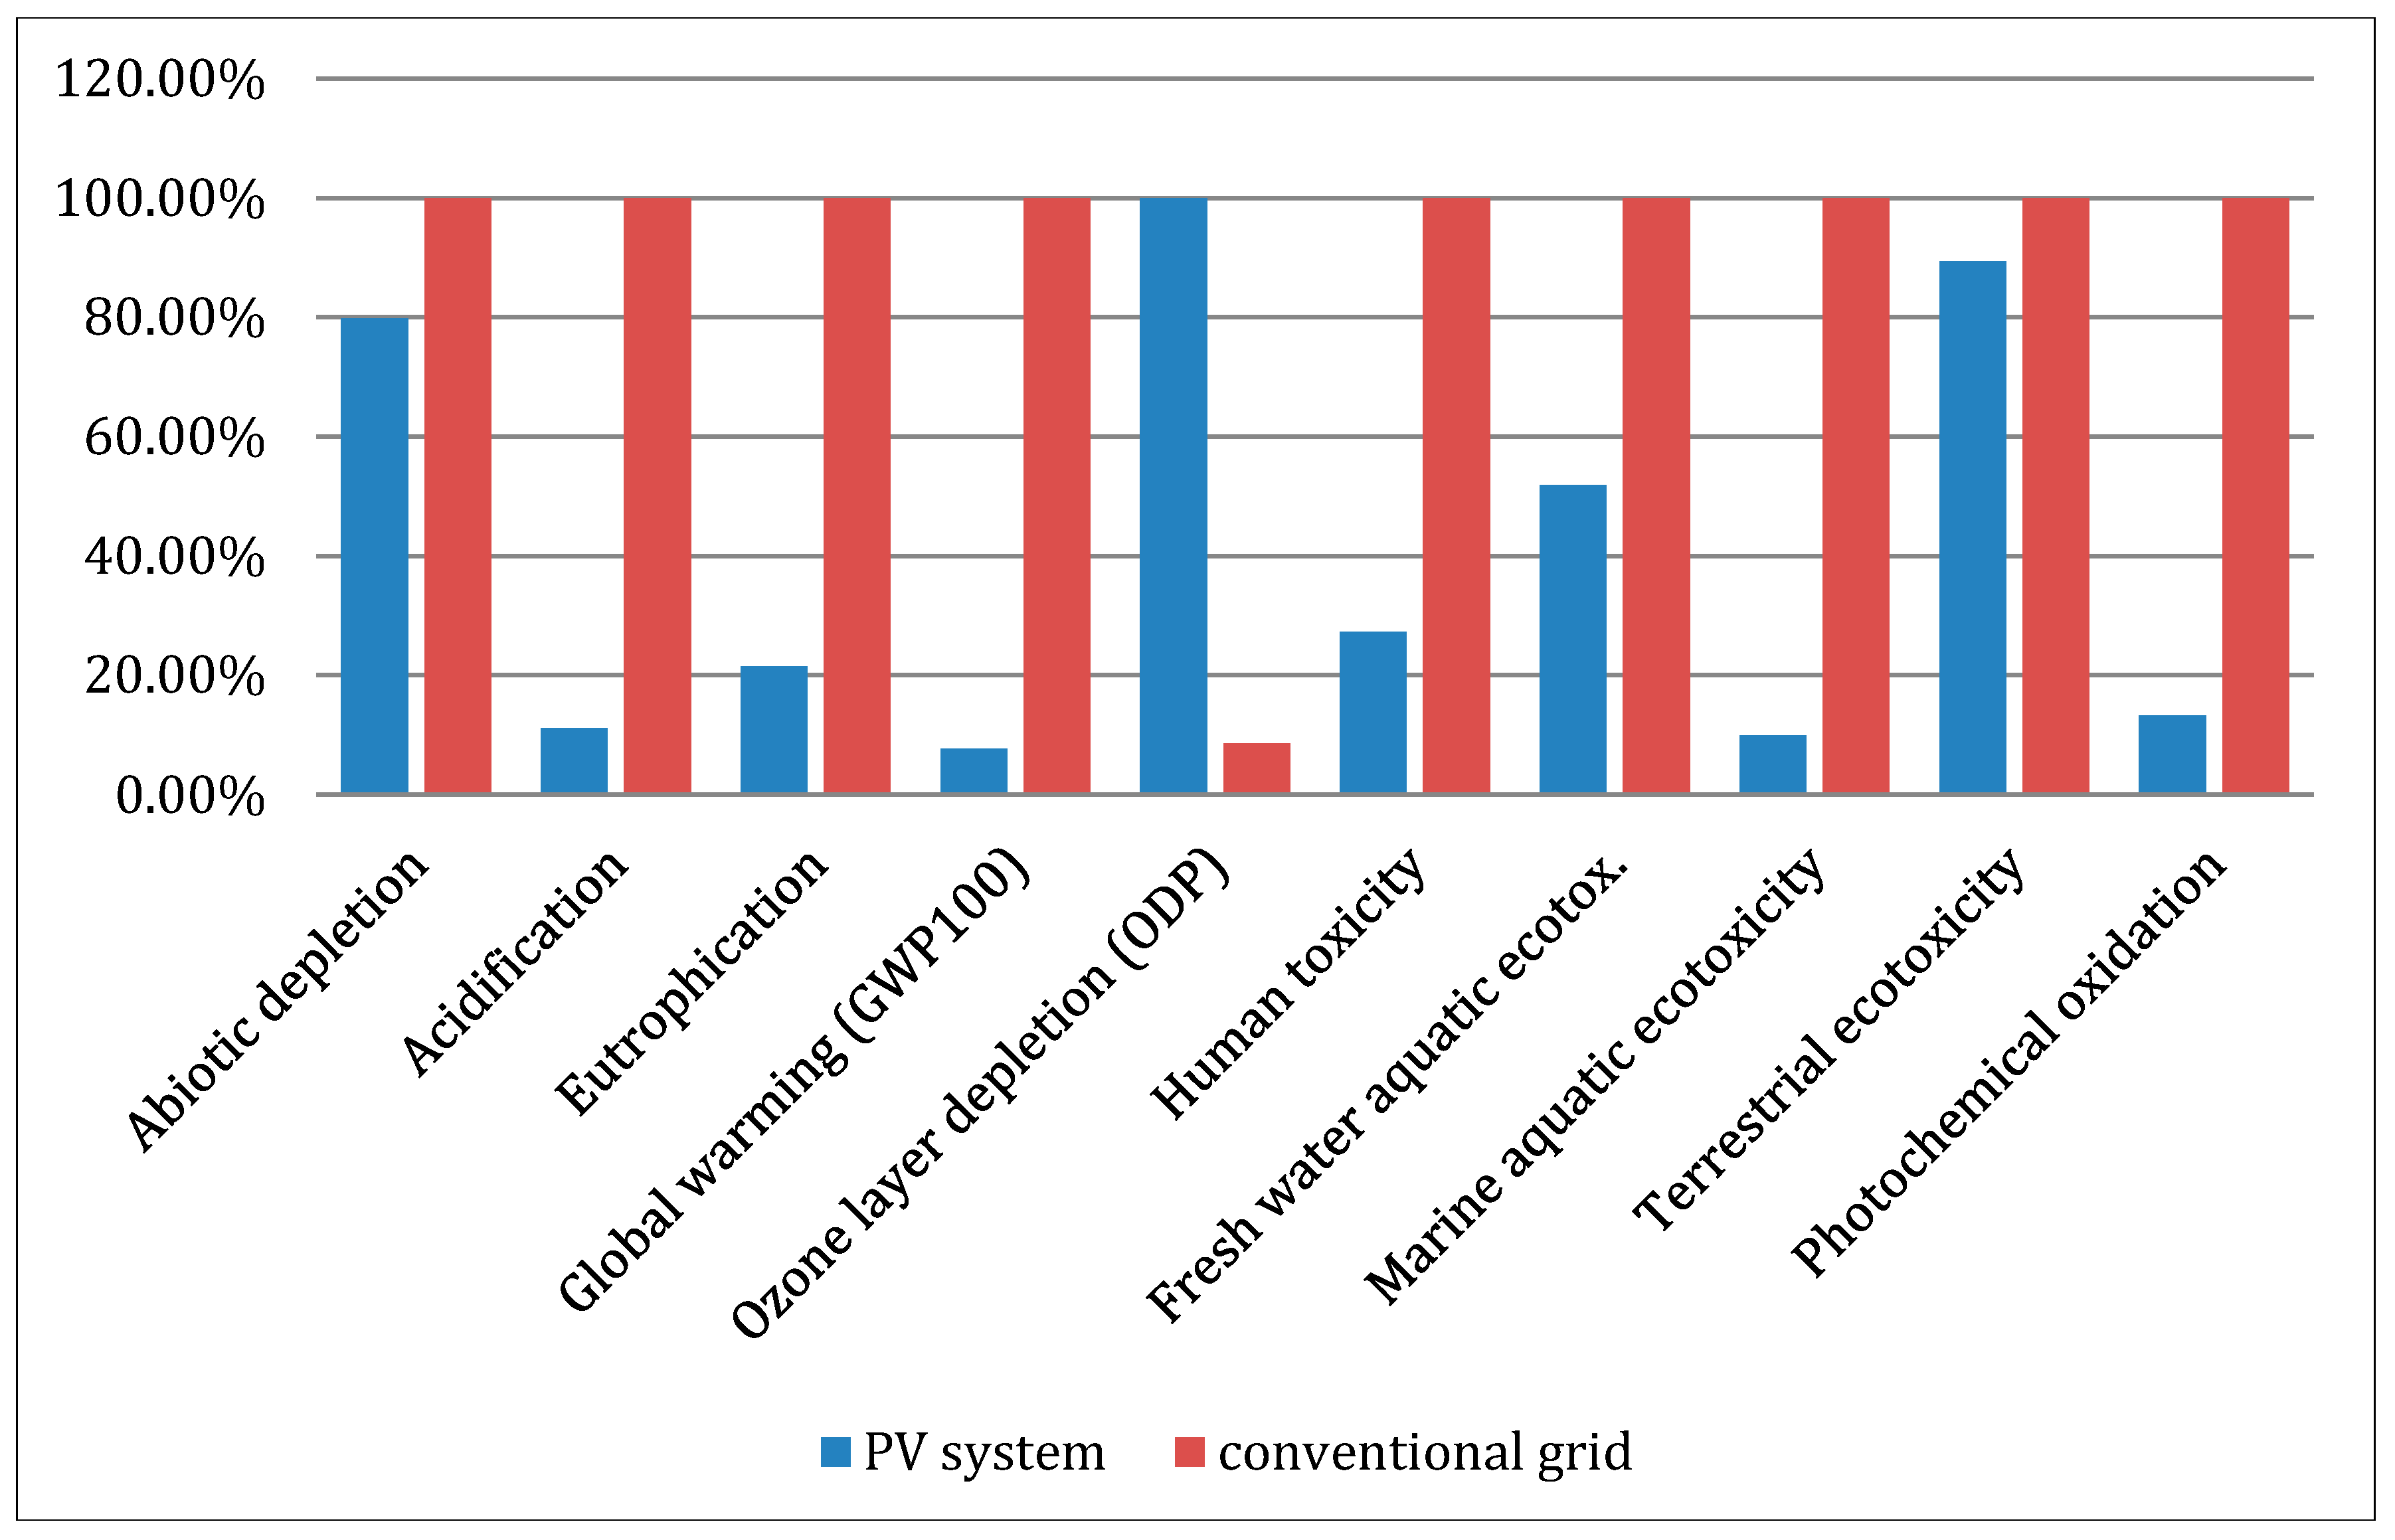
4.1.3. Life Cycle Impact Assessment

4.1.4. Interpretation
4.2. UQ Solar LCC
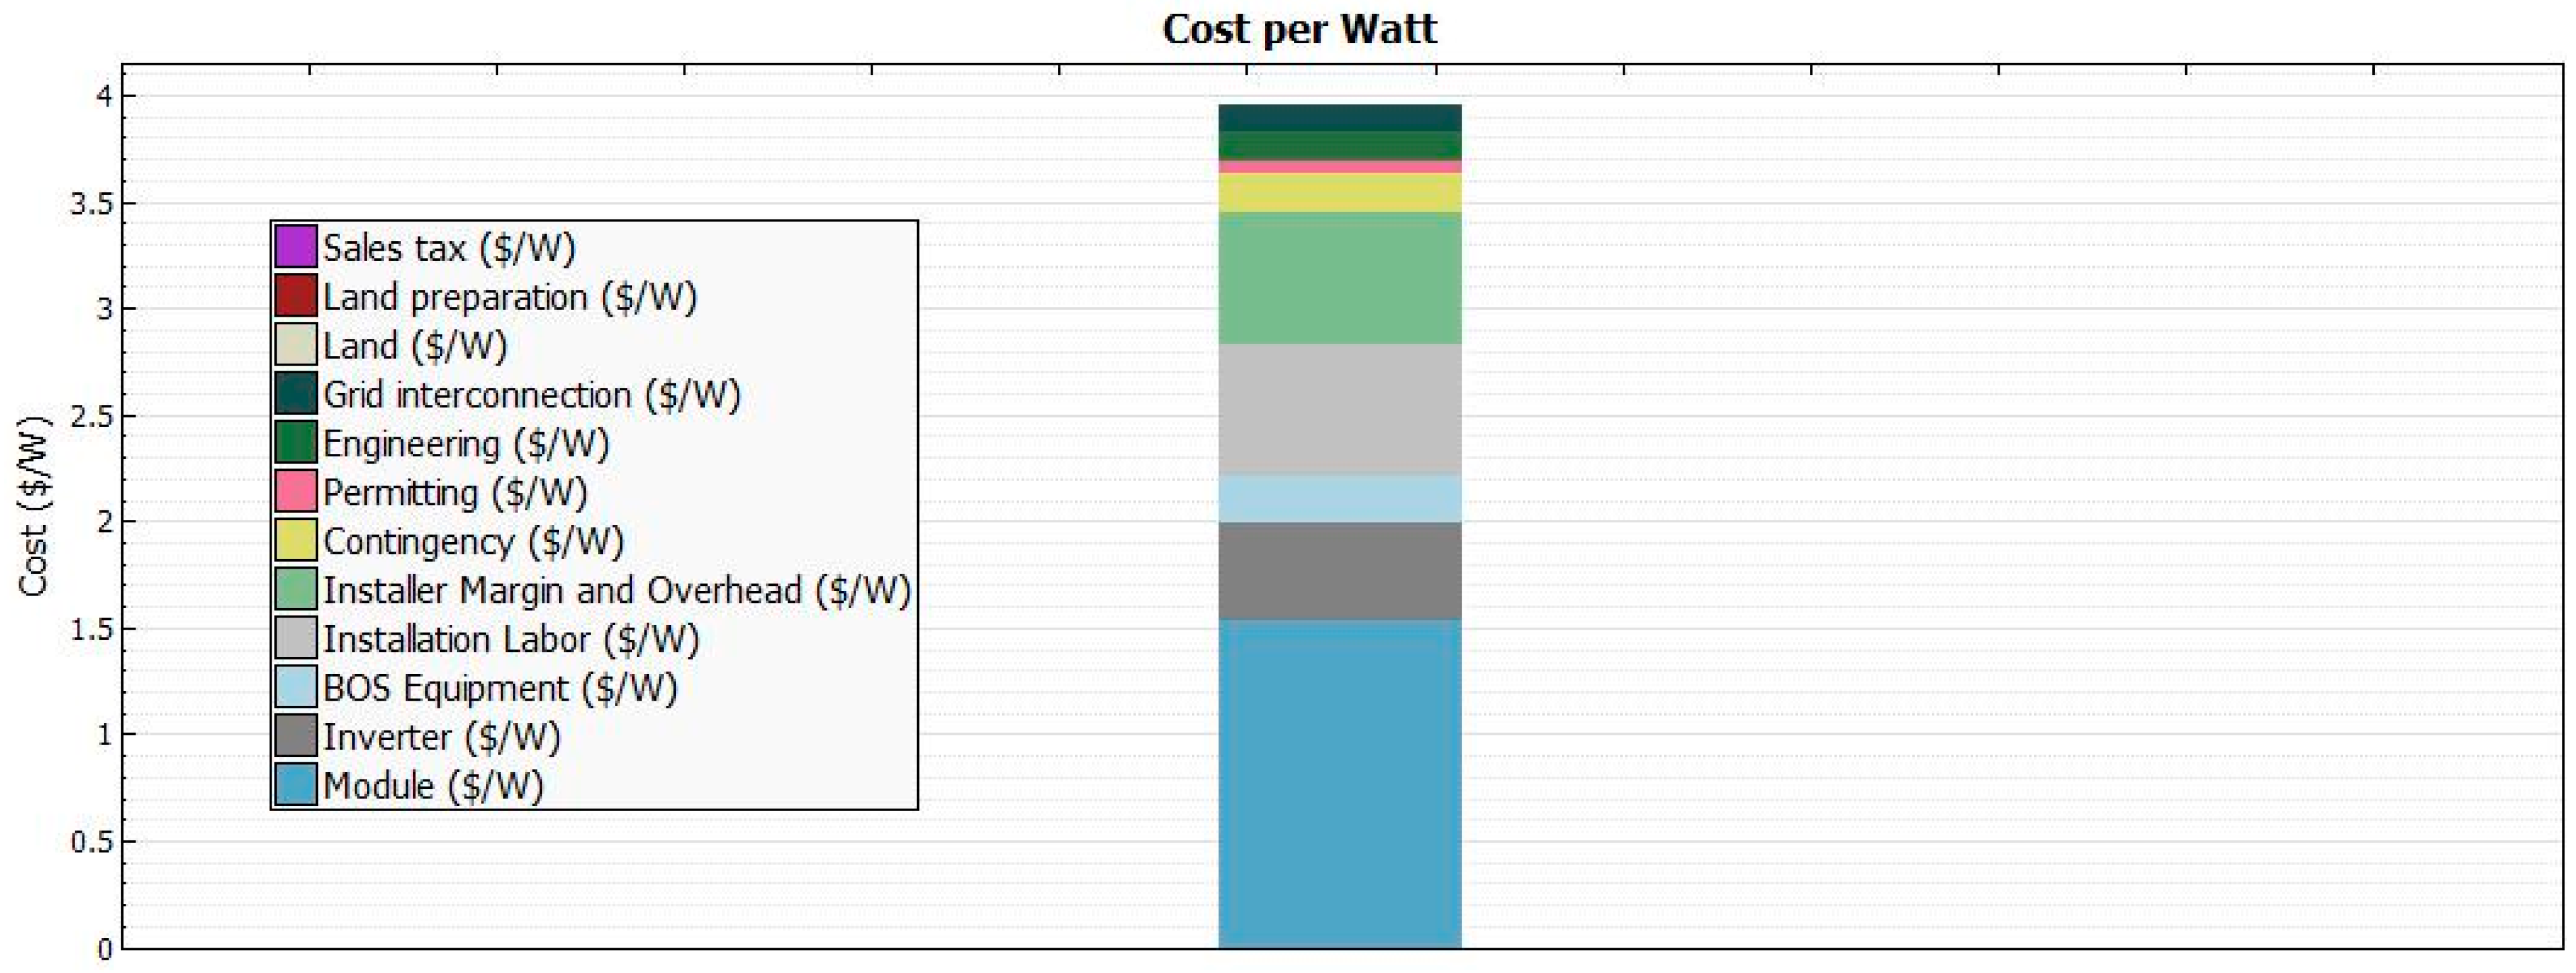
4.2.1. Goal and Scope Definition
- (1)
- Production of PV modules
- (2)
- Production of Inverters
- (3)
- Provision of BOS equipment
- (4)
- Installation labour
- (5)
- Installer margin and overhead
- (6)
- Contingency
- (7)
- Permitting
- (8)
- Engineering
- (9)
- Grid interconnection
- (1)
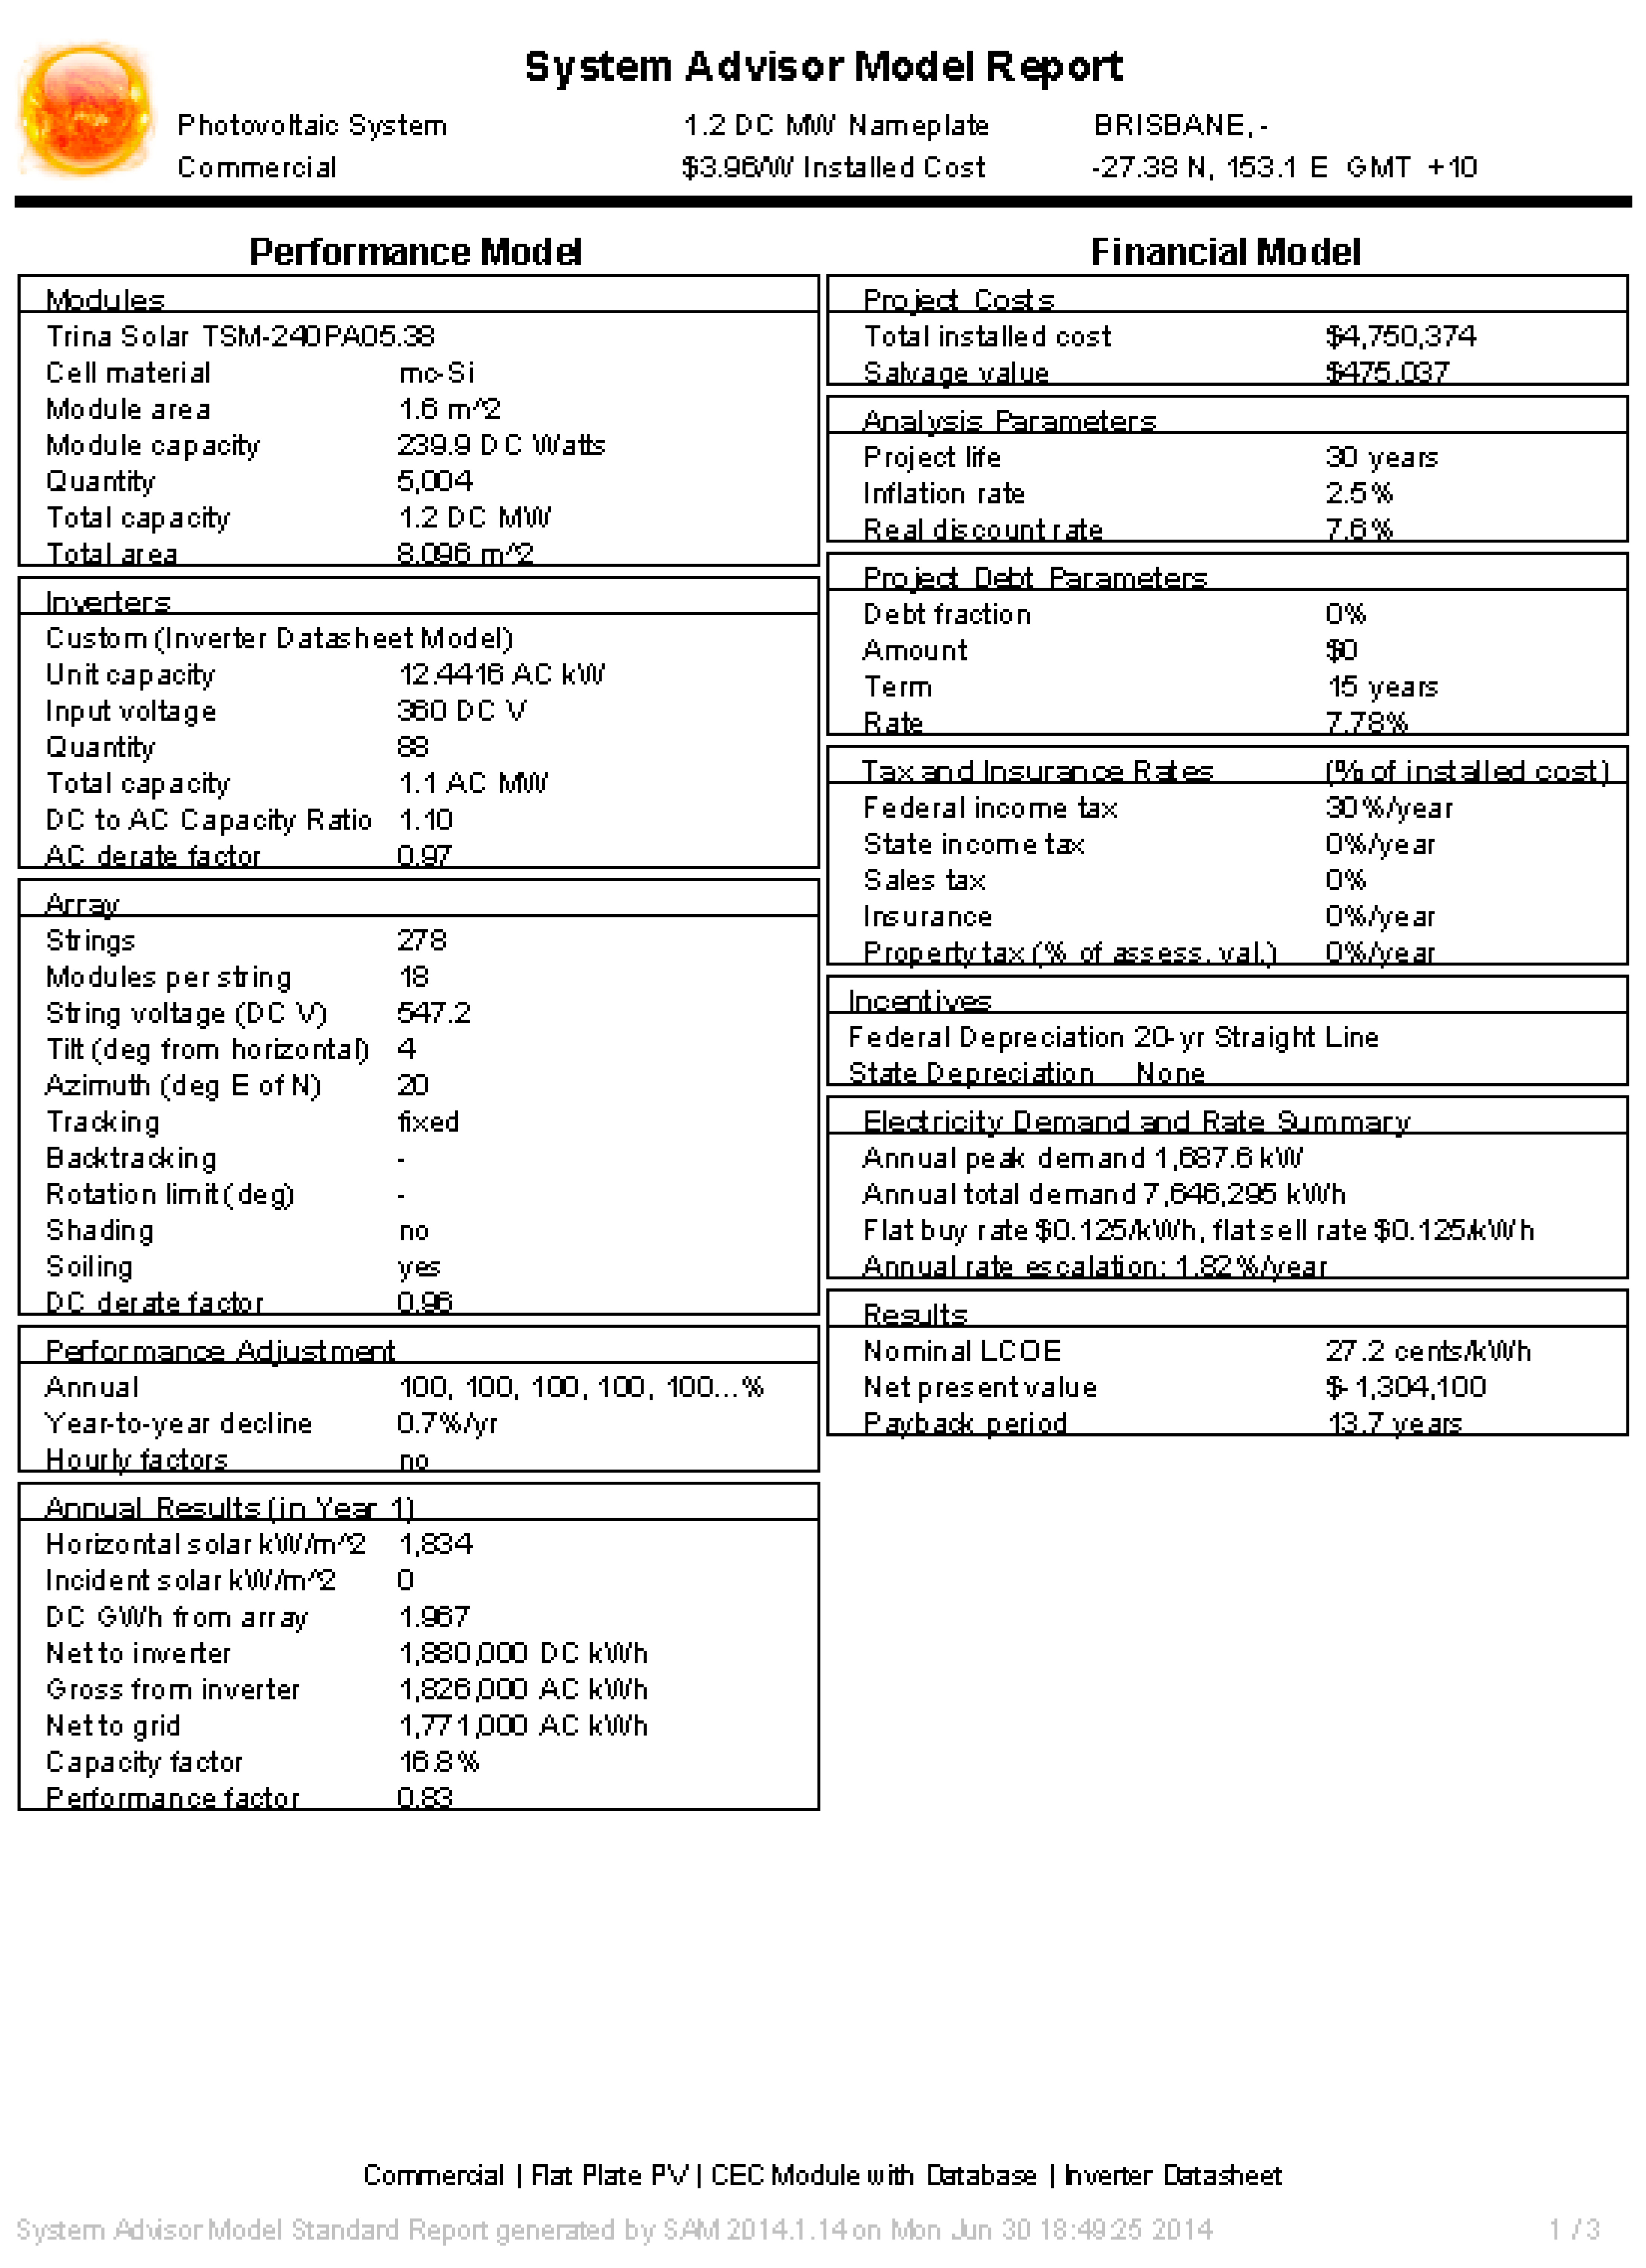
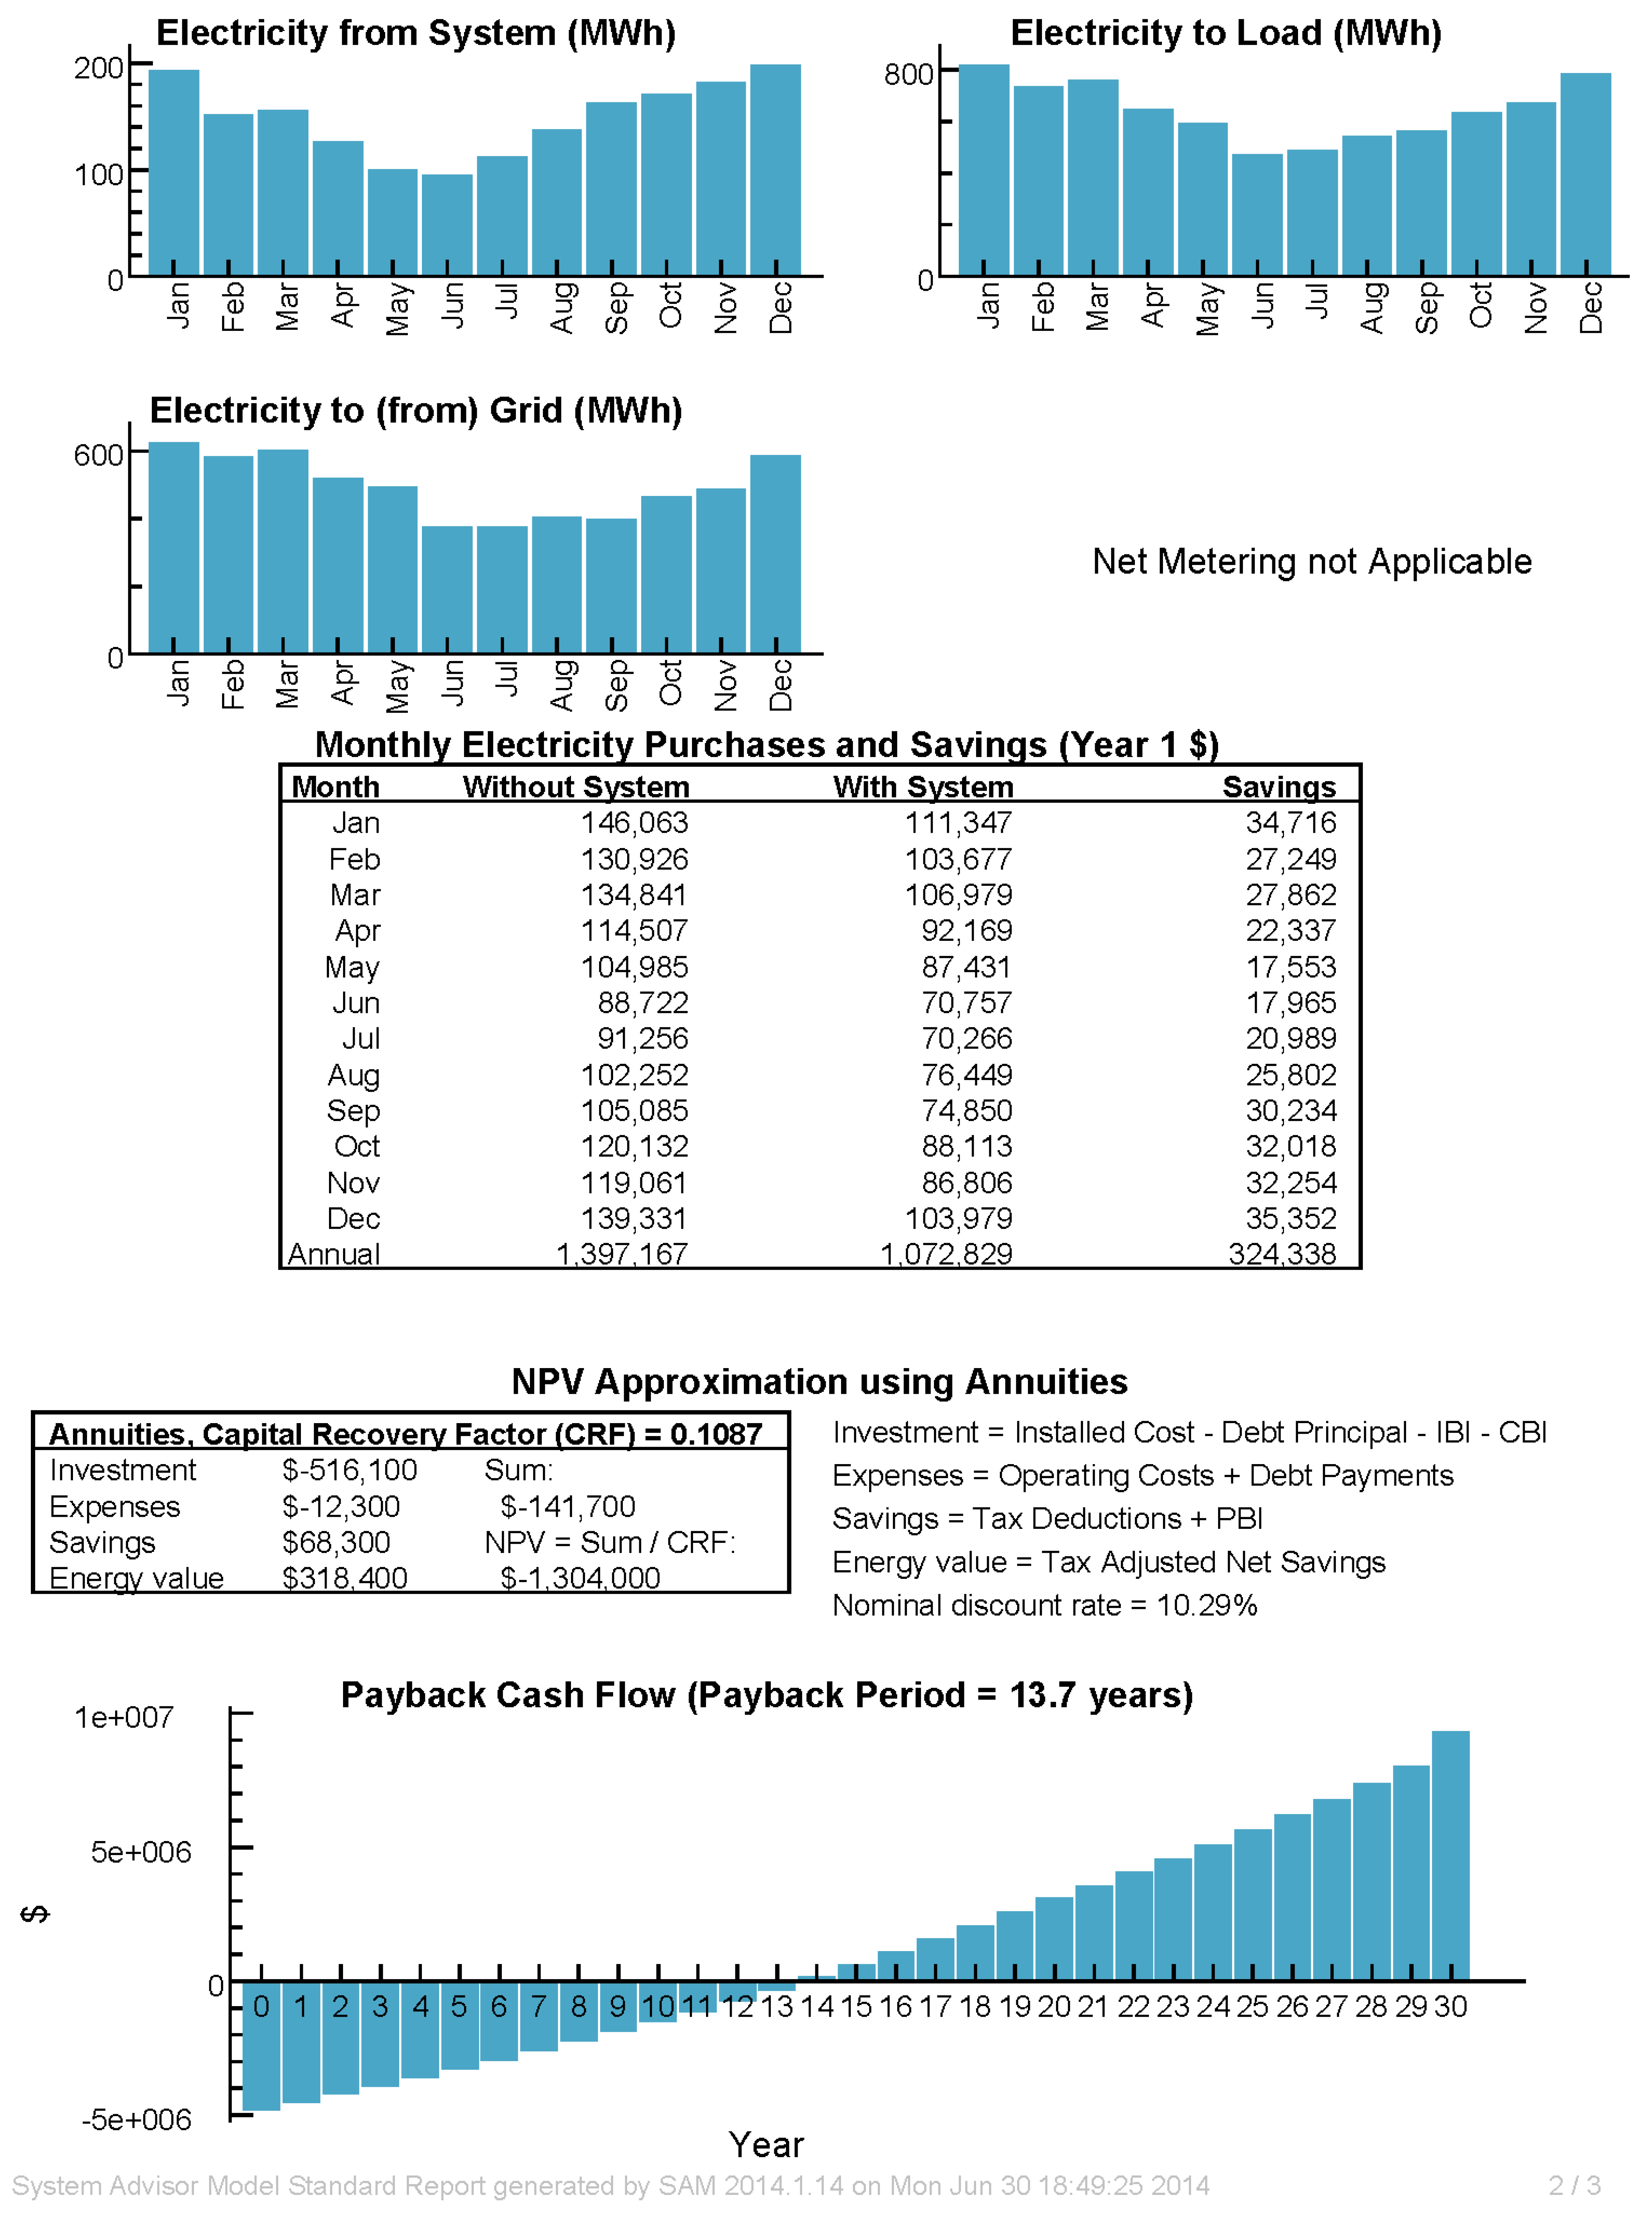
- If the effect of inflation is taken into account, the “nominal” discount rate is 10.29%/year. On the contrary, the “real” discount rate is 7.6%/year [21];
- (2)
- Inflation rate is 2.5%/year [21];
- (3)
- Escalation rate is essentially the same as the inflation rate;
- (4)
- 10% of the total installed cost is assumed to be the salvage value;
- (5)
- The base date of this project is 1 June 2010, the service date is 1 June 2011, and the study period is 30 years;
- (6)
- The results of this study are independent of government subsidies (e.g., renewable energy certificates, rebates) and special feed in tariffs arrangements, because the inclusion of incentive is not consistent with the strict definition of LCOE [23];
- (7)
- DC to AC ratio is set to be 1.1, and interconnection derate is 0.97 in total;
- (8)
- The utility rate is going to increase 1.82%/year given no carbon tax is considered [21];
- (9)
- Loan rate is 7.78%/year [21];
- (10)
- Federal income tax is 30% [32];
- (11)
- Contingency is assumed to be 5%.
4.2.2. Life Cycle Inventory Analysis
4.2.3. Life Cycle Impact Assessment

| Metric | Value |
|---|---|
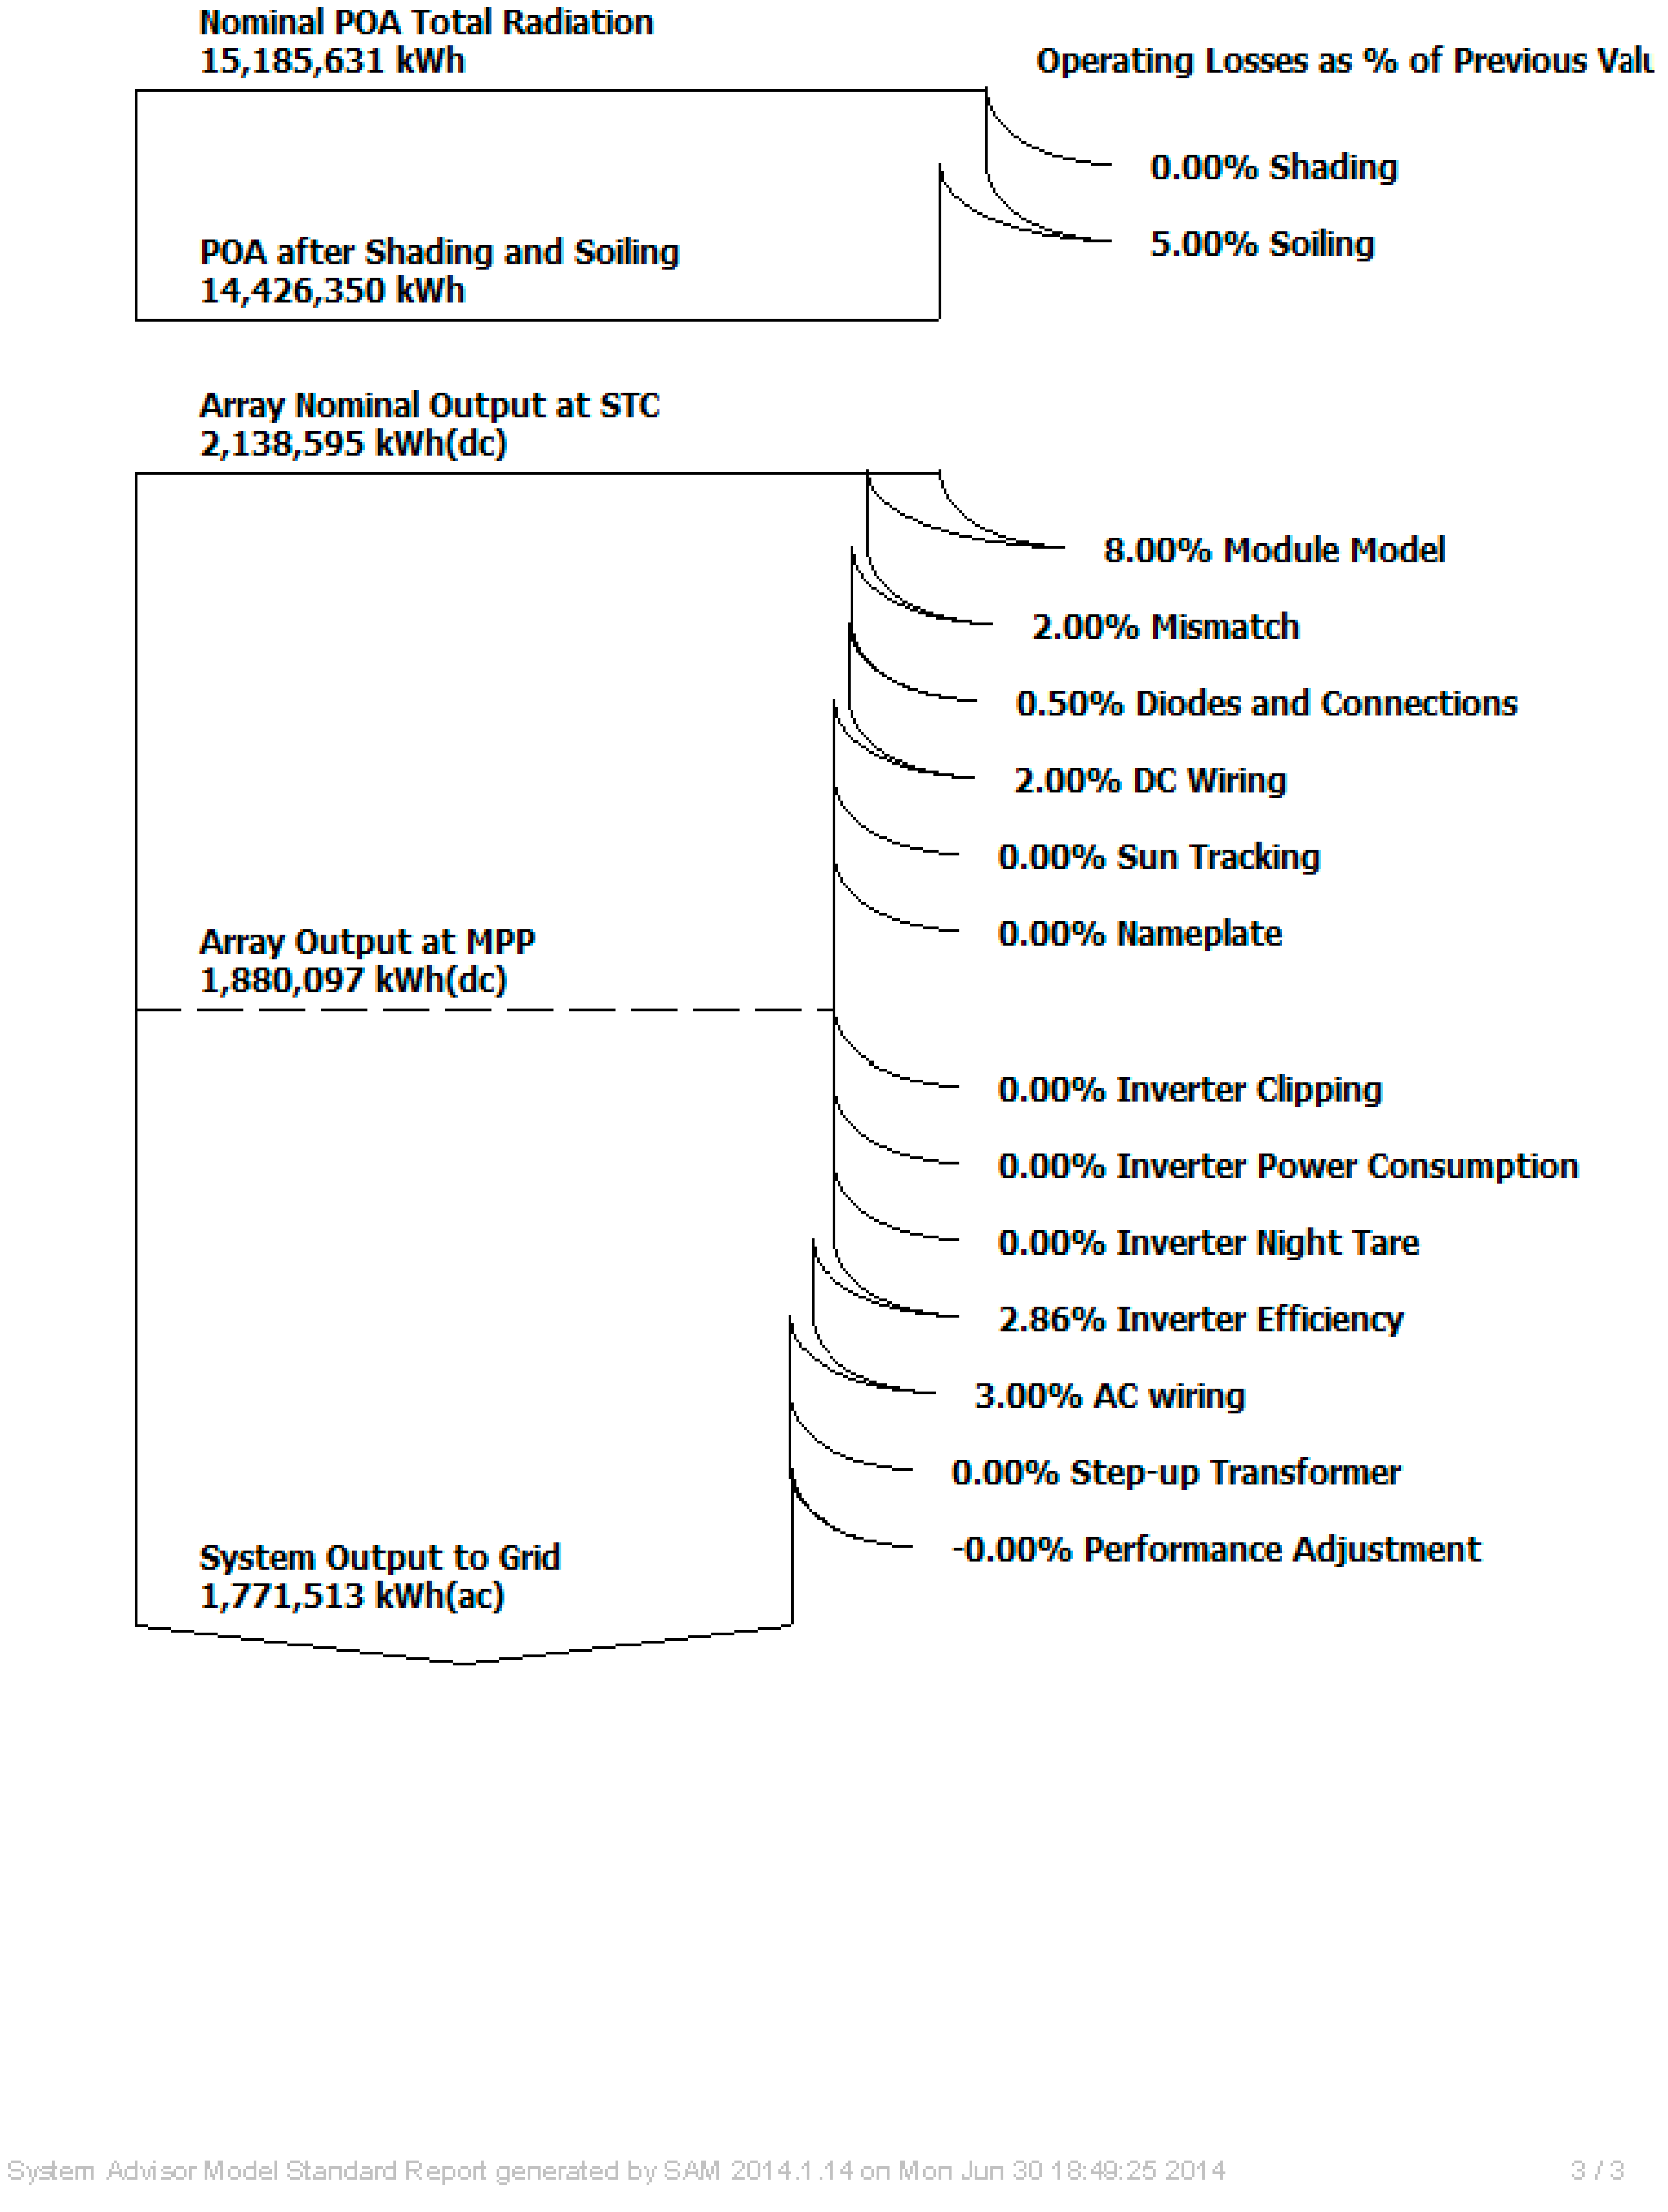
| Annual Energy | 1771,513 kWh |
| LCOE Nominal | 27.19 ¢/kWh |
| LCOE Real | 21.53 ¢/kWh |
| Electricity cost without system | $1397,169.13/year |
| Electricity cost with system | $1072,829.13/year |
| Net savings with system | $324,348.28/year |
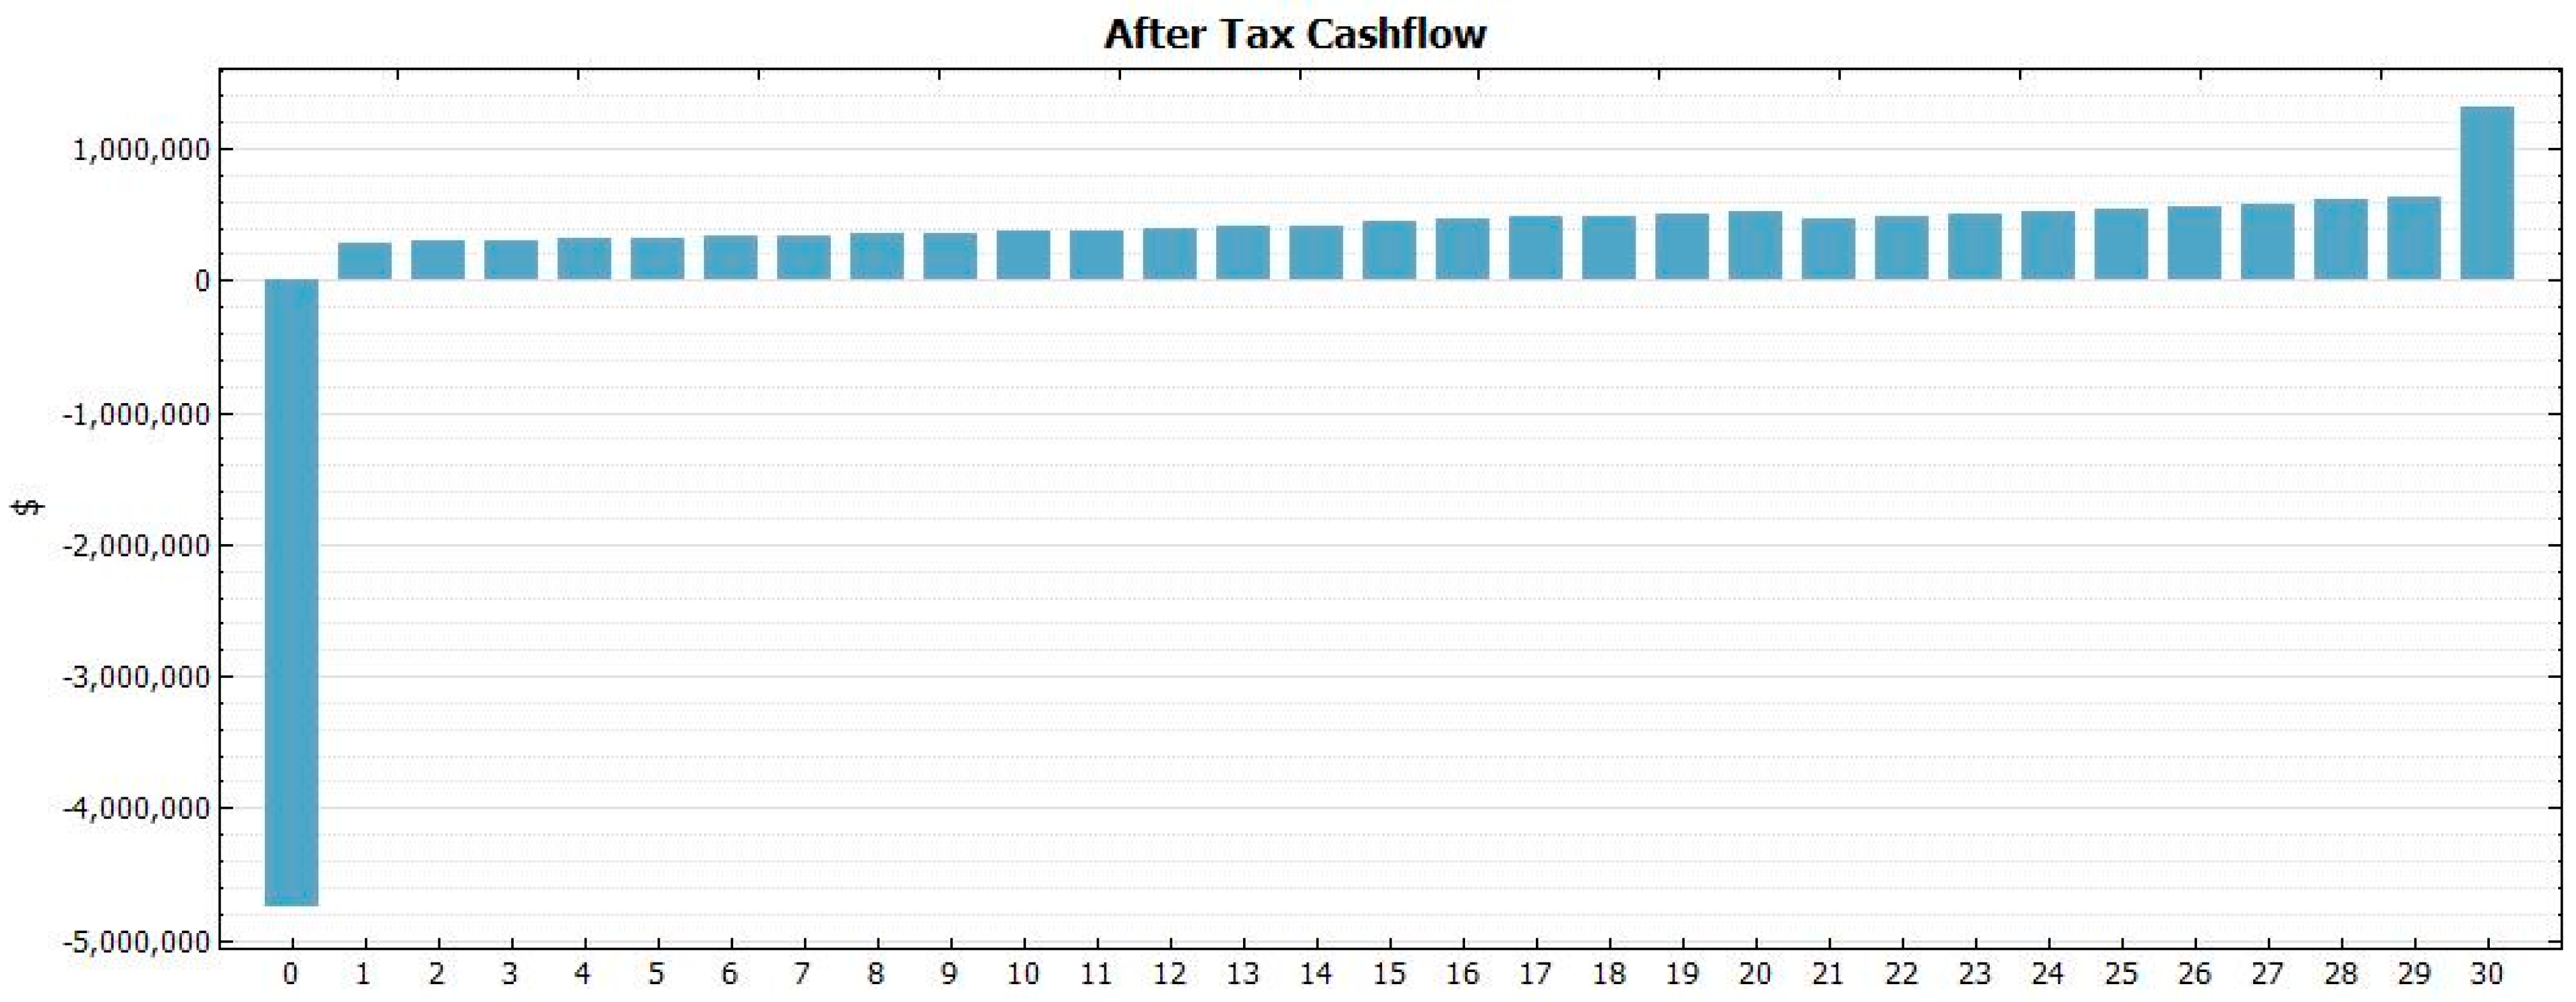
| Net present value ($) | −$1,304,143.13 |
| Payback (years) | 13.6769 years |
| Capacity Factor | 16.84% |
| First year kWhac/kWdc | 1476 |
| System performance factor (%) | 0.83 |
| Total Land Area | 2.10 acres |

4.2.4. Interpretation
- (1)
- When comparing these values with the utility electricity rates paid by UQ to the Queensland electricity network provider, which is about 12.5 cents/kWh [17], UQ Solar is not an attractive investment at present if there are not any incentives, grants, or carbon taxes.
- (2)
- When comparing real LCOE value with Queensland average residential time of use (TOU) tariff, which is about 22.07 cents/kWh [35], grid parity has been reached. Especially when feed-in-tariff and renewable energy certificates apply, PV installation seems more appealing.
- (3)
- When comparing these values with LCOE offset electricity, which is about 28 cents/kWh in 2012 [21], it can be concluded UQ Solar is more or less economically competitive.
- (4)
- When considering projections of these two systems, it is reasonable to predict PV installation will become more and more beneficial because LCOE of PV will be continually decreasing while LCOE of grid electricity will be generally increasing.
- (1)
- The LCOE is 26.5 cents/kWh for a 100 kW commercial polycrystalline PV installation in Sydney in 2011 [21], which is very similar to the result of this study.
- (2)
- From the UQ Solar website, it is known the initial cost of the studied system is 4.746 million, the cost per watt is approximately 3.955 dollars, and the payback period for this project is 10–12 years [17]. These results are also similar to the results of this study. While the UQ Solar website considers government grants, this study does not.
4.3. UQ Solar S-LCA
4.3.1. Goal and Scope Definition
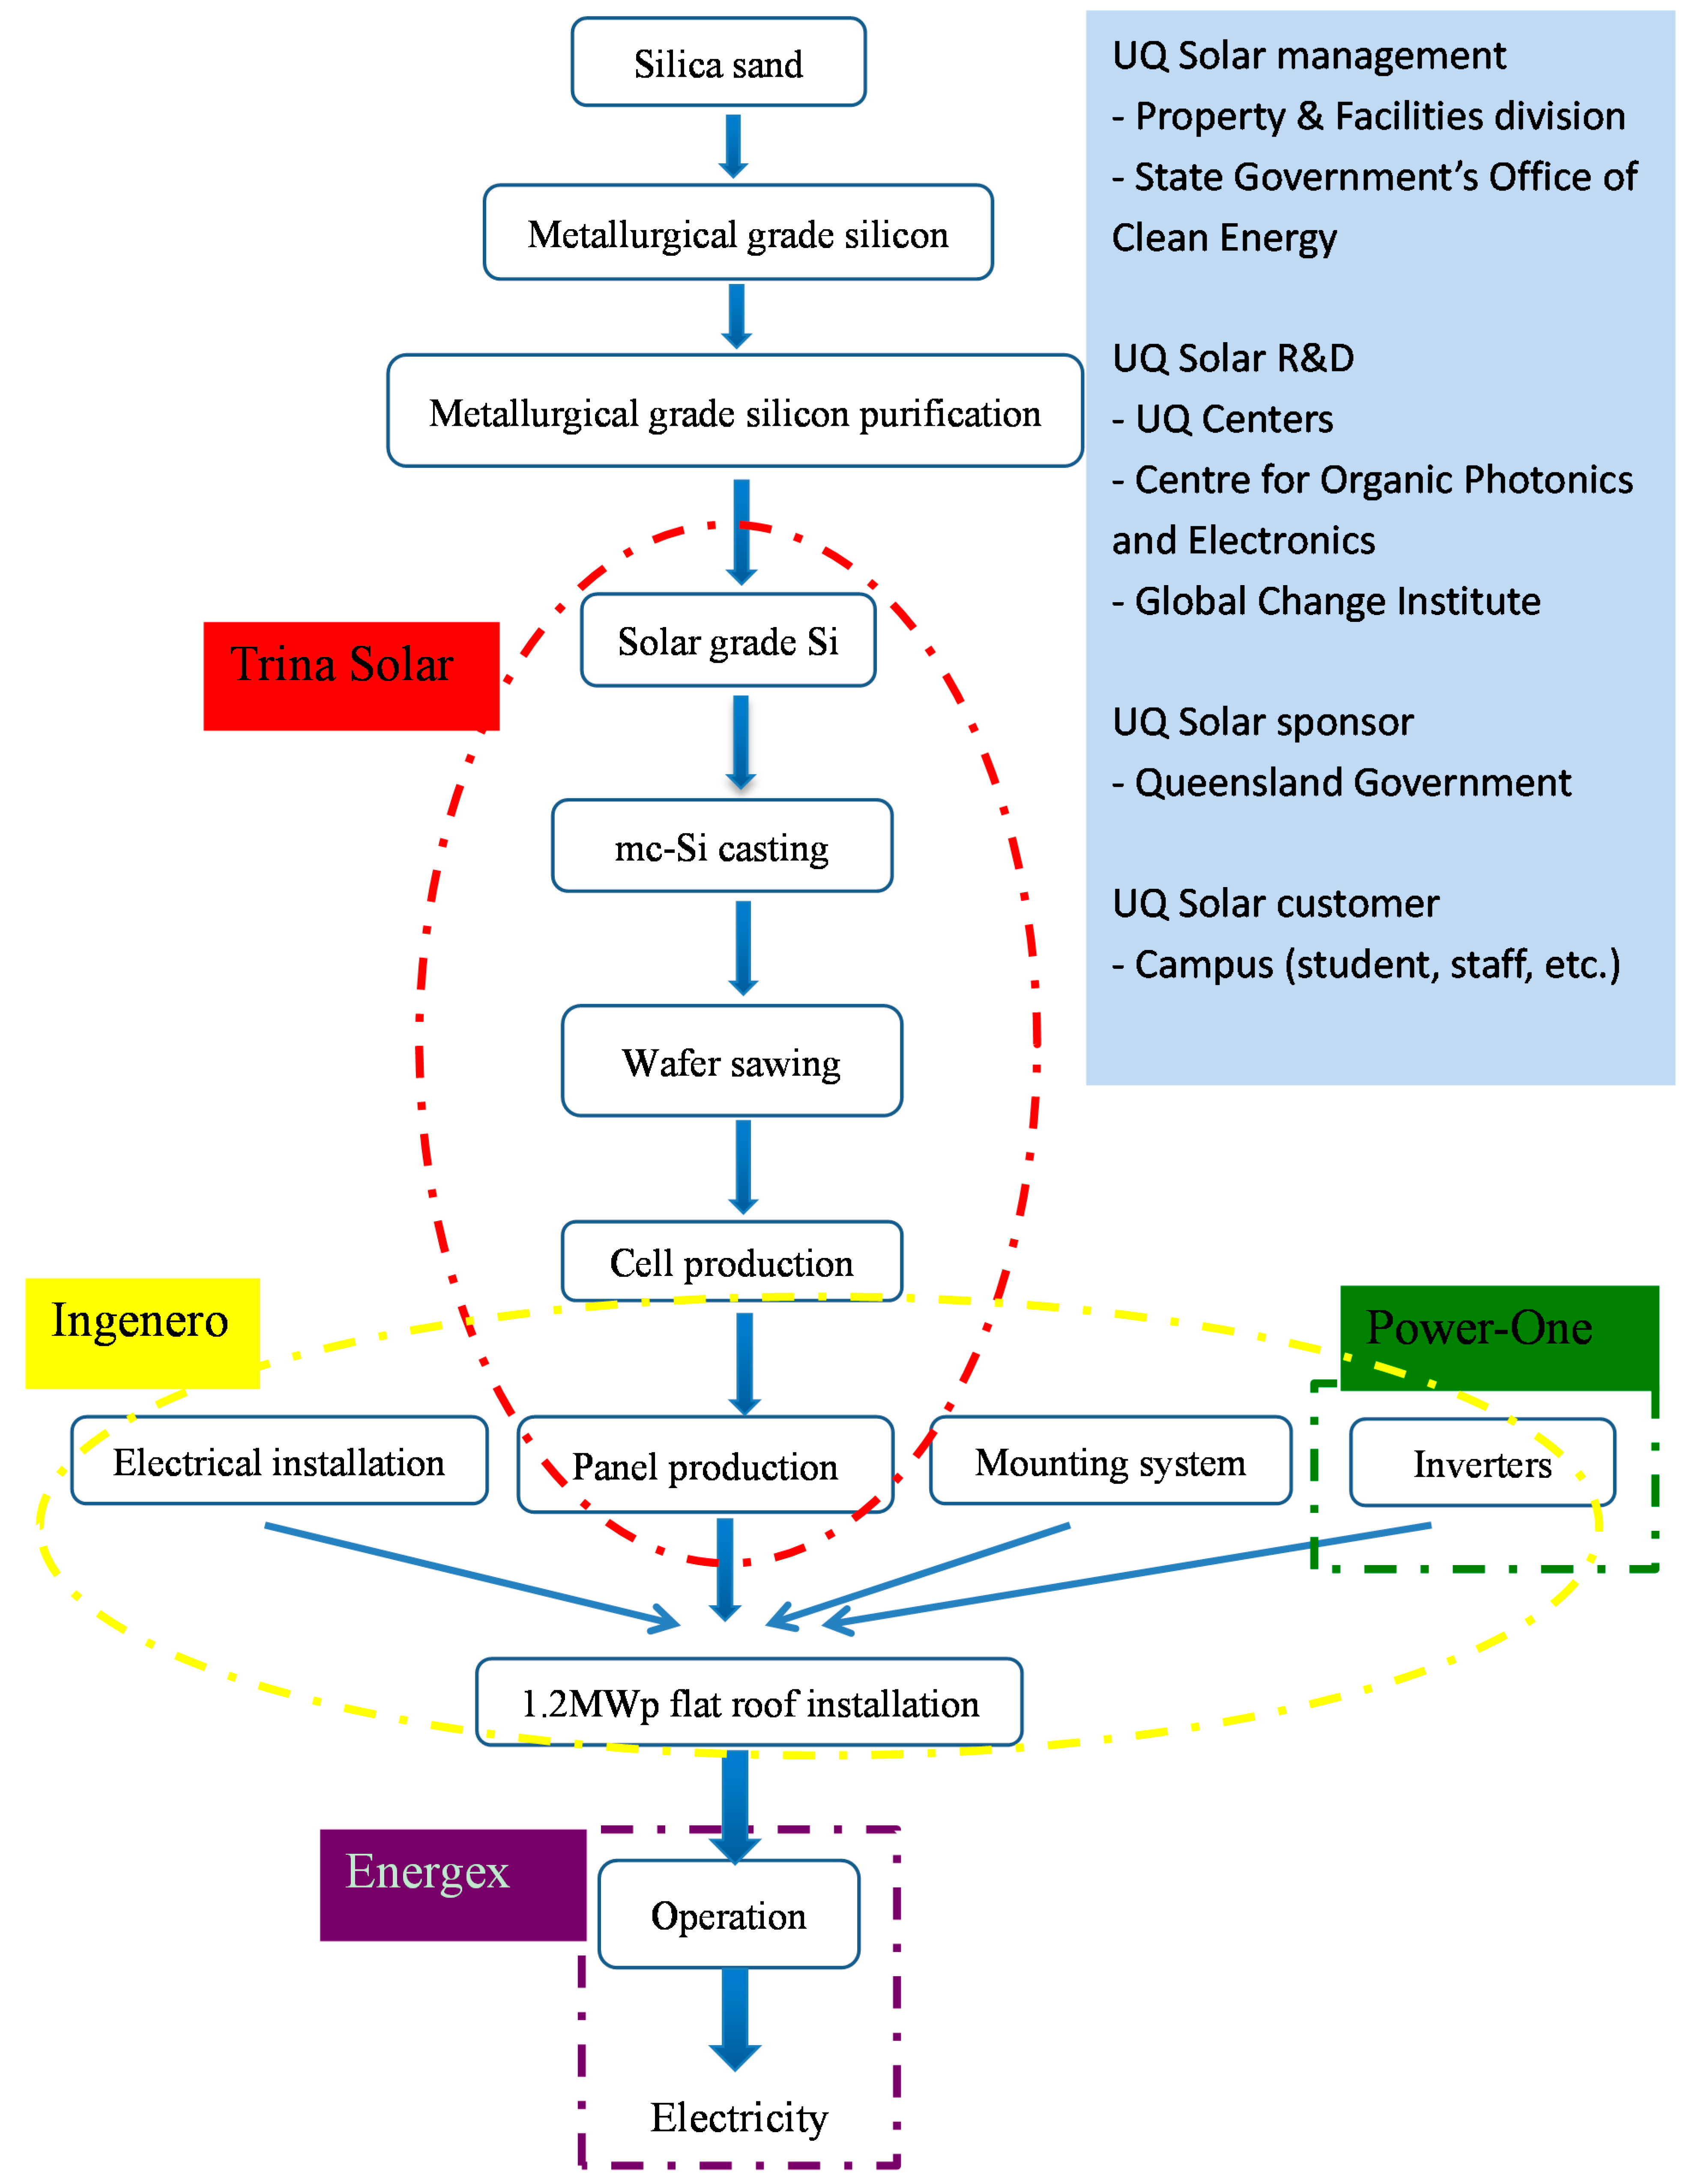
- ➢
- StakeholdersMajor stakeholders involved and their respective roles are marked in Figure 6.
- ➢
- SubcategoriesSubcategories are assigned to several stakeholders who potentially have significant impacts. These subcategories are selected against each stakeholder’s main roles and interests, and they can be found in the life cycle inventory analysis and life cycle impact assessment.
- ➢
- LimitationDue to very limited data availability, the complex social assessment has to be a generic, qualitative and subjective one. Only main stakeholders are selected, and the information collected is neither completely unbiased nor comprehensively inclusive. Therefore, all the conclusions need to be read with caution. However, it can be considered as a good starting point to conduct more profound and advanced social assessment.

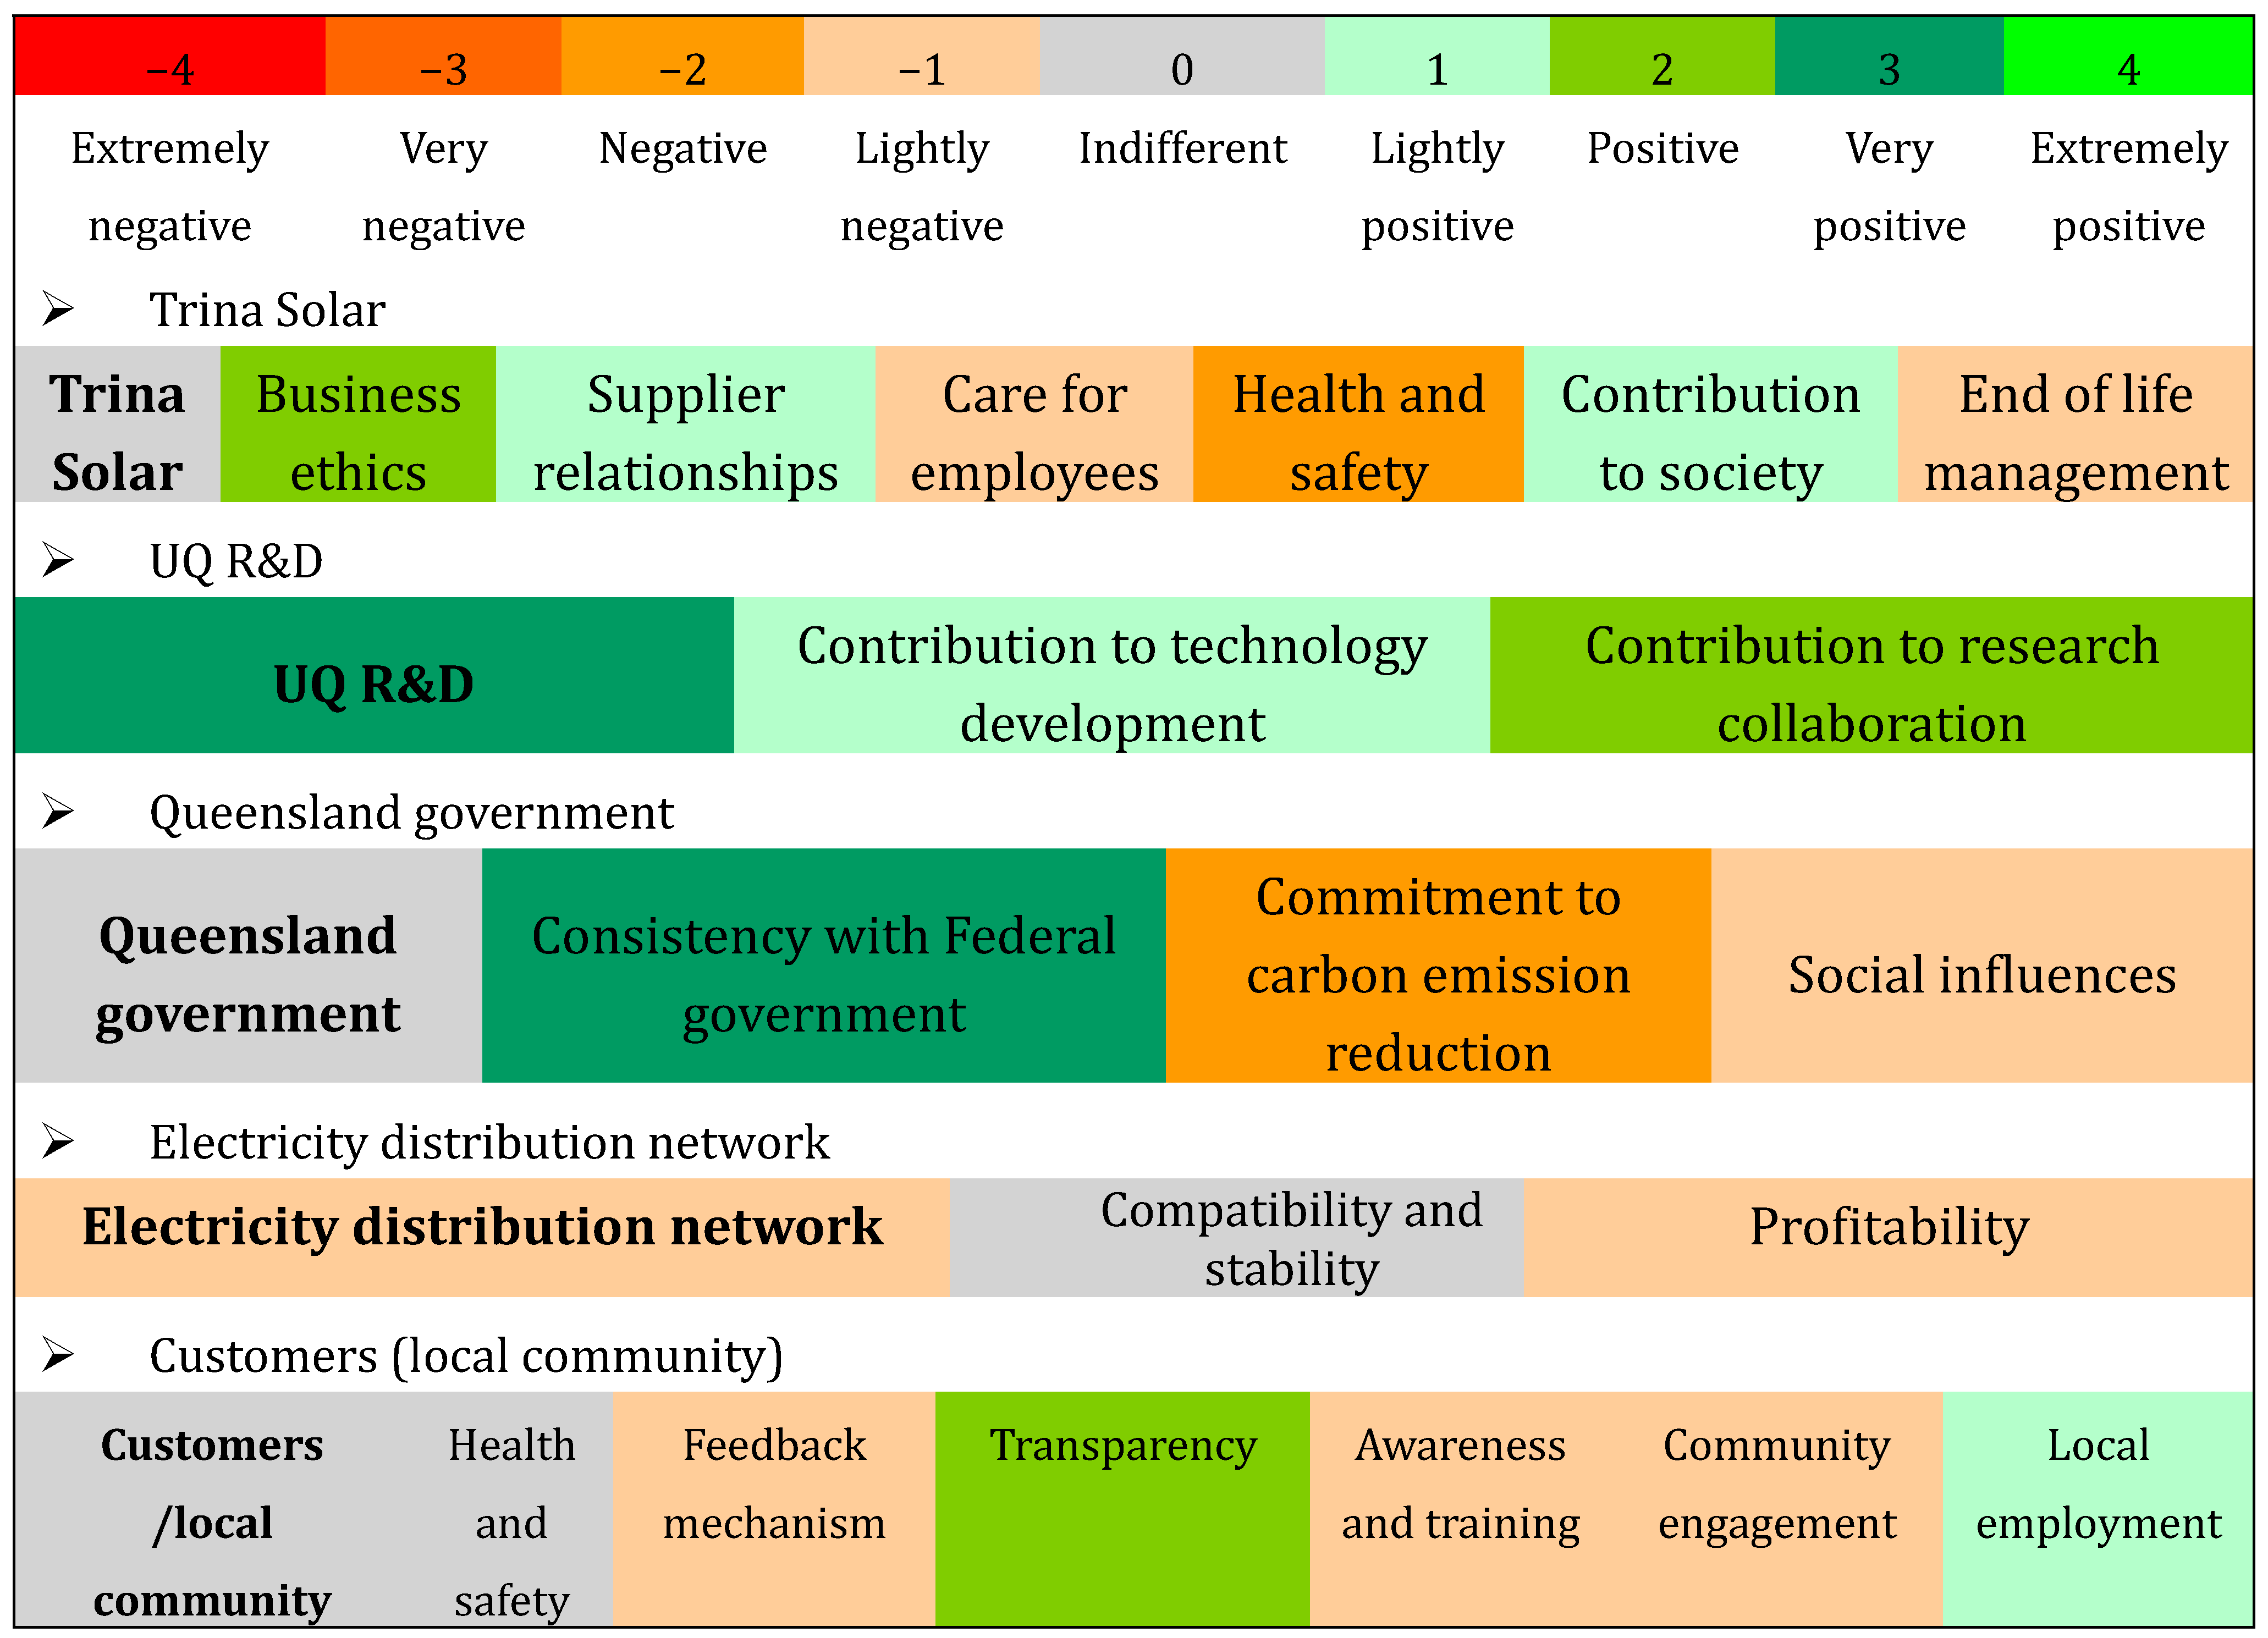
4.3.2. Life Cycle Inventory Analysis
- ➢
- Trina Solar
- Business ethicsTrina Solar has established the “Code of Business Conduct and Ethics”, in which it highlights anti-corruption, integrity and compliance, reporting mechanism, and high business ethical standards with suppliers and partners [36].
- Supplier relationshipsIn order to improve the social responsibility performance of suppliers, Trina Solar exerts some influence on them. Trina Solar carries out risk assessments annually to list key suppliers who comply with its requirements on sustainable development. Trina Solar has implemented Supplier CSR Management Procedure. Key suppliers are required to sign a commitment letter in order to strengthen communication and cooperation between different suppliers. In 2012, 18 key suppliers had been through EHS/CSR audits, among which 11 are conditionally accepted and three are disqualified [36].
- Care for employeesFollowing laws and regulations, employees’ rights are protected: no forced labor or child labor; men and women are equally paid; no discrimination incidents; various insurances, funds and benefits are guaranteed [36]. However, in fact, it is recognized the enforcement of law in China is not very strict, and the inspection can be very superficial.In 2012, the amount of employees reached 12,000, 67.3% of which had joined a labor union. Female employee ratio is 36.5%, and 100% of employees’ salary is higher than the stipulated minimum. Total recordable rate is 0.56 per million working hour. There is no work-related fatality, and the average training hours is 33 h per employee per year. US$4.568 million had been invested in safety and occupational health management [36].
- Health and safetyTrina Solar has implemented both an Environmental Health and Safety policy and Product Stewardship policy to ensure the commitment to designing and manufacturing solar photovoltaic modules with overall lower impacts on the environment, and employees’ health, safety and well-being. In November 2012, Trina Solar had passed Occupational Health and Safety management system (OHSAS 18001) verification [36].However, it is known that during the manufacturing and disposal phase, many toxic and hazardous metals and chemicals can be generated to harm workers who work around them. For example, sawing c-Si wafers may generate silicon particulate matter that can pose inhalation problems [37]. Especially, in China, the problems would get more serious as environmental regulatory enforcement is low. Therefore, it is not indubitable to conclude Trina Solar has no problems in dealing with health and safety problems.
- Contribution to societyApart from doing business, Trina Solar contributes to the society development in many ways. Trina Solar established an international school to support education, and it donated solar PV modules to universities for demonstration and education, etc. [36].
- End of life managementTrina Solar encourages Extended Producer Responsibility (EPR), and it collects end-of-life PV modules sold in Europe through PV Cycle initiative [38]. In Europe, the end-of life or defective PV modules are recycled at facilities with certified environmental management systems.By and large, Trina Solar is a social responsible company and it is ranked No. 1 for its environmental and social performances in the 2012 Solar Scorecard among 40 companies globally [38].
- ➢
- UQ R&D
- Contribution to technology developmentThe establishment of UQ Solar has facilitated the research activities in UQ regarding photovoltaic development.UQ Center proactively carries out many researches on renewable energy system, and UQ Solar can provide the opportunities for many efficiency improvement experiments. Centre for Organic Photonics and Electronics are developing emerging PV technologies. Although UQ Solar does not utilize any new technologies, it is still a good establishment for comparative research, and emerging technologies can also be added to this establishment for pilot-scale research. The Global Change Institute is conducting researches that are, in particular, using UQ Solar. They are working on the storage devices, the concentrated PV installation and the shading effects [17].
- Contribution to research collaborationAs the largest flat panel installation in Australia, UQ Solar can be regarded as a demonstration project, which may attract many researchers in other universities, institutes, and industries to work together to improve the overall performances of PV system. Not only can scholars in science and engineering fields participate, experts in social science and economics are also encouraged to make contributions.
- ➢
- Queensland government
- Consistency with Federal governmentAustralia has Federal, State and local governments, and they all have different priorities, jurisdictions, incentives and motivations. In order to respond to climate change, the Federal government has set several greenhouse gas emission reduction targets for different periods, and the transition to more renewable energy deployment is taking place. However, current policies still favor more mature and cheaper technologies such as hydro and wind, which have little thing to do with solar photovoltaic. Some non-renewable but “greener” fossil fuels (e.g., natural gas, coal seam gas) are considered as critical contributors to emission reduction. In addition, some emission intensive and trade-exposed industries (steel, alumina, coal fired power stations, etc.) are privileged, subsidized and protected from participating in renewable energy targets and carbon pricing in order to balance social concerns regarding jobs and competitiveness. More seriously, many practical barriers exist in implementing renewable energy policies, such as lengthy and complicated permitting procedures, costly and non-transparent grid connection, uncertainty of returns, etc. In summary, all the above-mentioned factors undermine the potential environmental, economic, and social contributions of emerging renewable energy industries, and renewables are actually not competing on an equal playing field [39].Globally speaking, Queenslanders emit the highest amount of greenhouse gases, and Queensland is a major exporter of coal and gas [40]. However, very few down to earth initiatives have been implemented to tackle this urgent problem. The Queensland government has set many strong renewable energy targets, and it has also outlined some funding strategies. However, no sufficient details are proposed to address the barriers existing in renewable energy development. On the contrary, large sums of subsidies are still provided to support conventional fossil fuel industry, and some policies still promote rapid expansion of coal/gas mining to increase export sales. With regard to solar photovoltaic development, the Queensland government did exceptionally well in promoting the uptake of residential solar PV systems, however, the major challenges still lay in deploying large-scale PV installations [41]. After the change of government in the Queensland election in March 2012, almost all renewable energy funding was cancelled, which substantially hinders the deployment of renewables as they largely rely on regulatory intervention to be commercially viable [39].As far as it is known, the Queensland government is consistent with the Federal government in dealing with renewable energy transition, however, in discouraging ways.
- Commitment to carbon emission reductionWith particular respect to UQ Solar, the Queensland government has provided AU$1.5 million to support this project, which, to some extent, indicates its intention to reduce carbon emissions. However, such a small contribution is not convincing enough to express its commitment.
- Social influencesUQ Solar is not very helpful to government to exert influences on society to use more renewable energy. It is more academic-oriented, and it is a big challenge to make the project widely known.
- ➢
- Electricity distribution network
- Compatibility and stabilityIn Australia, the majority of electricity is firstly generated by large centralized generators, and then it is transmitted at high voltage through transmission networks, after which distribution networks take over at low voltage before reaching end consumers [39]. This centralized system is both cheap and efficient, but it also faces many challenges nowadays due to changing demand patterns and deteriorating environmental problems. The prevailing “top-down” structure needs to be transformed to a “bottom-up” structure as consumers may have a number of alternatives to choose from [42].However, for UQ Solar only, the electricity distribution network is readily available so that no extra efforts or costs need to be paid to expand the current network.
- ProfitabilityFor electricity network provider Energex, the establishment of UQ Solar can be both good and bad. When peak demand cannot be met, UQ Solar can provide a reliable energy backup. However, when UQ Solar provides too much electricity, it will reduce electricity use and electricity utility revenues.
- ➢
- Customers (local community)
- Health and safetyDuring the operation of UQ Solar, it is not likely to generate any toxic/hazardous materials or noises; therefore, it is quite a safe renewable technology during its operation. However, if some unexpected accidents happen, exposure to toxic materials can be very harmful.
- Feedback mechanismThere is no extensive feedback mechanism available to students and local communities, as they are not much affected by UQ Solar. However, for the Property & Facility Division of UQ, a feedback mechanism is available, because there should be some feedback on how good the system runs, what problems it brings and how to address them.
- TransparencyIt is quite a transparent project because a data acquisition system (DAS) has been installed on a data display screen. Real-time output of the PV system can be displayed.
- Awareness and trainingFor general students and local communities, UQ Solar is not well exploited for awareness enhancement and training.
- Community engagementThe community is not actively engaged, as they are not directly/seriously affected.
- Local employmentThe solar energy sector has the potential to provide hundreds of thousands of jobs in fields of manufacturing, construction, installation, and maintenance. However, this environmentally sustainable industry may end up with unsustainable jobs, which keep workers and their families in poverty [43]. Besides, the creation of jobs in solar industry indicates fewer jobs are needed in the conventional electricity industry.
4.3.3. Life Cycle Impact Assessment

4.3.4. Interpretation
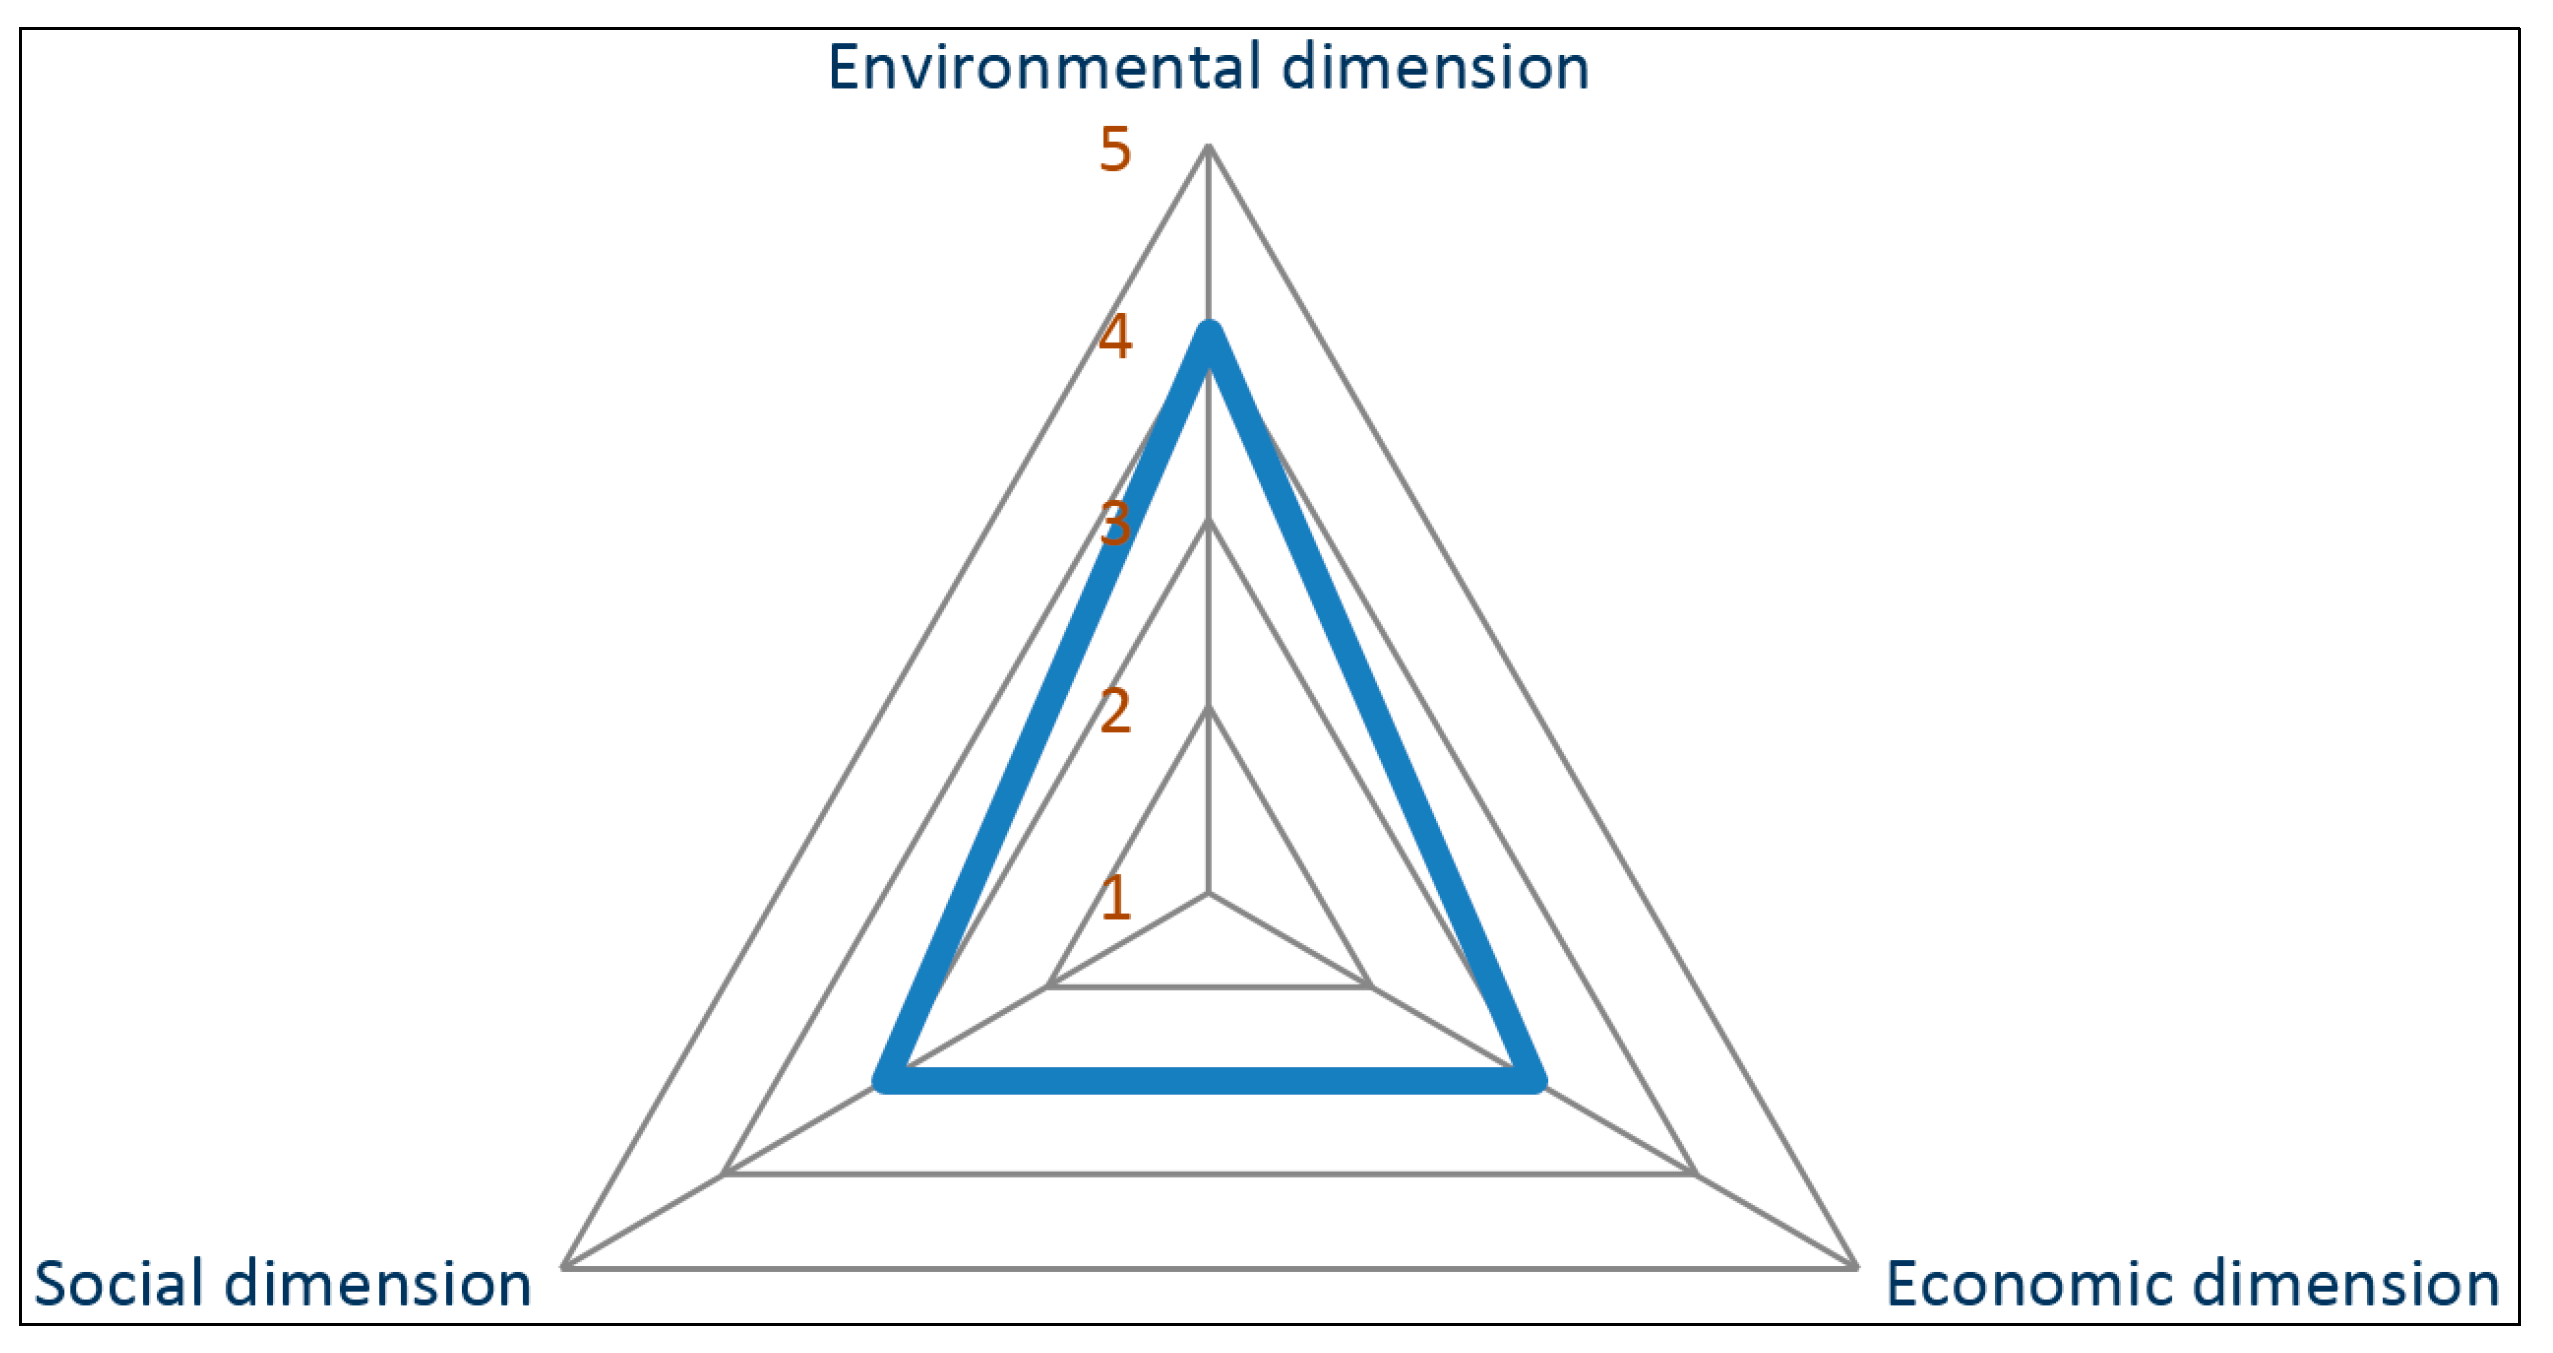
4.4. UQ Solar Integrated LCSA

5. Discussion
5.1. Problem Identification
5.1.1. Environmental Dimension
5.1.2. Economic Dimension
5.1.3. Social Dimension
5.2. Recommendations
5.2.1. Environmental Dimension
5.2.2. Economic Dimension
5.2.3. Social Dimension
6. Conclusions and Prospects
6.1. Key Messages
6.2. Limitations
- (1)
- As the main objectives of this study are to know whether current solar photovoltaic deployment is sustainable in Australia and how to make large-scale installation more sustainable in the future, it is not sufficient to assess just one case on the project level.
- (2)
- Life cycle sustainability assessment is such a complex topic that it is not sufficient to just assess three dimensions of sustainability separately.
- (3)
- UQ Solar is selected in this study because it is the largest flat roof PV installation in Australia and it is easily accessed. However, some social and economic problems cannot be properly examined in an academic-oriented establishment.
- (4)
- The limitations mentioned in each section of the assessment emphasize the limitations of data quality in this study. Not all data are case specific, and the interpretation of results, to a large extent, depends on the assumptions made.
- (5)
- When discussing a complex problem regarding sustainability, expert review and stakeholder participation can be very helpful, sometimes necessary, to grasp a comprehensive picture of this problem.
6.3. Prospects
- (1)
- With the aim of achieving sustainable large-scale PV installation in Australia, additional macro-level or landscape level systems need to be investigated to complete multi-level perspective analysis. It is helpful to employ adaptive and dynamic mechanisms.
- (2)
- Life cycle sustainability assessment is such a complex topic that more integrated frameworks should be adopted. It is recommended to take system interrelationships as well as dynamics into account.
- (3)
- In order to know what the social and economic problems really are, cases selected for study should cover different technologies adopted in different sizes of systems at different locations. The more representative the cases are, the more convincing the study is.
- (4)
- Further studies should concentrate on case-specific data gathering. At present, most of the data collected are based on European conditions, so it is crucial to improve Australian life cycle databases to find out problems that are urgently taking place in Australia. Sensitivity and uncertainty analysis should be conducted to make the results more reliable.
- (5)
- If possible, experts and stakeholders should actively take part in sustainability assessment. Their opinions should be considered during the whole life cycle assessment and adjustments should be made accordingly.
Acknowledgments
Author Contributions
Appendix
Assumptions of UQ Solar LCA
- (1)
- Delivery of various system components via road transport, including the transport of construction workers, is assumed to be 100 kM [27];
- (2)
- The existing database only has data on the inverter with a capacity of 2500 W, while in fact 5000 W and 12.5 kW inverters are used, therefore the data are correspondingly scaled using mass ratio 1.4 (2.3) [44] and energy ratio 2 (5) for 5000 W (12.5 kW) inverters;
- (3)
- For electric installation, most of material use can be assumed to be proportional to the installed capacity;
- (4)
- It is known 1800 MWh of electricity is generated per year for 1.22 MWp PV installation [17], so it is assumed 1770 MWh of electricity, in proportion, is generated per year for 1.2 MWp installation;
- (5)
- In database, the data is made for 3 kWp installation [27], while in fact the system is 1.2 MWp. So, every value is multiplied by 400 to fit in the studied system;
- (6)
- The whole defined PV system is uniformly simplified as flat roof installation;
- (7)
- The electricity supplied to UQ campus by conventional Queensland electricity grid does not have significant transmission—distribution losses;
- (8)
- All casted mc-Si is produced from solar-grade silicon; neither electronic grade silicon nor upgraded MG silicon is used.
| Unit | PV Modules | Mounting System | Electric Installation | Inverter | Transportation | Total | |
|---|---|---|---|---|---|---|---|
| Air Pollutants | |||||||
| Carbon monoxide (CO) | kg | 1872.5 | 2200 | 108 | 188.75 | 394.28 | 4763.62 |
| Hydrocarbons (HC) | kg | 19.70 | 3.23 | 0.67 | 1.18 | 1.00 | 25.78 |
| Lead (Pb) | kg | 8.99 | 0.163 | 2.95 | 1.33 | 0.03 | 13.46 |
| Nitrogen Oxides (NOx) | kg | 9190 | 514 | 171 | 272.4 | 432 | 10,581.2 |
| Particulate Matter (PM10) | kg | 1922.94 | 272 | 126.24 | 101.24 | 25.28 | 2447.77 |
| Sulfur Oxides (SOx) | kg | 24.8 | 0 | 0.901 | 57.37 | 0 | 84.33 |
| Greenhouse gases | |||||||
| Carbon dioxide (CO2) | kg | 2,690,000 | 285,000 | 44,700 | 76,610 | 59,180 | 3,155,877 |
| Methane (CH4) | kg | 15,441.4 | 599 | 122.246 | 147.699 | 69.54 | 16,380.32 |
| PV System (g/kWh) | Conventional Grid (g/kWh) | Net Emission (g/kWh) | ||
|---|---|---|---|---|
| Metals | Arsenic (As) | 4.28 × 10⁻⁵ | 1.41 × 10⁻⁵ | −2.87 × 10⁻⁵ |
| Cadmium (Cd) | 1.34 × 10⁻⁵ | 3.42 × 10⁻⁶ | −1.00 × 10⁻⁵ | |
| Chromium (Cr) | 5.15 × 10⁻⁵ | 2.84 × 10⁻⁵ | −2.30 × 10⁻⁵ | |
| Mercury (Hg) | 2.34 × 10⁻⁶ | 5.54 × 10⁻⁶ | 3.20 × 10⁻⁶ | |
| Criteria Air Pollutants | Lead (Pb) | 2.53 × 10⁻⁴ | 2.79 × 10⁻⁵ | −2.26 × 10⁻⁴ |
| Carbon Monoxide (CO) | 8.96 × 10⁻² | 7.20 × 10⁻¹ | 6.30 × 10⁻¹ | |
| Particulate Matter (PM10) | 4.61 × 10⁻² | 1.39 × 10⁻¹ | 9.32 × 10⁻² | |
| Nitrogen Oxides (NOx) | 1.99 × 10⁻¹ | 3.67 | 3.47 | |
| Sulfur Oxides (SOx) | 1.57 × 10⁻³ | 2.73 | 2.73 | |
| Greenhouse gases | Carbon Dioxide (CO2) | 5.94 × 101 | 8.64 × 10² | 8.05 × 10² |
| Methane (CH4) | 3.08 × 10⁻¹ | 7.92 × 10⁻¹ | 4.84 × 10⁻¹ | |
| Air Toxics | Benzene (C6H6) | 4.07 × 10⁻⁴ | 1.65 × 10⁻⁴ | −2.42 × 10⁻⁴ |
| Impact Category | Unit | Inverter | Electric Installation | Mounting System | PV Module | Transportation | Total |
|---|---|---|---|---|---|---|---|
| Abiotic depletion | kg Sb eq | 507.2442 | 349.7557 | 2116.7385 | 20,024.71 | 416.2695 | 23,414.71 |
| Acidification | kg SO2 eq | 736.0431 | 926.10171 | 1305.7183 | 27,130.96 | 341.8155 | 30,440.64 |
| Eutrophication | kg PO4 eq | 710.8017 | 1031.4202 | 476.21218 | 3597.214 | 81.6106 | 5897.259 |
| Global warming (GWP100) | kg CO2 eq | 82,154.04 | 48,457.16 | 338080.4 | 3,153,394 | 61,980.09 | 3,684,066 |
| Ozone layer depletion (ODP) | Kg CFC-11 eq | 0.005396 | 0.0013523 | 0.0162321 | 0.295842 | 0.00905 | 0.327872 |
| Human toxicity | kg 1,4-DB eq | 500,004.4 | 935,956.42 | 1,150,067.6 | 1,643,401 | 21,015.72 | 4,250,445 |
| Fresh water aquatic ecotoxicity | kg 1,4-DB eq | 182,845.5 | 5,690,261 | 233,253.8 | 705,574.5 | 5944.029 | 6,817,879 |
| Marine aquatic ecotoxicity | kg 1,4-DB eq | 4.72 × 10⁸ | 1.84 × 10⁹ | 326,874,804 | 1.56 × 10⁹ | 13,497,108 | 4.22 × 10⁹ |
| Terrestrial ecotoxicity | kg 1,4-DB eq | 1375.375 | 2331.5322 | 2896.7959 | 12,883.78 | 123.399 | 19,610.89 |
| Photochemical oxidation | kg C2H4 eq | 63.3772 | 36.694604 | 109.93306 | 1099.181 | 21.09426 | 1330.28 |
| Impact Category | Unit | PV System (kg/kWh) | Conventional Grid (kg/kWh) |
|---|---|---|---|
| Abiotic depletion | kg Sb eq | 0.000441 | 0.000553 |
| Acidification | kg SO2 eq | 0.000573 | 0.005129 |
| Eutrophication | kg PO4 eq | 0.000111 | 0.000518 |
| Global warming (GWP100) | kg CO2 eq | 0.069393 | 0.909119 |
| Ozone layer depletion (ODP) | kg CFC-11 eq | 6.17 × 10⁻⁹ | 5.31 × 10⁻¹⁰ |
| Human toxicity | kg 1,4-DB eq | 0.080053 | 0.29406 |
| Fresh water aquatic ecotox. | kg 1,4-DB eq | 0.128401 | 0.247349 |
| Marine aquatic ecotoxicity | kg 1,4-DB eq | 79.41658 | 800.2707 |
| Terrestrial ecotoxicity | kg 1,4-DB eq | 0.000369 | 0.000413 |
| Photochemical oxidation | kg C2H4 eq | 2.51 × 10⁻⁵ | 0.000189 |
| Input Variable | Value |
|---|---|
| Analysis Parameters/Analysis Period (years) | 30 |
| Analysis Parameters/Federal Income Tax Rate (%/year) | 30 |
| Analysis Parameters/Inflation Rate (%/year) | 2.5 |
| Analysis Parameters/Net Salvage Value (% of installed cost) | 10 |
| Analysis Parameters/Real Discount Rate (%/year) | 7.6 |
| Array/DC to AC ratio | 1.1 |
| CEC Performance Model with Module Database/Array height | One story building height or lower |
| CEC Performance Model with Module Database/Mounting standoff | Building integrated |
| CEC Performance Model/Columns of modules in array | 10 |
| CEC Performance Model/Gap Spacing (m) | 0.05 |
| CEC Performance Model/Heat Transfer Dimensions | Module Dimensions |
| CEC Performance Model/Material | Multi-c-Si |
| CEC Performance Model/Module Area (m2) | 1.618 |
| CEC Performance Model/Module Name | SAM/CEC Modules/Trina Solar TSM-240PA05.38 |
| CEC Performance Model/Module Width (m) | 0.992 |
| CEC Performance Model/Mounting Configuration | Rack |
| CEC Performance Model/Number of Cells | 60 |
| CEC Performance Model/Rows of modules in array | 1 |
| Depreciation/Federal Straight Line Depreciation Years | 20 |
| Inverter (Sandia)/Sandia Inverter | SAM/Sandia Inverters/Power-One Inc.: PVI-12.0-I-OUTD-x-US-480-y 480V [CEC 2011] |
| Inverter (Sandia)/Sandia Inverter | SAM/Sandia Inverters/SMA America: SB4000US 240V [CEC 2007] |
| Inverter Datasheet/ Manufacturer efficiency (%) | 96 |
| Inverter Datasheet/Maximum AC output power (Wac) | 12441.6 |
| Inverter Datasheet/Maximum DC current (Adc) | 36 |
| Inverter Datasheet/Maximum DC voltage (Vdc) | 900 |
| Inverter Datasheet/Maximum MPPT DC voltage (Vdc) | 750 |
| Inverter Datasheet/Minimum MPPT DC voltage (Vdc) | 360 |
| Inverter Datasheet/Nominal AC voltage (Vac) | 400 |
| Inverter Datasheet/Nominal DC voltage (Vdc) | 360 |
| Inverter Datasheet/Power consumption at night (Wac) | 3.1104 |
| Inverter Datasheet/Power consumption during operation (Wdc) | 0 |
| Inverter Datasheet/Weighted efficiency (%) | 97.2 |
| Inverter Part Load Curve/Maximum AC output power (Wac) | 36,000 |
| Inverter Part Load Curve/Maximum DC current (Adc) | 150 |
| Inverter Part Load Curve/Maximum DC voltage (Vdc) | 600 |
| Inverter Part Load Curve/Maximum MPPT DC voltage (Vdc) | 480 |
| Inverter Part Load Curve/Minimum MPPT DC voltage (Vdc) | 250 |
| Inverter Part Load Curve/Nominal AC voltage (Vac) | 240 |
| Inverter Part Load Curve/Nominal DC voltage (Vdc) | 310 |
| Inverter Part Load Curve/Power consumption at night (Wac) | 0.6 |
| Inverter Part Load Curve/Weighted Efficiency Type | CEC efficiency |
| Loan Parameters/Debt Fraction (%) | 0 |
| Loan Parameters/Loan Rate (%/year) | 7.78 |
| Loan Parameters/Loan Term (years) | 15 |
| Location and Resource/Location | C:\Users\Fisher\Desktop\SAM weather data/AUS_QLD.Brisbane.945780_IWEC.epw |
| O and M Costs/Fixed Cost by Capacity ($/kW-year) | 12 |
| PV Array Self-Shading/Mask Angle Calculation Method | Average over Entire Array |
| PV Array Self-Shading/Number of Bypass Diodes | 3 |
| PV Array Self-Shading/Number of Cells along Width | 6 |
| PV Array Self-Shading/Number of Modules along Side | 1 |
| PV Array Self-Shading/Number of Strings along Bottom | 1 |
| PV Array Self-Shading/Orientation | Portrait |
| PV Array Self-Shading/Row Spacing (m) | 5 |
| PV Array Self-Shading/Width (m) | 0.992 |
| PV Array/AC wiring losses ((0..1)) | 0.97 |
| PV Array/Desired array size (kWdc) | 1202 |
| PV Array/Mode | Specify desired array size |
| PV Array/Modules per string | 40 |
| PV Array/Monthly ground reflectance (albedo) | 0.2 |
| PV Array/Number of inverters | 88 |
| PV Array/PV Radiation Model (0 = Total&Beam 1 = Beam&Diffuse) | 0 |
| PV Array/PV Tilt Radiation Model (0 = Isotropic 1 = HDKR 2 = Perez) | Perez |
| PV Array/Packing factor | 1.05 |
| PV Array/Row offset (m) | 0 |
| PV Array/Step-up transformer losses ((0..1)) | 1 |
| PV Array/Strings in parallel | 125 |
| PV Array/Use albedo in weather file if it exists | 1 |
| PV Capital Costs/Balance of System Equipment Capacity ($/Wdc) | 0.219 |
| PV Capital Costs/Contingency | 5 |
| PV Capital Costs/Engineering Cost, by Capacity ($/Wdc) | 0.14 |
| PV Capital Costs/Grid Interconnect Cost, by Capacity ($/Wdc) | 0.13 |
| PV Capital Costs/Installation Labor, by Capacity ($/Wdc) | 0.625 |
| PV Capital Costs/Installer Margin and Overhead, by Capacity ($/Wdc) | 0.625 |
| PV Capital Costs/Inverter Cost | 0.5 |
| PV Capital Costs/Module Cost | 1.53 |
| PV Capital Costs/Permitting Cost, by Capacity ($/Wdc) | 0.06 |
| PV Inverter/Inverter Model Type (0 = CEC, 1 = DATASHEET, 3 = PARTLOAD) | 1 |
| PV Module Manufacturer Specifications Model/Approximate installation height | Two story building height or higher |
| PV Module Manufacturer Specifications Model/Cell type | Multi-Si |
| PV Module Manufacturer Specifications Model/Maximum power point current (Imp) (A) | 6 |
| PV Module Manufacturer Specifications Model/Maximum power point voltage (Vmp) (V) | 30 |
| PV Module Manufacturer Specifications Model/Module area (m2) | 1.3 |
| PV Module Manufacturer Specifications Model/Module description | Generic polycrystalline silicon module |
| PV Module Manufacturer Specifications Model/Nominal operating cell temperature ('C) | 46 |
| PV Module Manufacturer Specifications Model/Number of cells in series | 60 |
| PV Module Manufacturer Specifications Model/Open circuit voltage (Voc) (V) | 37 |
| PV Module Manufacturer Specifications Model/Short circuit current (Isc) (A) | 7 |
| PV Module Manufacturer Specifications Model/Standoff height | Ground or rack mounted |
| PV Module Manufacturer Specifications Model/Temperature coefficient of Isc | 0.004 |
| PV Module Manufacturer Specifications Model/Temperature coefficient of Voc | −0.11 |
| PV Module Manufacturer Specifications Model/Temperature coefficient of max. power point (%/'C) | −0.41 |
| PV Module/Module Model Type (0 = MPE 1 = CEC 2 = CECUSER 3 = SANDIA) | 1 |
| PV Subarray 1/Azimuth 1 (deg) | 20 |
| PV Subarray 1/DC wiring losses 1 (%) | 0.98 |
| PV Subarray 1/Diode and connection losses 1 (%) | 0.995 |
| PV Subarray 1/Ground coverage ratio 1 | 0.3 |
| PV Subarray 1/Mismatch losses 1 (%) | 0.98 |
| PV Subarray 1/Nameplate derate 1 (%) | 1 |
| PV Subarray 1/Self-shading mode for 1x trackers | Self-shaded |
| PV Subarray 1/Tilt 1 (deg) | 4 |
| PV Subarray 1/Tracker rotation limit 1 (deg) | 45 |
| PV Subarray 1/Tracking error 1 (%) | 1 |
| PV Subarray 1/Tracking mode 1 | Fixed |
| Performance Adjustment/Year-to-year decline in output (compounded annually) | 0.7 |
| Sandia Inverter Model/Maximum AC power (Wac) | 12,000 |
| Sandia Inverter Model/Maximum DC current (Adc) | 25 |
| Sandia Inverter Model/Maximum DC power (Wdc) | 12,363.9 |
| Sandia Inverter Model/Maximum DC voltage (Vdc) | 520 |
| Sandia Inverter Model/Maximum MPPT DC voltage (Vdc) | 470 |
| Sandia Inverter Model/Minimum MPPT DC voltage (Vdc) | 250 |
| Sandia Inverter Model/Nominal AC voltage (Vac) | 480 |
| Sandia Inverter Model/Nominal DC voltage (Vdc) | 374.028 |
| Sandia Inverter Model/Power consumption at night (Wac) | 0.4 |
| Sandia Inverter Model/Power consumption during operation | 69.199 (Wdc) |
| Sandia PV Array Performance Model/Material | Mc-Si |
| Sandia PV Array Performance Model/Module Area (m2) | 1.312 |
| Sandia PV Array Performance Model/Module Name | SAM/Sandia Modules/Advent Solar AS160 [2006] |
| Sandia PV Array Performance Model/Module Structure and Mounting | Use Database Values |
| Sandia PV Array Performance Model/Number of Cell Strings in Parallel | 1 |
| Sandia PV Array Performance Model/Number of Cells in Series | 72 |
| Sandia PV Array Performance Model/Vintage | 2006 |
| Sandia PV Array Performance Model/a | −99 |
| String Wiring | Horizontal |
| Utility Rate/Flat Buy Rate ($/kWh) | 0.125 |
| Utility Rate/Flat Sell Rate ($/kWh) | 0.125 |
| Utility Rate/Out-year Escalation (%/year) | 1.82 |
| Utility Rate/Year End Sell Rate ($/kWh) | 0.0289 |

Conflicts of Interest
References
- Che, N.; Feng, A.; McCluskey, C.; Pham, P.; Willcock, T.; Stanwix, G. 2013 Australian Energy Update; Bureau of Resources and Energy Economics (BREE): Canberra, Australia, 2013. [Google Scholar]
- Geoscience Australia and ABARE. Australian Energy Resource Assessment; Geoscience Australia and ABARE: Canberra, Australia, 2010. [Google Scholar]
- BREE. Energy in Australia 2013; BREE: Canberra, Australia, 2013. [Google Scholar]
- Finkbeiner, M.; Schau, E.M.; Lehmann, A.; Traverso, M. Towards life cycle sustainability assessment. Sustainability 2010, 2, 3309–3322. [Google Scholar] [CrossRef]
- Kloepffer, W. Life cycle sustainability assessment of products (with comments by Helias A. Udo de Haes). Int. J. Life Cycle Assess. 2008, 13, 89–95. [Google Scholar] [CrossRef]
- Zamagni, A.; Buttol, P.; Buonamici, R.; Masoni, P.; Guinee, J.B.; Huppes, G.; Heijungs, R.; van der Voet, E.; Ekvall, T.; Rydberg, T. D20 Blue Paper on Life Cycle Sustainability Analysis (Revision 1 after the Open Consultation). Available online: http://www.leidenuniv.nl/cml/ssp/publications/calcas_report_d20.pdf (accessed on 19 January 2015).
- Halog, A.; Manik, Y. Advancing integrated systems modelling framework for life cycle sustainability assessment. Sustainability 2011, 3, 469–499. [Google Scholar] [CrossRef]
- UNEP/SETAC Life Cycle Initiative. Towards a Life Cycle Sustainability Assessment—Making Informed Choices on Products. Available online: http://www.unep.org/pdf/UNEP_LifecycleInit_Dec_FINAL.pdf (accessed on 19 January 2015).
- Alsema, E.A. Energy pay-back time and CO2 emissions of PV Systems. Prog. Photovolt. Res. Appl. 2000, 8, 17–25. [Google Scholar] [CrossRef]
- Meijer, A. Life-cycle assessment of photovoltaic modules: Comparison of mc-Si, InGaP and InGaP/mc-Si solar modules. Prog. Photovolt. Res. Appl. 2003, 11, 275–287. [Google Scholar] [CrossRef]
- Jungbluth, N. Life cycle assessment of crystalline photovoltaics in the Swiss ecoinvent database. Prog. Photovolt. Res. Appl. 2005, 13, 429–446. [Google Scholar] [CrossRef]
- Alsema, E.; de Wild-Scholten, M. Environmental impact of crystalline silicon photovoltaic module production. In Proceedings of the Material Research Society Fall Meeting, Symposium G: Life Cycle Analysis Tools for “Green” Materials and Process Selection, Boston, MA, USA, 28–30 November 2005.
- Fthenakis, V.; Alsema, E. Photovoltaics energy payback times, greenhouse gas Emissions and external costs: 2004-early 2005 status. Prog. Photovolt. Res. Appl. 2006, 14, 275–280. [Google Scholar] [CrossRef]
- De Wild-Scholten, M.J. Renewable and Sustainable. In Proceedings of the CrystalClear Final Event, Munich, Germany, 26 May 2009.
- Fthenakis, V.M. Sustainability metrics for extending thin-film photovoltaics to terawatt levels. MRS Bull. 2012, 37, 425–430. [Google Scholar] [CrossRef]
- APVI. Mapping Australian Photovoltaic Installations. Available online: http://pv-map.apvi.org.au/historical#4/-26.67/134.12 (accessed on 15 April 2014).
- UQ Solar. Available online: http://uq.edu.au/solarenergy/ (accessed on 20 April 2014).
- Watt, M.; Passey, R. PV in Australia 2012. Available online: http://apvi.org.au/wp-content/uploads/2013/11/Australian-PV-Report-2012.pdf (accessed on 19 January 2015).
- Ecoinvent. Available online: http://www.ecoinvent.ch (accessed on 4 May 2014).
- Australia Greenhouse Office. RMY Australia Representative Meteorological Year Climate Files; Department of the Environment and Water Resources, Commonwealth of Australia: Canberra, Australia, 2006. [Google Scholar]
- Australian PV Association (APVA). Modelling of PV and Electricity Prices in the Australian Commercial Sector; Australian PV Association (APVA): Canberra, Australia, 2011. [Google Scholar]
- BREE. Australia Energy Technology Assessment; BREE: Canberra, Australia, 2012. [Google Scholar]
- AUSTELA. Australian Companion Guide to SAM for Concentrating Solar Power. Available online: http://austela.com.au/docs/projects/sam/SAM_for_Aus_Companion_Guide_20140306.pdf (accessed on 19 January 2015).
- Fthenakis, V.; Frischknecht, R.; Raugei, M.; Kim, H.C.; Alsema, E.; Held, M.; de Wild-Scholten, M. Methodology Guidelines on Life Cycle Assessment of Photovoltaic Electricity. Available online: http://www.seas.columbia.edu/clca/IEA_Task12_LCA_Guidelines_12_1_11_Latest.pdf (accessed on 19 January 2015).
- TrinaSolar. Available online: http://www.trinasolar.com/ (accessed on 23 April 2014).
- Fthenakis, V.; Kim, H.C.; Frischknecht, R.; Raugei, M.; Sinha, P.; Stucki, M. Life Cycle Inventories and Life Cycle Assessment of Photovoltaic Systems; International Energy Agency (IEA) PVPS Task 12, Report T12-02; International Energy Agency (IEA): New York, NY, USA, 2011. [Google Scholar]
- Jungbluth, N.; Stucki, M.; Frischknecht, R. Final Report No. 6 Ecoinvent v2.1; Bauer, C., Ed.; Swiss Centre for LCI, PSI: Villigen, Switzerland, 2009; Volume 6. [Google Scholar]
- Ecoinvent. Allocation, Cut-off by Classification. Available online: http://www.ecoinvent.org/database/ecoinvent-version-3/system-models/allocation-cut-off-by-classification/ (accessed on 2 May 2014).
- Fthenakis, V.M.; Kim, H.C. Photovoltaics: Life-cycle analyses. Sol. Energy 2011, 85, 1609–1628. [Google Scholar] [CrossRef]
- Fthenakis, V. Overview of potential hazards. In Practical Handbook of Photovoltaics: Fundamentals and Applications; Markvart, T., Castaner, L., Eds.; Elsevier: Oxford, UK, 2003; pp. 857–868. [Google Scholar]
- Fuller, S.K.; Petersen, S.R. NIST Handbook 135 Life-Cycle Costing Manual for the Federal Energy Management Program; U.S. Government Printing Office: Washington, DC, USA, 1996. [Google Scholar]
- APVA. Development of a Strategic Planning Model for ASI to Assist Further Development of the Australian PV Sector; APVA: Richmond, VA, USA, 2010. [Google Scholar]
- Stanford University. Guidelines for Life Cycle Cost Analysis; Stanford University: Stanford, CA, USA, 2005. [Google Scholar]
- NREL. System Advisor Model (SAM)’s Help System; NREL: Golden, CO, USA, 2014. [Google Scholar]
- Energex Limited. PeakSmart Time of Use Tariff; Energex Limited: Brisbane, Australia, 2012. [Google Scholar]
- Trina Solar. Corporate Social Responsibility Report; Trina Solar: Changzhou, China, 2012. [Google Scholar]
- SVTC. Toward a just and Sustainable Solar Energy Industry. A Silicon Valley Toxics Coalition White Paper; SVTC: San Francisco, CA, USA, 2009. [Google Scholar]
- SVTC. A Project of the Silicon Valley Toxics Coalition; 2013 Solar Scorecard; SVTC: San Francisco, CA, USA, 2013. [Google Scholar]
- Byrnes, L.; Brown, C.; Foster, J.; Wagner, L. Australian renewable energy policy: Barriers and challenges. Renew. Energ. 2013, 60, 711–721. [Google Scholar] [CrossRef]
- DERM. ClimateQ: Toward a Greener Queensland; DERM: Brisbane, Australia, 2009. [Google Scholar]
- Berrill, T. Clean Energy Pathways? A Review of Energy Policy in Queensland with a Regional Case Study of the Impacts on the Felton Valley. Available online: http://r.search.yahoo.com/_ylt=A86.J3U16L1U3kAAN5ElnIlQ;_ylu=X3oDMTEzY3Nia2wzBHNlYwNzcgRwb3MDMQRjb2xvA2dxMQR2dGlkA1lIUzAwMl8x/RV=2/RE=1421760694/RO=10/RU=http%3a%2f%2fxa.yimg.com%2fkq%2fgroups%2f17964577%2f690092342%2fname%2fClean%2bEnergy%2bPathways%2b-%2bQld%2bEnergy%2bPolicy%2bReview%2bV2.pdf/RK=0/RS=GSYJ7eFw9J235x5IfeL1ZWr86xI- (accessed on 19 January 2015).
- APVA. A Distributed Energy Market: Consumer & Utility Interest, and the Regulatory Requirements. Available online: http://apvi.org.au/a-distributed-energy-market-consumer-utility-interest-and-the-regulatory-requirements/ (accessed on 19 January 2015).
- Pinderhughes, R. Green Collar Jobs; Berkeley Office of Energy and Sustainable Development: Berkeley, CA, USA, 2007. [Google Scholar]
- Energymatters. Available online: http://store.energymatters.com.au/brand/abb/products/inverters (accessed on 27 April 2014).
© 2015 by the authors; licensee MDPI, Basel, Switzerland. This article is an open access article distributed under the terms and conditions of the Creative Commons Attribution license (http://creativecommons.org/licenses/by/4.0/).
Share and Cite
Yu, M.; Halog, A. Solar Photovoltaic Development in Australia—A Life Cycle Sustainability Assessment Study. Sustainability 2015, 7, 1213-1247. https://doi.org/10.3390/su7021213
Yu M, Halog A. Solar Photovoltaic Development in Australia—A Life Cycle Sustainability Assessment Study. Sustainability. 2015; 7(2):1213-1247. https://doi.org/10.3390/su7021213
Chicago/Turabian StyleYu, Man, and Anthony Halog. 2015. "Solar Photovoltaic Development in Australia—A Life Cycle Sustainability Assessment Study" Sustainability 7, no. 2: 1213-1247. https://doi.org/10.3390/su7021213
APA StyleYu, M., & Halog, A. (2015). Solar Photovoltaic Development in Australia—A Life Cycle Sustainability Assessment Study. Sustainability, 7(2), 1213-1247. https://doi.org/10.3390/su7021213