Article

Oxygen Control and Improved Denitrification Efficiency by Means of a Post-Anoxic Reactor

1
Department of Biotechnologies and Life Sciences, University of Insubria, Via G.B. Vico 46, I-21100 Varese, Italy
2
Department of Civil Engineering and Computer Science Engineering, University of Rome "Tor Vergata", Via Politecnico 1, I-00133 Roma, Italy
3
Department of Civil and Environmental Engineering, University of Rome "La Sapienza", Via Eudossiana 18, I-00184 Rome, Italy
*
Author to whom correspondence should be addressed.
These authors contributed equally to this work.
Sustainability 2015, 7(2), 1201-1212; https://doi.org/10.3390/su7021201
Submission received: 17 November 2014 / Accepted: 19 January 2015 / Published: 23 January 2015
(This article belongs to the Special Issue Sustainability of Resources)

Abstract

:
The presence of dissolved oxygen (DO) in biological denitrification reactors determines inhibition effects on the denitrification rate. The article shows the results of an experimental study to control the DO concentration in the pre-denitrification stage by a post-anoxic reactor. The results demonstrate that the post-anoxic reactor is very effective in improving the nitrogen removal efficiency because it causes a considerable reduction of the DO content in the mixed liquor recycle sent to the pre-denitrification reactor. This reduction is influenced by both the retention time and the F:M ratio (referred to the denitrification and the oxidation-nitrification volume). In fact, a retention time and a F:M ratio equal to 1.5 h and 0.130 kgBOD5 kgMLVSS−1·day−1, respectively, allow to limit DO in the post-anoxic reactor at 0.31 mgO2·L−1. Such concentration determines a DO concentration of 0.11 mgO2·L−1 in the pre-denitrification reactor and, consequently, a denitrification efficiency of 91%. Moreover, the contribution of the endogenous denitrification to the whole denitrification efficiency was found negligible. The paper contributes to the progress in nitrogen removal from sewage, a fundamental issue for a sustainable management of water resources.

Graphical Abstract

1. Introduction

Anthropic activities such as industrial plants, intensive agriculture, zootechny, uncontrolled waste disposal and domestic wastewater discharge introduce many pollutants in the environment. Nitrogen is one of them and can be found in both surface and ground water. It is one of the possible causes of eutrophication, while some compounds (e.g., NH3, NO3) can be harmful for human health at relative high concentrations. Therefore, nitrogen control is one of the key factors for the sustainable management of water resources.
Nitrogen compounds can be removed by the means of physico-chemical (e.g., chemical oxidation, stripping, ion exchange, breakpoint chlorination) and biological treatments [1,2,3,4,5,6]. The last ones are cost-effective and they are based on the presence of both aerobic and anoxic bacteria. In the nitrification stage, aerobic bacteria oxidize ammonia (NH4-N) into nitrites (NO2-N) and, subsequently, nitrates (NO3-N) in presence of DO. In the denitrification stage bacteria convert NO3-N into gaseous nitrogen (i.e., N2, NO and N2O) under anoxic conditions (absence of DO). Different denitrification layouts have been proposed for biological removal of nitrogen [2]: pre-denitrification, post-denitrification and simultaneous denitrification. Pre-denitrification is one of the most diffused and consists in an anoxic tank (pre-denitrification tank) upstream to the biological nitrification-oxidation reactor. The activated sludge of the oxidation reactor containing NO3-N is recirculated with high flow rate in the anoxic pre-denitrification tank in order to remove nitrates from wastewater.
Small concentrations of DO are constantly present in biological pre-denitrification reactors. The daily average concentrations measured on real scale plants are mostly in the range 0.2–0.4 mgO2·L−1, with higher peaks during the day, especially in small wastewater treatment plants (WWTPs) which are characterized by strong fluctuations of flow rate and quality [7,8]. Therefore, the DO concentration within the anoxic reactor is the result of two opposing factors: The oxygen consumption by heterotrophic bacteria and the oxygen intake from raw sewage, sludge recycle and, mainly, mixed-liquor recycle (ML-recycle).
The design of the biological pre-denitrification reactor is generally conducted on the basis of the denitrification rate (rDENT, gNO3-N kgMLVSS−1·h−1), assuming a zero-order kinetics (in relation to both NO3-N and organic substrate) and considering the relevant effect of the temperature (T, °C) [9,10,11,12,13,14]:
r D E N T = r D E N 20   ° C θ T 20
where rDEN 20 °C = 2.9 ÷ 3.0 gNO3-N kgMLVSS−1·h−1 is the denitrification rate at 20 °C and θ is the temperature coefficient (θ = 1.026; θ = 1.07). Such a value can be significantly reduced by the presence of DO in the denitrification reactor. The possible inhibitory effects of DO on the kinetics of the process were postulated by US-EPA [9]. Further studies highlighted and deepened this effect introducing an inhibition factor and considering both dissimilative and assimilative (cell synthesis) denitrification [2,15,16,17]. A detailed description of such factors can be found elsewhere [18]. DO inhibition on the denitrification rate also depends to the floc size and structure [2]. In any case, the mere presence of 0.2 mgO2·L−1 can reduce rDEN up to 40% in respect to the maximum value [2,16,17].
For the practical sizing of the denitrification reactor volume (VDEN, m3) a semi-empirical relationship which correlates the Specific DeNitrification Rate (SDNR, gNO3-N gMLVSS−1·day−1) to the sludge loading in denitrification (F:M, gBOD5 applied gMLVSS−1·day−1) has been proposed [2,19]:
S D N R 20 ° C = 0.03 F : M + 0.029
S D N R = Q Δ N O 3 N V D E N X
where Q is the sewage flow rate (m3·day−1), ΔNO3-N is the removed nitrogen, as nitrate, per unit of volume (gNO3-N·m−3) and X is the biomass concentration in the denitrification reactor (gMLVSS·m−3). Values of SDNR observed in full scale pre-anoxic reactors range from 0.04 to 0.42 gNO3-N·gMLVSS−1·day−1 [2,15,20]. A recent research highlighted the strong dependence of the SDNR in pre-denitrification from both the DO concentration and the F:M ratio [18] and suggested that the optimal DO concentration for good denitrification efficiencies should be less than 0.2 mgO2·L−1.
In the present paper the authors show the possibility of reducing the DO concentration in the ML-recycle by applying a post-anoxic reactor, which is a reactor downstream of the oxidation-nitrification stage where the only available carbon source is endogenous. Post-anoxic reactors have already been applied to achieve post-denitrification but with poor results; in fact, endogenous carbon allows a very low denitrification rate if compared to external carbon sources. The aim of this experience is to verify the ability of a post-anoxic reactor to reduce the DO concentration so far as to allow a noticeable improvement of the pre-denitrification performance. Preliminary batch tests with mixed liquor samples from an oxidation-nitrification stage were carried out in order to verify the DO behavior in anoxic conditions, while a pilot-plant with two parallel lines has been used to compare the denitrification performances with and without the presence of a post-anoxic reactor.

2. Materials and Methods

2.1. Preliminary Batch Tests

Preliminary respirometric batch tests were performed on 60 samples of mixed-liquor collected downstream of the oxidation-nitrification reactor at three F:M ratios [21]. Tests were conducted in a 1 L bottle completely filled with mixed-liquor and closed with a watertight stopper. For the complete mixing of the mixed-liquor a magnetic stir bar was used. DO concentrations were measured by means of an electrochemical probe (accuracy: 0.01 mgO2·L−1) with automatic calibration and temperature compensation.

2.2. Experimental Pilot Plants
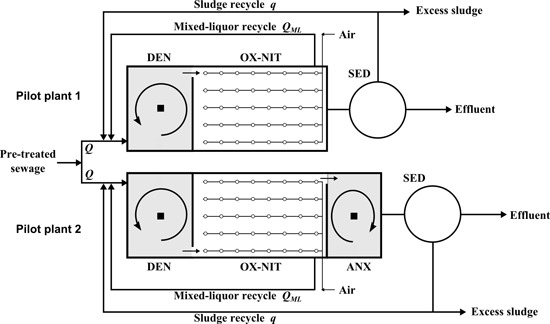
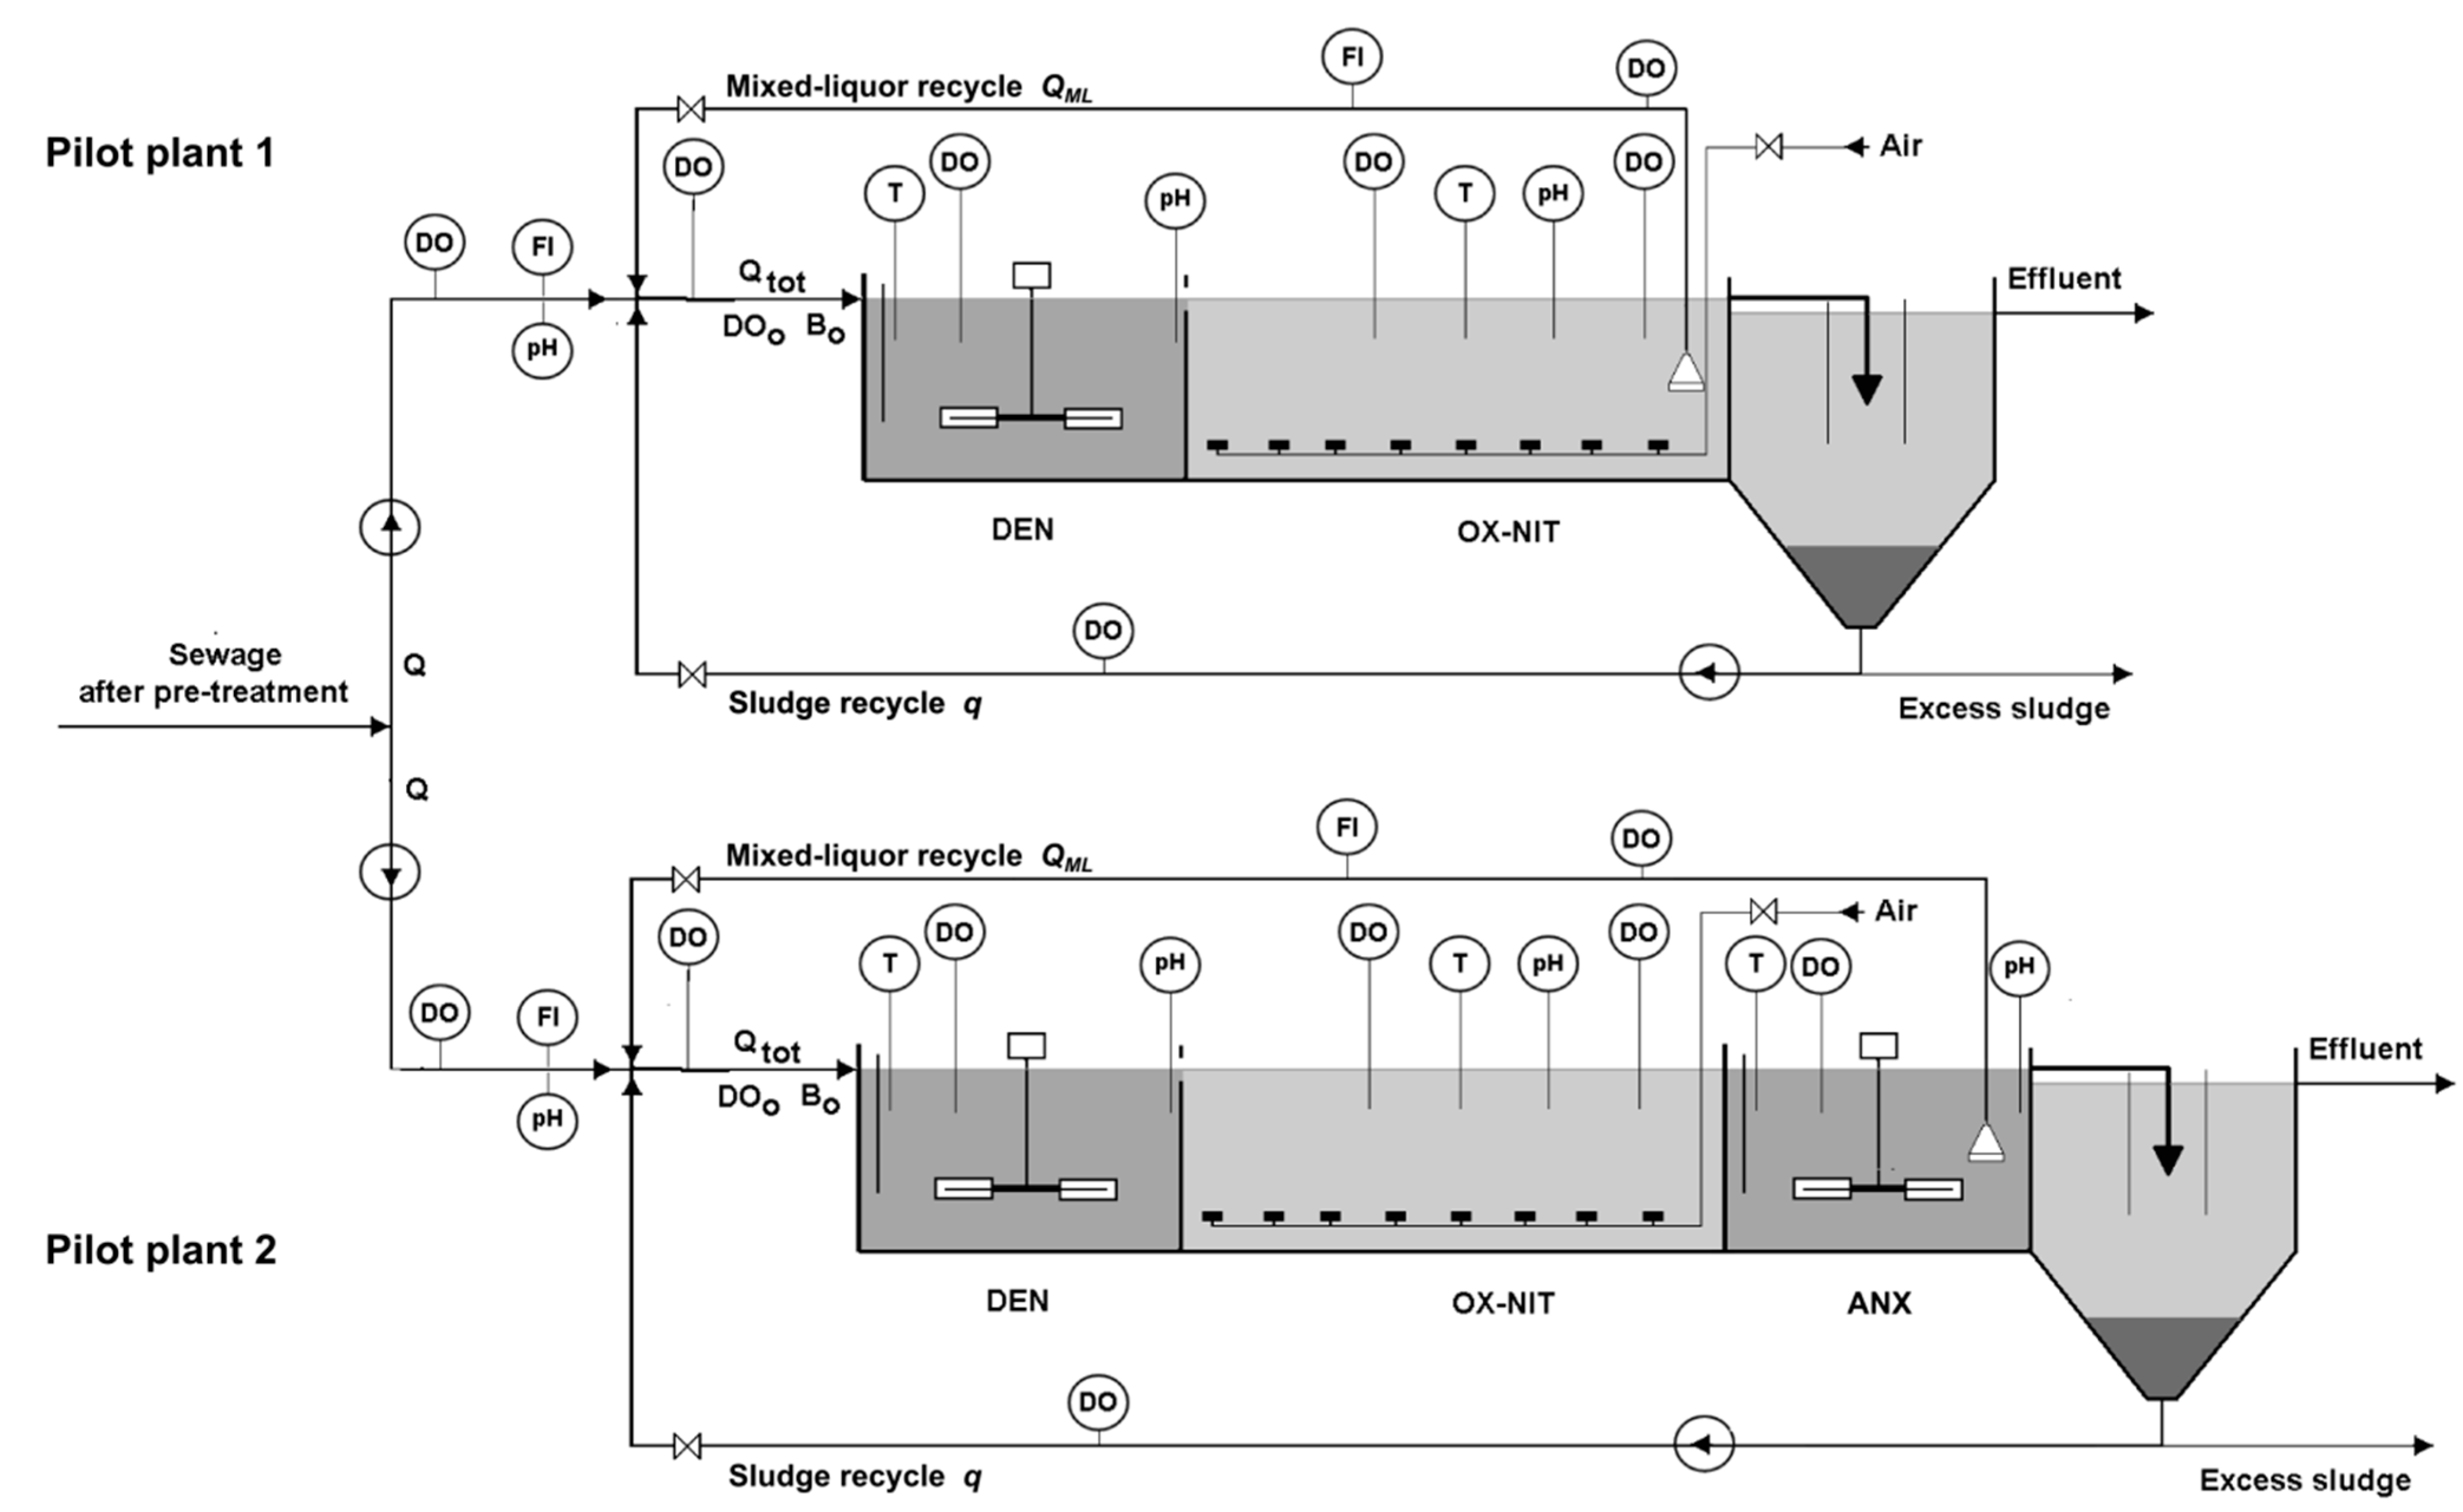
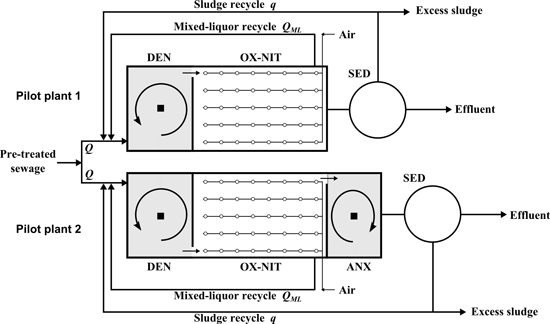
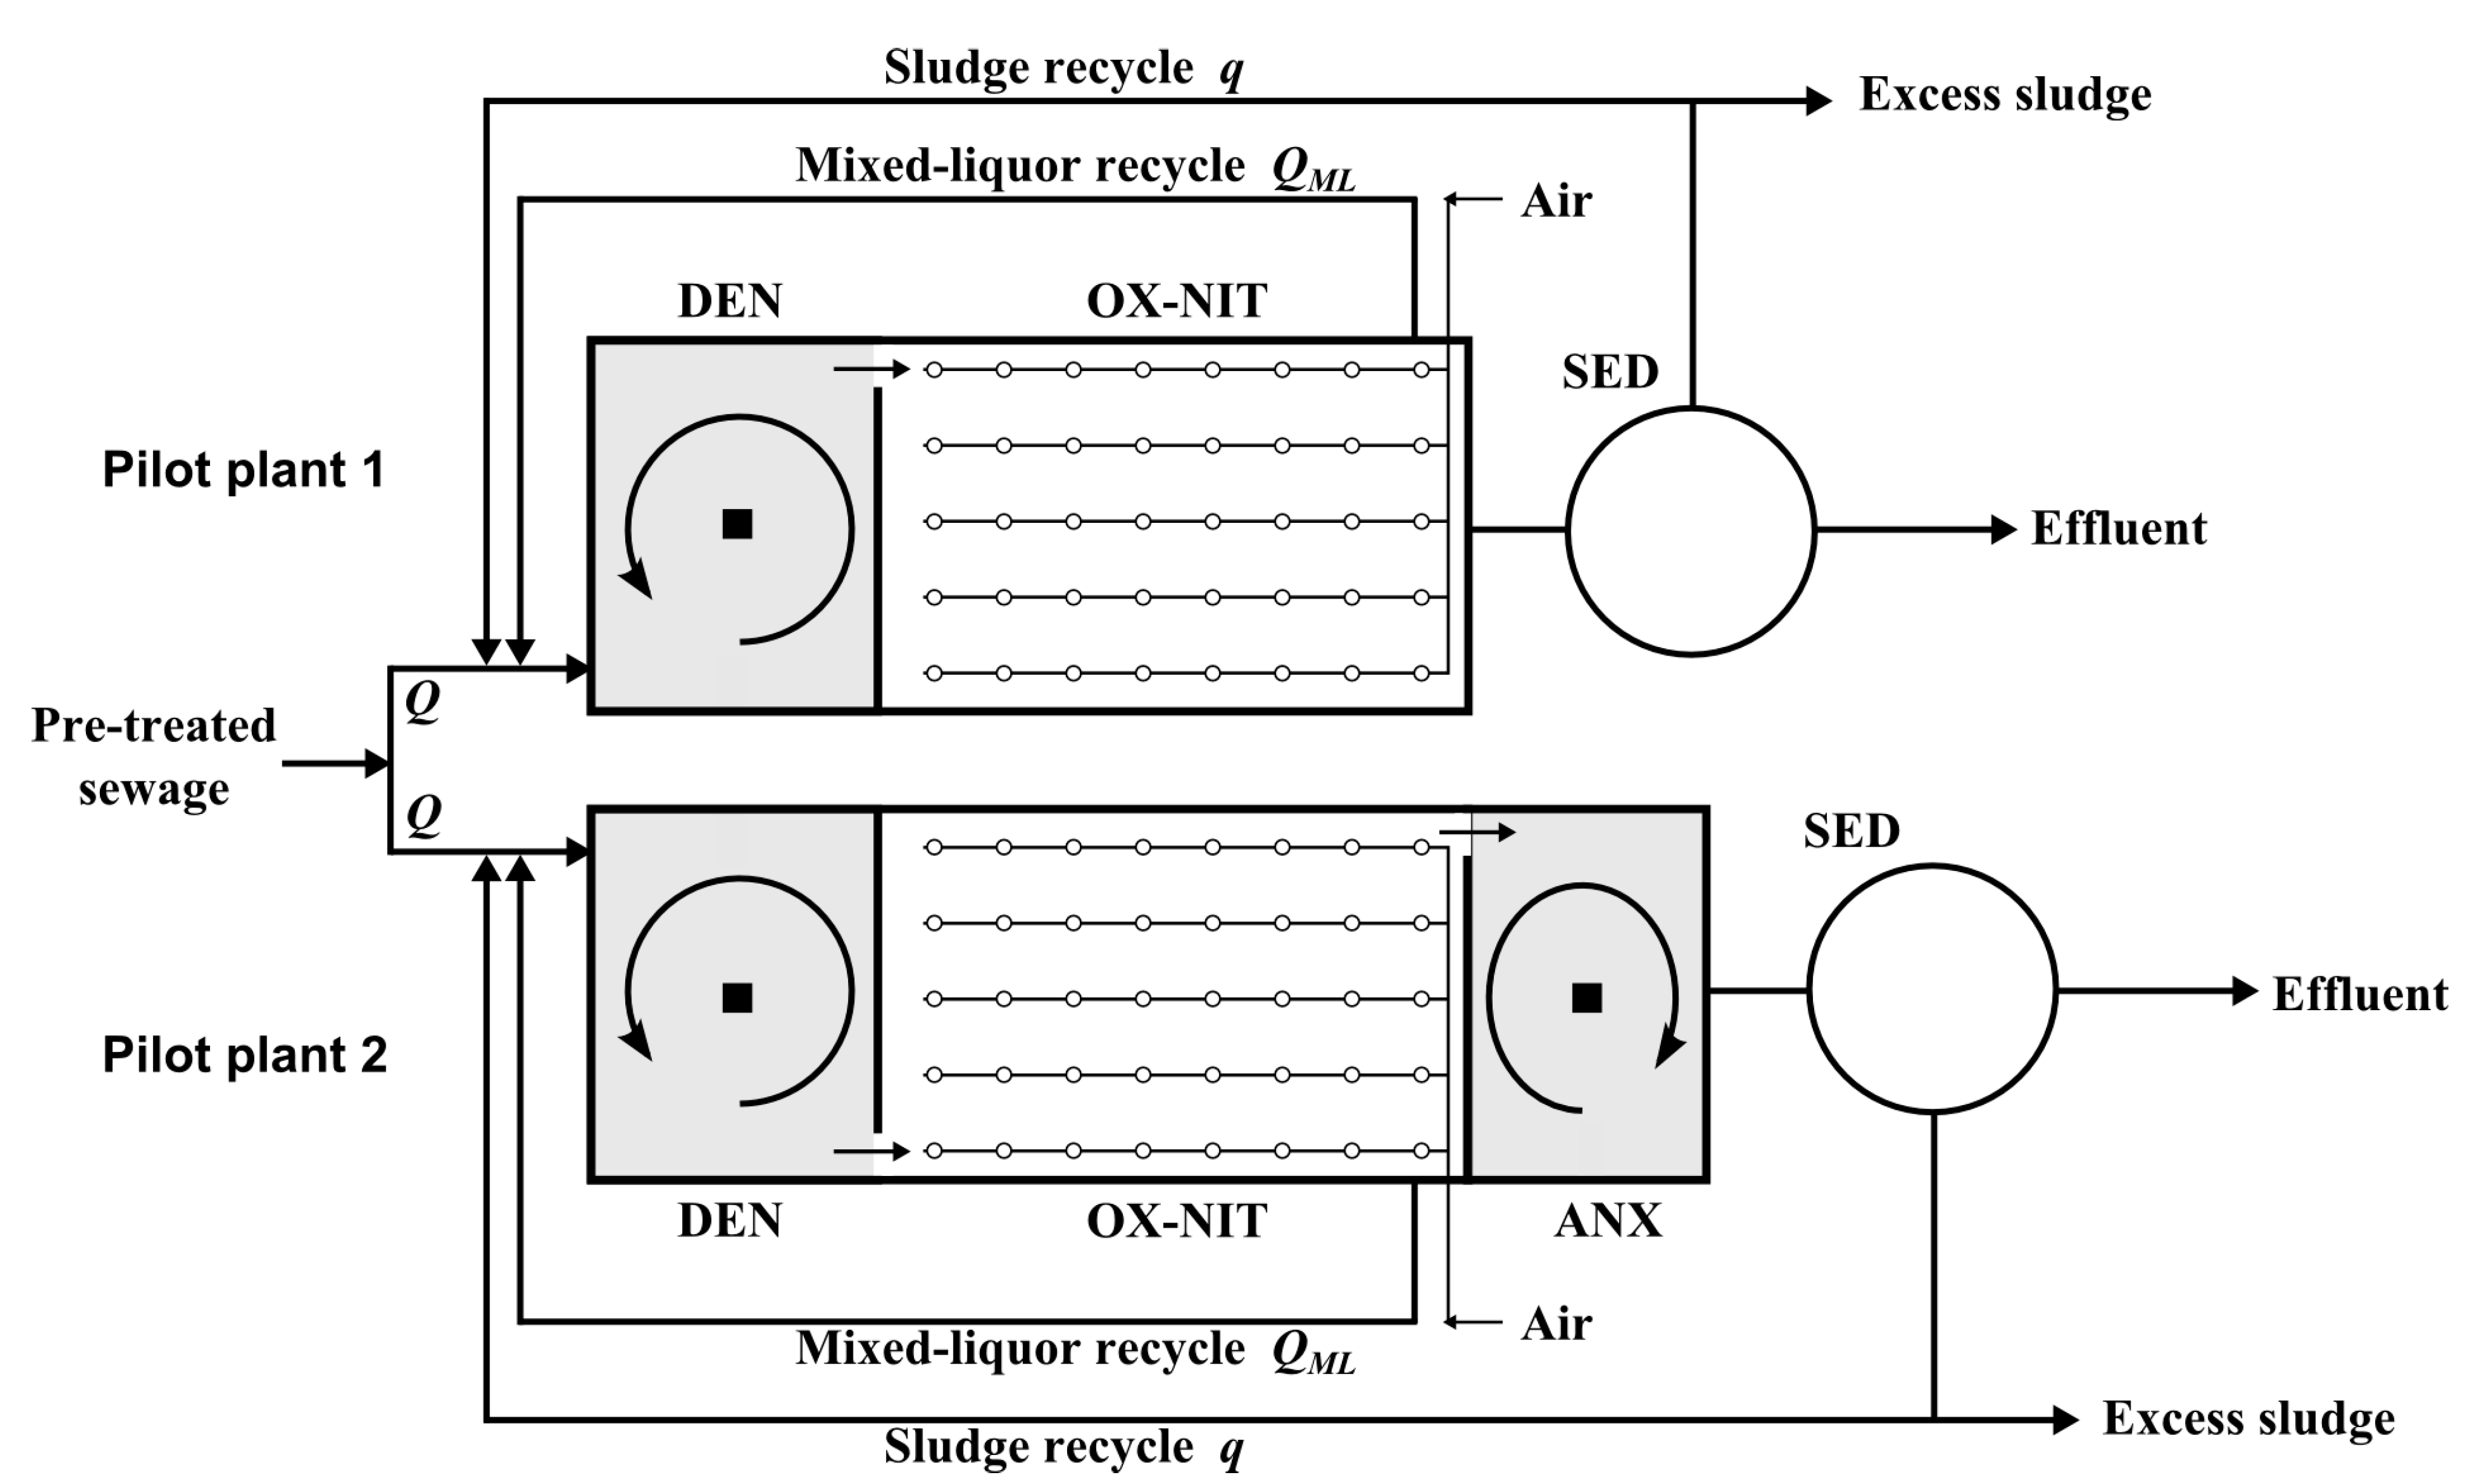
2.2.1. Description

Two parallel pilot plants with the following layout were used for the tests (Figure 1):
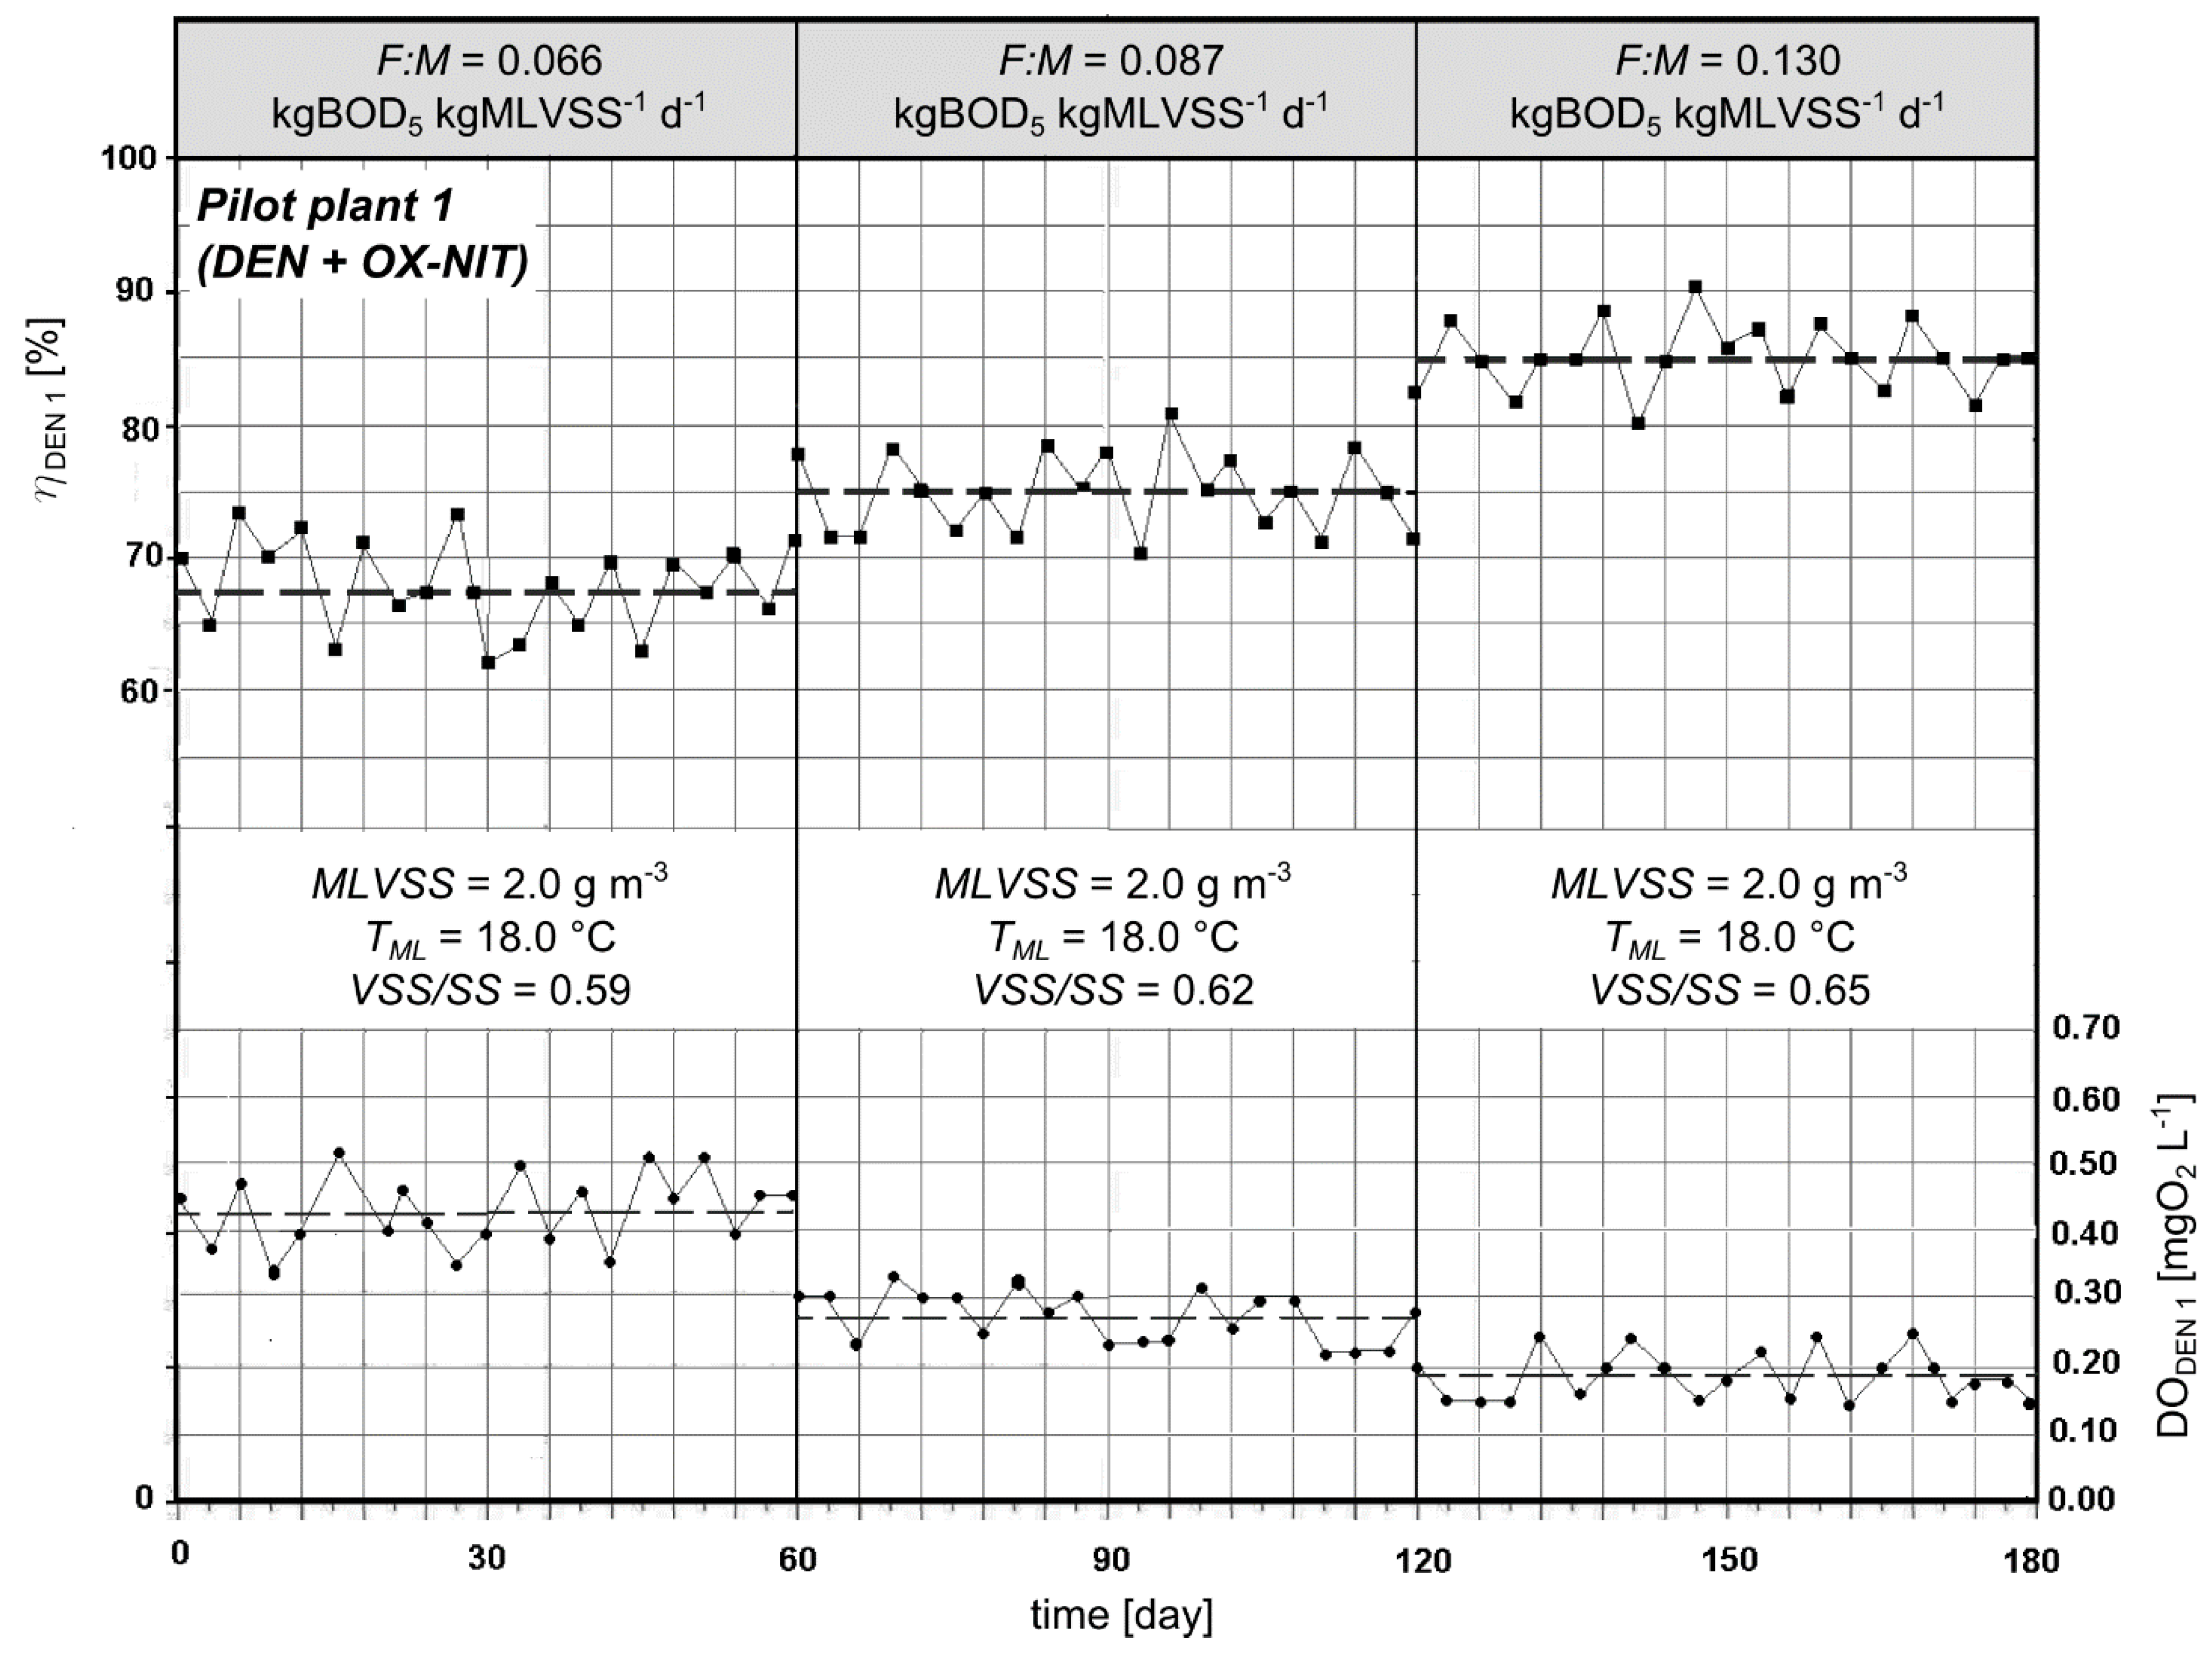
Pilot plant 1 (standard plant with pre-denitrification reactor): biological pre-denitrification stage (DEN) followed by an oxidation-nitrification stage (OX-NIT) and a final clarifier (SED);
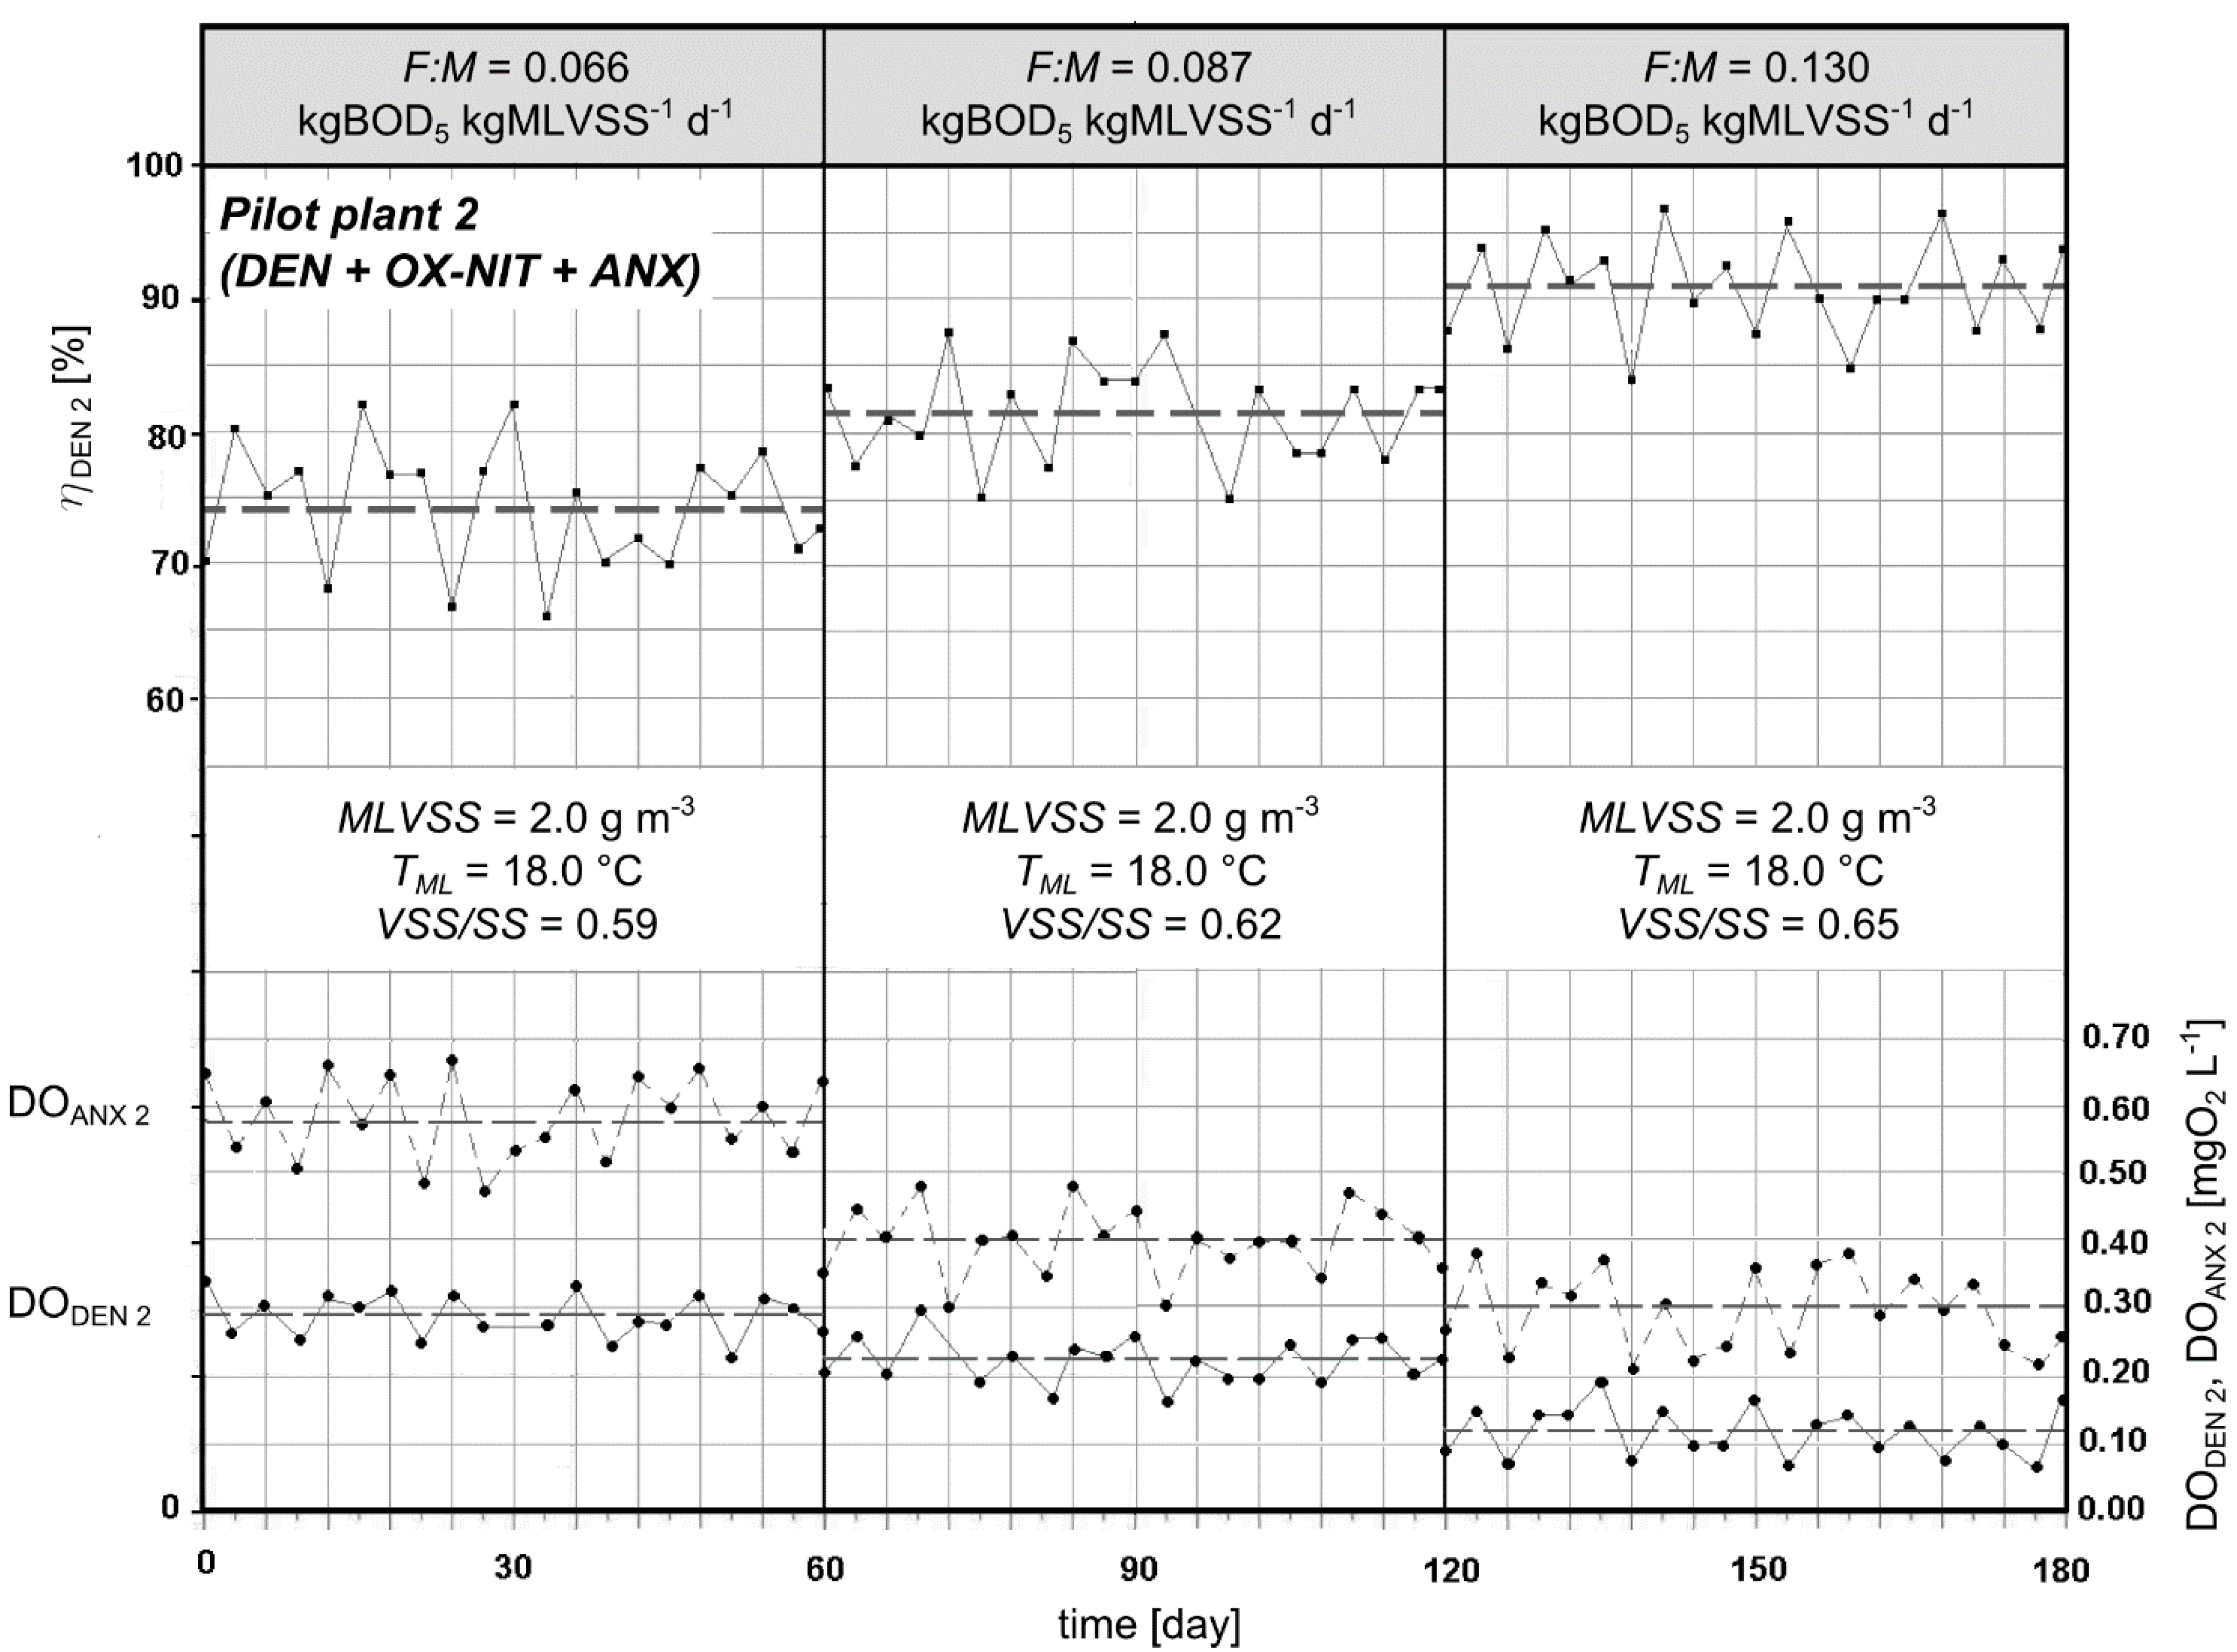
Pilot plant 2 (standard plant with pre-denitrification and post-anoxic reactor): biological pre-denitrification stage (DEN) followed by an oxidation-nitrification stage (OX-NIT), an anoxic stage (ANX) and a final clarifier (SED).
The pilot plants were fed with a pre-treated sewage of a 50,000-inhabitant town located in the Northern Italy. The pre-treatments were: (i) a screening stage and (ii) an aerated grit chamber.
Figure 1. Layout of the two parallel pilot plants.
Sustainability 07 01201 g001
The main technical characteristics of the pilot plants are:
  • DEN. Volume: 10 m3; liquid height: 1.8 m; mixing: one slow vertical-axis mixer (power input: 12 W·m−3);
  • OX-NIT. Volume: 20 m3; liquid height: 1.8 m; aeration and mixing: micro-bubble aeration system;
  • ANX. Volume: 6 m3; liquid height: 1.6 m; mixing: one slow vertical-axis mixer (power input: 12 W·m−3);
  • SED. Volume: 6 m3; diameter: 2 m.

2.2.2. Samplings and Analyses

The instrumentation used for the measurements is (Figure 2):
  • 15 DO fixed probes (accuracy: 0.01 mgO2·L−1; automatic calibration and temperature compensation);
  • 7 pH fixed probes (accuracy: 0.05);
  • 5 temperature fixed probes (accuracy: 0.05 °C);
  • 4 magnetic flow-meters (accuracy: 0.5% of the reading).
Figure 2. Scheme of the instrumentation installed on the pilot plants.
Sustainability 07 01201 g002
The following analytical parameters were measured:
  • BOD5, COD, TN, NO3-N, Ptot and Suspended Solids (SS) in both the pre-treated sewage and the pilot plants effluents (automatic daily average samplings);
  • TN and NO3-N in filtered samples collected at both the inlet and the outlet of ANX (automatic daily average samplings);
  • MLVSS and MLSS in DEN and OX-NIT (manual sampling);
  • DO, pH and temperature at the locations shown in Figure 2 (continuous sampling and recording).
Samplings and analyses were carried out in compliance with official standard methods [21].

2.2.3. Operating Conditions

The pilot plants operating conditions were chosen in order to verify:
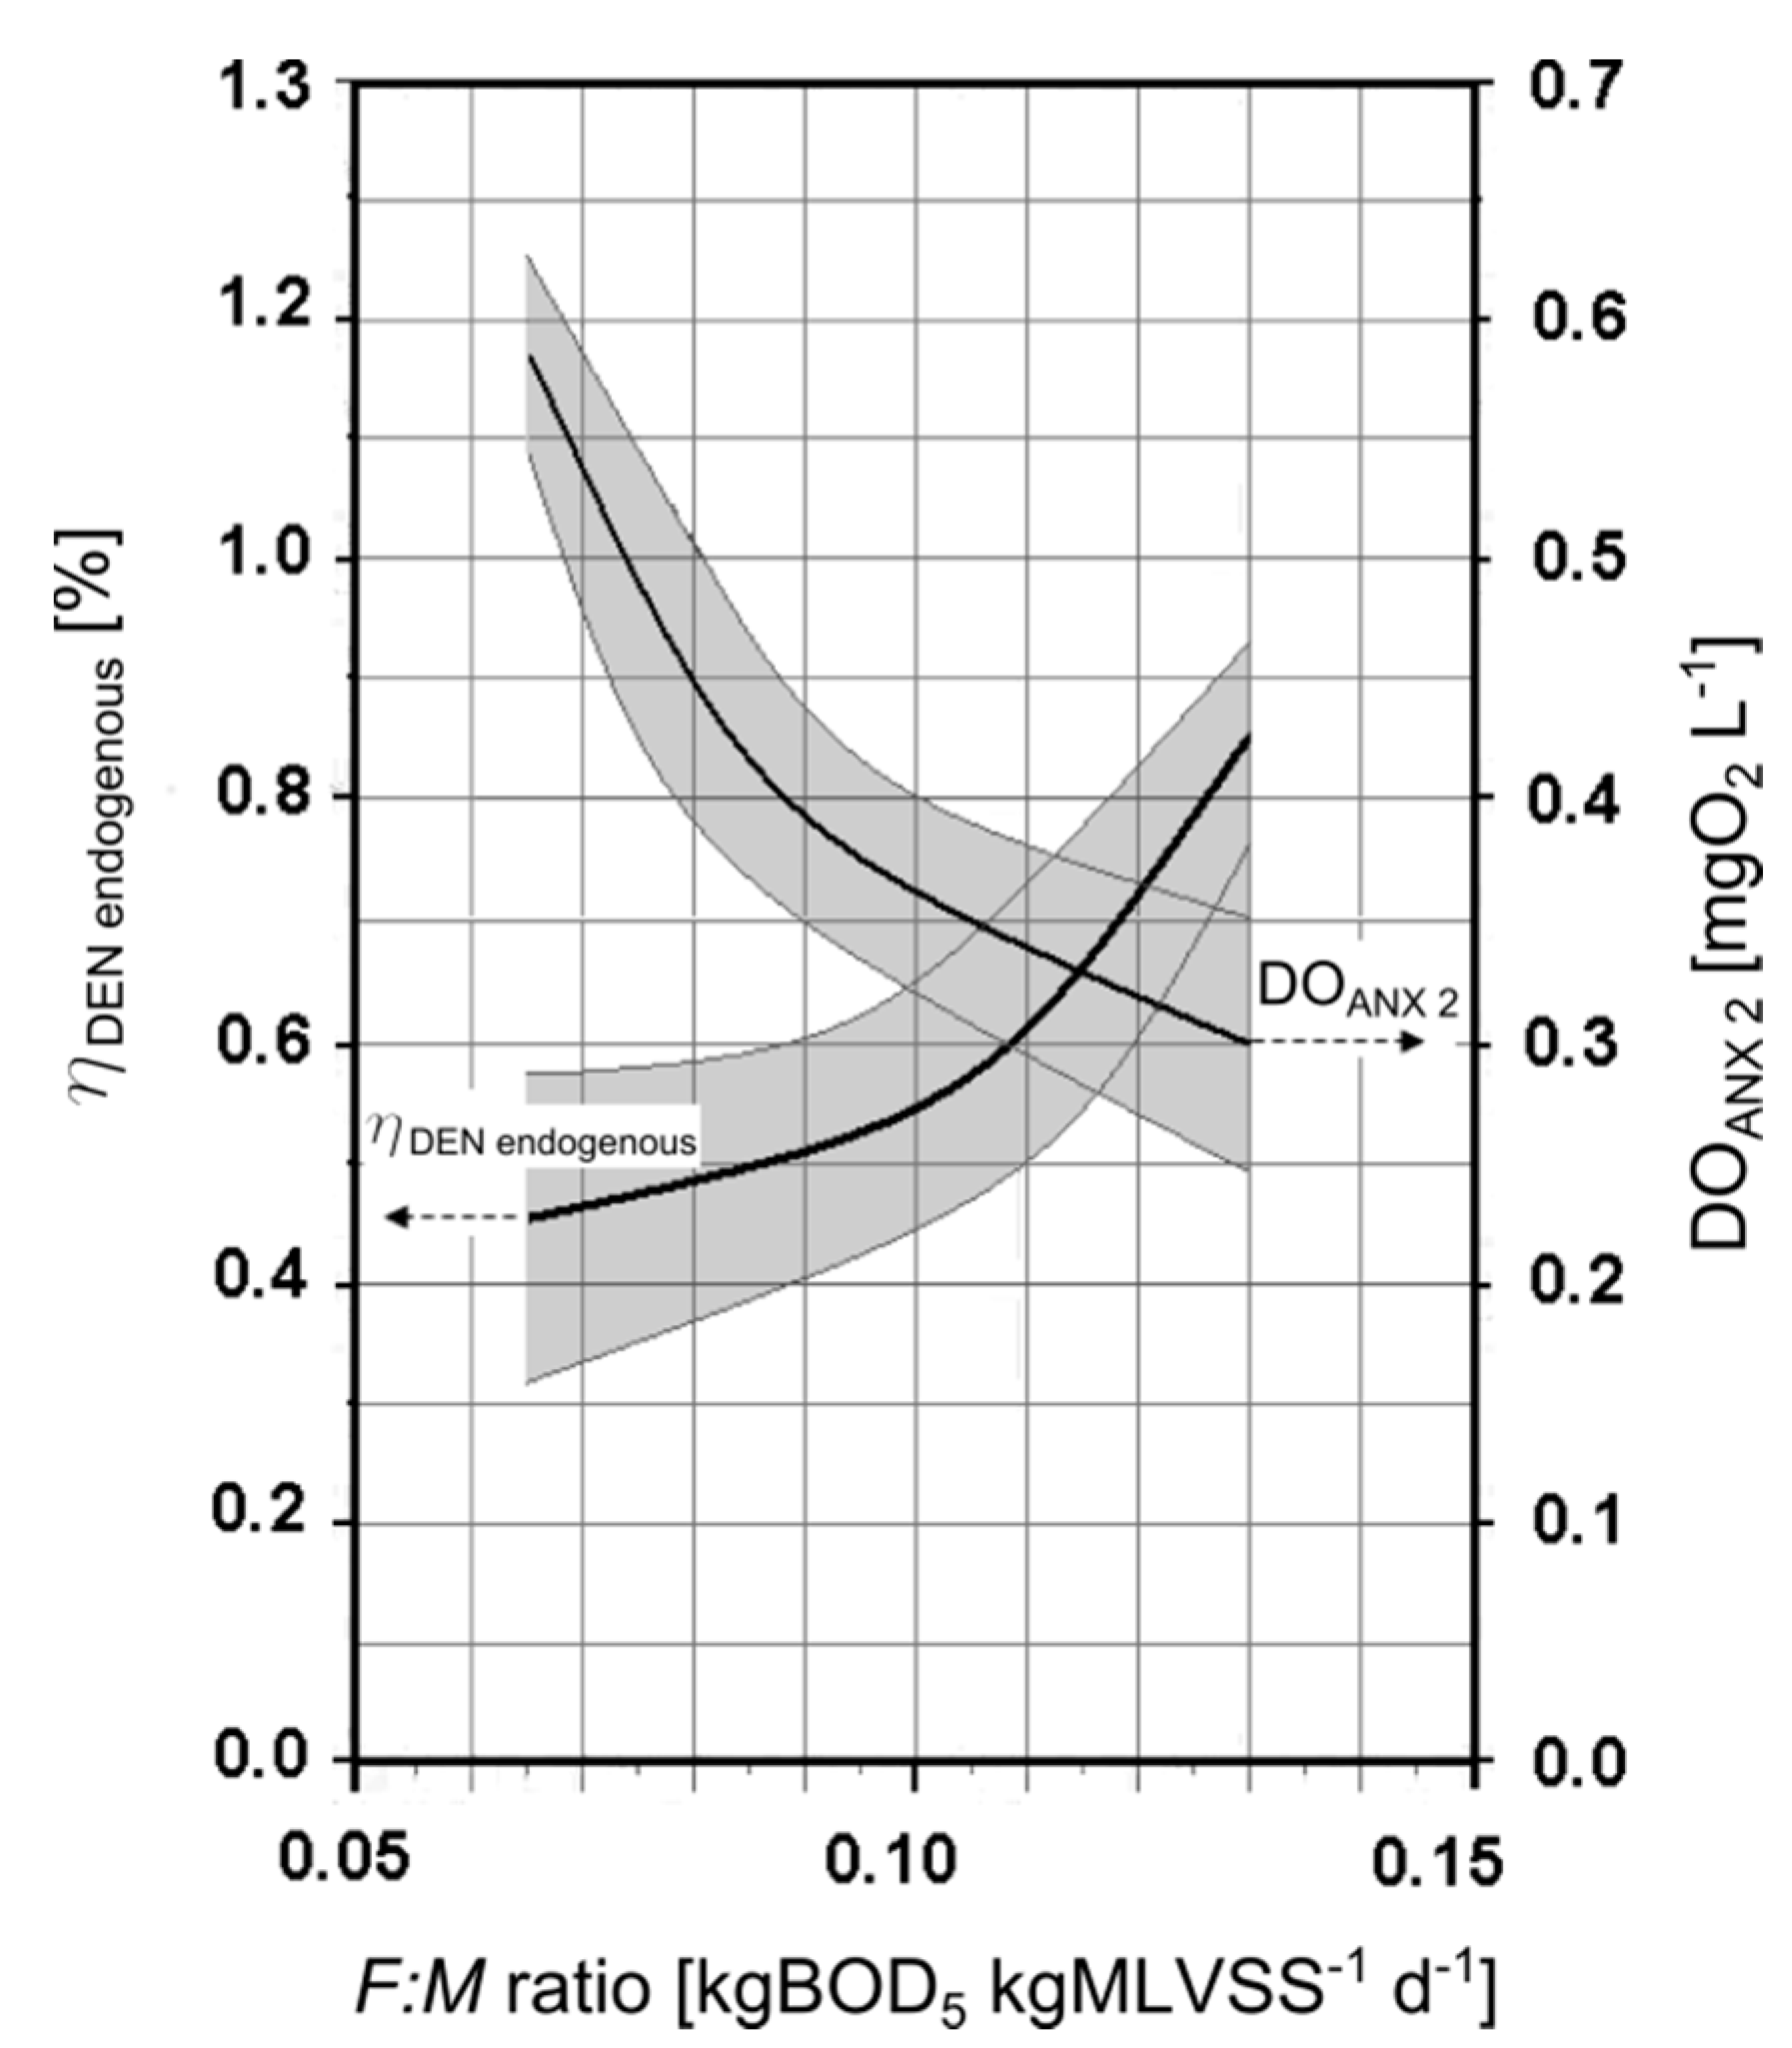
the effective decrease of DO concentration in ANX (DOANX);
the impact of DOANX decrease on (i) the DO concentration in DEN (DODEN) and, consequently, (ii) on the denitrification performance (ηDEN, %) at different sludge loadings:
η D E N = T N p s T N e f f T N p s 100
where TN is the average daily Total Nitrogen concentration, while the subscripts ps and eff refer to the pre-treated sewage and the effluents, respectively.
The pilot plants continuously ran for six months. Sewage flow rate Q ranged between 2 and 4 m3·h−1 while ML-recycle and sludge recycle flow rates were QML = 3Q and q = Q, respectively. The MLVSS concentration was maintained at the average value of 2.0 kg·m−3 (standard deviation: 0.11 kg·m−3) while average DO concentrations in OX-NIT were in the range of 2.0–2.2 mgO2·L−1. The F:M ratio (referred to DEN + OX-NIT volume) was gradually increased from 0.066 up to 0.130 kgBOD5·kgMLVSS−1·day−1. Consequently, the F:M ratio referred to the only denitrification stage (F:MDEN) varied from 0.20 to 0.39 kgBOD5·kgMLVSS−1·day−1.
During the experimentation, the endogenous denitrification removal efficiency (ηDEN endogenous, %) in ANX was determined using filtered samples:
η D E N e n d o g e n o u s = ( N O 3 N ) A N X i n ( N O 3 N ) A N X o u t ( N O 3 N ) A N X i n 100
with the subscripts ANX in and ANX out referring to the inlet and the outlet of ANX, respectively.

3. Results and Discussion

3.1. Mean Quality of the Raw Sewage and the Treated Effluent

Table 1 shows the daily average quality of both the raw sewage and the treated effluent of the pilot plant 1.
Table 1. Raw sewage (“in”) and Pilot plant 1 treated effluent (“eff 1”) quality: average (m) and standard deviation (sd). Number of samples: 60 for sewage; 60 for the treated effluent.
ParameterUnit of measurementValues (daily average samplings)
msd
CODinmg·L−1281.058.6
CODeff 1mg·L−182.717.7
BOD5 inmg·L−1135.226.0
BOD5 eff 1mg·L−113.23.8
SSinmg·L−1159.041.0
SSeff 1mg·L−119.84.1
TNin = TKNin mg·L−129.85.2
TNeff 1 (*)mg·L−17.22.7
Ptot inmg·L−14.71.6
Ptot eff 1mg·L−13.91.1
(*) all NO3-N (TKN in the effluent is always less than 0.5 mg·L−1).
The quality indicates a “low strength” sewage. The average efficiency of the Pilot plant 1 is 70.6% for COD, 90.2% for BOD5, 75.8% for TN and 7.0% for Ptot. The removal efficiency of TN is indeed poor compared to expectations. This result is largely determined by the excessive presence of DO in DEN (DODEN 1 = 2.0 mgO2·L−1), mainly due to the strong contribution of the ML recycle as already reported by previous researches [18]. Regarding the mixed-liquor temperature (TML), which is very important for the denitrification performance, the average value was 18 °C (standard deviation: 0.3 °C).

3.2. Preliminary Batch Tests

Figure 3 shows three respirometric curves obtained from mixed-liquor samples collected at three operating conditions of Pilot plant 1.
Figure 3. Respirometric batch tests on mixed-liquor samples collected from Pilot plant 1 at three operating conditions (F:M ratio referred to pre-denitrification stage (DEN) + oxidation-nitrification stage (OX-NIT)). Continuous lines and shaded areas represent the mean and the 95% confidence interval, respectively.
Sustainability 07 01201 g003
The curves demonstrate the relevant influence of time and F:M ratio on the DO removal. The best results are achieved with the highest F:M ratio. In particular with F:M = 0.130 kgBOD5·kgMLVSS−1·day−1 the respirometric test leads to residual concentrations of DO = 0.30 mgO2·L−1 after 90 min of contact time. On the contrary, samples collected from the plant operated at lower F:M ratios have a DO decrease less pronounced (DO = 0.96 mgO2·L−1 after 90 min at F:M = 0.066 kgBOD5·kgMLVSS−1·day−1). The differences in the three curves can be explained by two converging factors:
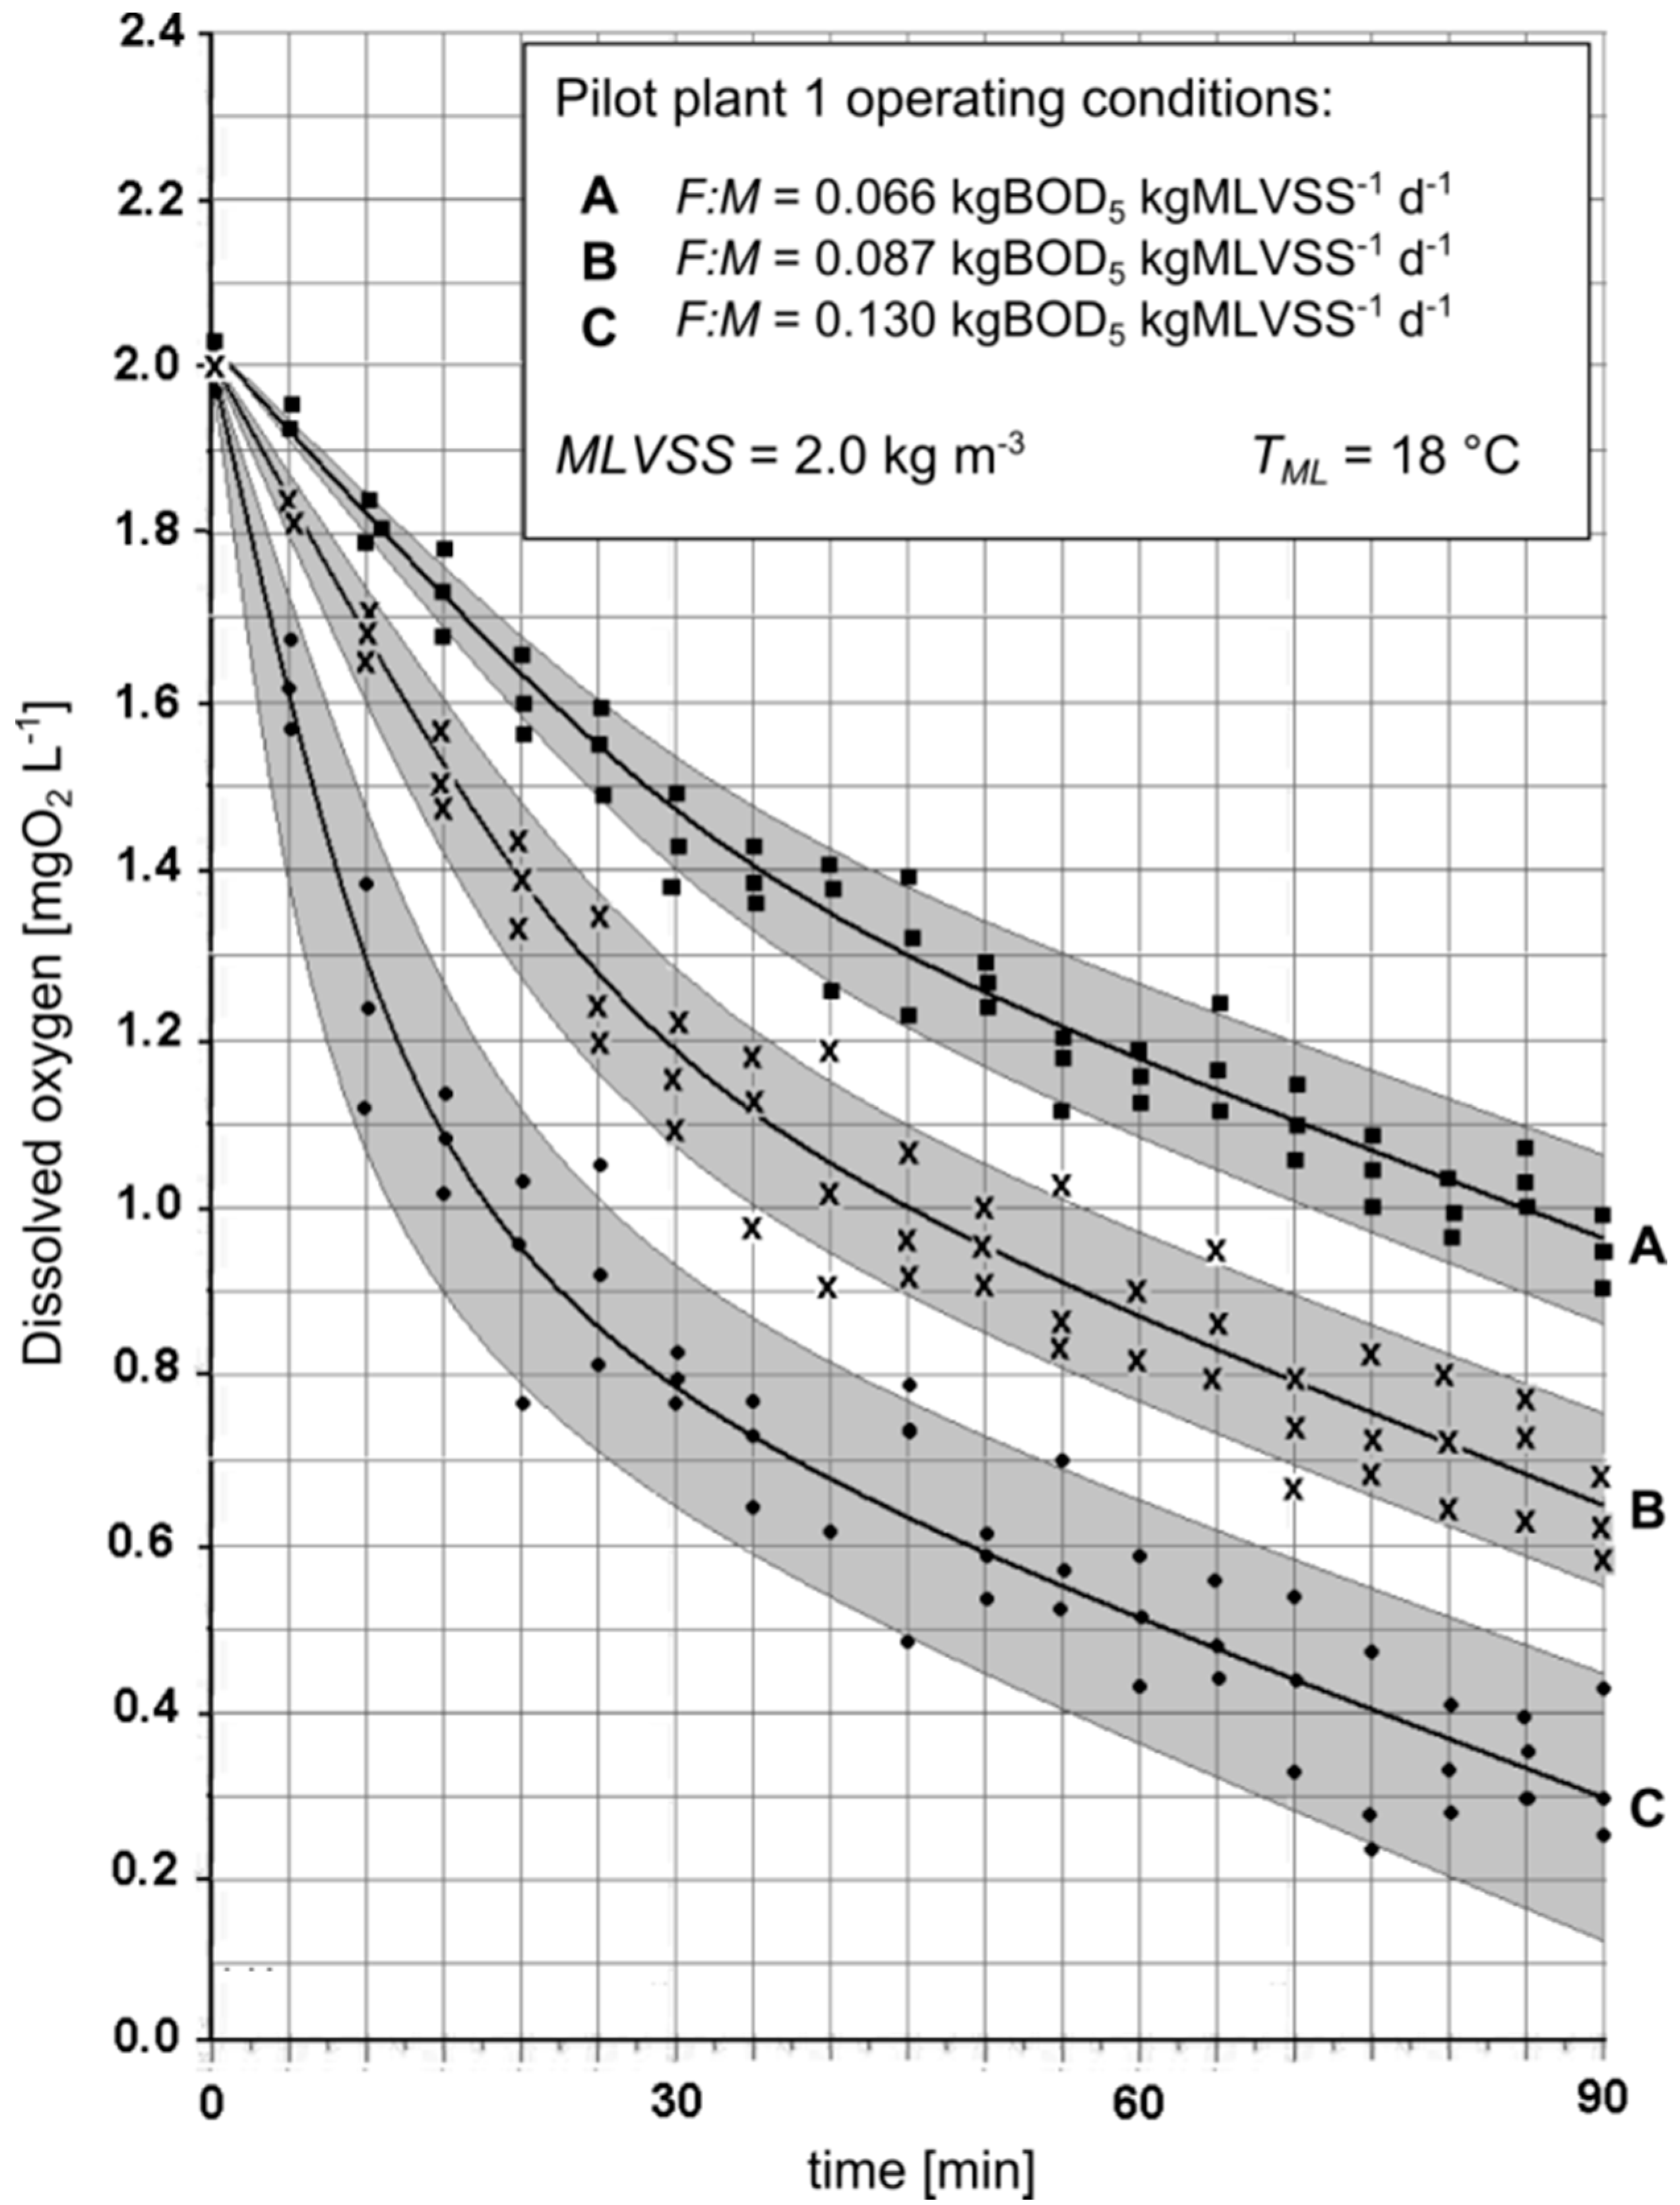
  • The great presence of residual BOD at high F:M ratios that favors the kinetics of both assimilative and endogenous respiration;
  • The low degree of sludge stabilization at high F:M that favors the kinetics of endogenous respiration.

3.3. Experimental Pilot Plants

Figure 4 shows the Pilot plant 1 denitrification performance and the average DO concentration measured in DEN at different F:M ratios.
Figure 4. Pilot Plant 1 nitrogen removal efficiency (ηDEN 1) at three F:M ratios (referred to DEN + OX-NIT volume) and average dissolved oxygen (DO) content in pre-denitrification (DODEN 1).
Sustainability 07 01201 g004
It can be noticed that in the first period (F:M = 0.066 kgBOD5·kgMLVSS−1·day−1) the presence of high DO concentrations in DEN (DODEN 1 = 0.42 mgO2·L−1) negatively affects the achievement of good denitrification yields (average efficiency: 67.5%). The increasing of F:M ratio gradually improves the denitrification performance, reaching the average and peak values of 85% and 91%, respectively, with F:M = 0.130 kgBOD5·kgMLVSS−1·day−1. This result is determined by both the higher carbon bioavailability in denitrification and the decrease of DODEN which drops to the mean value 0.19 mgO2·L−1.
Figure 5 shows the biological denitrification performance of Pilot plant 2, which operates at the same operating conditions of Pilot plant 1. The figure reports also the average DO concentration in both ANX and DEN.
Figure 5. Pilot Plant 2 nitrogen removal efficiency (ηDEN 2) at three F:M ratios (referred to DEN + OX-NIT volume), average DO content in pre-denitrification (DODEN 2) and post-anoxic (DOANX 2) reactors.
Sustainability 07 01201 g005
The comparison between the results of Pilot plant 1 and 2 highlights the effect of the post-anoxic reactor on (i) the DO concentrations in the pre-denitrification tank and (ii) the denitrification performance. It stands out the higher denitrification efficiency and the lower content of DO in DEN achieved with Pilot Plant 2 compared to Pilot Plant 1. In particular the average denitrification efficiency increases from 73.5% (F:M = 0.066 kgBOD5·kgMLVSS−1·day−1) up to 91.5% (F:M = 0.130 kgBOD5·kgMLVSS−1·day−1). Also in this case the improvement of the denitrification efficiency is connected to both the greater carbon bioavailability in denitrification (at high values of F:M ratio) and the low DO in pre-denitrification, which drops to 0.113 mgO2·L−1 in the third period.
The contribution of endogenous denitrification has also been investigated. The result is shown in Figure 6, which represents the curves of both endogenous denitrification efficiency and DO in ANX as a function of the F:M ratio.
Figure 6. Pilot plant 2 denitrification efficiency determined by endogenous carbon (ηDEN endogenous) and DO in the post-anoxic reactor (DOANX 2) as a function of the F:M ratio. Continuous lines and shaded areas represent the mean and 95% confidence interval, respectively.
Sustainability 07 01201 g006
The contribution of the endogenous biological activities on the denitrification is indeed very small (0.45%–0.85%) because of the low endogenous denitrification rate (theoretical value: 0.3 mgNO3-N·gMLVSS−1·h−1 at 20 °C, as reported by [14]) and the negative effects of the residual DO in AXN.

4. Conclusions

Small concentrations of dissolved oxygen are always present in biological pre-denitrification reactors. They cause adverse effects on the kinetics of nitrogen removal and, consequently, on the denitrification performance. The addition of a post-anoxic reactor after the oxidation-nitrification stage has proved to be very effective in improving the nitrogen removal because of the considerable reduction of the dissolved oxygen content in the mixed liquor recycle sent to the pre-denitrification reactor. The reduction of the dissolved oxygen content in the post-anoxic reactor is influenced by the retention time and the F:M ratio. High values of F:M ratio (e.g., 0.130 kgBOD5·kgMLVSS−1·day−1 referred to the denitrification and oxidation-nitrification volumes) allow to reduce the dissolved oxygen concentration in the post-anoxic reactor to the mean value of 0.31 mgO2·L−1, such as to determine (i) an average concentration lower than 0.11 mgO2·L−1 in the pre-denitrification reactor and (ii) a denitrification efficiency up to 91%. The improvement of the denitrification efficiency at higher F:M ratio is caused by both the greater carbon bioavailability in denitrification and the higher values of residual BOD fed into the post-anoxic reactor which contribute to the decrease of the dissolved oxygen. The contribution of endogenous denitrification in post-anoxic reactor resulted very small (0.45%–0.85% of the whole nitrogen removal efficiency) because of the very low values of the endogenous denitrification rate and the negative effects of the residual DO on the reaction.

Author Contributions

The authors contributed equally to this work. Giordano Urbini and Renato Gavasci developed the idea and designed the plant, while Paolo Viotti analyzed data collected by the technicians. The article has been written with full collaboration of both the authors.

Conflicts of Interest

The authors declare no conflict of interest.

References

  1. Moghaddam, A.H.; Sargolzaei, J. A review over diverse methods used in nitrogen removal from wastewater. Recent Patents Chem. Eng. 2013, 6, 133–139. [Google Scholar] [CrossRef]
  2. Metcalf & Eddy Inc.; Tchobanoglous, G.; Burton, F.L.; Stensel, H.D. Wastewater Engineering: Treatment and Reuse; McGraw-Hill: New York, NY, USA, 2003. [Google Scholar]
  3. Raboni, M.; Torretta, V.; Viotti, P.; Urbini, G. Experimental plant for the physical-chemical treatment of groundwater polluted by municipal solid waste (MSW) leachate, with ammonia recovery. Rev. Ambient. Água. 2013, 8, 22–32. [Google Scholar]
  4. Zhu, G.; Peng, Y.; Li, B.; Guo, J.; Yang, Q.; Wang, S. Biological removal of nitrogen from wastewater. Rev. Environ. Contam. Toxicol. 2008, 192, 159–195. [Google Scholar] [PubMed]
  5. Torretta, V.; Urbini, G.; Raboni, M.; Copelli, S.; Viotti, P.; Luciano, A.; Mancini, G. Effect of powdered activated carbon to reduce fouling in membrane bioreactors: A sustainable solution. Case study. Sustainability 2013, 5, 1501–1509. [Google Scholar] [CrossRef] [Green Version]
  6. Farabegoli, G.; Gavasci, R.; Lombardi, F.; Romani, F. Denitrification in tertiary filtration: Application of an up-flow filter. J. Environ. Sci. Health A Tox. Hazard. Subst. Environ. Eng. 2003, 38, 2169–2177. [Google Scholar] [CrossRef] [PubMed]
  7. Raboni, M.; Torretta, V.; Urbini, G. Influence of strong diurnal variations in sewage quality on the performance of biological denitrification in small community wastewater treatment plants (WWTPs). Sustainability 2013, 5, 3679–3689. [Google Scholar] [CrossRef] [Green Version]
  8. Raboni, M.; Torretta, V.; Viotti, P.; Urbini, G. Pilot experimentation with complete mixing anoxic reactors to improve sewage denitrification in treatment plants in small communities. Sustainability 2014, 6, 112–122. [Google Scholar] [CrossRef] [Green Version]
  9. United States-Environmental Protection Agency (US-EPA). Process Design Manual for Nitrogen Control; US-EPA Office of Technology Transfer: Washington, DC, USA, 1975. [Google Scholar]
  10. Torretta, V.; Ragazzi, M.; Trulli, E.; de Feo, G.; Urbini, G.; Raboni, M.; Rada, E.C. Assessment of biological kinetics in a conventional municipal WWTP by means of the oxygen uptake rate method. Sustainability 2014, 6, 1833–1847. [Google Scholar] [CrossRef] [Green Version]
  11. Ekama, G.A.; Wentzel, M.C. Denitrification kinetics in biological N and P removal activated sludge systems treating municipal wastewaters. Water Sci. Technol. 1999, 39, 69–77. [Google Scholar] [CrossRef]
  12. Ekama, G.A.; Wilderer, P. Biological nutrient removal. In Treatise on Water Science; Elsevier: Oxford, UK, 2011; Chapter 4.14; pp. 409–526. [Google Scholar]
  13. Eramo, B.; Gavasci, R.; Misiti, A.; Viotti, P. Validation of a multisubstrate mathematical model for the simulation of the denitrification process in fluidized bed biofilm reactors. Water Sci. Technol. 1994, 29, 401–408. [Google Scholar]
  14. Vismara, R. Depurazione Biologica, 3rd ed.; Hoepli: Milan, Italy, 1998. [Google Scholar]
  15. United States-Environmental Protection Agency (US-EPA). Nutrient Control Design Manual; US-EPA, National Risk Management Research Laboratory: Washington, DC, USA, 2010. [Google Scholar]
  16. Oh, J.; Silverstein, J. Oxygen inhibition of activated sludge denitrification. Water Res. 1999, 33, 1925–1937. [Google Scholar] [CrossRef]
  17. Plósz, B.G.; Jobbágy, A.; Grady, C.P.L., Jr. Factors influencing deterioration of denitrification by oxygen entering an anoxic reactor through the surface. Water Res. 2003, 37, 853–863. [Google Scholar] [CrossRef] [PubMed]
  18. Raboni, M.; Torretta, V.; Viotti, P.; Urbini, G. Calculating specific denitrification rates in pre-denitrification by assessing the influence of dissolved oxygen, sludge loading and mixed-liquor recycle. Environ. Technol. 2014, 35, 2582–2588. [Google Scholar] [CrossRef] [PubMed]
  19. United States-Environmental Protection Agency (US-EPA). Manual: Nitrogen Control; US-EPA Office of Research and Development: Washington, DC, USA, 1993. [Google Scholar]
  20. Henze, M. Capabilities of biological nitrogen removal processes from wastewater. Water Sci. Technol. 1991, 23, 669–679. [Google Scholar]
  21. Clesceri, L.S.; Greenberg, A.E.; Eaton, A.D. Standard Methods for the Examination of Water and Wastewater, 20th ed.; APHA American Public Health Association: Washington, DC, USA, 1998. [Google Scholar]

