Article

A Scorecard Framework Proposal for Improving Software Factories’ Sustainability: A Case Study of a Spanish Firm in the Financial Sector

by
César Álvarez
,
Vicente Rodríguez
*,†,
Francisco Ortega
and
Joaquín Villanueva
Department of Project Engineering, University of Oviedo, C/Independencia 3, 33004 Oviedo, Spain
*
Author to whom correspondence should be addressed.
These authors contributed equally to this work.
Sustainability 2015, 7(12), 15999-16021; https://doi.org/10.3390/su71215800
Submission received: 15 September 2015 / Revised: 15 November 2015 / Accepted: 23 November 2015 / Published: 2 December 2015

Abstract

:
Financial institutions and especially banks have always been at the forefront of innovation in management policies in order to improve their performance, and banking is probably one of the sectors that more effectively measures productivity and efficiency in virtually all aspects of its business. However, there is one area that still fails: the productivity of its software development projects. For years banking institutions have chosen to outsource their software projects using software firms created by them for this purpose, but up until a few years ago, the deadline for the delivery of the projects was more important than the efficiency with which they were developed. The last economic crisis has forced financial institutions to review and improve the software development efficiency related to their software factories to achieve a sustainable and feasible model. The sustainability of these software factories can be achieved by improving their strategic management, and the Balanced Scorecard (BSC) framework can be very useful in order to obtain this. Based on the concepts and practices of the BSC, this paper proposes a specific model to establish this kind of software factory as a way of improving their sustainability and applies it to a large Spanish firm specializing in financial sector software. We have included a preliminary validation plan as well as the first monitoring results. The adoption is still very recent and more data are needed to measure all the perspectives so no definitive conclusions can be drawn.

Graphical Abstract

1. Introduction

The software industry is a very demanding and challenging sector, characterized by vigorous competition, extensive dependence on intellectual capital and the need for continuous training in new technologies. Furthermore, many software companies are dealing with significant drops in revenue, and have been forced to reduce labor and cut research and development investments [1].
The banking sector traditionally requires the most software development and the most likely to opt for outsourcing when faced with these kind of situations. The development of business applications represents over 50% of the managed IT budget and in most cases it is outsourced [2]. However, despite being one of the largest IT budget items, some banks still do not measure the productivity of software and maintenance development. The reasons for not analyzing productivity are that the production software model is absolutely customized, and it is very difficult to measure what is produced, and furthermore it is due to the intangible nature of software. Banks pay for the time it takes to produce the software and not the amount produced, a model that in most cases includes the increase of the cost of the projects [2]. With the recent economic crisis, most of the financial institutions have chosen to reduce the number of projects or are pressing software developers to lower their rates. Their response to this situation has been to create offshore software factories with the aim of reducing costs. The creation of software factories is justified by the idea of industrializing the production of software, but this is not always the case. What they are really doing is hiring labor with a high level of training, but with lower rates, which causes costs to be reduced, but with no necessary improvement in development processes. The first thing that financial institutions must apply to software development firms, and especially to their software factories, is to measure the software they are delivering to them. Although it seems strange, the majority of software that is delivered is not measured [2]. There are several ways to measure the amount of software produced, as was explained by Fenton et al. [3], that allow companies to know what is being delivered and the real productivity. With this information they can create strategies for building improvements and payments can be linked to what is actually produced, and not the time taken to produce them. The financial software industry needs to transform itself into an industrialized software manufacturer, able to provide software projects that the financial markets expect today related to efficiency, fast delivery and quality [4].
One of the characteristics of these software factories, which occurs in most cases, at least in Spain and other European countries, is that they have been created by the financial institutions in order to outsource software development needed for their maintenance business. This is a difficult situation to manage because it is necessary to satisfy the interests of a business group, which in this case is both the owner and the main client. We refer in this study to this kind of software factories as Financial Software Factories (FSF).
Until approximately 2008, at the beginning of the last economic crisis that affected the whole of the financial sector, for such business groups of these software factories, the deadline for the delivery of projects was more important than the efficiency with which they were developed. There were times when the cost of development was not as important as ever before. In addition to its own business reforms, financial entities demanded internal changes in their FSF in order to make them more productive and able to manage the huge number of new software developments needed to comply with the regulatory changes and the always necessary core and commercial software. The ever-increasing demand for more software suggests the need not only to increase production capabilities but also to produce more with the resources available for production. In other words, software development productivity needs to increase, and needs to be sustainable [5].
This paper describes the case in which a FSF in Spain decided to review the concept of industrialization of the software to implement the principles and elements of the software factory approach [6] and searched for a scheme of work and organization that would increase the productivity of the different teams. In order to increase and quantify this productivity, it had established a metric that could be used to express productivity in terms of software product volume built in a span of time, similar to that described by de Vries and Microsoft a few years before [7]. The management team of this software factory took high-level decisions that affected all areas of the company to adopt the guidelines imposed by the financial group, who as owners wanted to produce more and reduce costs, and as customers wanted more useful, faster and cheaper software.
Based on the concepts and practices of BSC [8,9], this paper proposes a specific model for FSF as a way to improve their sustainability and validate it into a Spanish firm specialized in the financial sector software. This BSC is the tool adopted by the management of the software factory to assess its evolution, and it is used as a support for the identification of future problems and decision-making in order to form a sustainability business group. The BSC has been widely used in several sectors, although it has not been much used across the software development industry. Even though there are some variations of BSC for the software sector, with the IT BSC [10] probably the best known among them, most of them are more focused on treating it like an “IT department” instead of a company. As an example of this, Martinsons et al. [11] suggested that the IT department is typically an internal rather than external service supplier, and projects are commonly carried out for the benefit of both the end users and the organization as a whole, rather than individual customers within a large market. Although we can find some examples of BSC considering the software development company as a strategic business unit, this vision is the prevalent one. BSC is a “necessary good” for companies [12] when used as a framework and guideline for successful strategy communication and implementation, and a system for understanding what really creates value in the company, rather than when it is used as a pure performance measurement system [1]. BSC is a good strategy to support the sustainability of companies and it can be very useful to achieve the improvement of strategic management in order to achieve this sustainability.
This work aims to identify and define a collection of Key Performance Indicators (KPIs) that permit effectiveness to be improved in this context. The paper presents the developed framework, the strategy maps, the BSC and the KPIs, which are properly established and thoroughly evaluated taking a large Spanish software factory as a reference. The framework is especially tailored considering some particularities of this kind of company working for the financial sector. In the presented scenario, the challenge is to manage effectively and intelligently invested resources for the best results in an environment where competition is more complex and tougher.

2. Background and Literature Review

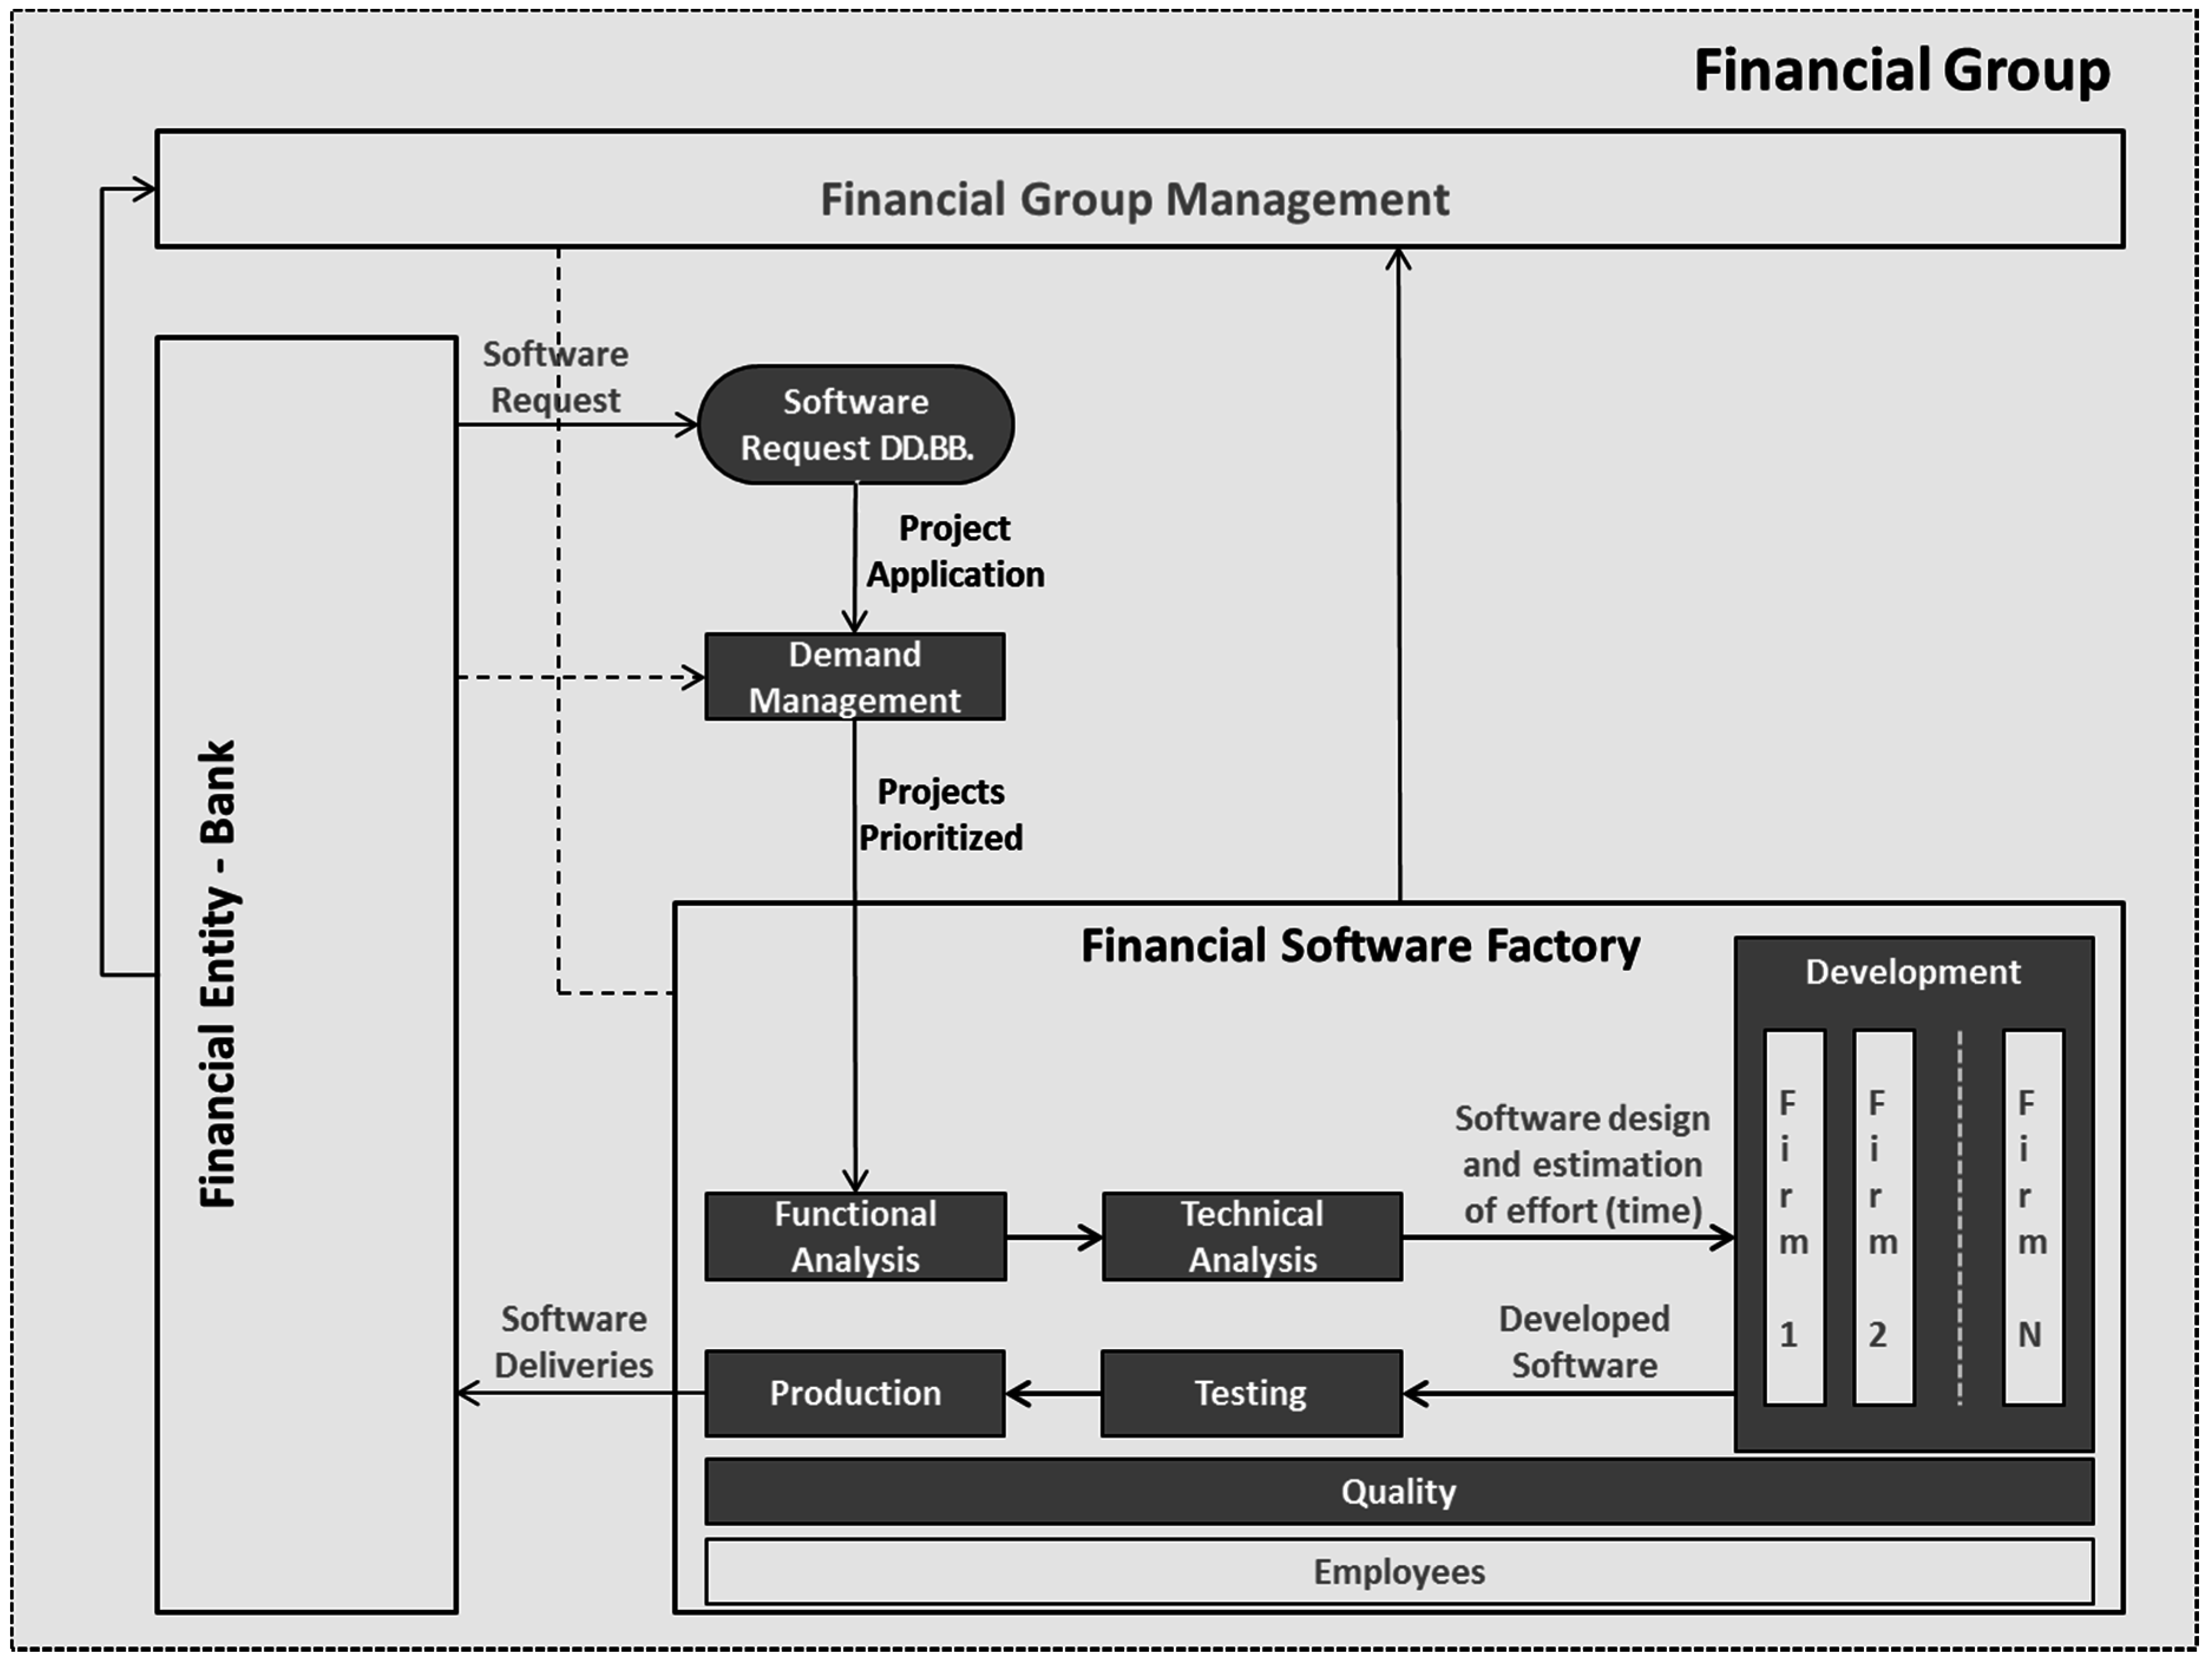
2.1. The Financial Software Factory Scheme

The characteristics and environment of working at the FSF studied in this work do not differ substantially from other software factories in the financial software sector. The software that supports the banking business had been traditionally developed in-house by the IT departments, but is now usually outsourced to IT firms, most of them created by the financial institutions at the beginning of the 1990s following the trend of externalization of services. Outsourcing and externalization of maintenance services has become a common practice in financial companies for years. One of the characteristics of this sector is that they have externalized the development processes, but they keep the top-level processes in place for strategic reasons [13], because of the extreme importance of the software for the core of the business. Despite this, these firms do not work exclusively for the matrix financial group, because they also offer their services to other financial institutions.
At the same time that all IT groups have been forced to lower operating costs and minimize waste and inefficiency, they must also improve quality, reduce time to market, and increase productivity and relevance to the business they serve [6,14]. This combination of business process restructuring and close focus on delivery efficiency has been seen in many business domains, and has resulted in techniques such as “lean manufacturing”, “supply-chain management” and “product line engineering” [6]. The application of these ideas in the software development industry is known as the “software factory approach” [15,16]. The major concern for a software factory is the industrialization of software development [14]. A software factory applies, in the software development context, the same manufacturing techniques and principles as traditional manufacturing [17]: systematic reuse, development assembly, model-driven development and process frameworks.
The FSF that work under the software factories approach have to demonstrate they are more competitive than other firms [18]. To achieve this and also to adopt industrialization techniques in software development processes, this kind of software factories have some of their own features that influence their development habits in some way. Among other features, the main ones, in this study case, are [18]:
They work almost exclusively for the financial group, which is both the owner and the principal customer.
They usually have a greater demand for requests, more than is possible to complete. There is always a queue of software developments pending.
They have secured the payment of deliveries, which means that the more software developments that are built, the greater their income.
Revenues are billed in relation to the use of developments.
The software development process is usually outsourced to several software companies, but this does not apply to top-level processes such as functional specifications and project management. The payment to outsourced firms is made according to the number of hours budgeted and not by the number of hours it takes to achieve it.
All of these features mean that there is always a demand to produce as much as possible and in the shortest time. On the other hand, the usual organizational structure for a FSF should not differ substantially from what is presented below, which includes the following processes [13,18]:
Demand Management, which aims to collect the top-level user requirements and establish methods for prioritizing demands.
Functional Analysis, which transforms the identified top-level user requirements into functional requirements.
Technical Analysis, which is responsible for the technical details of the functional specifications that must be implemented.
Development, which performs the development, construction and assembling of the requested requirements.
Testing, which has to validate everything that has been implemented.
Production, which performs the customer deployment.
Quality, which assesses the software development processes quality.
In the presented schema, the development process is outsourced to several software development firms, but the rest of the processes are under the software factory’s control. Figure 1 illustrates the usual processes followed in this scheme of operation, which are similar to those explained by Valderrama et al. [17] for a software factory.
Figure 1. Map of processes of model for a software factory oriented financial sector.
Sustainability 07 15800 g001

2.2. The BSC Framework as a Management System

The working scheme studied needs a complete management system that permits an awareness of the productivity with which it is working. Unfortunately, the performance measure in the production of software is not as simple as it is in other industries; but nevertheless, it is necessary that the management system can answer a series of questions:
What is the productivity of the software factory?
How does productivity evolve?
How do the planning and cost of the projects evolve?
What are the quality developments?
What is the software factory’s position in the market?
How is the relationship between the shareholders, customers and employees with the software factory?
Is the software factory a sustainable business in the medium to long term?
To answer these questions, the management system needs to control the production and the development processes. In addition, the management system should assist in making decisions to improve efficiency, reduce costs, control the amount of software developed and ensure the sustainability of the business. It is necessary to integrate the IT strategy to the business strategy, and placing it in the BSC framework can be very useful. The BSC approach is probably the best-known management tool for a company. In 1992 and the years that followed, Kaplan and Norton, of Harvard University, presented the Balanced Scorecard [8,19] as a corporate performance tool that allows managers to look at the business from four important perspectives: financial, customer, internal business and innovation and learning; and that provides answers to four basic questions referred to each perspective:
How do we look to shareholders?
How do customers see us?
What must we excel at?
Can we continue to improve and create value?
Kaplan and Norton argued that traditional financial measures offer a narrow and incomplete picture of the business, and they suggest that financial measures must be supplemented with other non-financial measures that reflect customer satisfaction, internal business processes and the ability to learn and grow [11]. In the following years, Kaplan and Norton presented new views and ways to improve the initial BSC approach, and linked it with measures and the business strategy [9,20]. The idea of linkages among objectives and measurements led to the creation of the strategy map [21]. This provides a robust structure to companies to express their strategic objectives and offers managers the framework for a generic interactive system. Managers can design a customized interactive system based on their strategy and use the strategy map and the scorecard as the cornerstone of their management system for executing the strategy [22]. Furthermore, the results adopting the BCS framework to link the software development with the business strategy should confirm the effective enhancement of productivity to reach the established high-level goals.
Since the BSC was introduced, many authors proposed some modifications to adapt the initial BSC to other scorecards that were specific for different areas or industrial environments. The IT BSC [10,11] in the information technologies sector and the SBSC [23] related to sustainable management are two of the best-known examples. The BSC framework is a performance management system that should allow enterprises to drive their strategies in measurement and follow-up to improve efficiency, reach their objectives and build a sustainable business model. To achieve this, companies need to “draw” the strategy map: the high level goal, the business objectives, the measurement goals and, finally, the strategic linking them all. When the complete goal hierarchy is defined, measurements can be taken and interpretations made to see if the goals at all levels have been achieved [24].

2.3. The Financial Software Factory, a Case Study

The FSF studied in this work is a software factory associated with an important financial group in Spain. The financial group has more than 2500 offices and 10,000 employees and total assets of more than 55,000 million euros. The FSF, founded in the 1980s, is responsible for the definition and implementation of the common strategy in all matters related to automatic processing of the financial information group. The purpose of the FSF is to operate a common center of computer services for the financial institution of the group and has carried out the first implementation of “total outsourcing of banking applications” held in Spain, and it provides services to financial institutions comprising software development and platforms for their implementation and use. Currently, besides the financial group, it also serves other smaller financial institutions, both public and private. During 2014, the FSF employed about 700 people, including their own and outsourced employees, with a sales revenue of over 65 million euros, and it has made more than 5000 million economic transactions.
In a very restrictive economic environment and low growth rates, the FSF works to reduce costs, increase revenue and improve software developments and services. They are aware that they need to provide a mature and stable technological service, with quality and an appropriate price to satisfy their customers. They must develop and improve their services to remain the technological support of the financial group and collaborate with its sustainability and expansion. Given these circumstances, the top management of the FSF opted to establish an efficient management business system that offers BSC framework.

3. Results and Discussion

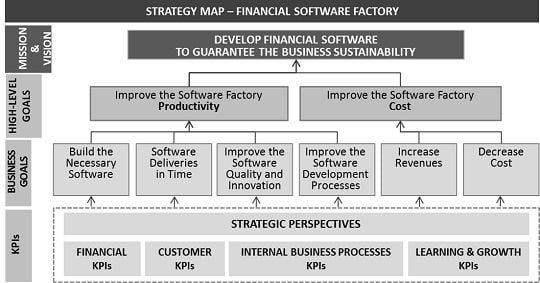
3.1. The Proposed BCS Management Framework

In this case study, the BSC framework was established for the higher management of the software factory as the preferred management system to guarantee organization sustainability. Studies show that companies that implement BSC tend to accomplish their goals or even outperform them [25]. Based on these ideas and principles, the software factory management gave its approval to this approach and explained to the whole organization their needs and their proposed ideas for transferring them into strategies. A set of fifteen KPIs was selected and a system of measurement for each KPI was adopted. Every KPI covers an area or department, and some KPIs are a compendium of other different indicators and measures. The KPIs were established with the best strategic perspective and thoroughly evaluated according to a planning timetable. The four perspectives of the BSC provide a robust structure to express the organization needs and their strategic objectives [22]. The adopted management system includes the Strategic Map and the KPI measures. Each KPI and its value measurement may influence one or more of the six Strategic Business Goals, which support the two Strategic High-Level Goals. The Strategic High-Level Goals are “pillars” of the strategy that directly supports achievement of the mission and vision of the organization. A good Strategic High-Level Goal is not just a particular objective, but a linked set of objectives that can impact on all of the four BSC perspectives. These linked objectives tell the story of the strategy, and form the basis for communicating the business strategy to everyone in a consistent manner [23]. This management system provides the necessary environment for making decisions in order to achieve the strategy of the company. Figure 2 shows the different layers of how a strategy using the BSC is developed, starting at the top with the company high-level strategy (Mission and Vision) and linking it, layer to layer, to KPI measures and the control of the objectives using the BSC.
Figure 2. Strategic thinking and planning using the BSC framework, adapted from The Balanced Scorecard Institute [23].
Sustainability 07 15800 g002
The proposed BSC framework, including the KPI description, the adopted BSC and the established strategic map, are described and explained below.

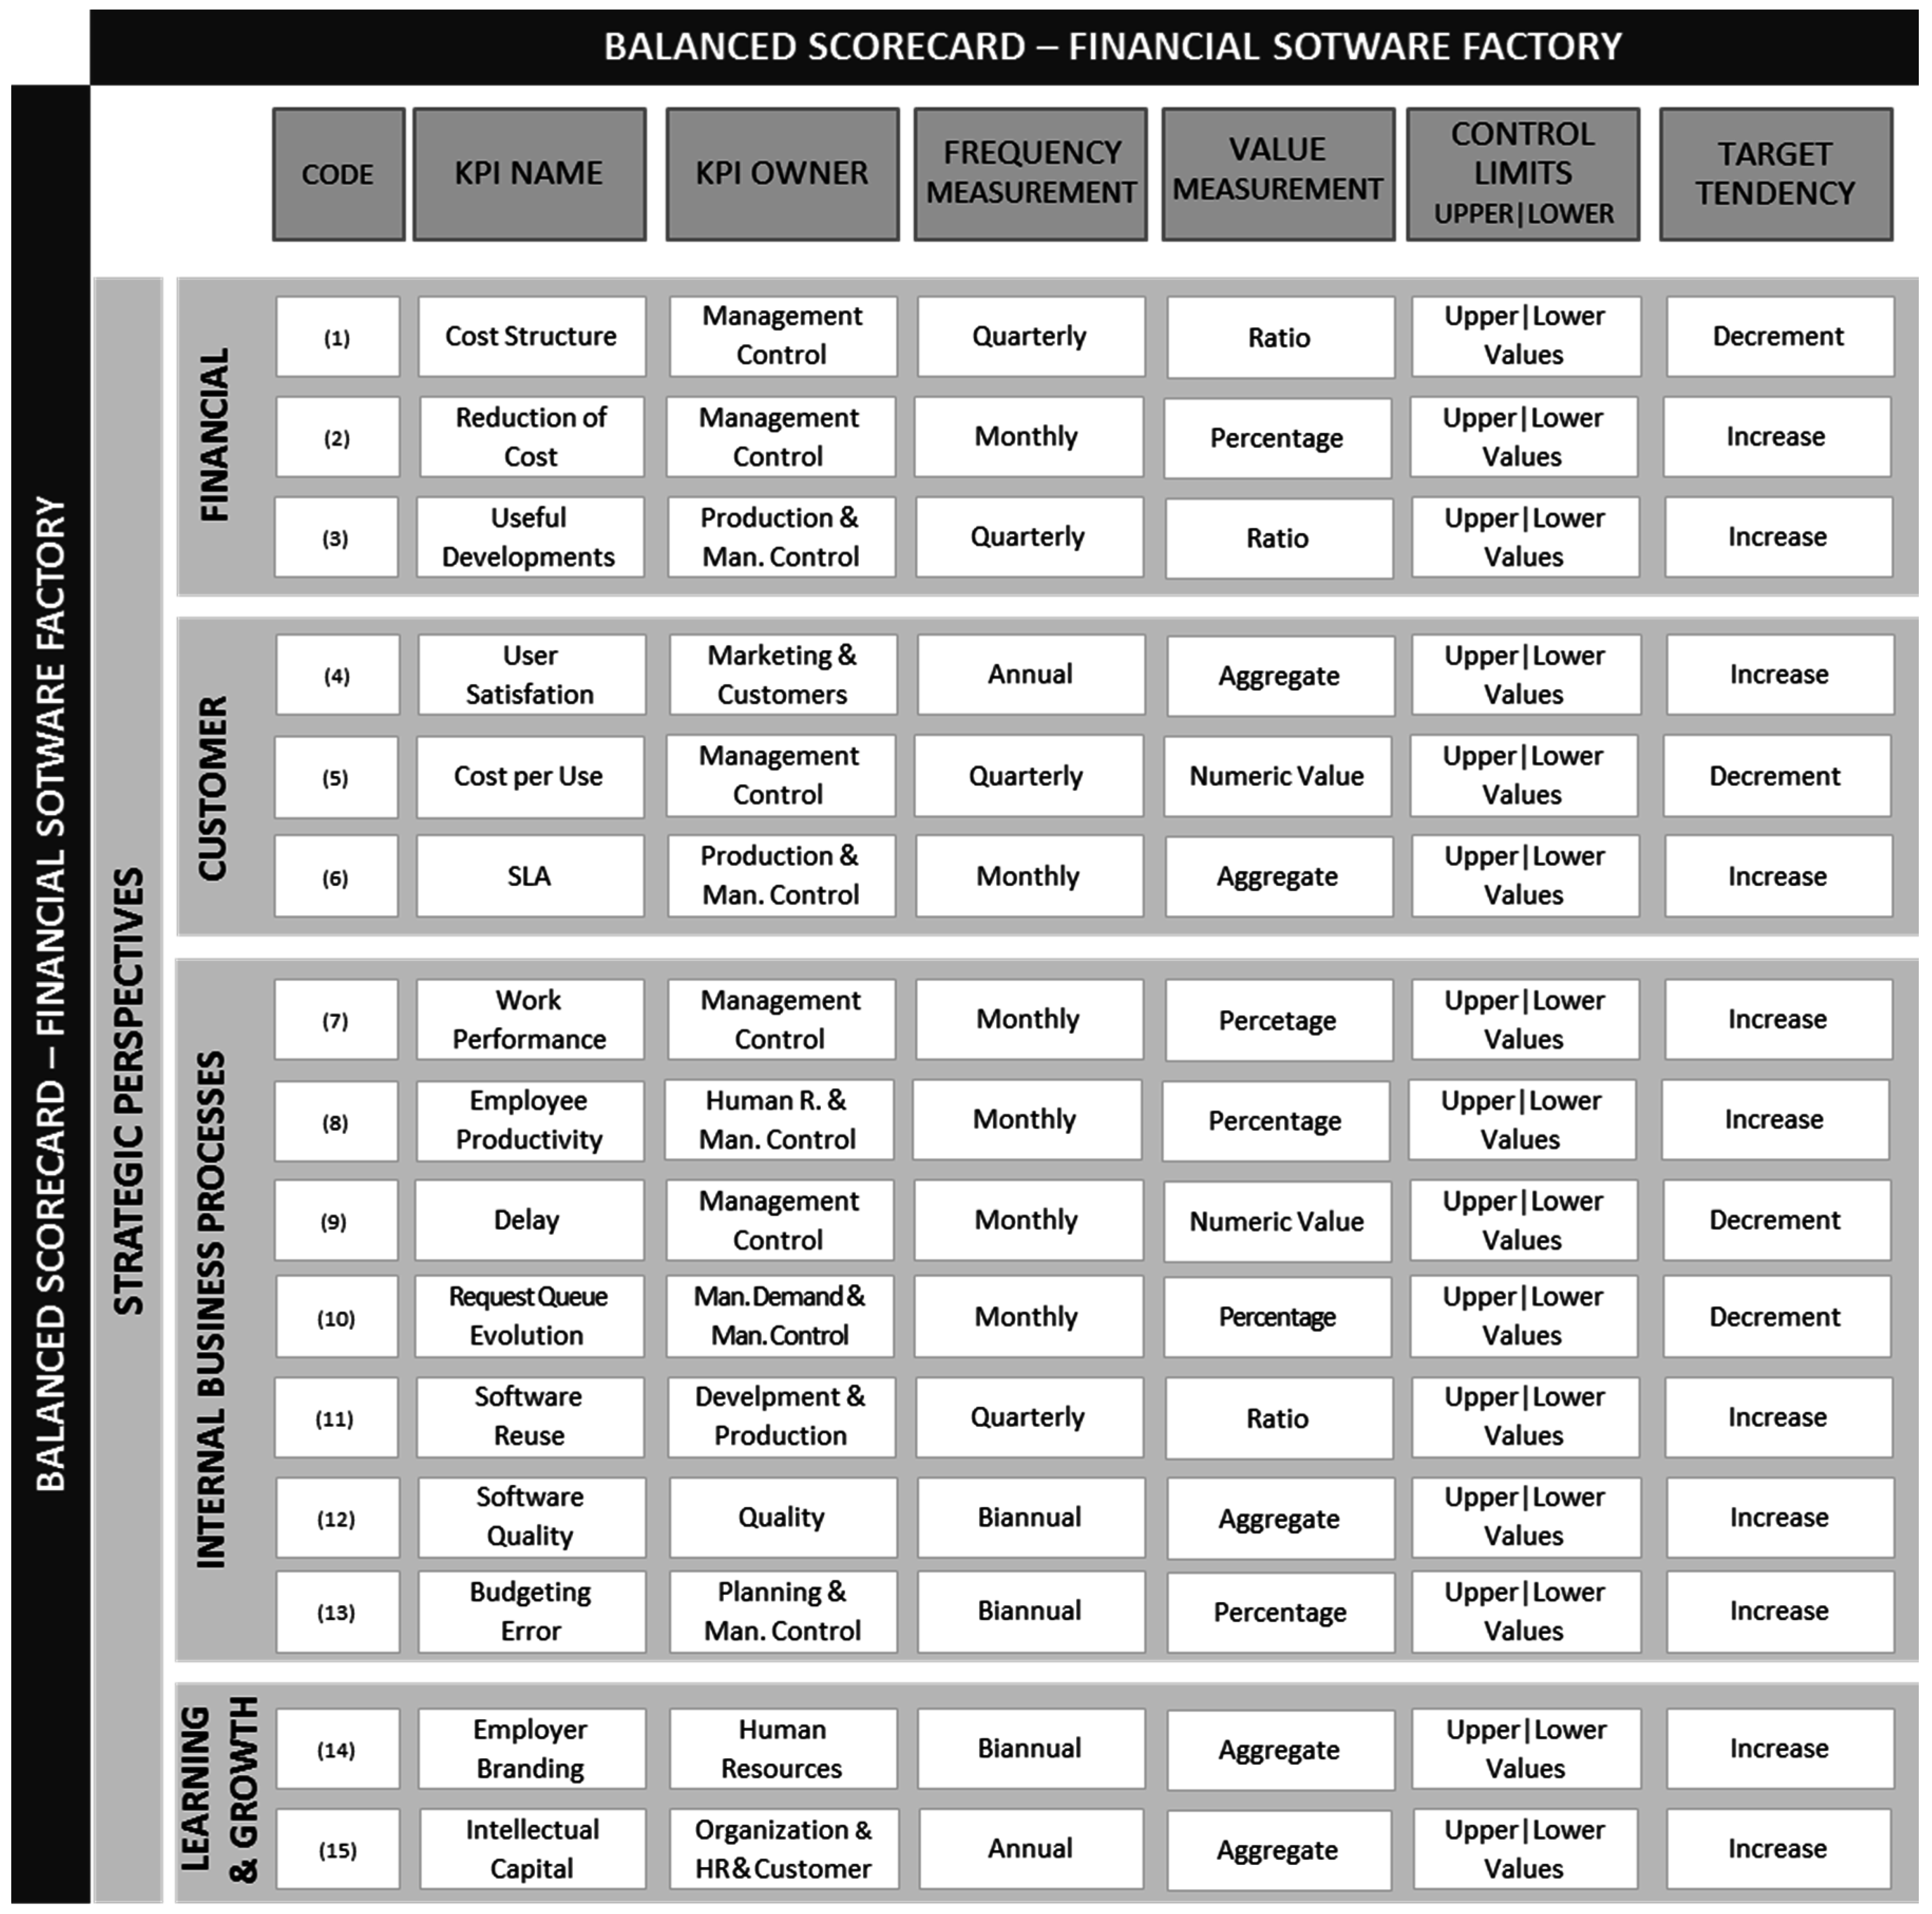
3.2. The Proposed KPIs for the BSC

The higher management of the software factory addressed the creation and selection of a set of KPIs according to the new needs transmitted by the financial group. KPIs are directly linked to business success, but defining an effective KPI is not always easy to do [26]. The KPIs defined were made in several work sessions with the participation of high and intermediate management staff, and they worked to choose a set of KPIs to ensure the business sustainability in the medium and long term. Some of the KPIs were simple to create and easy to obtain, since previous data and measurements existed that facilitated their preparation. On the other hand, there are other indicators that did not previously have measurements related to them, and these are being developed presently.
A set of fifteen KPIs are presented below, and for each of them, the following fields are described, according to the specifications published by the Advanced Performance Institute [27]:
KPI Name: All KPIs need a name which should clearly explain what the indicator is about.
Strategic BSC Perspective: Each KPI is aligned to one of the four BSC strategic perspectives.
KPI Owner: Identifies the areas or departments that are responsible for controlling each indicator and establishes the system to capture, store and retrieve the data related to this indicator.
KPQ: Identifies the key performance question (KPQ) that the indicator is helping to answer, and provides the context of why this indicator is being introduced.
Formula: Identifies how the data will be captured, if it is possible to create a formula, and if the KPI is a simple indicator or if it is composed of other indicators.
KPI justification and description: In this field the importance of KPI for the organization is justified, how the data needed to measure the indicator are obtained is described and all those relevant facts that should be known about the KPI are explained.
Furthermore, during the explanation of KPIs, there are usually several words or expressions used that need to be clarified for understanding:
Transactions: “Transactions” are those events that trigger the execution of a program, object, feature or section of code. Transactions can be triggered by a user request or by calling another transaction previously executed.
Total Software Factory Cost: We refer to “Total Software Factory Cost” as all costs incurred to make a business model work, including staff cost.
Total Financial Group Assets: In the banking sector, “Total Assets” are all that a bank owns, including loans, reserves, investment securities and physical assets. “Average of Total Assets” is a usual measurement to identify the size of a bank.
Total Executed Transactions: “Total Executed Transactions” is the number of times that a transaction is triggered during a predetermined fixed span of time.
Cost Charged to the Client: “Cost Charged to the Client” is the cost that the customer pays to use the software developments and services offered by the software factory. In this case, the customer is the bank’s business group, and the amount of this cost is related to the number of total transactions executed.
Budgeted Hours: In the proposed model, a “Budgeted Hour” is the amount of software that the software factory should build in an hour of real time. During the estimating process, the estimates of the size are transformed into hours. We use these hours to monitor the projects.
Performed Hours: In the proposed model, “Performed Hours” is the amount of software that the software factory had built in an hour of real time.

3.2.1. KPIs for the Financial Perspective

In general, the aim of the financial perspective is to provide a vision of the business to the shareholders, and usually answer the question: “to succeed financially, how should we appear to our shareholders?” [22], and shows plans for growth, handling risk and making a profit. It evaluates how well a strategy is being developed and executed in order to improve profits. KPIs in this perspective indicate whether the company’s strategy, implementation, and execution are contributing to bottom-line improvements [8]. Typical financial goals have to do with profitability, growth, and shareholder value. However, in this case and as it was explained before, one of the features of these software factories in the financial sector is the fact that the owner and the client are in both cases the same financial group. This means that typical KPIs from a financial perspective of BSC such as ROI (Return On Investment, measures the benefit to the investor resulting from an investment of some resource), ROA (Return On Assets, measures how profitable a company’s assets are in generating revenue) or ROE (Return On Equity, measures the relation by dividing the profit before tax, or net profit, compared to equity (capital and reserves)) are not appropriate for this particular case study, as the improved profits of the software factory are not important for the group, and also the fact that the improved result could be caused by the increase in customer invoicing, an undesirable situation of its own accord. Furthermore, KPIs related to sales revenue of software can be easily modified for the purpose of altering their values. In addition these changes do not provide improvements in the software factory’s productivity or efficiency. Other typical indicators of the financial perspective such as the growth of the company do not seem appropriate, since in this case the size of this FSF should vary in proportion to the financial institution of the group.
The needs and interests of the financial group that must be evaluated for improvement and optimization into the financial perspective of the software factory BSC are:
Reduction and optimization of the expenses of the software factory.
Sell the developments and services to other companies different from the owning financial group, to recover the development costs with external revenues.
Delivery of software development must be good quality and useful for the customer. The use of software increases customer loyalty and promotes business sustainability.
According to these premises, the following three KPIs were proposed for assessing the financial perspective of the software factory BSC, under the interests of the financial group as owner.

KPI Name: Cost Structure

  • Strategic BSC Perspective: Financial
  • KPI Owner: Management Control
  • KPQ: How to evolve the costs of the software factory?
  • Formula:
    C o s t   S t r u c t u r e = T o t a l   S o f t w a r e   F a c t o r y   C o s t T o t a l   F i n a n c i a l   G r o u p   A s s e t s
KPI justification and description: This indicator allows us to assess the evolution of the costs of the software factory. To do this, compare the costs of the software factory with the size of the financial entity, expressed as its total average assets over the last year. The financial group wants to have a contained cost structure, so the costs should vary according to the size of the financial institution. It is desirable that when the size of the bank decreases, the cost of software factory should decrease, at least as much as the bank does. On the other hand, when the size of the bank increases, the cost of the software factory could also increase, but without reaching the growth rates of the bank. Furthermore, this KPI should be aligned with the sector.

KPI Name: Reduction of Cost

  • Strategic BSC Perspective: Financial
  • KPI Owner: Management Control
  • KPQ: What is the ratio of costs that are covered by sales to companies outside the group?
  • Formula:
    R e d u c t i o n   o f   C o s t = E x t e r n a l   S a l e s   R e v e n u e T o t a l   S o f t w a r e   F a c t o r y   C o s t × 100
KPI justification and description: The purpose of this indicator is to assess the percentage of the structural cost of the software factory that is covered by income over the last year, whose source is the sale of software developments and services to companies outside the corporate group. Because of the huge cost of software development, sales revenue outside the financial group is generally seen as a reduction of costs associated with development, making it a sustainable factor linked to the software factory. Revenues from sales to companies outside the financial group are gaining increasing importance because other small financial groups choose to hire or rent the use of software development, as they find it impossible to deal, either temporally or economically, with needs originated by new software developments.

KPI Name: Useful Developments

  • Strategic BSC Perspective: Financial
  • KPI Owner: Production and Management Control
  • KPQ: How useful are the developments for the financial group?
  • Formula:
    U s e f u l   D e v e l o p m e n t = T o t a l   E x e c u t e d   T r a n s a c t i o n s T o t a l   F i n a n c i a l   G r o u p   A s s e t s
KPI justification and description: The purpose of this indicator is to assess the use of the delivered software developments. To compensate for the lack of traditional financial indicators linked to sales revenue in the BSC, this indicator can assess the extent of use by the group companies of (both older and more recent) software developments. It is understood that the greater use of the developments, the higher income should be achieved. The use of the developments is measured by the number of transactions executed in relation to the size of the financial institution over the last year. The increased ratio gives assurance to the financial group that developments are useful and, therefore, do their job well. Otherwise, a decrease in the use of development and services would generate uncertainty, casting doubt on their usefulness and the need to find alternatives for software developments outside the financial group. Business sustainability will be increased then, the higher the development and use of services offered and the greater the availability of the financial group to invest more resources in the software factory.

3.2.2. KPIs for the Customer Perspective

In general, the aim of the financial perspective is to assess customer satisfaction, in terms of satisfying and resolving customer needs. This perspective usually answers the question: “to achieve our vision, how should we appear to our customer?” [8,22]. Measures in this perspective are necessary because sustainability and financial success is achieved by solving the needs (products and services) demanded by customers. The BSC, as a description of a company’s strategy, should identify the customer objectives in each targeted segment [9].
The needs and interests of the financial group that must be evaluated for improvement and optimization into the customer perspective of the software factory BSC are:
To have covered the needs of software.
Software development must be delivered on time.
Services prices must be assumed by the client to be equal to the rest of the companies in the sector.
According to these premises, the following three KPIs were proposed for assessing the customer perspective of the software factory BSC, under the interests of the financial group as customer.

KPI Name: User Satisfaction

  • Strategic BSC Perspective: Customer
  • KPI Owner: Marketing and Customers
  • KPQ: What is the level of customer satisfaction?
  • Formula:
    U s e r   S a t i s f a c t i o n = Σ ( S a t i s f a c t i o n   A s p e c t s   V a l u e M a x i m u n   S a t i s f a c t i o n   A s p e c t s   V a l u e   x   S a t i s f a c t i o n   A s p e c t s   W e i g h t )
KPI justification and description: Most companies are becoming more aware of the importance of user satisfaction with the service provided. Universal end user computing in banking needs a reliable and valid instrument that measures satisfaction in this environment and evaluates its success when used in improving user performance [28]. User satisfaction KPI is defined as “the overall level of compliance with the user expectations, measured as a percentage of really met expectations” [29]. The level of satisfaction is, therefore, an aggregate measure of user satisfaction with various aspects of the service [30]. In this study, User Satisfaction KPI tries to measure the satisfaction of the financial entity concerning software developments and services given by the software factory. In order to measure financial institutions’ user satisfaction it can be used on an online survey in order to determine the strong and weak points of the services offered. According to the survey results, and the criteria for its evaluation, actions must be taken in order to improve user satisfaction and the quality of the services provided.

KPI Name: Cost per Use

  • Strategic BSC Perspective: Customer
  • KPI Owner: Management Control
  • KPQ: What is the relative cost of software development?
  • Formula:
    C o s t   p e r   U s e   = C o s t   C h a r g e d   t o   t h e   C l i e n t T o t a l   E x e c u t e d   T r a n s a c t i o n s
KPI justification and description: The financial entity, as a customer of the software factory developments and services, wants the costs to be as low as possible. This indicator relates the cost paid by the customer for the use, measured by the number of Executed Transactions, of the services contracted over the last year.

KPI Name: Service Level Agreements (SLA)

  • Strategic BSC Perspective: Customer
  • KPI Owner: Management Control
  • KPQ: What is the level of compliance with the SLA?
  • Formula:
    S L A   = Σ ( S L A   P r o v i d e d   V a l u e O p e r a t i v e   L e v e l   A g r e e d   f o r   S L A   x   I n d i c a t o r   W e i g h t )
KPI justification and description: In the software development sector the business provides critical application services for customers, which need effective mechanisms to manage and control them. SLAs are agreements signed between a service provider and another party such as a service consumer, broker agent, or monitoring agent [31]. Customers and companies need a method to maintain and identify the trust and reliability between each of the parties involved in the negotiation process. A well-structured SLA KPI has significant positive influence on the various aspects of relational governance in information technology outsourcing relationships. Overall, the findings support the proposition that well-developed SLAs not only provide a way to measure the service provider’s performance, but also enable effective management of outsourcing engagements through the development of partnership-style relationships with high levels of trust and commitment [32].
The proposed SLA indicator to use in the BSC is a multi-indicator that joins and unifies all the agreements reached with the financial group, and more specifically between the financial institution and the software factory. For each SLA established between the FSF and the financial institution, there are two values related to itself: the value of the agreed service and the provided value for this SLA. The value offered for the SLA KPI is an aggregated value based on the relationship (agreed and provided value) of each SLA and the weight established between the FSF and the financial institution for this relationship.

3.2.3. KPIs for the Internal Business Process Perspective

In general, the aim of the internal business process perspective is to achieve the shareholders’ and customers’ objectives, and usually to answer the question: “what business processes must we excel at?” [22]. Here, the managers identify the processes that are most critical for achieving the company objectives, and measures provide managers with information focus on internal operations and emphasize how a company delivers software products and services to its customers. Typical financial goals have to do with productivity, efficiency, performance, quality, schedule and planning cost and time, and other different and specific goals related to different companies.
In this case and as it was explained previously, one of the features of the FSF studied in this paper, is the fact that the software size is expressed in terms of the number of hours budgeted or estimated for its development, and also the cost of these software developments is based on these budgeted hours of work. This means the concepts of Budgeted Hours and Performed Hours to control and monitor the evolution of the developments in terms of size, time and cost can be unified around only one KPI.
The needs and interests of the financial group that must be evaluated for improvement and optimization into the internal business process perspective of the software factory BSC are:
Improve the efficiency and productivity related to software developments.
Identify cost and time deviations to avoid future problems.
Improve the quality of software developments.
According to these premises, the following seven KPIs were proposed for assessing the internal business process perspective of the software factory BSC, under the interests of the financial group.

KPI Name: Work Performance

  • Strategic BSC Perspective: Internal Business Process
  • KPI Owner: Management Control
  • KPQ: What is the Software Factory performance?
  • Formula:
    W o r k   P e r f o r m a n c e   = B u d g e t e d   H o u r s P e r f o r m e d   H o u r s × 100
KPI justification and description: The production performance and efficiency of firms is a major concern of many individuals, including policymakers, consumers, economists, and managers of the firms themselves. Consumers think firms that produce more efficiently tend to produce at lower prices and higher production levels. Firms desire to provide quality products at the lowest cost in order to maximize revenues for any given cost structure, which is facilitated by efficient production [33]. The most common measure used to determine the status of performance is productivity.
Obviously, one of the aspects of software development that needs to be improved is productivity. However, to quantify productivity a metric is needed that we can use to express productivity in terms of software product volume built in a span of time. When we are able to predict the size of the system and to measure product-size growth during development, the time required to complete the project can be better predicted, and productivity in terms of hours spent per unit of product size can be measured. By measuring the growth and size, we are able to identify differences between the actual and planned values and to start analyzing and managing the differences when they become apparent [7].
In this study, to construct an index of productivity to assets for the software development performance, a KPI structure needs to be implemented to measure the difference between the size of software budgeted (Budgeted Hours) and the size of software performed (Performed Hours) over the last year. The Work Performance KPI represents a comparison of the productivity level in terms of improving rates of software development and is defined as the number of budgeted hours divided by the number of hours performed for software development. This KPI can assess the labor productivity of the software factory. It also shows the degree of actual implementation against the estimated development projects, because of the duality between size and hours spent per unit of product size. Higher values for the indicator up to 100% indicate that performance and development productivity is higher than budgeted, and that the development will be completed with an advance equal to the percentage of improvement noted by the indicator. On the other hand, indicators below 100% indicate that productivity is not at the desired level and that the time schedule is not being met.
The value of the KPI is the development size (and hours) earned by the software factory production model.

KPI Name: Employee Productivity

  • Strategic BSC Perspective: Internal Business Process
  • KPI Owner: Human Resources and Management Control
  • KPQ: What is employee productivity?
  • Formula:
    E m p l o y e e   P r o d u c t i v i t y   = B u d g e t e d   H o u r s L a b o r   W o r k   H o u r s   × 100
KPI justification and description: This KPI measures the software product volume built in Budgeted Hours per labor hour of employees. This indicator, following the proposed scheme, shows the amount of software that an employee produces for each hour on the job. This ratio is interpreted as the percentage of employee productivity over the last year.

KPI Name: Delay

  • Strategic BSC Perspective: Internal Business Process
  • KPI Owner: Management Control
  • KPQ: What is the waiting time for software development deliveries?
  • Formula:
    D e l a y   =   T i m e   t o   F i n i s h   H o u r s B u d g e t e d   H o u r s
KPI justification and description: Furthermore to know if Performed Hours for development is in line with planning, it is necessary to know the average waiting time for deliveries of software developments. This indicator shows the delay in hours when the software factory is delivering software developments, and it relates the amount of software that is developed in a budgeted hour with the number of hours from the financial entity requesting the developments until these developments have been delivered to the customer. The value offered by this indicator shows the average waiting time for delivery of software built in one budgeted hour over the last year.

KPI Name: Request Queue Evolution

  • Strategic BSC Perspective: Internal Business Process
  • KPI Owner: Management Demand and Management Control
  • KPQ: How does the size of pending software deliveries evolve?
  • Formula:
    R e q u s t   Q u e u e   E v o l u t i o n   = F i n i s h   B u d g e t e d   H o u r s R e q u i r e d   B u d g e t e d   H o u r s × 100
KPI justification and description: This indicator shows the size of product volume that is being delivered against the software product volume that has been requested over the last year. The scheme proposed by this FSF means that there is always software to develop, so it is necessary to know this ratio for taking decisions if required, because it shows if the request queue of pending developments increases or decreases in time.

KPI Name: Software Reuse

  • Strategic BSC Perspective: Internal Business Process
  • KPI Owner: Development and Production
  • KPQ: What is the level of software reuse?
  • Formula:
    S o f t w a r e   R e u s e   = N u m b e r   o f   N o   F i r s t   T i m e   E x e c u t e d   T r a n s a c t i o n s N u m b e r   o f   F i r s t   T i m e   E x e c u t e d   T r a n s a c t i o n s
KPI justification and description: Some of the benefits of an effective reuse of software are: accelerated development, reduced development cost, increased quality, decreased software test time and enhanced customer satisfaction [34,35]. The FSF studied in this work is specialized in developing a specific family of financial products with known characteristics, not just arbitrary software applications, which allows the software factory approach [7,36] and the software reusability principles to be applied. The proposed Software Reuse KPI allows assessing the amount of software code that is effectively reused. This amount is determined by the number of transactions that are executed by the call of other transactions previously executed. When a transaction triggers the execution of another transaction, it means that the code executed had previously been developed, and, therefore, is reused code. An important event in the definition of this indicator is that the KPI values are obtained which provide post-processing developments, so that it is a dynamic measurement data obtained during execution of the software. It not only values the amount of reused code during the development process, but also assesses the number of times that reused code is executed by the daily activity of the financial institution. The Software Reuse KPI shows the calculated value of reusability code ratio according to these factors over the last year.

KPI Name: Software Quality

  • Strategic BSC Perspective: Internal Business Process
  • KPI Owner: Quality
  • KPQ: What is the quality of software development?
  • Formula:
    S o f t w a r e   Q u a l i t y   =   S u b S e t   ( Q u a l i t y   i n   U s e ;   P r o d u c t   Q u a l i t y   M o d e l )
KPI justification and description: Software Quality KPI offers to the managers the possibility of controlling the quality of software developments. In this model, we proposed that this KPI will be compounded taking standard metrics like those proposed in ISO 25010:2011 [37], Software Quality in Use (Effectiveness, Efficiency, Satisfaction, Freedom from Risk and Context Coverage) and Product Quality Model (Functional Suitability, Performance Efficiency, Compatibility, Usability, Reliability, Security, Maintainability and Portability).
The proposed Software Quality KPI works under the ISO 25010 standard, although this metric has been chosen in this model because it is one of the best known. To develop this KPI, each organization can choose the standard that seems most appropriate to establish its own metric related to software quality. The Software Quality KPI should offer a quality assessment of the developments according to ISO 25010, and in this study it has been chosen to use a subset of aggregated metrics in the project portfolio such as: efficiency, usefulness, functional correctness, functional appropriateness, time behavior, interoperability, others related to security, modifiability and adaptability.

KPI Name: Budgeting Error

  • Strategic BSC Perspective: Internal Business Process
  • KPI Owner: Planning and Management Control
  • KPQ: What is the budget error in software development deliveries?
  • Formula:
    B u d g e t i n g   E r r o r   =   Σ [ A B S ( B u d g e t e d   H o u r s     P e r f o r m e d   H o u r s ) ] P e r f o r m e d   H o u r s   × 100
KPI justification and description: This indicator measures the accuracy of the estimates linked to software development, and should be analyzed together with other indicators of Internal Business Perspective, especially the Work Performance KPI. The estimating process has different steps: previously an estimation of software size is done using technical sizing figures as Function Points, Lines Of Code and others linked to “Transactions”, and then, these estimates of the size are transformed into hours and are used to monitor the projects.
If the differences between Budgeted and Performed Hours are due to estimation errors rather than improvements in production processes, the methodology for budgeting (size, time and cost developments in hours) should be revised in order to reduce cost. It is necessary to emphasize the importance to have a very good system or tool for budgeting, because the estimation accuracy affects most KPIs into the Internal Business Process Perspective. The Budgeting Error KPI shows how good the estimations are over the last year, and its value is the planning error degree.

3.2.4. KPIs for the Learning and Growth Perspective

In general, the aim of the Learning and Growth perspective is to provide a vision about the continuity of the business. A company needs well-trained, highly skilled employees if it is to excel in the other perspectives in the BSC. This perspective usually answers the question: “can we continue to improve and create value?” [8]. The other three perspectives on the BSC identify the parameters that the company considers most important for competitive success, but investments in intellectual capital and employee capabilities make it possible to achieve them.
The software industry is a very demanding and challenging sector, characterized by vigorous competition, extensive dependence on intellectual capital and the need for continuous training in new technologies for competitive success. Other factors like quality of workforce, management capabilities and environmental conditions of a software organization also affect software development productivity [38]. A company’s ability to innovate, improve and learn ties directly in with the company’s value and sustainability of the business model. Typical goals in this perspective have to do with innovation, intellectual capital and more recently employer branding, including the most important features in human resources orientation.
The needs and interests of the financial group that must be evaluated for improvement and optimization into the Learning and Growth perspective of the software factory BSC are:
Ensure the presence of the best personnel for the company.
Improve the intellectual capital of the company in order to improve its sustainability.
According to these premises, the following two KPIs are proposed for assessing the Learning and Growth perspective of the software factory BSC, under the interests of the software factory.

KPI Name: Employer Branding

  • Strategic BSC Perspective: Learning and Growth
  • KPI Owner: Human Resources
  • KPQ: What is the employer branding of the company?
  • Formula:
    E m p l o y e r   B r a n d i n g   =   S u b S e t ( E m p l o y e r   B r a n d i n g   I n d i c a t o r   M e a s u r e s )
KPI justification and description: Employer Branding, a relatively new concept, is a new branch of enterprise brands. From conceptual understanding, like a product brand, it is an image given by the company to potential employees in the human resources market. With the growing competition among enterprises, many senior managers recognize talent as the key factor for an enterprise to succeed. The employer brand does not exist in a static market environment and it must be dynamically or organizationally shaped. Thus, enterprises need to build an employer brand with their own characteristics, and establish a series of internal and external evaluation and feedback systems [39].
In order to create a sustainable management of human resources, an attractive employer brand is necessary that can address the different needs and expectations of potential and existing employees, which can result in a sustained competitive advantage. Employees, and especially high-quality employees as a very important part of intellectual capital, must be attracted and retained by firms, and employer branding can help them to address the different needs and expectations of potential and existing employees [40]. Firms can use their brands to promote the value of sustainability to their industrial customers, consumers, and other stakeholders. This may be achieved through branding activities that emphasize the firm’s sustainability practices and their impact on stakeholders [41]. All sectors, but especially the software development sector where human capital is the most important factor in the process, must understand the importance and benefits of developing an employer brand to attract, engage and retain talent. A good employer branding strategy is crucial, and in this case it is necessary to know the software factory business objectives to guide the efforts to the interested audience [42]. There are employer branding measures with a high degree of accuracy and, according to the statistics in a study published in 2014 [43], there are several different possible metrics to use related to employer branding, but the most important are: employee satisfaction, employee engagement and loyalty, quality of hire, time and cost per hire, job acceptance rate of candidates, number of applicants, employee turnover, increased level of employee referrals, decreased absenteeism, promotion readiness rating, external/internal hire ratio, performance ratings of newly promoted managers and manager/executive failure rate. A subset of these employer branding indicators must be measured, established and merged into a specific Employer Branding KPI into the Learning and Growth perspective in the BSC.

KPI Name: Intellectual Capital

  • Strategic BSC Perspective: Learning and Growth
  • KPI Owner: Organization and Human Resources
  • KPQ: What is the intellectual capital level of the company?
  • Formula:
    I n t e l l e c t u a l   C a p i t a l   =   S u b S e t   ( H u m a n   C a p i t a l ,   S t r u c t u r a l   C a p i t a l ;   R e l a t i o n a l   C a p i t a l )
KPI justification and description: The concept of intellectual capital was revealed firstly by Kenneth Galbraith in 1969. Intellectual capital is usually defined as the combination of three main factors: Human Capital, Structural Capital and Relational Capital. When these factors are compatible with each other, this increases creativity, stimulates innovation and facilitates feedback [44].
The most important assets in the software industry are their employees, and their knowledge is the pillar of human capital. A business like this, with strong direct intellectual capital with innovative business behavior can survive for longer periods and obtain competitive advantage. A good information system to measure the intellectual capital of this software factory may well be strategic and can be used to leverage structural resource differences among firms, including differences in resource integration, diversification, and quality. Thus, an information system attempts to develop proprietary organizational capabilities for linking to firm performance [45]. An Intellectual Capital KPI that measures a subset of the intangible assets of human capital (knowledge, skills, abilities), structural capital (processes, procedures, organization, information systems, common repository) and relational capital (customers, suppliers, contributors) is included in the proposed BSC to assess this essential part of the assets of the company that develop the business and make it sustainable. A remarkable fact about structural capital and software companies is that they often adapt their processes to improvement frameworks that guide them in high-performance operations, as in CMMI® [46] or PRINCE2® [47].

3.3. The Proposed Financial Software Factory Balanced Scorecard

This study has opted to choose the classic BSC originally proposed and developed by Kaplan and Norton [8], although being a business IT company, it might seem more appropriate to have adopted the IT-BSC introduced by Van Grembergen [10] and widely studied later [48,49]. The second is better for an IT department in a company, but in this study the software factory is treated as a whole company and not as an internal IT department.
Figure 3 shows the Balanced Scorecard proposed for this FSF. The BSC includes the proposed KPIs, each of them situated in their corresponding strategic perspective. The BSC is completed with various fields assigned to each KPI: Code (every indicator should have a unique identification number that makes it easier to keep track of indicators [27]; here, “Code” refers to corresponding numbers of the equations in this article), KPI Name, KPI Owner, Frequency Measurement, Value Measurement, Target Tendency and the Upper and Lower Control Limits to manage the processes stability. By linking the financial and non-financial KPIs exposed in this study with the strategy, and using the BSC as a management support, we have the necessary management system in order to ensure medium- and long-term sustainability.
Figure 3. The Balanced Scorecard proposed for the Financial Software Factory.
Sustainability 07 15800 g003

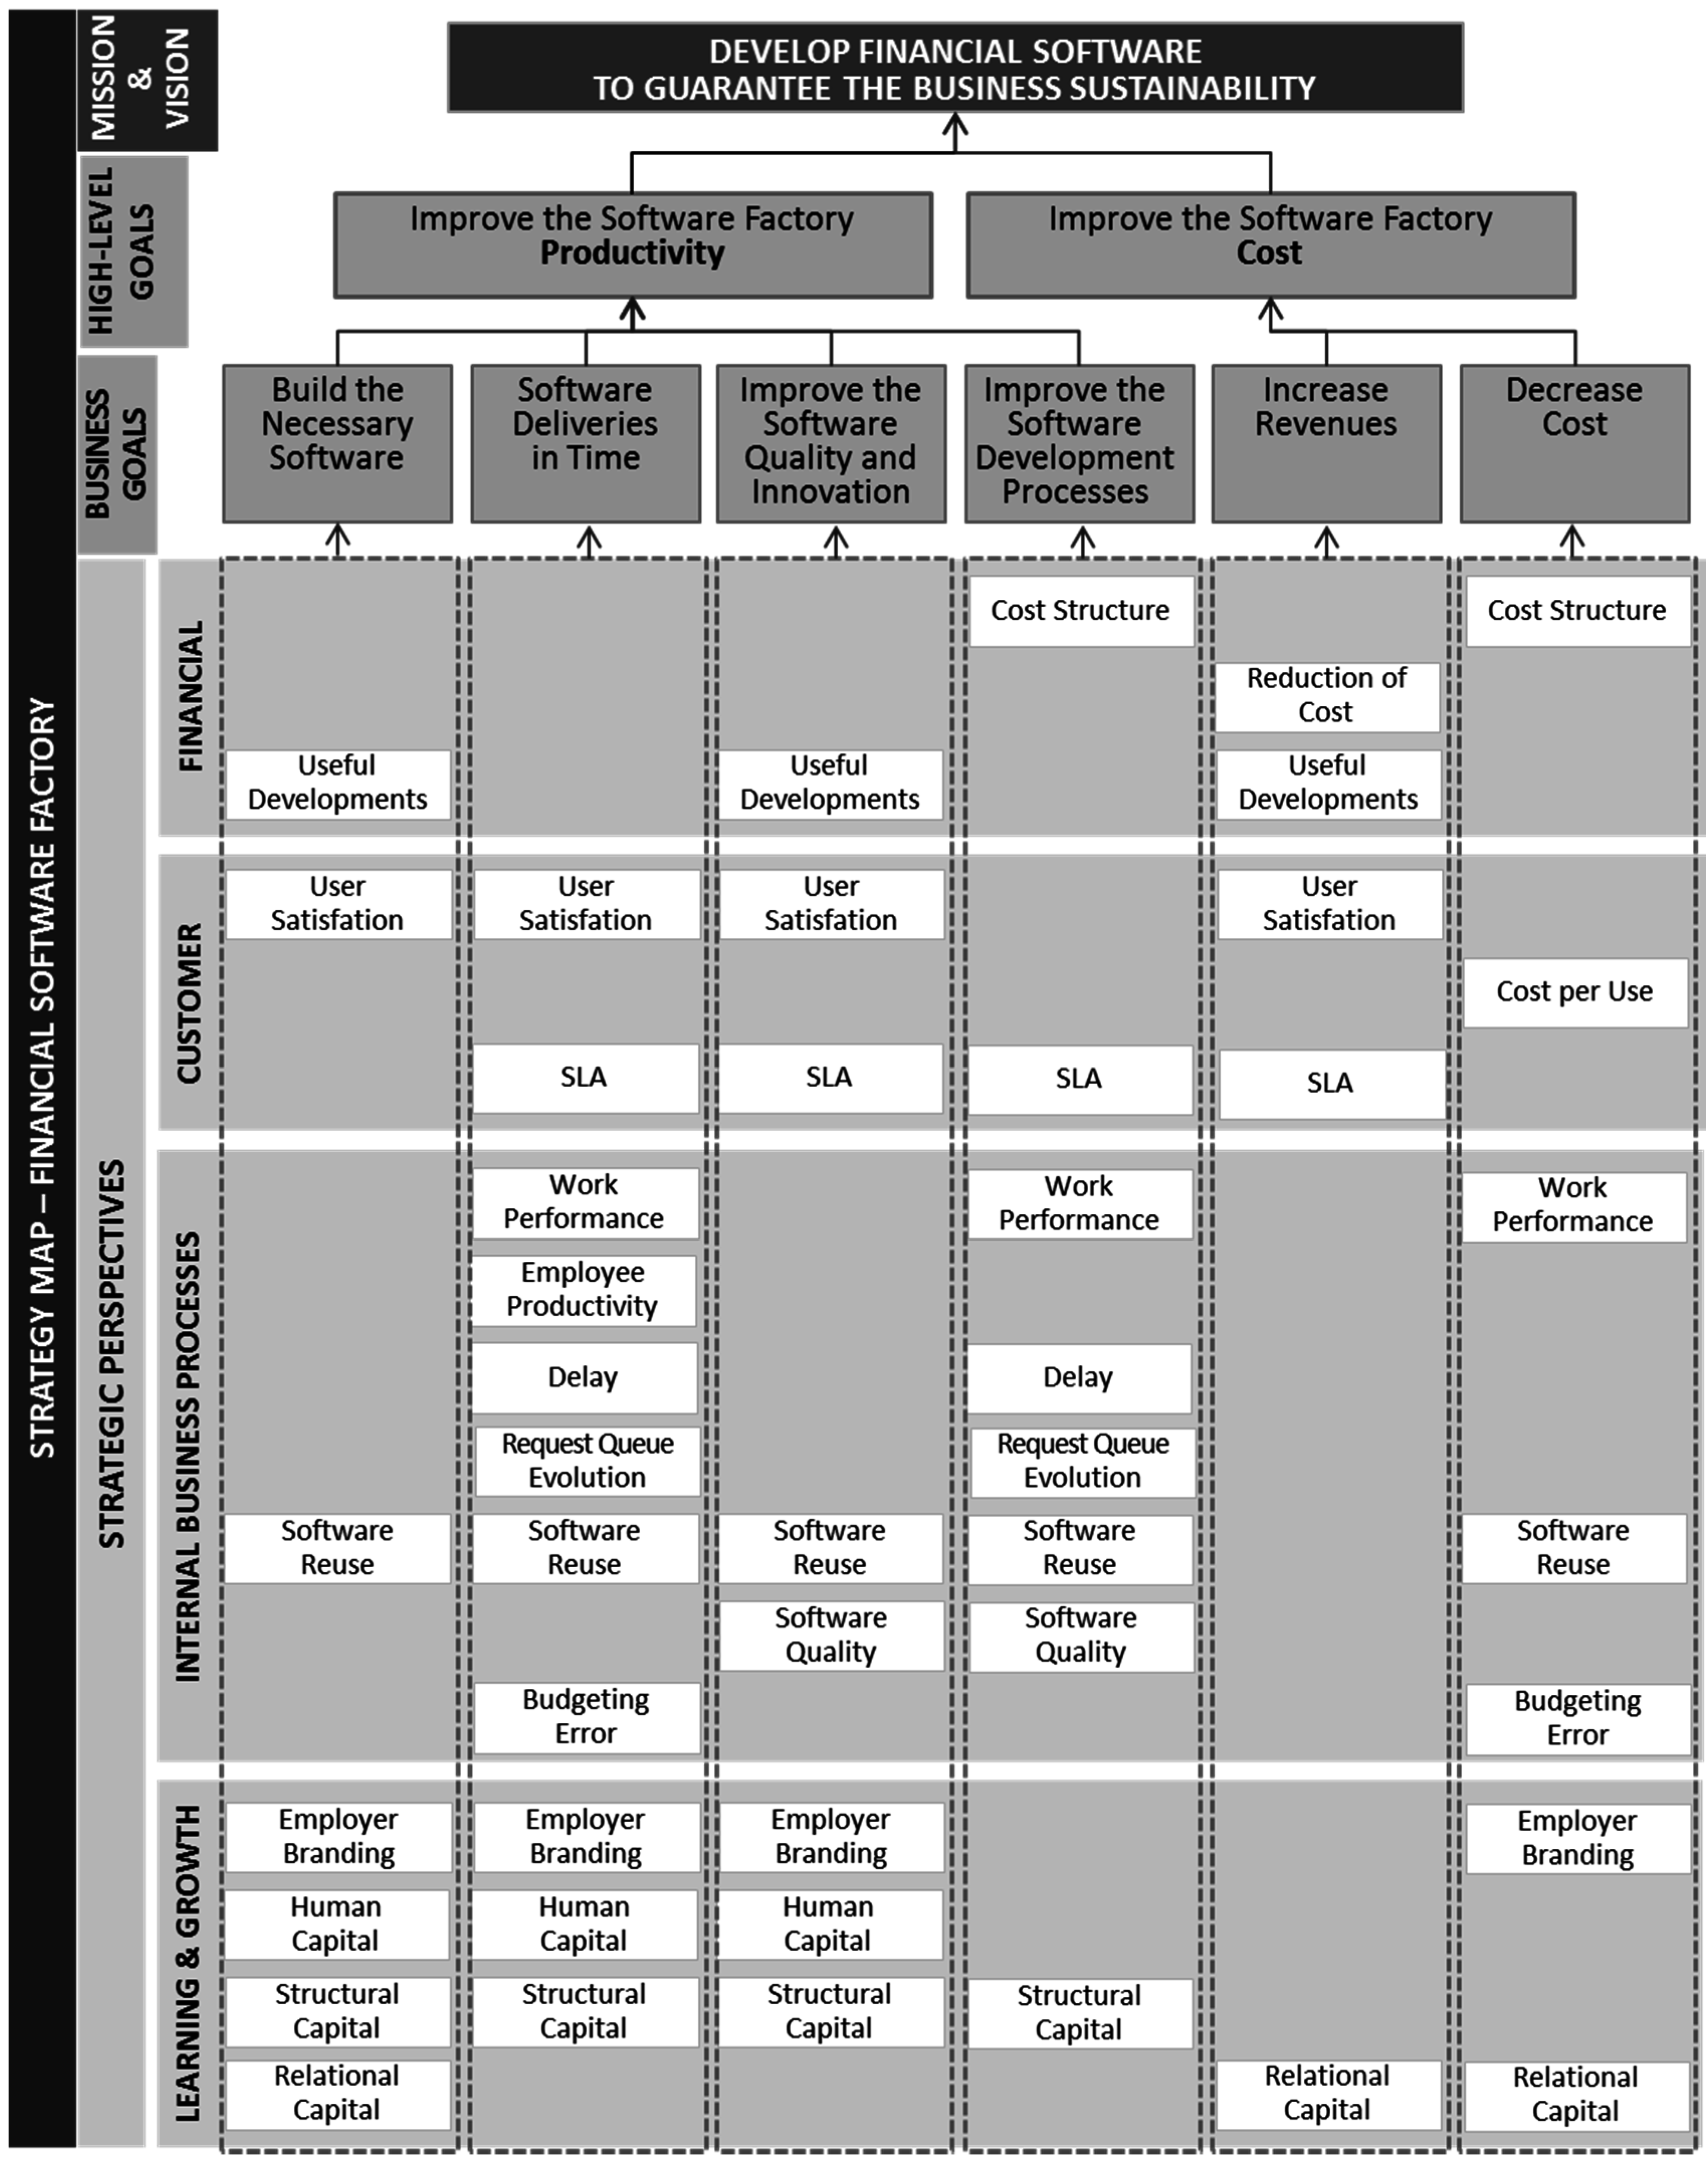
3.4. The Strategy Map of the Financial Software Factory

Software development is becoming increasingly a pervasive element in many business areas, and furthermore, linking software activities to an organization’s higher-level business goals can improve its performance [50].
In software-intensive organizations, as in this work, it is necessary to link software measurement goals to higher-level goals. This linkage is important, as it helps to justify software measurement efforts and allows measurement data to contribute to higher-level decisions [24].
To develop and implement the strategy map of the software factory studied in this work, the financial group, led by top management, met in working sessions with representatives from different levels and areas. In these meetings, they proposed a new approach to plan and implement the business strategy, and they decided on one of the options, the most appropriate mechanisms for linking the measurement goals to higher-level goals for the software factory. These working groups determined the right set of strategy decisions, the business goals, the software goals and the metric for measurement of goals, similar to that proposed by Basili et al. in some of their studies published in 2007 [24] and 2010 [51], concerning both software development and business strategy. Finally, and according to all of these, they created a strategy map that effectively shows the linkages of the software factory objectives to the whole financial group.
Figure 4. The strategy map proposed for the Financial Software Factory.
Sustainability 07 15800 g004
Figure 4 shows the Strategy Map proposed for this Software Factory. At the top of the Strategy Map are the Strategic Goals: the Strategic Mission and Vision, the Strategic High-Level Goals and the Strategic Business Goals. Under each Strategic Business Goal a set of KPIs is situated. This set includes the KPIs that are directly related and have and influence in each specific Strategic Business Goal. Every Strategic Business Goal has its own set of KPIs and every KPI can influence more than one Strategic Business Goals, as it is represented in Figure 4. KPIs do not have a specific influence to each other into the strategy map.

3.5. Preliminary Validation Plan

A validation plan provides an opportunity to build and improve the trust in a new model. In this case, the software factory management will need to use the model effectively in decision making in order to improve the software development processes. An effective validation plan requires a consistent approach across all validation features of the BSC framework. To make this the management must to consider all about software development processes. An effective validation plan requires time and efforts to reach and prove the different steps or phases: Planning, Execution, Review and Scoring and, finally, Analysis and Reporting [52]. Furthermore it will be necessary a tool that support these steps. Validation plan is an important role in framework improvement and it will help to understand and identify weaknesses, strengths and limitations. Finally it will be the key towards approval to use this proposed model for a FSF and as result a validation report will show the scope of the validation.
The FSF studied in this work has already provided us with the first monitoring data that are necessary for the validation of the proposed model. Until now, we only have data for some indicators from 2012 to 2014, but they allow us to draw some conclusions that should be endorsed with the data obtained for the following years. Table 1 shows the values of the data for some of the main indicators of the company and their influence on some of the KPIs proposed in this model, during 2012 (the last year working with the old framework) and 2014 (the first complete year working with the framework proposed). The KPIs presented show positive values associated with lower costs and improved performance and productivity. In contrast, the Budgeting Error KPI needs more corrective actions for improvement.
Table 1. Data and KPIs values obtained during 2012 and 2014.
Data/Year20122014Var.%
Finished Software Request33842425.44%
Budgeted Hours251,019257,9512.76%
Performed Hours354,722339,847−4.19%
Group Revenues60,418,000 €54,681,000 €−9.50%
Core Transactions1,296,439,2811,276,054,739−1.57%
KPIs/Year20122014Var.%
Cost per Use0.04660.0429−8.05%
Work Performance70.7775.907.26%
Employee Productivity0.560.6515.93%
Budgeting Error29.2324.10−17.57%
Over the next few years, new data will be collected and new indicators will be assessed in order to confirm the performance and productivity improvements observed during 2014.

4. Conclusions

Over the past 25 years, many articles have been written that proposed the BSC as a business management tool for improving business. Assessing the productivity and performance of software development industries is not easy, due to the intangible nature of the final product, but they need to know and control the production to establish policies and strategies that can achieve the desired goals.
In this paper a management system for controlling the productivity of a FSF is proposed, and for this aim, a specific framework based on the BSC is defined in order to answer the questions that the managers need to be satisfied. For this purpose and in a working environment based on the software factory approach, we have adopted a set of management objectives that applied to this type of FSF allowing them to establish measurements that are linked to the internal business process that can value the software development quality and productivity, and its evolution over time. The proposed relationship between size, budgeted hours, the cost of software deliveries, and the specific indicators designed to control it, facilitate the difficult task of controlling the deployment and deviations of the software projects. This knowledge is necessary for making corrections and initiatives to guide the production process to the desired performance. The indicators included in the financial perspective provide insights into the economic viability of the FSF and allow comparing it with other similar FSF. The assessment of the indicators included in the other two perspectives provides information about the relationships amongst the company, customers and employees. This information values the availability of customers to remain so and checks if human resources planning promotes the continuity and growth of the business.
The BSC is a “necessary good” for companies, especially when is used as a framework and guideline for a strategy approach of the organization and its corresponding structure [12]. According to our knowledge, this work is the first to propose the BSC framework to be used in this specific kind of IT firm whose mission is to develop financial software adapted to the banking sector. The special features discussed in this study on the FSF, result in other proposals from typical indicators for BSC not fitting properly for this type of management system, arising therefore, the need for new proposals. The described model is limited to use in this kind of FSF, although it could be apply in other different software factories that fit the presented framework.
Although the framework has being implemented in a real context with beneficial results, as shown in Table 1, the adoption is still very recent so no definitive conclusions can be drawn.
The proposed BSC, design of the indicators and their relationship with the business goals set, provide a management system that allows production control, facilitates the needs of management and allows them to take appropriate decisions for the sustainability of the software development business in a specific FSF.
Likewise and in relation to this work, we expect to launch new studies linked to the optimization of demand management systems for project portfolios of this type of software factory.

Acknowledgments

This work has been subsidized through the Plan of Science, Technology and Innovation of the Principality of Asturias (Ref: FC-15-GRUPIN14-132). The authors also thank anonymous referees who reviewed and gave important comments to this paper.

Author Contributions

Vicente Rodríguez and Francisco Ortega contributed in developing the conception of the research design; data interpretation; and writing. César Álvarez contributed in the development and execution of the research approach; literature review; data collection and integration; validation and writing. Joaquín Villanueva contributed in enhancing the research approach and data collection.

Conflicts of Interest

The authors declare no conflict of interest.

References and Notes

  1. Papalexandris, A.; Ioannou, G.; Prastacos, G.P. Implementing the Balanced Scorecard in Greece: A Software Firm’s Experience. Long Range Plan. 2004, 37, 351–366. [Google Scholar] [CrossRef]
  2. De la Fuente Asprón, R. Medir la Productividad del Desarrollo de Software en Banca. Available online: www.financialtech-mag.com (accessed on 22 June 2013).
  3. Fenton, N.; Bieman, J. Software Metrics: A Rigorous and Practical Approach; CRC Press: Boca Raton, FL, USA, 2014. [Google Scholar]
  4. Emaldi Abasolo, M. The Software Factories. Dyna (Bilbao) 2007, 82, 330–333. [Google Scholar]
  5. Murphy, G.C. What is software development productivity, anyway? (keynote). In Proceedings of the 10th Working Conference on Mining Software Repositories (MSR), San Francisco, CA, USA, 18–19 May 2013; IEEE Press: San Francisco, CA, USA, 2013; p. 1. [Google Scholar]
  6. Brown, A.W.; Lopez Mancisidor, A.; Reyes Oliva, L. Practical Experiences with Software Factory Approaches in Enterprise Software Delivery. In Proceedings of the Sixth International Conference on Software Engineering Advances, ICSEA, Barcelona, Spain, 23–29 October 2011; pp. 465–470. Available online: http://www.thinkmind.org/index.php?view=instance&instance=ICSEA+2011 (accessed on 26 November 2015).
  7. De Vries, M. Measuring Success with Software Factories. Available online: https://msdn.microsoft.com/en-us/library/bb245774.aspx (accessed on 26 November 2015).
  8. Kaplan, R.S.; Norton, D.P. The Balanced Scorecard—Measures That Drive Performance. Harv. Bus. Rev. 1992, 70, 71–79. [Google Scholar] [PubMed]
  9. Kaplan, R.S.; Norton, D.P. The Balanced Scorecard: Translating Strategy into Action; Harvard Business Press: Boston, MA, USA, 1996. [Google Scholar]
  10. Van Grembergen, W. The Balanced Scorecard and IT Governance. Inf. Syst. Control J. 2000, 2, 40–43. [Google Scholar]
  11. Martinsons, M.; Davison, R.; Tse, D. The balanced scorecard: a foundation for the strategic management of information systems. Decis. Support Syst. 1999, 25, 71–88. [Google Scholar] [CrossRef]
  12. Mooraj, S.; Oyon, D.; Hostettler, D. The Balanced Scorecard: A Necessary Good or an Unnecessary Evil? Eur. Manag. J. 1999, 17, 481–491. [Google Scholar] [CrossRef]
  13. Rodríguez Montequín, V.; Álvarez, C.; Ortega, F.; Villanueva Balsera, J. Scorecard for Improving Software Factories Effectiveness in the Financial Sector. Procedia Technol. 2013, 9, 670–675. [Google Scholar] [CrossRef]
  14. Djotio Ndie, T.; Tangha, C.; Ekwoge Ekwoge, F. MDA (Model Driven Architecture) as a Software Factory Industrialization Pattern: An Approach for a Pragmatic Software Factories. J. Softw. Eng. Appl. 2010, 3, 561–571. [Google Scholar] [CrossRef]
  15. Poppendieck, M.; Poppendieck, T. Lean Software Development: An Agile Toolkit; Addison Wesley: Boston, MA, USA, 2003. [Google Scholar]
  16. Hotle, M.; Landry, S. Application Delivery and Support Organizational Archetypes: The Software Factory. Available online: https://www.gartner.com/doc/980919/application-delivery-support-organizational-archetypes (accessed on 26 November 2015).
  17. Peredo Valderrama, R.; Canales Cruz, A.; Peredo Valderrama, I. An Approach toward a Software Factory for the Development of Educational Materials under the Paradigm of WBE. Interdiscipl. J. E-Learn. Learn. Objects 2011, 7, 55–67. [Google Scholar]
  18. Rodríguez Montequín, V.; Álvarez Pérez, C.; Ortega Fernández, F.; Villanueva Balsera, J. Scorecard and KPIs for monitoring software factories effectiveness in the financial sector. Int. J. Inf. Syst. Project Manag. 2013, 1, 29–43. [Google Scholar]
  19. Kaplan, R.S.; Norton, D.P. Putting the Balanced Scorecard to Work. Harv. Bus. Rev. 1993, 71, 134–140. [Google Scholar]
  20. Kaplan, R.S.; Norton, D.P. Using the Balanced Scorecard as a Strategic Management System. Harv. Bus. Rev. 2007, 85, 150–161. [Google Scholar]
  21. Kaplan, R.S.; Norton, D.P. Strategy Maps: Converting Intangible Assets into Tangible Outcomes; Harvard Business School Press: Boston, MA, USA, 2004. [Google Scholar]
  22. Kaplan, R.S. Conceptual Foundations of the Balanced Scorecard. Handb. Manag. Account. Res. 2008, 3, 1253–1269. [Google Scholar]
  23. Rohm, H.; Montgomery, D. Link Sustainability to Corporate Strategy Using the Balanced Scorecard; The Balanced Scorecard Institute: Cary, NC, USA, 2011. [Google Scholar]
  24. Basili, V.; Heidrich, J.; Lindvall, M.; Münch, J.; Regardie, M.; Rombach, D.; Seaman, C.; Trendowicz, A. Bridging the Gap between Business Strategy and Software Development. Available online: aisel.aisnet.org/icis2007/25/ (accessed on 26 November 2015).
  25. Chi, D.-J.; Hung, H.-F. Is the BSC really helpful for improving performance? Evidence from software companies in China and Taiwan. Afr. J. Bus. Manag. 2011, 5, 224–239. [Google Scholar]
  26. Eckerson, W.W. Creating Effective KPIs. Available online: http://www.information-management.com/issues/20060601/1056305-1.html (accessed on 26 November 2015).
  27. Marr, B. How to Design Key Performance Indicators, Management Case Study; The Advanced Performance Institute: Buckinghamshire, UK, 2010. [Google Scholar]
  28. Etezadi-Amoli, J.; Farhoomand, A.F. A structural model of end user computing satisfaction and user performance. Inf. Manag. 1996, 30, 65–73. [Google Scholar] [CrossRef]
  29. Tyrinopoulus, Y.; Antoniou, C. Public transit user satisfaction: Variability and policy implications. Transp. Policy 2008, 15, 260–272. [Google Scholar] [CrossRef]
  30. Del Castillo, J.M.; Benitez, F.G. A Methodology for Modeling and Identifying Users Satisfaction Issues in Public Transport Systems Based on Users Surveys. Procedia-Soc. Behav. Sci. 2012, 54, 1104–1114. [Google Scholar] [CrossRef]
  31. Alhamad, M.; Dillon, T.; Chang, E. Conceptual SLA framework for cloud computing. In Proceedings of the 4th IEEE International Conference on Digital Ecosystems and Technologies (DEST), Dubai, United Arab Emirates, 13–16 April 2010; pp. 606–610.
  32. Goo, J.; Kishore, R.; Rao, H.R.; Nam, K. The Role of Service Level Agreements in Relational Management of Information Technology Outsourcing: An Empirical Study. MIS Q. 2009, 33, 119–145. [Google Scholar]
  33. Morrison, C.J. A Microeconomic Approach to the Measurement of Economic Performance: Productivity Growth, Capacity, Utilization, and Related Performance Indicators; Springer Science & Business Media: Berlin, Germany, 2012. [Google Scholar]
  34. Sommerville, I. Software Engineering (9th Edition); Pearson Addison Wesley: Boston, MA, USA, 2004. [Google Scholar]
  35. Huda, M.; Arya, Y.D.S.; Khan, M.H. Quantifying Reusability of Object Oriented Design: A Testability Perspective. J. Softw. Eng. Appl. 2015, 8, 175–183. [Google Scholar] [CrossRef]
  36. Fuller, T. A Foundation for the Pillars of Software Factories. ACSIJ 2012, 1, 10–17. [Google Scholar]
  37. Joint Technical Committee ISO/IEC JTC 1/SC7 ISO/IEC 25010:2011 Systems and Software Engineering–Systems and software Quality Requirements and Evaluation (SQuaRE)–System and Software Quality Models 2011.
  38. Yilmaz, M.; O’Connor, R.V. An Empirical Investigation into Social Productivity of a Software Process: An Approach by Using the Structural Equation Modeling. In Systems, Software and Service Process Improvement; Springer: Berlin, Germany, 2011; Volume 172, pp. 155–166. [Google Scholar]
  39. Chunping, Y.; Xi, L. The Study on Employer Brand Strategy in Private Enterprises from the Perspective of Human Resource Management. Energy Procedia 2011, 5, 2087–2091. [Google Scholar] [CrossRef]
  40. App, S.; Merk, J.; Büttgen, M. Employer Branding: Sustainable HRM as a Competitive Advantage in the Market for High-Quality Employees. Manag. Rev. 2012, 23, 262–278. [Google Scholar]
  41. Kumar, V.; Christodoulopoulou, A. Sustainability and Branding: An Integrated Perspective. Ind. Market. Manag. 2014, 43, 6–15. [Google Scholar] [CrossRef]
  42. Nagy, I. How to Measure your Employer Branding ROI. Available online: http://www.social-hire.com/social-recruiting-advice/2151/how-to-measure-your-employer-branding-roi (accessed on 7 July 2015).
  43. Minchington, B. 2014 Employer Branding Global Trends Study Report; Employer Brand International—EBI: Torrensville, Australia, 2014. [Google Scholar]
  44. Örnek, A.Ş.; Ayas, S. The Relationship between Intellectual Capital, Innovative Work Behavior and Business Performance Reflection. Procedia 2015, 195, 1387–1395. [Google Scholar] [CrossRef]
  45. Wu, I.-L.; Chen, J.-L. A stage-based diffusion of IT innovation and the BSC performance impact: A moderator of technology-organization-environment. Technol. Forec. Soc. Change 2014, 88, 76–90. [Google Scholar] [CrossRef]
  46. Software Engineering Institute. Capability Maturity Model Integration (CMMI®) Version 1.3. Available online: http://cmmiinstitute.com/ (accessed on 15 September 2015).
  47. Office of Government Commerce. PRINCE2®:2009 (Projects IN Controlled Environments). Available online: https://www.axelos.com/best-practice-solutions/prince2 (accessed on 15 September 2015).
  48. Van Grembergen, W.; de Haes, S. Measuring and Improving IT Governance through the Balanced Scorecard. Inf. Syst. Control J. 2005, 2, 35–42. [Google Scholar]
  49. Van Grembergen, W.; Saull, R.; de Haes, S. Linking the IT Balanced Scorecard to the Business Objectives at a Major Canadian Financial Group. J. Inf. Technol. Case Appl. Res. 2003, 5, 23–50. [Google Scholar] [CrossRef]
  50. Kathuria, R.; Joshi, M.P.; Porth, S.J. Organizational alignment and performance: past, present and future. Manag. Decis. 2007, 45, 503–517. [Google Scholar]
  51. Basili, V.; Heidrich, J.; Lindvall, M.; Münch, J.; Regardie, M.; Rombach, D.; Seaman, C.; Trendowicz, A. Linking Software Development and Business Strategy Through Measurement. IEEE Comput. 2010, 43, 57–65. [Google Scholar] [CrossRef]
  52. Towers Watson. Effective Model validation—Embedding Trust. Available online: https://www.towerswatson.com/en/Insights/IC-Types/Ad-hoc-Point-of-View/Insights/2013/Insights-Model-validation (accessed on 26 November 2015).

