1. Introduction
Greenhouse effects are resulting in the gradual increase of the temperature of our planet, and greenhouse gasses (GHGs) are believed to be primarily responsible for the phenomenon.
The proliferation of countless number of products and transport activities related to trade between countries, the consumer goods market growth fostered by free trade on one side and an ever increasing consumer awareness on the other, promote the necessity to assess the impact that production of goods and services have on the environment.
Food production invariably has a significant impact on the environment and numerous studies have been completed to assess its entity. A recent review published by Schau and Fet [
1] on life cycle assessment (LCA) methods highlights the importance of food production with respect to potential harm to the environment together with sources and methods of calculating this impact. Nonetheless, whilst LCA is a comprehensive way to calculate a product environmental impact, it is sometimes complex to communicate it to non-technical users and often LCA methodologies used on novel food productions pose several questions [
2]. On the other hand, CFP is an “easy to read”, largely recognized climate indicator to provide in-depth knowledge of the environmental impact of a good or service [
3,
4,
5,
6,
7]. CFP calculation allows the evaluation of emissions of carbon dioxide equivalent in the atmosphere caused by productions. Although CFP it is not as comprehensive as LCA, it provides companies with a means to show the environmental performance of their products in a way that final consumer can easily read.
This work is aimed at calculating the CFP of value added nut products such as creams and powders prepared from raw materials sourced in Italy at a manufacture company based in northwest Sicily.
Whilst nuts and nuts based products consumption is significantly increasing in Italy and all around the world [
8,
9], very little or virtually no scientific literature exist with regards to calculation of their CFP. Italian consumption of nuts is 115,000 tons for almonds, pistachios and hazelnuts and 60,000 tons for peanuts (shell free) and has increased by 15% in the past six years [
8]. World peanut production totals approximately 31 to 36 million metric tons of which about 46% is produced in China, followed by India and USA at 5%. [
9]. The growing interest in nuts based products increases the need for awareness of their impact on the environment. Companies dealing with value added dried nuts cannot afford to ignore the issue, since the final consumer attention on the environment is significantly increasing and the competitive global market obliges operators to align to this [
10]. On the other hand, GHG emissions of productions are directly related to energy and materials consumptions, hence to direct costs. Therefore, actions towards the calculation and reduction of GHG emissions of consumer goods productions induces beneficial effects not only to the environment, but also firms, which can significantly increase their competitive advantage and reduce production costs. The aim of this study is to calculate the total CFP of the following types of value added nut products:
- (1)
Bags of dried transformed hazelnut, pistachio and almond sourced in Italy;
- (2)
Bags of dried peanuts sourced in Argentina;
- (3)
Jars of pastes and spreadable creams of hazelnut pistachio and almond sourced in Italy.
All production takes places at a company based in Messina province, Sicily.
2. Methodological Approach
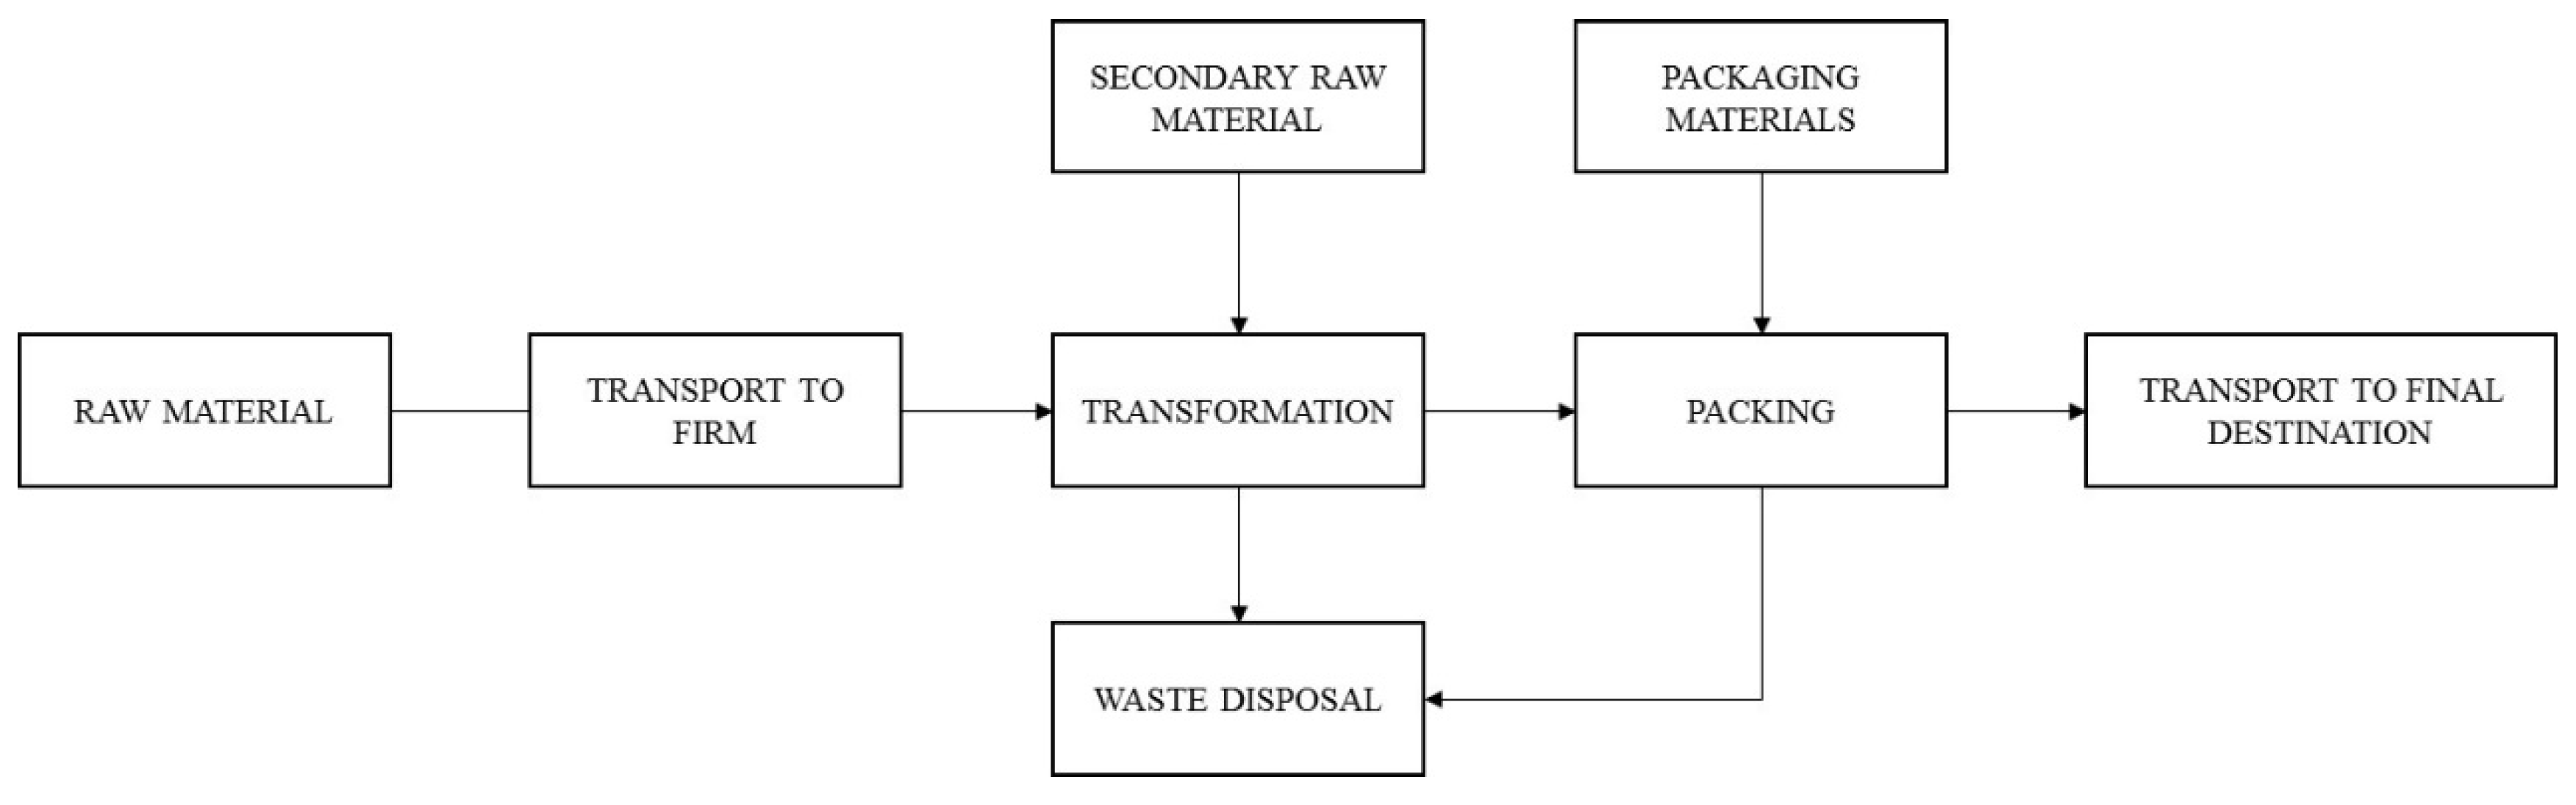
Methodology adopted for calculating the CFP is based on UNI ISO/TS 14067. kg CO2 per kg of finished product was used as a functional throughout the calculation. For the purposes of the analysis, the calculation was performed by dividing the production process according to the logical schematics: raw material → transport inbound → transformation → packing → transport to destination.
Lacking specific data for CFP of raw material cultivated in Italy, the data was derived from the literature regarding fruit cultivation in USA [
11,
12]. In those works a life cycle assessment (LCA) model was constructed for almond, pistachio, and walnut production in California and for peanuts in the US. Agro-chemical inputs, mechanized operations, soil processes, geospatial variation, and biomass accumulation are explicitly modelled based on technical reports, economic cost-and-return studies, field data collection, and grower interviews. The annual GHG foot-prints for orchards from nursery to hulling/shelling facility gate, were calculated.
Due to the similarity of cultivation technique, these data were applicable to the fruit dealt with in the present work. The cultivation of nuts in temperate and subtropical environments presents significant similarities [
13]. The small differences which are envisaged to be influencing the final GHG, were estimated to be either not directly comparable (e.g., Differences in land orography) or not relevant for the present work (e.g., differences in the average power of machines used for mechanized part of the cultivation).
CFP of transformation phase was calculated empirically from firm information, that means that each of the specific transformations that the products underwent in the factory, was analyzed in terms of employed power and material throughput, that allowed to calculate the energy (electric and thermal) employed by each kg of finished product as the product of the power employed in W by the material throughput in kg/h. The energy spent was then converted to CO
2 equivalent according to the rules for national energy mix and rules for calculation of GHG emission for different primary sources [
14,
15].
CFP related to transport (inbound and outbound) and packaging was calculated using existing models respectively:
Ecological Transport Information Tool for Worldwide Transports [
16] and
Compass Design [
17]. The year 2013 was taken as a reference year and CFP contributions below 3% of total value were ignored (
cut-off value). The analysis was carried out for 84 references among bags and jars of almonds, hazelnut peanuts and pistachios and classified into two main different groups for type of packaging and type of raw material, as reported in
Table 1.
Table 1.
Types and packaging of raw material.
Table 1.
Types and packaging of raw material.
| Type of Packaging | Raw Material |
|---|
| Products in bag (dry fruit, flour, grains) | Peanut, Almond, Hazelnut and Pistachio |
| Product in jar (spreadable cream, paste) | Peanut, Almond, Hazelnut and Pistachio |
All productions use fruits sourced in Italy with exception of productions based on peanuts, which are sourced in Argentina. Italy is still a lead producer of pistachios and hazelnut, whereas almond production is shrinking in favor of USA and Turkey producers [
18]. Italian pistachio production is concentrated almost exclusively in Sicily and the total production is not sufficient to satisfy the internal demand, hence most of the pistachio consumed in Italy is imported from Iran [
19], nonetheless, the company sources all the pistachio from local Sicilian producers, the same goes with almonds that are all sourced by small local producers. Thus, the calculation will refer and is applicable to products sourced entirely in Italy.
With respect to composition, final products are made of a single or multiple ingredients. Fruit in bags are normally composed of a single ingredient, which underwent some sort of mechanical and/or thermal transformation, jars may be made of a single or multiple ingredient and coated fruits are always made of multiple ingredients.
Salted peanuts include salt as a secondary ingredient, nonetheless, the salt accounts for some 1% in weight of the product and therefore it was ignored in the calculation.
Pastes in jars are simple or composed, simple pastes are made of a single ingredient, while mixes of pastes and grain in jars are made of 90% paste and 10% grain of the same main ingredient. This of course is taken into account when calculating the energy consumption associated to production.
Praline (coated) almond and hazelnut include a quantity of milk or dark chocolate approximately 2.57 kg per each kg of raw material.
Spreadable creams are made up of hazelnut as the primary ingredient and other secondary ingredients mixed in different proportions depending on the recipe requested by the customer. The recipes vary only very slightly between one customer and the other.
Table 2 shows the recipes for multiple ingredient products including the recipe of hazelnut spreadable cream used for the present calculation.
Table 2.
Multiple ingredients products, percentage weight of secondary ingredients.
Table 2.
Multiple ingredients products, percentage weight of secondary ingredients.
| Reference | Secondary Ingredient | Percentage Weight in Recipe |
|---|
| Salted peanut | salt | 0.50% |
| Fried peanut | vegetable oil | 1.75% |
| Praline almond and hazelnut | milk chocolate | 72.00% |
| Praline almond and hazelnut | dark chocolate | 72.00% |
| Tamari coated toasted almond | soy oil | 10.00% |
| Hazelnut spreadable cream | hazelnut paste | 14% |
| cocoa | 11% |
| powder milk | 11% |
| sugar | 45% |
| sunflower oil | 6% |
| palm oil | 12% |
| flavors | 1% |
The vast majority (97.46%) of the products is sold by the company is sent to Europe (mainly Italy, France and Germany), the remaining part is sold to Great Britain, Sweden, the USA and Hong Kong (this latter is negligible in quantity).
Products are packed in controlled nitrogen atmosphere to prevent oxidation, low density polyethylene (LDPE) is used for the bags which are then labelled in a special dedicated department. Jars are packed in a semi-automatic dedicated apparatus.
All packed items are stored in boxes, in different number of bags or jars per box depending on the product, and then stored in a warehouse (refrigerated if necessary), prior to be sent to the final destination.
With respect to the present analysis, the production chain may be divided into 4 macro chapters: (1) raw materials (primary and secondary ingredient); (2) transport (inbound and outbound) (3) production and (4) packaging. Removal of production waste is dealt with within the raw materials chapter.
2.1. Raw Material
Emissions caused by almond, hazelnut and pistachio production were defined as described in [
11], calculation accounts for all emissions related to growth of the plant to maturity. Cultivation and production related emissions are averaged among 60 years plant life. The calculated value considers a credit obtained from the energy conversion of part of the shells. No credit is calculated for energy conversion of the tree trimmings and prunings during plants life.
We assumed that thermal energy was recovered from the 50% of the shells (in weight). This assumption is justified by the fact that almond, hazelnut and pistachio are all supplied in Italy where energy recovery of trimmings and prunings is negligible, while recovery of thermal energy from the shells is common practice [
19]. Sequestration of carbon dioxide during plant lifetime is also accounted for.
The credit due to the recovery of thermal energy from the shells is calculated considering the mass of shell per kg of fruit (oven dry basis) as follows [
14]:
- ▪
Almond: 0.45;
- ▪
Hazelnut: 0.77;
- ▪
Pistachio: 1.01.
The energy content of the shell is equal to 4.6 kWh
th/kg [
14] and therefore the recovery of thermal energy per kg of fruit:
- ▪
Almond: 1.04 kWhth/kg;
- ▪
Hazelnut: 1.77 kWhth/kg;
- ▪
Pistachio: 2.32 kWhth/kg.
GHG emissions credit due to shell recovery is then calculated according to the following sequence. Total energy recovered is calculated based on Low Heating Value (LHV) of materials as per the following equation:
The amount of saved GHG emissions is calculated considering the avoided Liquefied Petroleum Gas (LPG) consumption at firm level, due to production of heat via shell combustion, as shown on equation:
Thus, assuming a value of avoided emissions of 0.227 kg CO
2eq/kWh of energy produced with LPG or Natural Gas [
15], the following are the net emission for the fruit.
- ▪
Almond: 0.23 kg CO2eq/kg;
- ▪
Hazelnuts: 0.40 kg CO2eq/kg;
- ▪
Pistachio: 0.53 kg CO2eq/kg.
Emissions from peanuts are assumed to be 0.621 kg CO
2eq/kg as reported in [
12]. The datum considers all emissions during plants life, fruits cultivation and all transformations up to shell removal. No reliable data was found to account for amount of shell recovered and therefore to evaluate the corresponding credits related to energy recovery.
In an influential study, Houghton
et al [
20] stated that the rate at which carbon is accumulating in terrestrial ecosystems is uncertain, as are the mechanisms responsible for sink. They state that estimates based on measured changes in wood volumes range between 0.079 and 0.280 petagrams of carbon per year in United States.
The variability of the datum is high and so are the uncertainties. Similarly, no sufficiently reliable data was found on the current trend in land use change linked to nuts cultivation in Sicily, for this reason, the related emissions have been neglected in the calculation.
2.2. Secondary Raw Material
For the purpose of the present work, raw materials, which contribute to the final product recipe as additional ingredients are called “secondary raw materials”.
The references that are made of more than one ingredient are: salted peanuts, toasted almonds, tamari covered fruits, almond and hazelnut praline and spreadable creams. In addition to the main raw material, and salt as a secondary raw material, salted peanuts are responsible for consumption of a quantity of oil used for frying. Tamari toasted almonds also consume some 10% in weight of tamari as a secondary raw material.
Emissions caused by secondary raw materials are calculated from data found in the literature [
21,
22,
23]. The values are shown in
Table 3 and expressed as kg CO
2eq/kg together with the amount calculated in the recipe in terms of percentage weight.
As shown on the table, hazelnut paste is a semi-finished product which was considered a secondary material for spreadable cream preparation.
Table 3.
CFP emissions related to secondary raw materials.
Table 3.
CFP emissions related to secondary raw materials.
| Reference | Secondary Ingredient | % Weight in Recipe | CFP (g CO2eq/kg) |
|---|
| Salted peanut | Salt | 0.50% | Negligible |
| Fried peanut | Vegetable oil | 1.75% | 1.65 |
| Praline almond and hazelnut | Milk chocolate | 72% | 3.6 |
| Praline almond and hazelnut | Dark chocolate | 72% | 2.1 |
| Tamari toasted almond | Soy oil | 10% | 2.95 |
| Hazelnut spread | Hazelnut paste | 14% | 0.76 |
| Cocoa | 11% | 3.6 |
| Powder milk | 11% | 2.4 |
| Sugar | 45% | 0.96 |
| Sunflower oil | 6% | 1.65 |
| Palm oil | 12% | 1.65 |
| Flavors | 1% | Negligible |
2.3. Transport (Inbound and Outbound)
Emissions related to transportation are calculated using
Tool for Ecological Transport Information Worldwide Transports. Details are available in [
16].
Transportation of incoming raw material takes place mainly via road from Italy for all the raw materials with the exception of peanuts, which travel from Argentina by sea.
Transport emissions are calculated according to the
Life Cycle Assessment (LCA) approach considering fuel consumed by vehicles and fuel production. Emissions of CO
2eq are calculated according to the following Equation (3) used in the model:
The calculation excludes:
- ▪
the construction and maintenance of vehicles;
- ▪
the construction and maintenance of infrastructures;
- ▪
other sources of energy consumption such as administrative premises, airports, stations, etc.
Calculation of CO
2eq footprint consists of two elements:
- (1)
the footprint due to direct energy consumption (electricity, fuel);
- (2)
the emissions related to fuel production and energy, based on the means of transport.
Table 4 describes the assumptions made based on mode of transport.
Table 4.
Assumptions based on the means of transport.
Table 4.
Assumptions based on the means of transport.
| Transport Way | Transport Mode | Propelling Energy |
|---|
| road | single or double truck | diesel |
| train line | different weight trains depending on total transported weight | electricity and diesel (depending on area of travel) |
| internal waters | vessels for internal waters | diesel |
| sea | container ships of different sizes depending on the total amount of transported weight | heavy oils, marine diesel oils, marine gas oils |
| air | cargo planes of different sizes depending on the total transported weight | kerosene |
Emission factors are derived from [
24]. The influence of load factor are calculated in accordance to the model, an empty vehicle accounts for 1/3 below the consumption of a fully loaded vehicle, depending on the road gradient.
Additional to the emissions caused directly by operating the vehicles, all emissions and the energy consumption of the generation of final energy (fuels, electricity) are taken into account. The impacts of building the infrastructure for extraction and generation of the different energy carrier are also included.
The main energy carriers used in freight transport processes are liquid fossil fuels such as diesel fuel, kerosene and heavy oil and electricity.
To compare the environmental impacts of transport processes with different energy carriers, the total energy chain is considered in the model as follows:
Energy chain of electricity production:
- ▪
Exploration and extraction of the primary energy carrier (coal, oil, gas, nuclear, etc.) and transport to the entrance of the power plant;
- ▪
Conversion within the power plant (including construction and deposal of power stations);
- ▪
Energy distribution (transforming and catenary losses).
Energy chain of fuel production:
- ▪
Exploration and extraction of primary energy (crude oil) and transport to the entrance of the refinery;
- ▪
Conversion within the refinery;
- ▪
Energy distribution (transport to service station, filling losses).
The emission factors and energy demand for the construction and disposal of refineries, exploration and preparation of different input fuels; the transport to the refineries; the conversion in the refinery and transport to the filling station are taken from Ecoinvent™ 2009 [
25].
2.4. Transformation
The calculation of energy consumption related to product transformation is carried out, for each product, by summing up all the electricity and heat energy consumptions caused by each stage of the process to the final product stored and ready for shipment. Each production process requires electric and/or thermal energy which allows calculation of electricity and heat per kg of finished product according to the following equation:
where:
- ▪
ENel/th is electricity or heat expressed in kWhel/th used during i-th stage of the transformation process;
- ▪
Pel/th is the electric and thermal power expressed in kWel/th consumed during the i-th stage of the transformation process, (the value is derived by the technical manuals of the machine used);
- ▪
p is the hourly productivity expressed in kg/h output from the entire converting line.
Therefore, electricity and/or heat consumption in the process, are calculated as the sum of all electrical and thermal energies caused by all stages of production to the final product.
Electrical and thermal energy are then converted into equivalent CO
2 emissions according to what reported on [
15]. The equivalence for electrical energy considers the actual national energy mix, while the heat was converted considering it produced with GPL, as that is the fuel used by the company to produce thermal energy.
Table 5 and
Table 6 show as an example of the method of calculation, the specific energy consumed for the peeling process that some of the products undergo as the first transformation before moving on to the following phases.
Table 5.
Example of energy calculation (peeling). Base data.
Table 5.
Example of energy calculation (peeling). Base data.
| Base for Calculation | Data |
|---|
| Hourly production (kg/h) | 800 |
| Electrical energy per kg of product (Whel/kg) | 5.6 |
| Thermal energy per kg of product (Whth/kg) | 72.5 |
Table 6.
Example of energy calculation (peeling). Values.
Table 6.
Example of energy calculation (peeling). Values.
| Element | Hot Bath | Brushing Conveyor Belt | Drying | Selection Belt |
|---|
| Powers | | | | |
| Electric (W) | | 2500 | | 2000 |
| Thermal (W) | 40,000 | | 18,000 | |
| Energies | | | | |
| Electrical energy per kg of product (Whel/kg) | 0 | 3.1 | 0 | 2.5 |
| Thermal energy per kg of product (Whth/kg) | 50.0 | 0 | 22.5 | 0 |
Each of the products under analysis is therefore dealt with as a raw product that undergoes a series of transformations that lead to the final transformed product. The total thermal and electric energy used is therefore the sum of the single energies consumed for each transformation processes that products undergo. As specified above, removing fruits shell is already accounted for in the calculation of the CFP of the raw material, therefore, the processes that have been closely analyzed are:
Cleaning and calibration: this is performed internally via a laser calibration machine.
Peeling. This stage takes place outside the company through a series of machines that use both thermal and electrical power supply.
Soft skins removal. This process takes place outside the company by rotary mechanical system that uses electricity to remove the soft skin of fruits.
Toasting. This is a particularly energy-intensive process, which consumes mainly heat by a LPG fueled oven. The raw material is loaded into the oven and moved through to gradually warmer sections. The nominal power of the oven is 350 kW. LPG calorific value is assumed to be 113 MJ/Nmc. At regime the system operates using 30% of its nominal power, to dry approximately 7% moisture of the product.
Deep frying. This process is used exclusively for peanuts. Palm oil and peanut oil in the desired quantity are stored in special boilers heated by LPG. The boilers power is 93.04 kW and at regime works at 57% of its nominal power.
Grinding. A mechanical process driven by electrical energy to reduce size of product.
Fine grinding. A mechanical process, which reduces materials to 1.3 mm particle size. The line comprises a vibrating sieve and a hammer fine grinder.
Almond paste making. The raw material is passed through a series of vibrating sieves and then through ball mill. The friction created between the balls and the crushed material raises the heat to keep the paste to a liquid state so that it can be pumped to a silos that is equipped with a stirring systems and kept at room temperature using water heated through a recovery system which uses heat generated by friction in the ball mill. The productivity per hour is approximately 350 kg/h, with an electric power of 18,600 W and a specific energy consumption of 53 Wh/kg.
Toasted almond paste. The process uses the same line discussed in the preceding paragraph but guarantees a higher productivity of about 600 kg/h and an energy consumption of 31 Wh/kg.
Hazelnut paste. Similar to the previous lines, only, in addition, the raw material also passes through a vibrating sieve and a vibrating filter. The line uses a power of 23,800 W and its productivity is 90 kg/h, energy consumption is therefore 264 Wh/kg.
Almond and hazelnut chocolate coating. The process takes place in temperature-controlled environment. Milk chocolate or dark chocolate are melted in a special container heated by an electrical resistance, then poured on almonds or hazelnuts and then cooled by a stream of cold air so that the coating solidifies on the dried fruits. The calculation includes electricity consumption for air conditioning and line cooling, as well as for melting the coating chocolate. Both energy consumption during the heat transient and for keeping the regime temperature are considered. Air conditioning is active 8 months over 12 and is assumed to work at around 30% of its peak power. It employs some 18,700 W electric power, productivity is 66 kg/h, and then the energy consumed is 284 Wh/kg.
Spreadable hazelnut cream. The process takes place downstream of the hazelnut paste line, ingredients are added via a separate line in which they are prepared and then mixed in cylindrical silos. The cream is kept warm before being purred into the jars, this warming session takes place through an electrical resistance placed in the silos. The calculation of powers and energies in in the process takes into account the hazelnut paste making, related to the percentage weight of paste in cream (14% of the weight of the finished product). Mixing and pumping the ingredients to the packaging station is also accounted for. This line is particularly energy-intensive with an electric power of about 56,000 W and an hourly productivity of 41.7 kg/h hence a specific energy consumption of 1270 Wh/kg.
Cutting. The cutter is used for peanut and paste making. The cutter is a large stainless steel heated blender that delivers a 120 kg/h product employing some 35,000 W electric power for an energy consumption of 294 Wh/kg, significantly less than the cream production line.
Tamari coating. The line consists of a screw conveyor and a dispensing pump. It uses approximately 3000 W power and consumes approximately 6 Wh/kg of electrical energy.
The relation between product category and different process in transformation phase is reported in
Supplementary Materials.
2.5. Packaging
Calculation was performed following the Compass™ Design methodology which fully explains procedure for calculation and also provides a relevant database. Reference and full details of the method can be found in [
17].
Emissions are assumed to be related to the following steps: (1) packing products and co-products; (2) recycling off-site and (3) material sent to landfill.
Lacking of more accurate information, the calculation followed a conservative approach and the amount of material recycled off site was considered to be nil, while 12% in weight was assumed as the quantity of materials recycled on site (based on an analysis of the internal procedures).
Data concerning emissions from transport of material to landfills was calculated considering: (1) the type of product, the quantity; (2) modes of transport according to the Ecoinvent™ 2009 database for Europe.
Finished products are put in bags or jars at the company premises. The calculation of emissions related to these mechanical operations was performed as described above for the transformations phases, hence an allocation for energy consumption was allocated per kg of product packed.
2.6. Identification of System Boundaries
Figure 1 shows the boundaries of the analysis between the primary product and the final product processed and delivered to final retail point. Anything that affects less than 3% to the final value was excluded from the calculation. For this reason, packing and transport of secondary raw material to the company was ignored. Internal transports within the company premises was also ignored. Year 2013 was chosen as the reference period as full information was available for calculation.
Figure 1.
Map of process.
Figure 1.
Map of process.
3. Results and Discussion
3.1. Carbon Dioxide Equivalent Emissions for Each Life Cycle Phase
Footprints due to the cultivation of almond, hazelnut and pistachio are respectively 2.30, 1.29 and 2.53 kg CO2eq/kg of fruit, from which we can respectively deduct 0.23, 0.40 and 0.53 kg CO2eq/kg of raw products due to the recovery of thermal energy from the shells and 0.14, 0.26 and 0.37 kg CO2eq/kg of fruit for temporary carbon dioxide sequestration by the plants during their life.
Thus, net emissions per kg of raw product considered in this study are:
- ▪
Almond: 1.92 kg CO2eq/kg;
- ▪
Hazelnut: 0.52 kg CO2eq/kg;
- ▪
Pistachio: 1.74 kg CO2eq/kg.
Emissions caused by peanuts are assumed equal to 0.621 kg CO
2eq/kg of raw material.
Table 6 shows, for each of the raw materials, the geographic origin and the relative emissions related to transport.
The value is calculated as the weighted average between the transportation of fruits in shell and the ones not in shell.
Table 7 shows the CFP expressed in kg CO
2eq per kg of finished product, aggregated by product category, for raw material, secondary raw material, transportation, packaging and outbound transport. The CFP of “reference” is also reported to indicate the total CFP of the single bag or jar of product. Incidence in terms of percentage over total value are also shown on
Table 8.
Table 7.
Calculation of emission for transportation of primary ingredients.
Table 7.
Calculation of emission for transportation of primary ingredients.
| Primary Ingredients | Total Weight (kg) | Country of Origin | Type of Transport | Primary Energy (MJ) | Emissions (t CO2 eq) | Emissions (kg CO2eq/kg) | Average Emission Type of Raw Material (kg CO2eq/kg) |
|---|
| Almond in shell | 11.830 | Italy | truck | 5.892 | 0.42 | 0.036 | 0.04 |
| almond | 2483.969 | Italy | truck | 1219.644 | 88 | 0.035 | - |
| Chestnut in shell | 76.257 | Italy | truck | 37.414 | 2.70 | 0.035 | 0.04 |
| chestnut | 361.091 | Italy | truck | 177.251 | 13 | 0.036 | - |
| Pistacho in shell | 2.380 | Italy | truck | 1.178 | 0.08 | 0.034 | 0.03 |
| pistacho | 10.517 | Italy | truck | 5.165 | 0.37 | 0.035 | - |
| Peanut | 45.292 | Argentina | ship | 53.200 | 4.09 | 0.090 | 0.09 |
Table 8.
CPF aggregated by product category.
Table 8.
CPF aggregated by product category.
| Product | | CFP |
|---|
| Bag/Jar Volume (g) | CFP Reference (kg CO2eq) | Total CFP (kg CO2eq/kg) | Raw Material (kg CO2eq/kg) | Sec. Raw Material (kg CO2eq/kg) | Inb. Transport (kg CO2eq/kg) | Processing (kg CO2eq/kg) | Packaging (kg CO2eq/kg) | Out Transport (kg CO2eq/kg) |
|---|
| Hazelnut in bag | 100–125 | 0.14 | 1.20 | 0.52 | - | 0.03 | 0.09 | 0.36 | 0.20 |
| Peanut in bag | 125 | 0.17 | 1.35 | 0.62 | - | 0.09 | 0.11 | 0.33 | 0.20 |
| Hazelnut paste US market | 454 | 0.72 | 1.59 | 0.52 | - | 0.04 | 0.19 | 0.78 | 0.07 |
| Peanut paste US market | 454 | 0.79 | 1.75 | 0.62 | - | 0.09 | 0.19 | 0.78 | 0.07 |
| Hazelnut paste EU market | 200–400 | 0.50 | 1.78 | 0.52 | - | 0.04 | 0.19 | 0.83 | 0.20 |
| Peanut paste EU market | 200–400 | 0.58 | 1.93 | 0.62 | - | 0.09 | 0.19 | 0.82 | 0.20 |
| Pistacho in bag | 100–125 | 0.27 | 2.33 | 1.74 | - | 0.04 | 0.06 | 0.30 | 0.20 |
| Almond in bag | 100–125 | 0.32 | 2.61 | 1.93 | 0.02 | 0.03 | 0.10 | 0.34 | 0.20 |
| Hazelnut spread cream in jar US | 454 | 1.19 | 2.61 | 0.07 | 1.06 | 0.04 | 0.60 | 0.78 | 0.07 |
| Hazelnut spread cream in jar EU | 200–400 | 0.83 | 2.81 | 0.07 | 1.07 | 0.04 | 0.60 | 0.82 | 0.20 |
| Almond paste US market | 454 | 1.31 | 2.89 | 1.93 | - | 0.04 | 0.09 | 0.78 | 0.07 |
| Almond paste EU market | 180–400 | 0.90 | 3.07 | 1.93 | - | 0.04 | 0.09 | 0.83 | 0.20 |
| Chocolate covered hazelnut | 100 | 0.34 | 3.43 | 0.52 | 1.89 | 0.04 | 0.16 | 0.61 | 0.20 |
| Chocolate covered almond | 100 | 0.48 | 4.80 | 1.93 | 2.23 | 0.04 | 0.11 | 0.29 | 0.20 |
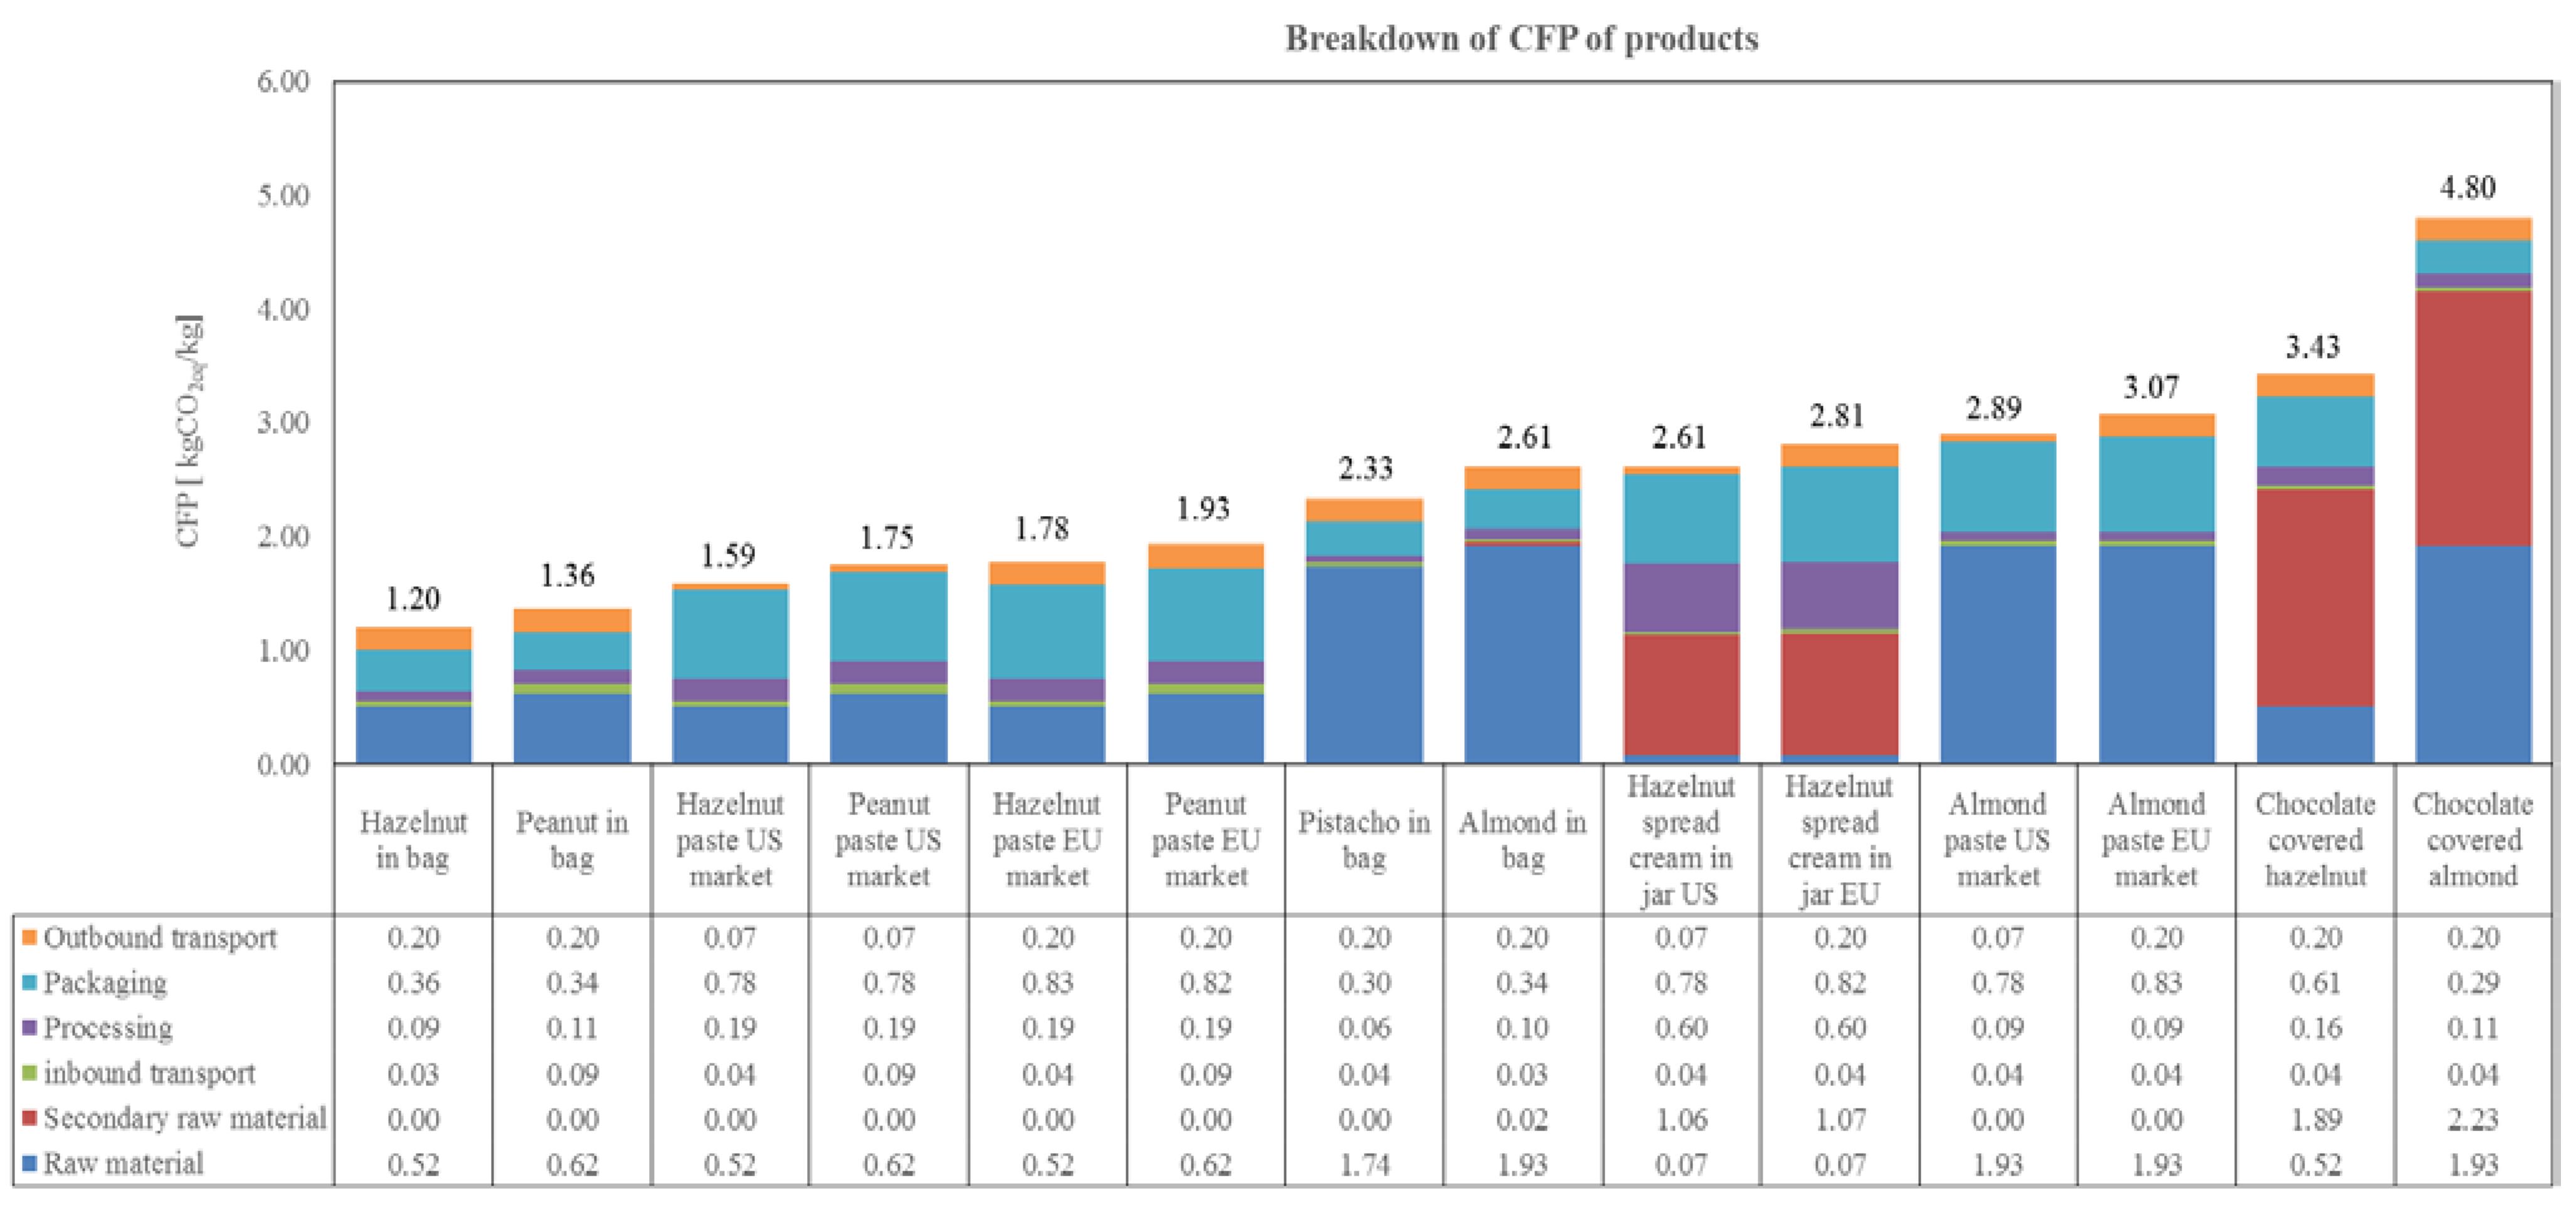
Among the different products analyzed, hazelnut shows the lowest emissions due to the high amount of recovered waste by weight. The coated fruit shows significantly higher emissions than the non-coated, this is due to the secondary raw material production that contributes to about 50% to the total product emission. The packaging emissions are considerably higher for jars than for bags, this is due to the assumption that the glass is not recycled at final destination.
Transformation shows relatively lower emissions, thus efforts to reduce environmental impact should be more efficiently focused on the supply of raw materials and packaging. Nonetheless, efforts related to reduction of GHG emissions related to transformation phase, may be possible with relatively small effort. This is particularly true for creams in jars for which significant efficiencies could be attained by a better heat exchanger at the ball mill.
A higher efficiency exchanger will allow a significant reduction in consumption of LPG. Similar consideration goes for the oven used to toast hazelnuts. At the present time, the oven is turned on and off daily and this causes an estimate 5% extra consumption of LPG due to transient heating times. The company does that for safety reasons (there is no night shift in place), though a more modern oven would allow for a more efficient procedure within health and safety constraints.
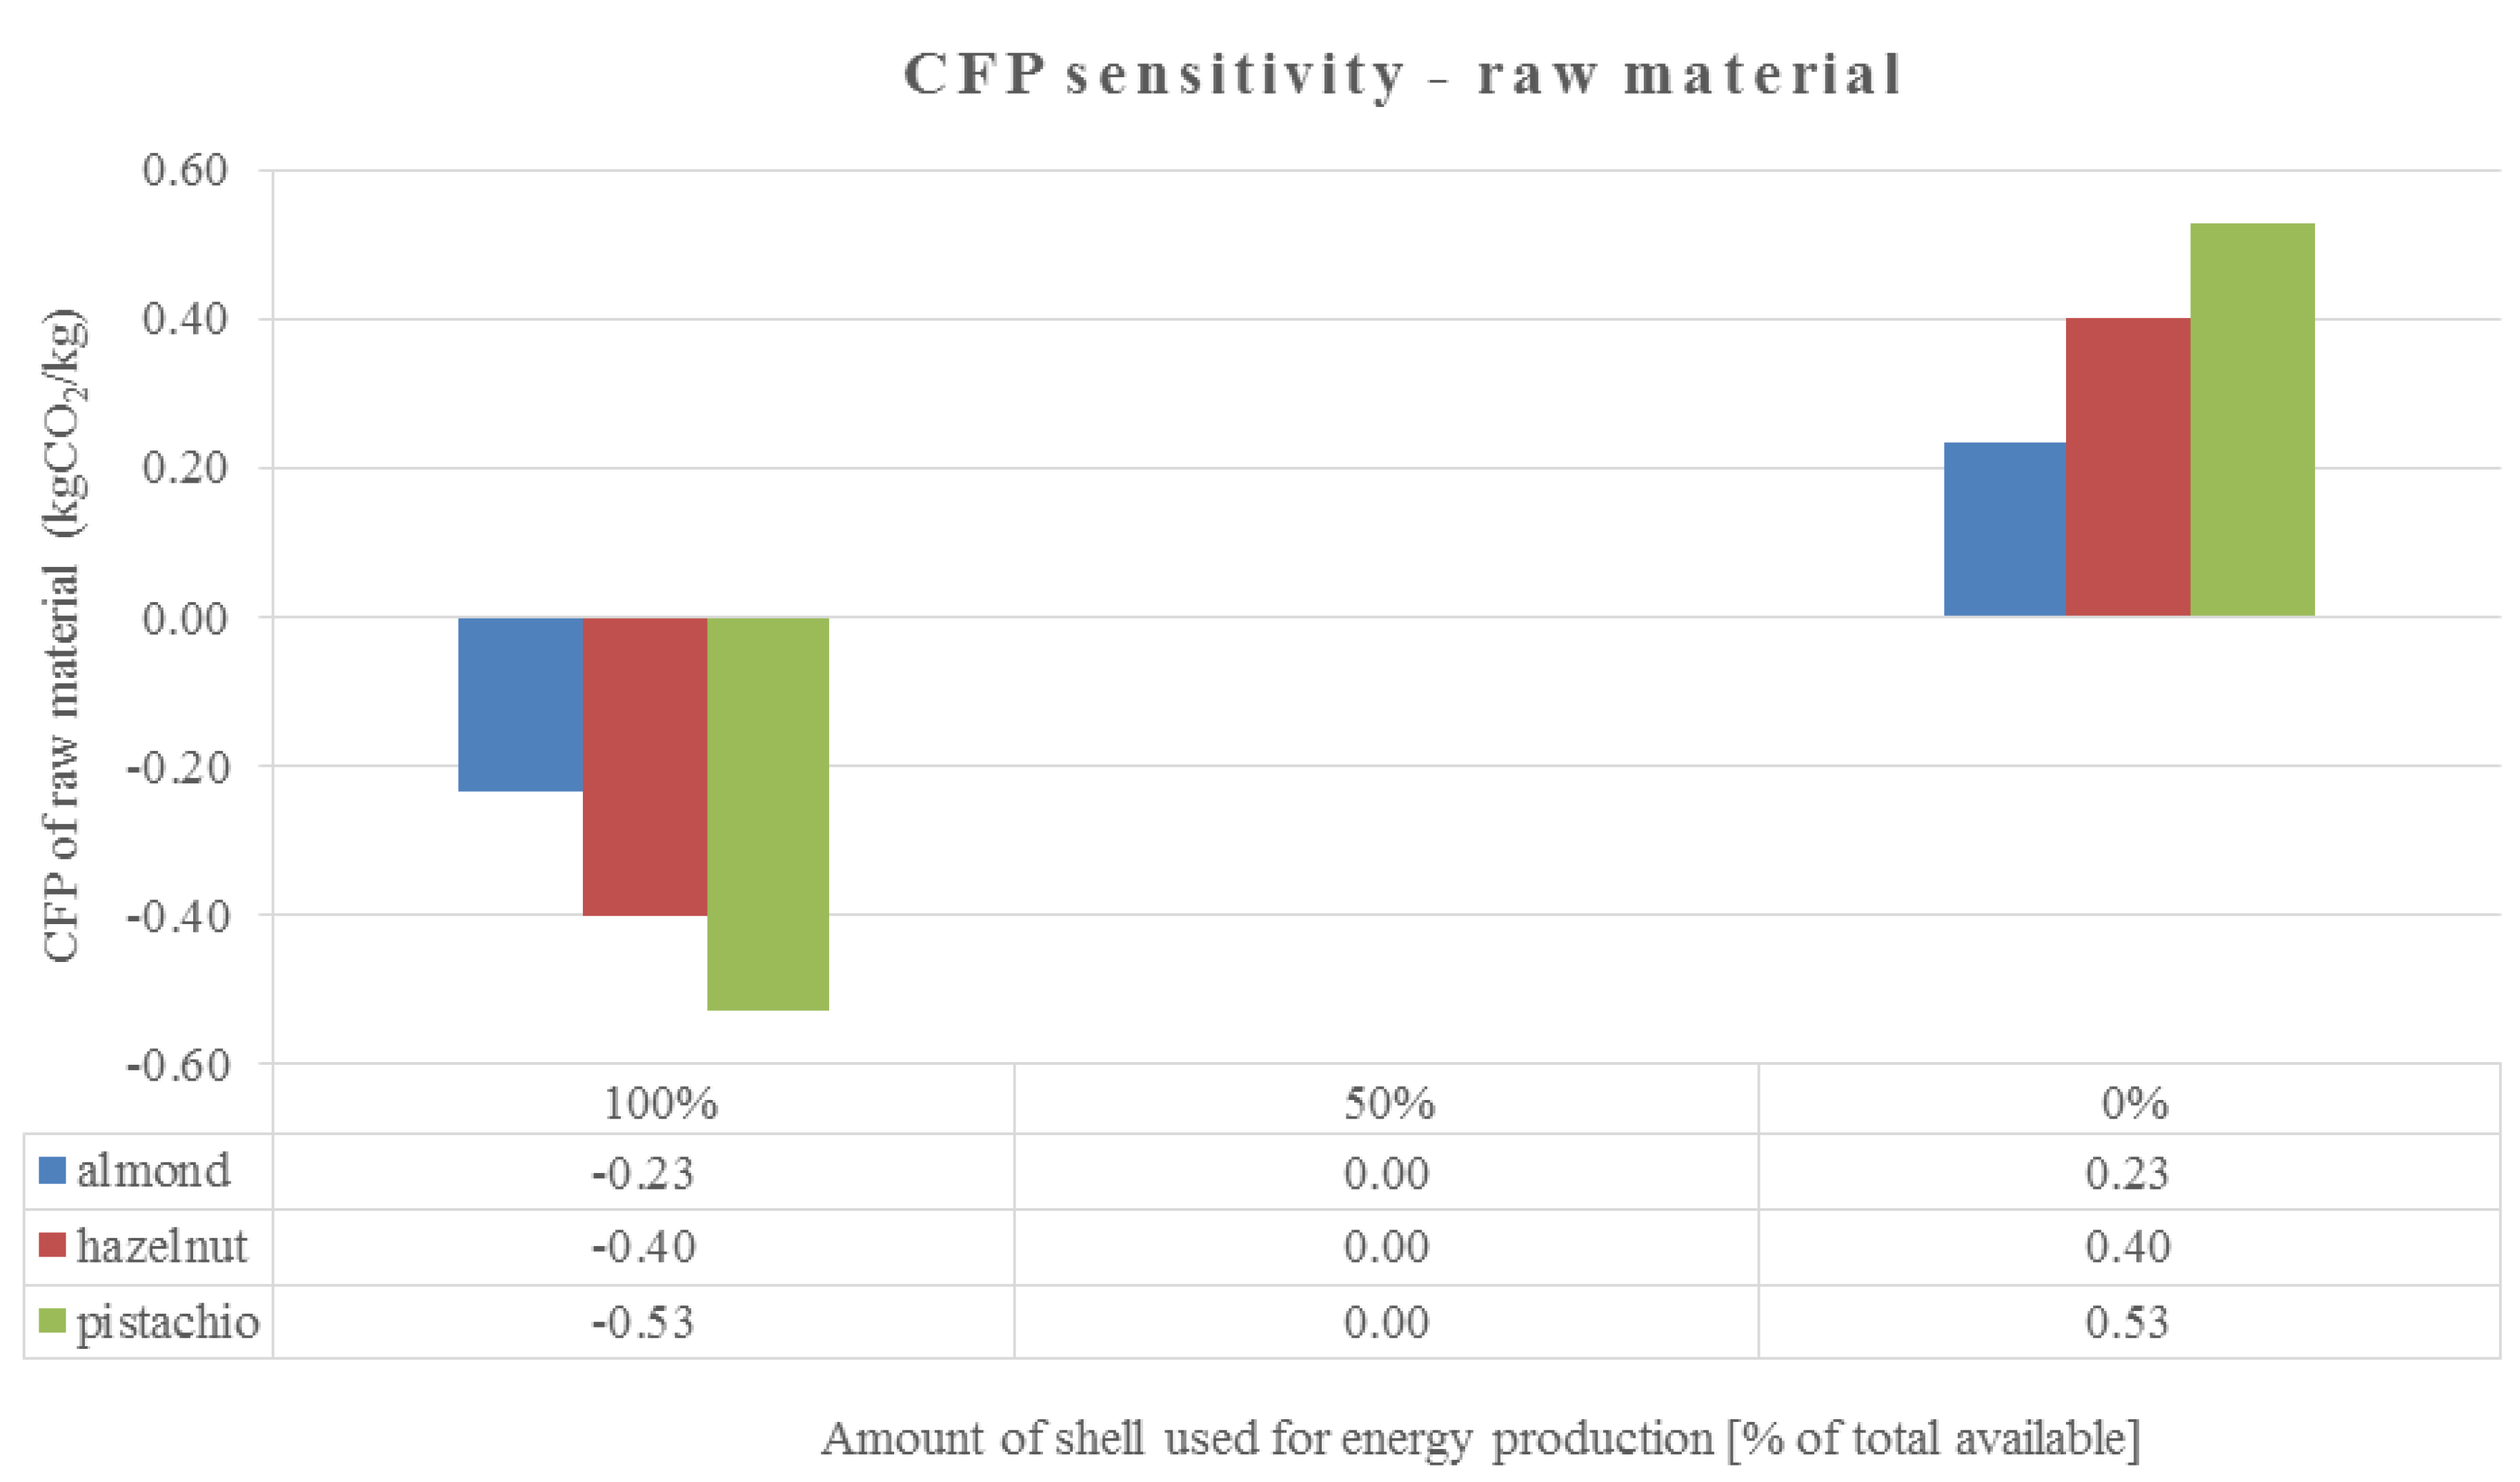
CFP of raw materials is significantly affected by the credit assumed for energy recovery, which could double in value if all shells were used for energy purposes.
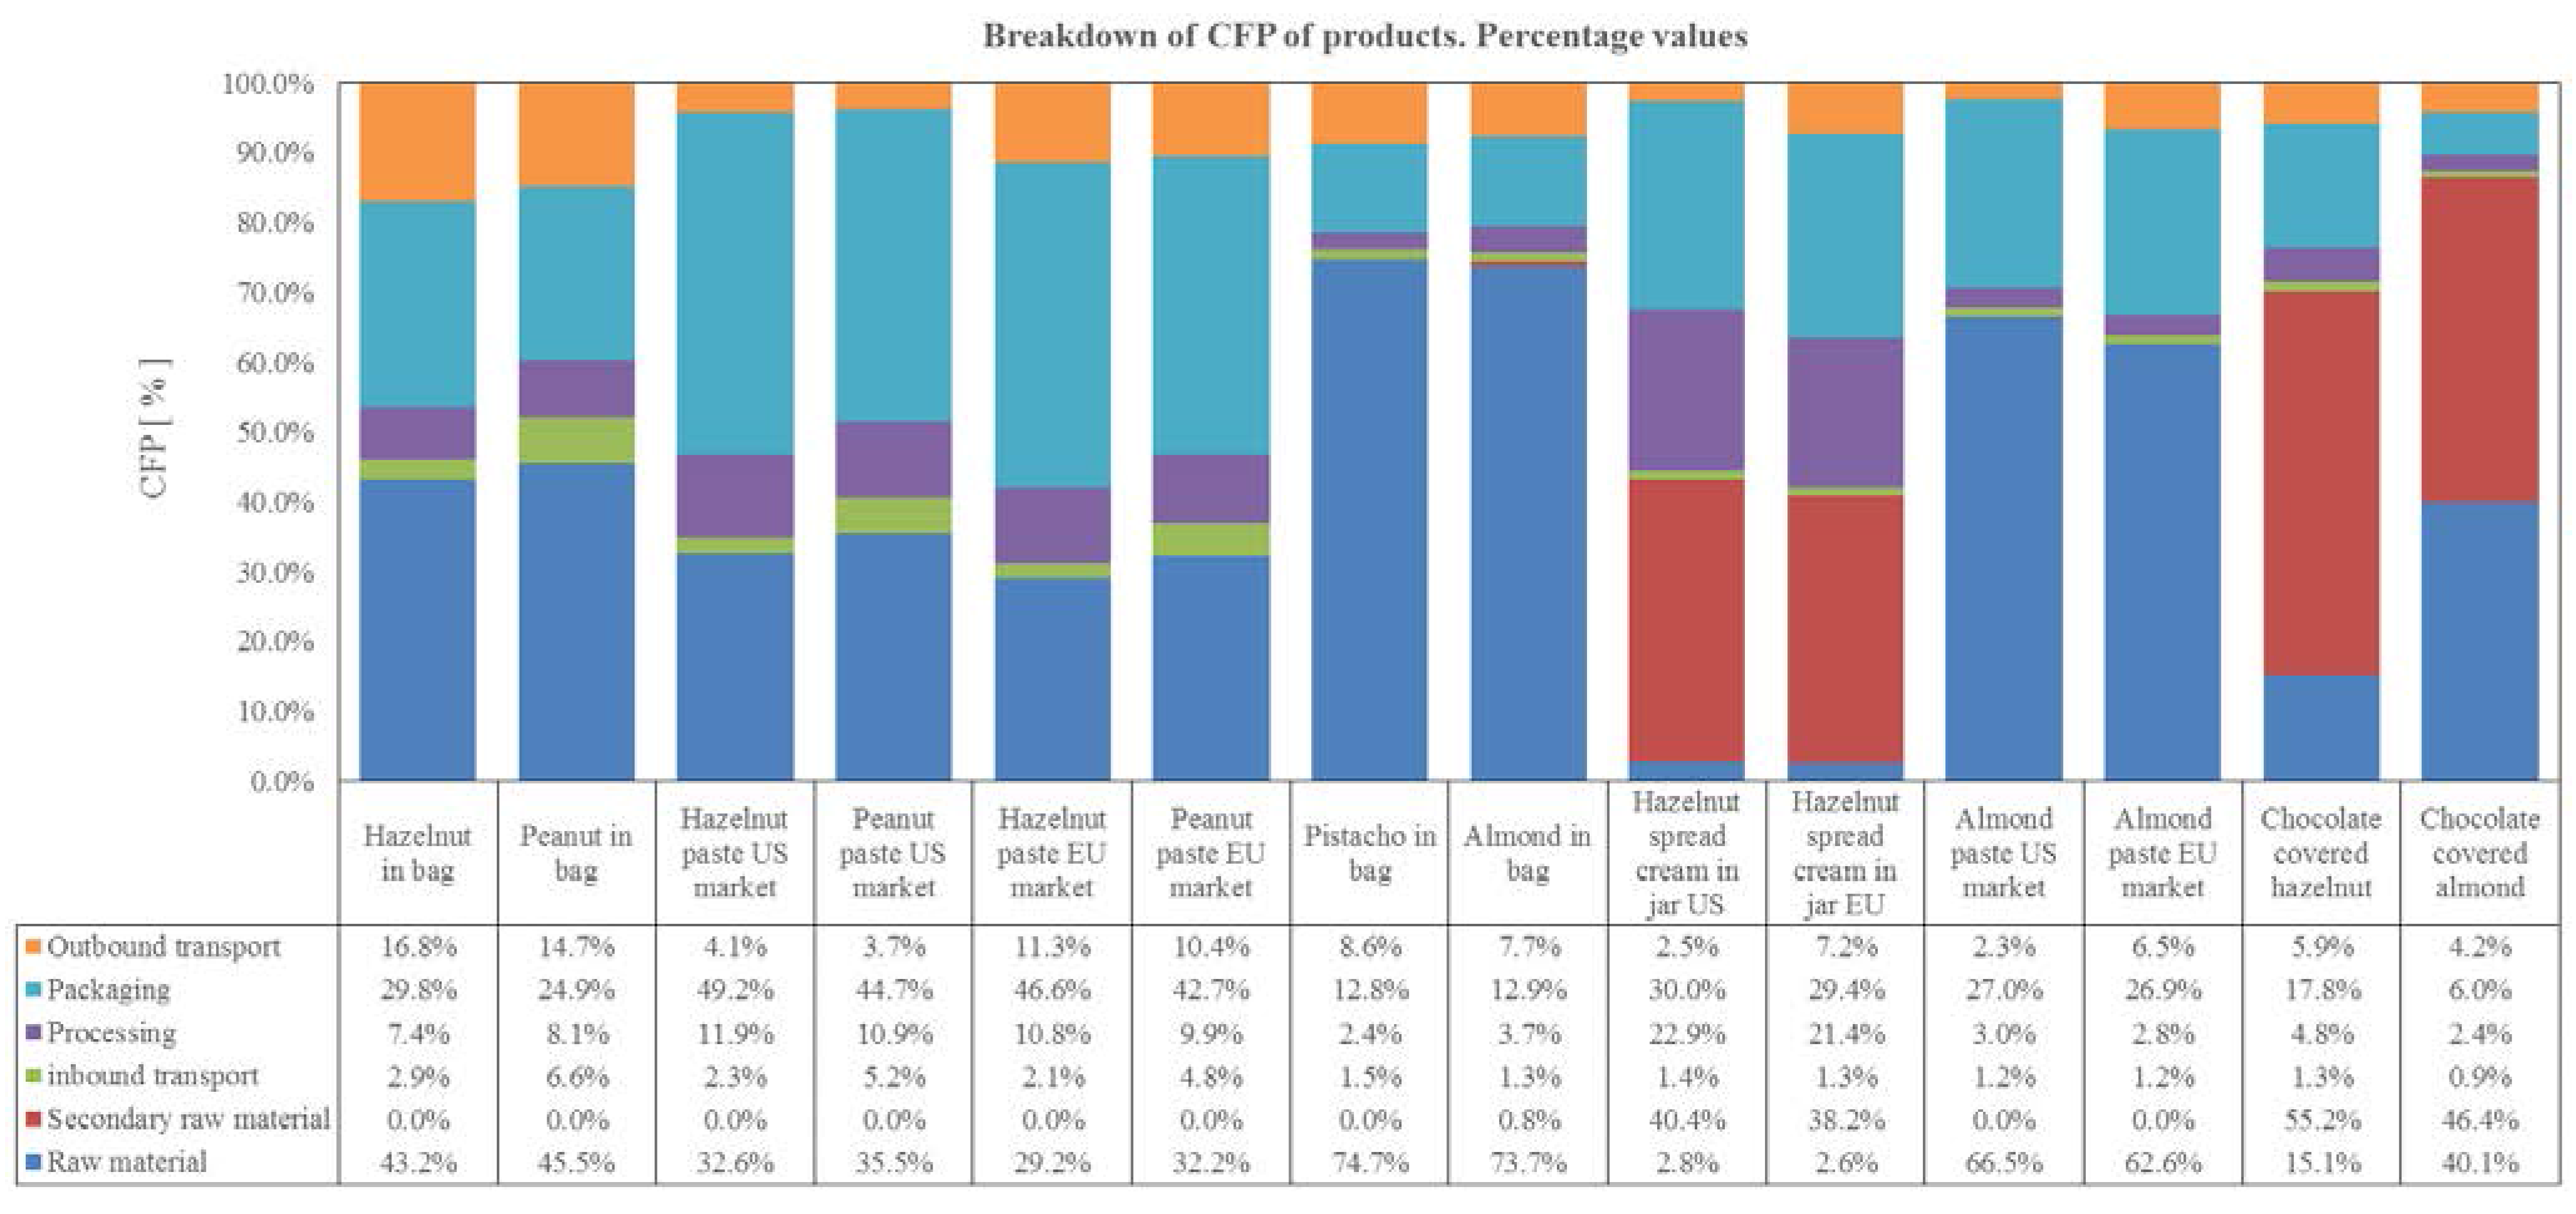
Figure 2 and
Figure 3 represent the absolute values and percentage contribution to total CFP per each of the product analyzed.
The graphs show the influence of raw material on the total emissions of pistachios and almonds. Those fruits are the ones that could benefit more from an increase of shell portion used for energy purposes. This is particularly true for chocolate covered almonds which show a CFP significantly higher than other products, since raw materials account for 40% of total value.
Figure 2.
Diagrams breakdown of CFP of products, absolute values.
Figure 2.
Diagrams breakdown of CFP of products, absolute values.
Figure 3.
Diagrams breakdown of CFP of products, percentage values.
Figure 3.
Diagrams breakdown of CFP of products, percentage values.
Should all the shells be recovered for energy purposes, the total CFP of product would be reduced by as much as 1 kg CO2eq/kg or 20% of total CFP. Similar considerations apply to hazelnut and peanut pastes, for which packaging is particularly heavy in terms of CFP, accounting for respectively 49.2% and 44.7% of total value, considerably higher compared to the raw material. For those products, efforts should be directed towards increasing the amount of glass recycled or reused at end of life. Using a jar which could be used as a glass for instance after product is finished could potentially reduce the total product CFP to very values as low as 1 kg CO2eq/kg.
Supplementary Material is provided to show the sources and sinks of GHG emissions per each of the phases and each of the product categories.
3.2. Uncertainty and Sensitivity Analysis
The main uncertainty in data is related to CFP of raw materials and to final destination of glass for what concerns jars.
Data on raw material is affected by the unknown credit related to the exact amount of shells (as well as tree trimmings and prunings) destined to energy production. In recent works, the authors highlighted the potential energy recovery from trimmings and prunings [
26,
27,
28,
29].
A sensitivity analysis was conducted mainly with regards to raw materials and the number of shells that can finally be destined to energy production. This is in fact the figure on which the company has the highest potential influence, in fact suppliers of almonds, hazelnuts and pistachios are largely small producers who have the company as the main client.
Data on packaging is affected by the unknown final destination of glass that jars are made of. On this issue the company has relatively little influence since final products are destined to consumer markets abroad and little control there could be on the destination of glass jars.
Figure 4 shows calculation of CFP related to raw materials in absolute values, assuming null to 100% the relative credit to the use of shells for the production of energy.
Figure 4.
CFP sensitivity raw material.
Figure 4.
CFP sensitivity raw material.
Table 9 shows the sensitivity in absolute values and percentages of them over total value for the product.
Hazelnut shows the greatest sensitivity, almond the lowest. This suggests that in order to reduce GHG, the most effective initiatives are those focused first on the hazelnut rather than almond or pistachio.
Table 9.
Percentage Sensitivity compared to the total value.
Table 9.
Percentage Sensitivity compared to the total value.
| Product | Volume of Bag/Jar (g) | Total CFP (kgCO2eq/kg) | Sensitivity (kgCO2eq/kg) | Incidence of Sensitivity (%) |
|---|
| hazelnut in bag | 100–125 | 1.20 | 0.40 | 33.33% |
| hazelnut paste US | 454 | 1.59 | 0.40 | 25.16% |
| hazelnut paste EU | 200–400 | 1.78 | 0.40 | 22.47% |
| pistachio in bag | 100–125 | 2.33 | 0.53 | 22.75% |
| almond in bag | 100–125 | 2.61 | 0.23 | 8.81% |
| hazelnut spreadable cream US | 454 | 2.61 | 0.40 | 15.33% |
| hazelnut spreadable cream EU | 200–400 | 2.81 | 0.40 | 14.23% |
| almond paste US | 454 | 2.89 | 0.23 | 7.96% |
| almond paste EU | 180–400 | 3.07 | 0.23 | 7.49% |
| chocolate coatted hazelnut | 100 | 3.43 | 0.40 | 11.66% |
| chocolate covered almond | 100 | 4.80 | 0.23 | 4.79% |
The uncertainty in the calculated value for the transformation phase is significantly lower than that of the raw material; moreover, lower sensitivity is also due to the significantly less influence of transformation emissions over total CFP.


