Article

The Response of Grain Potential Productivity to Land Use Change: A Case Study in Western Jilin, China

1
College of Earth Science, Jilin University, Changchun 130012, China
2
Northeast Institute of Geography and Agroecology, Chinese Academy of Sciences, Changchun 130102, China
3
State Key Laboratory of Resources and Environmental Information System, Institute of Geographic Sciences and Natural Resources Research, Chinese Academy of Sciences, Beijing 100101, China
*
Author to whom correspondence should be addressed.
Sustainability 2015, 7(11), 14729-14744; https://doi.org/10.3390/su71114729
Submission received: 8 August 2015 / Revised: 22 October 2015 / Accepted: 26 October 2015 / Published: 4 November 2015
(This article belongs to the Section Environmental Sustainability and Applications)

Abstract

:
The impact of land use change on grain potential productivity is one of the most important topics in the research of land use/cover change and its effects. Western Jilin, located on the edge of an ecotone in northern China, and its land use have changed dramatically in recent decades, with significant impact on grain potential productivity. This study evaluated the grain potential productivity in different conditions and analyzed the response to land use change based on land use data, meteorological data and statistical data by using the Global Agro-ecological Zone model. Results showed that (1) grain potential productivity of Western Jilin in 2010 was 19.12 million tons, an increase of 34.8% over 1975 because of changes in land use and in climate; (2) due to land use change, grain potential productivity in the study area increased between 1975 and 2000, however, it decreased between 2000 and 2010; (3) conversion in type of land use and an increase in irrigation percentage caused grain potential productivity to increase by 0.70 million tons and 3.13 million tons respectively between 1975 and 2000; between 2000 and 2010, grain potential productivity had an increase of 0.17 million tons due to the increase in farmland area, but it decreased by 1.88 million tons because the irrigation percentage declined from 36.6% to 24.7%. Therefore, increasing investment in agriculture, improving land quality and increasing the conversion rate of grain potential productivity to actual production would be a better choice for ensuring national food security and achieving sustainable land use.

1. Introduction

Food is a specialized commodity and an important strategic reserve relating directly to a country’s well-being [1,2]. Food security is an important part of national security. Land resources are the basic physical conditions for the agricultural industry. Land use changes directly impact grain production, thus affecting the food supply [3]. How ecosystem services are influenced by changes in the coupled human-environment system at different scales and background has becoming an important topic of global change research. Within the past two decades, the Land-Use and Land-Cover Change (LUCC) and the Global Land Project (GLP) have promoted the research on eco-environment effects of land use changes [4,5,6,7,8,9]. Thus, the impact of land use change on grain potential productivity (GrPP) is an important component of research on land use/cover change and its effect. The response of grain potential productivity to land use change is an important foundation for regional land use and ecological environment construction, relating to the socio-economic development of a region. As an important indicator, the change in grain potential productivity is the core of agricultural and human development issues that receive much attention internationally [10,11].
Currently, widely used grain potential productivity estimation models can be grouped into three categories (i) the potential productivity attenuation model which estimates the meteorological suitability of certain crops based on climatic conditions and then calculates the grain potential productivity using a stepwise limiting method; (ii) the climate factors integration model, i.e., empirical model, which calculates grain potential productivity by using empirical formulas, for example, the Wageningen model [12]; (iii) crop growth simulation model, this method is based on crop photosynthesis process, physiological and ecological characteristics and environmental factors to calculate grain potential productivity, such as the CERES model [13,14], the EPIC model [15,16] and the CROPGRO model [17,18]. The GAEZ model is a large-scale model developed by the Food and Agriculture Organization of the United Nations (FAO) and the International Institute for Applied Systems Analysis (IIASA) over the past 30 years and integrates the potential productivity attenuation model and the climate factors integration model [19,20,21]. The AEZ methodology follows an environmental approach [22,23] and provides a standardized framework in which the trade-offs and synergies of alternative uses of agro-resources (land, water, technology) can be analyzed for producing food and energy [24,25]. It can also yield knowledge about current and future grain potential productivity of land [25], while preserving environmental quality [21,26]. The GAEZ comprehensively considers the radiation, temperature and other climatic factors that affect the crop growth, such as the length of the growing season, the water needs in different growth stages, etc., according to the characteristics of the crop [21]. The results could reflect the region’s annual average grain potential productivity [27]. In recent years, it has become easier to calculate the GAEZ, so it has been widely used throughout the world, especially in developing countries [28]. For example, Liu et al. (2015) calculated the grain potential productivity of China in 1990 and 2010 by using GAEZ and found that the net decrease of grain potential productivity was 2.97 million tons, accounting for 0.29% of the total yield in China in 2010 [2].
Since the reform and opening up, rapid growth of China’s national economy and population has resulted in important changes of land use. Western Jilin, located on the edge of a farming-pastoral zone in Northern China, is one of three saline-alkali landscapes in the world with soil that severely restricts its use for farming. Thus, its land use change would directly have a significant impact on grain potential productivity. Therefore, this research focused on Western Jilin as a case study for analyzing the response of the grain potential productivity for land use change. This study estimated the grain potential productivity in Western Jilin in 1975, 2000 and 2010 according to land use data, meteorological data from 1975 to 2010, soil data and Digital Elevation Model (DEM) data and by using the GAEZ model, in which solar radiation, temperature, water, soil and topography were taken into account.

2. Material and Methods
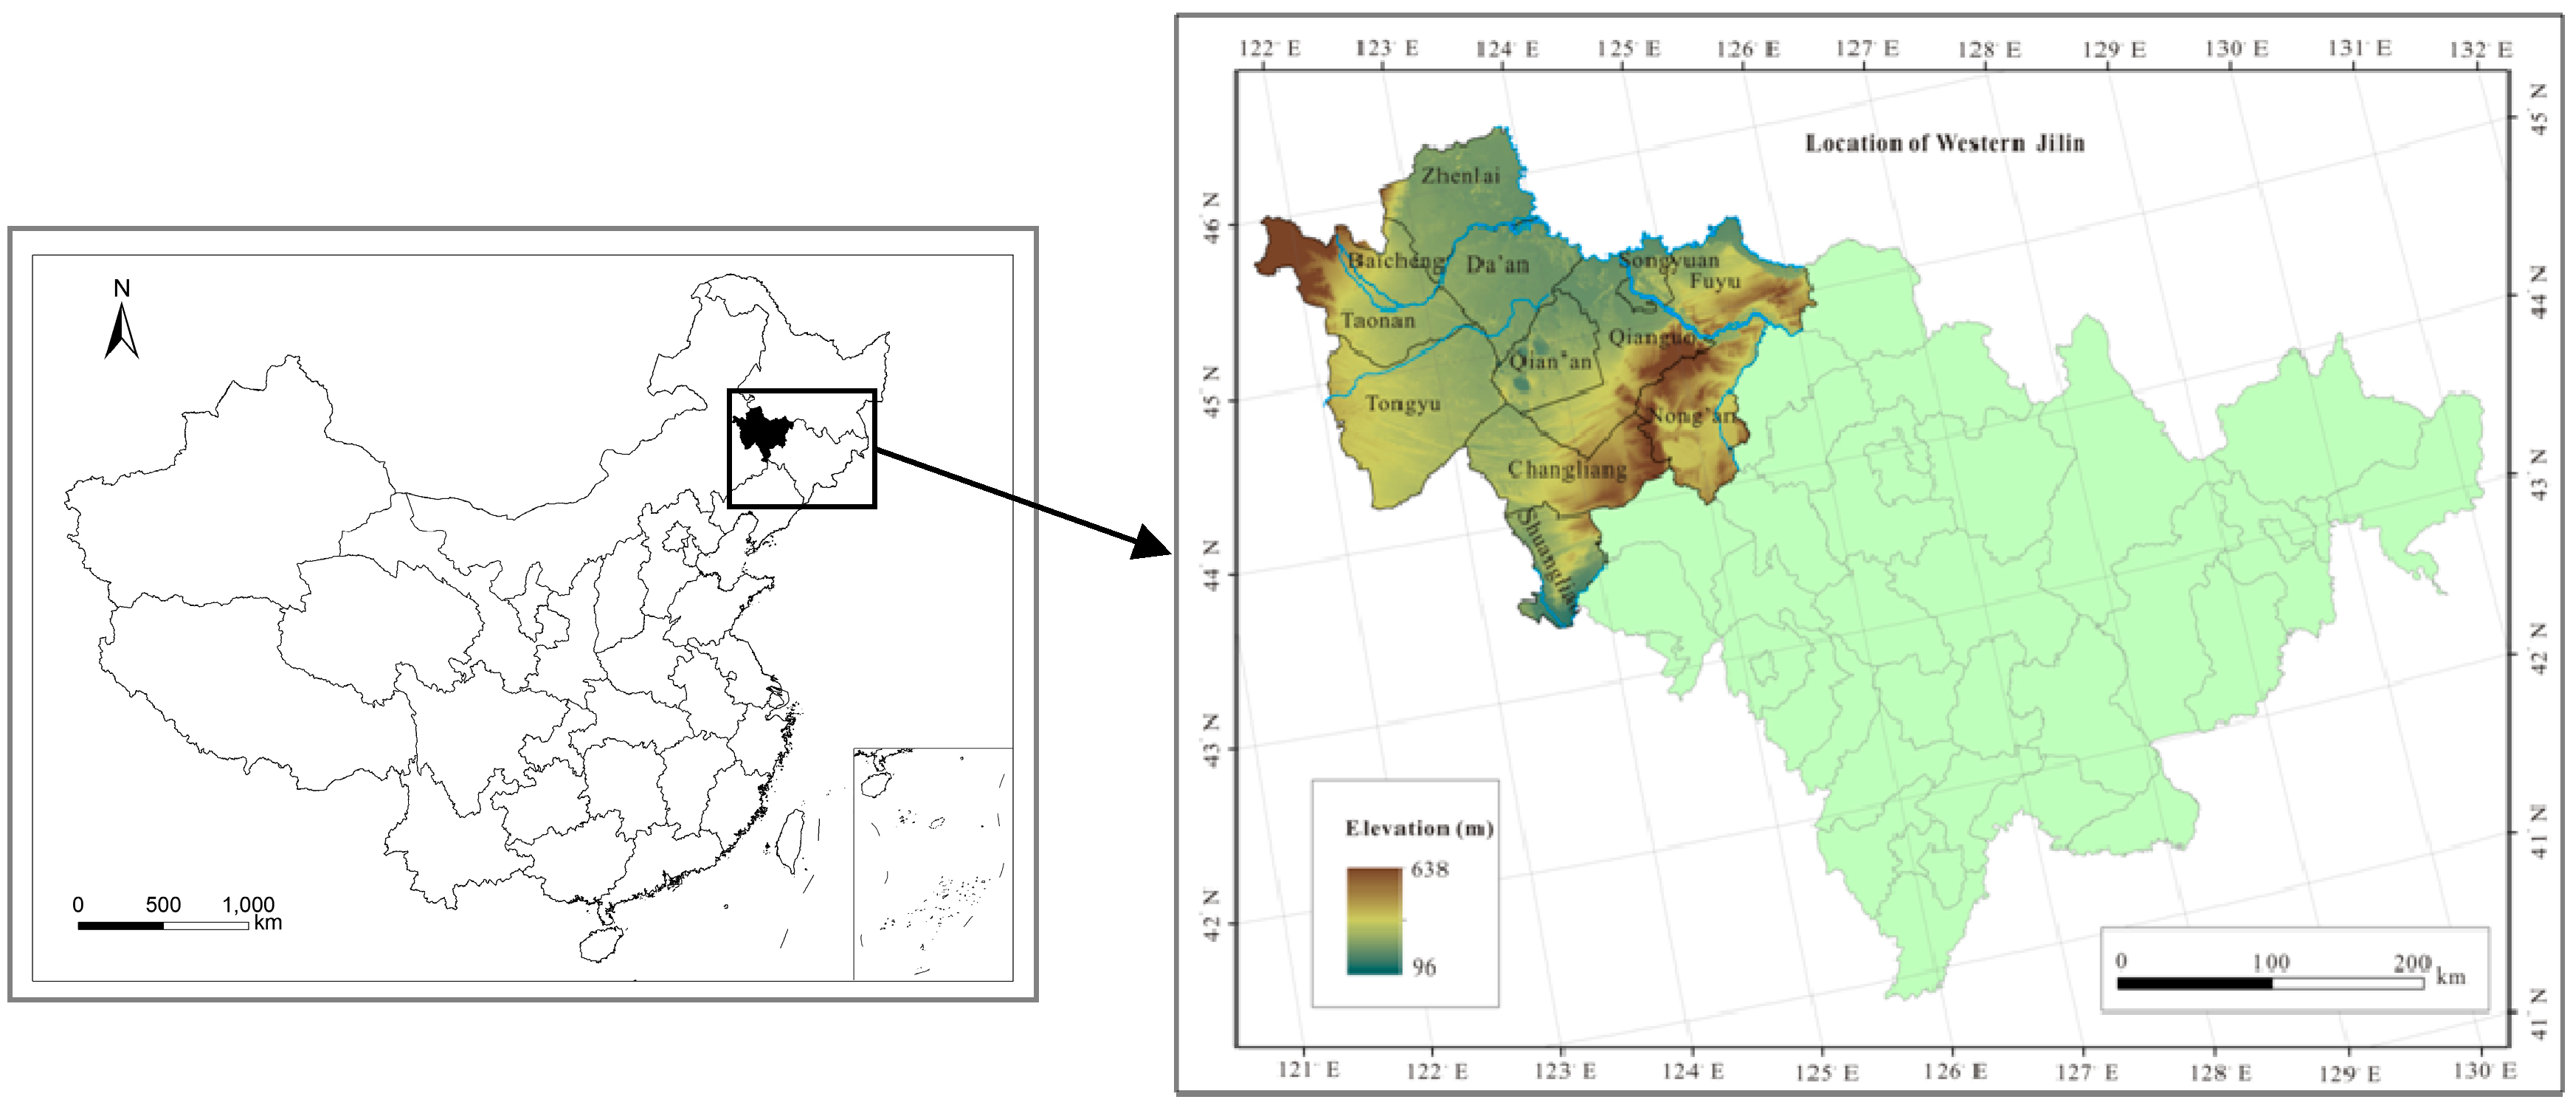
2.1. Study Area

Western Jilin is located at 43°22′ N–46°18′ N, 121°36′ E–126°12′ E and includes 12 counties (or cities) which are called Baicheng, Songyuan, Taonan, Da’an, Zhenlai, Tongyu, Qian’an, Fuyu, Qianguo, Changling, Nong’an and Shuangliao. The total area is 5.5 million ha (Figure 1). Western Jilin is the transitional region from black soil in temperate sub-humid areas to chestnut soil in a temperate sub-arid steppe and typical farming-pastoral ecotone. Annual precipitation is 370–410 mm, far less than the annual evaporation (1500–1900 mm) ≥10 °C annual accumulated temperature is 2900–3200 °C and moisture coefficient is 0.5. One hundred years ago, the wide range of alluvial plain in Western Jilin was one of the famous pastures in China. However, it now is mainly occupied by cultivated land.
Figure 1. Location of Western Jilin province, China.
Sustainability 07 14729 g001

2.2. Data Source

The data used in this research included land use data, meteorological data, terrain elevation data, soil data and statistical data.
The data sources of land use that used in this article included remote sensing, terrain, socio-economic statistical and survey data as well as various thematic maps. We divided land use into eight categories: farmland, woodland, grassland, water body, build-up land, alkali-land, marsh and unused land.
In consideration of their fidelity and free access, we used high-resolution raster DEM from the shuttle radar topography mission (SRTM) C-band data were used to derive the terrain elevation data set [29].
Meteorological data for 1975–2010 included monthly mean minimum temperature, monthly mean maximum temperature, monthly cumulative precipitation, monthly cumulative radiation, monthly mean relative humidity, monthly mean wind speed and monthly wet day frequency. The data were obtained from 19 national meteorological stations maintained by the Chinese Meteorological Administration. The monthly data for the above seven key plant growth factors were interpolated to raster surfaces with a 1000 m resolution by using ANUSPLIN software based on the DEM of Western Jilin [30,31,32].
Soil data were obtained from a nationwide soil database at a scale of 1:1,000,000 which was provided by the Data Center for Resources and Environmental Sciences at the Chinese Academy of Sciences. The attributes included type, constituents, depth, and water-holding capacity.
Statistical data (such as grain yields and irrigated area of each county) mainly consist of official statistics from Jilin Bureau of Statistics.

2.3. Methodology

2.3.1. Grain Potential Productivity Estimation Method

The Global Agro-Ecological Zone model was used to estimate the grain potential productivity in this study. This model is a large-scale land productivity model that was developed jointly by the Food and Agriculture Organization of the United Nations (FAO) and International Institute for Applied Systems Research Institute (IIASA) [19]. The GAEZ model estimated the climatic suitability of a certain crop according to climatic conditions. Then it was used to calculate the grain potential productivity by using a stepwise limiting method: photosynthetic potential productivity (only limited by light), light-temperature potential productivity (limited by light and temperature), climatic potential productivity (limited by light, temperature and water), land potential productivity (limited by light, temperature, water and soil) and agricultural potential productivity (limited by agricultural input level and management methods) [19,20,21,22,23,24,25,26].
The suitability of land for the cultivation of a given crop depends on crop requirements as compared to the prevailing agro-climatic and agro-edaphic conditions. GAEZ combines these two components by successively modifying grid-cell specific agro-climatic suitability according to edaphic suitability of location specific soil and terrain characteristics [25]. The structure allows a stepwise review of results. Calculation procedures for establishing crop suitability estimates include five main steps of data processing, namely:
(i)
Module I: Climate data analysis and compilation of general agro-climatic indicators
(ii)
Module II: Crop-specific agro-climatic assessment and water-limited biomass/yield calculation
(iii)
Module III: Yield-reduction due to agro-climatic constraints
(iv)
Module IV: Edaphic assessment and yield reduction due to soil and terrain limitations
(v)
Module V: Integration of results from Modules I–IV into crop-specific grid-cell databases.
Two main activities were involved in obtaining grid-cell level area, yield and production of prevailing main crops, namely:
(vi)
Module VI: Estimation of shares of rain-fed or irrigated cultivated land by 5’ grid cell, and estimation of area, yield and production of the main crops in the rain-fed and irrigated cultivated land shares.
In this study, the GAEZ model was used to calculate the grain potential productivity (for corn and rice) under the 1975–2010 annual average climates. Western Jilin has a cold and long winter, its planting system brings in one harvest a year. The corn and rice account for more than 90% of total grain production (The actual production and grain potential productivity referenced in this article are the total output of corn and rice).
The GAEZ model included irrigated and rain-fed scenarios. The equation used to calculate crop yields within each grid cell under the rain-fed and irrigated scenarios was:
G r P P t = G r P P r × ( 1 i ) + G r P P i × i
where GrPPt represented the grain potential productivity within each grid cell (kg/ha); GrPPr and GrPPi respectively were the grain potential productivity under the rain-fed scenario and the irrigated scenario within each grid cell (kg/ha); and i (%) was the irrigation percentage [33].

2.3.2. Land Use Change Impact Analysis on Grain Potential Productivity

Grain potential productivity is affected by land use change and climatic change. Land use change included land use conversions and changes in irrigation percentage in this article. For analyzing the response of grain potential productivity to land use change, climatic conditions in 2000 and 2010 were assumed to be the same as in 1975, and the grain potential productivity with different land use conditions was calculated. Thus, changes in grain potential productivity between 1975, 2000 and 2010 caused by land use changes were compared with grain potential productivity in 1975, 2000 and 2010 in hypothetical conditions.

3. Results and Analysis

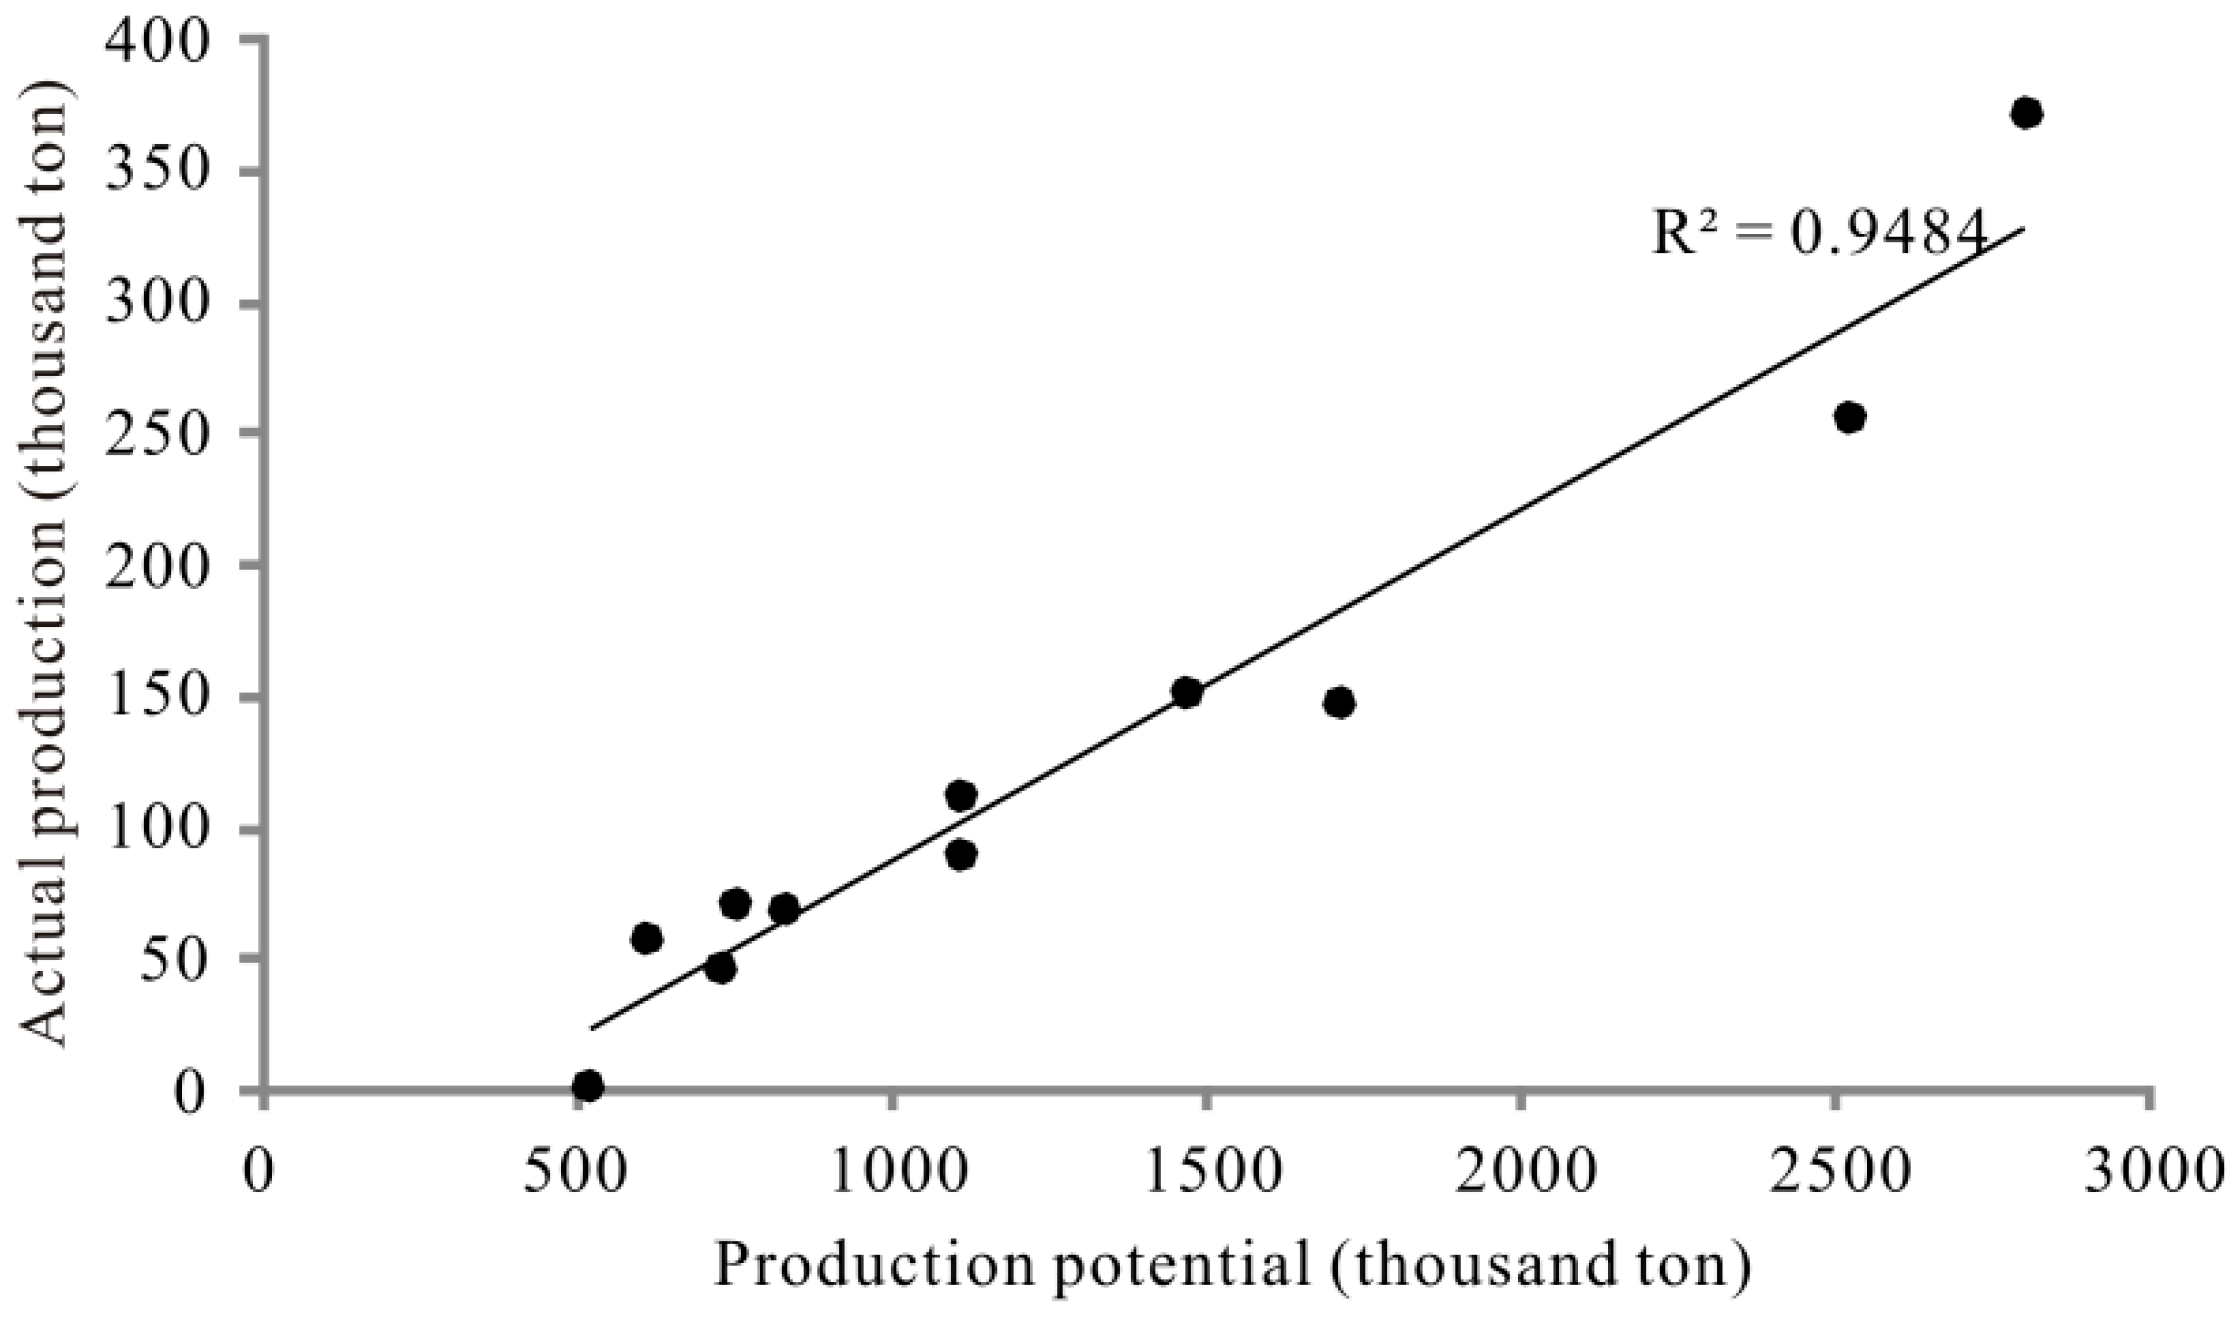
3.1. Results Validation

In order to verify the simulation results of grain potential productivity of Western Jilin, the grain potential productivity in 1975 was estimated by using monthly climate and land use data. The results showed that the total grain potential productivity in 1975 was 14.18 million tons, 10.3 times of the actual production. The total grain potential productivity and actual production of each county were compared in Figure 2. As shown, there was a strong correlation between grain potential productivity and actual production.
Figure 2. Comparison between grain potential productivity and actual production of each county in Western Jilin in 1975.
Sustainability 07 14729 g002

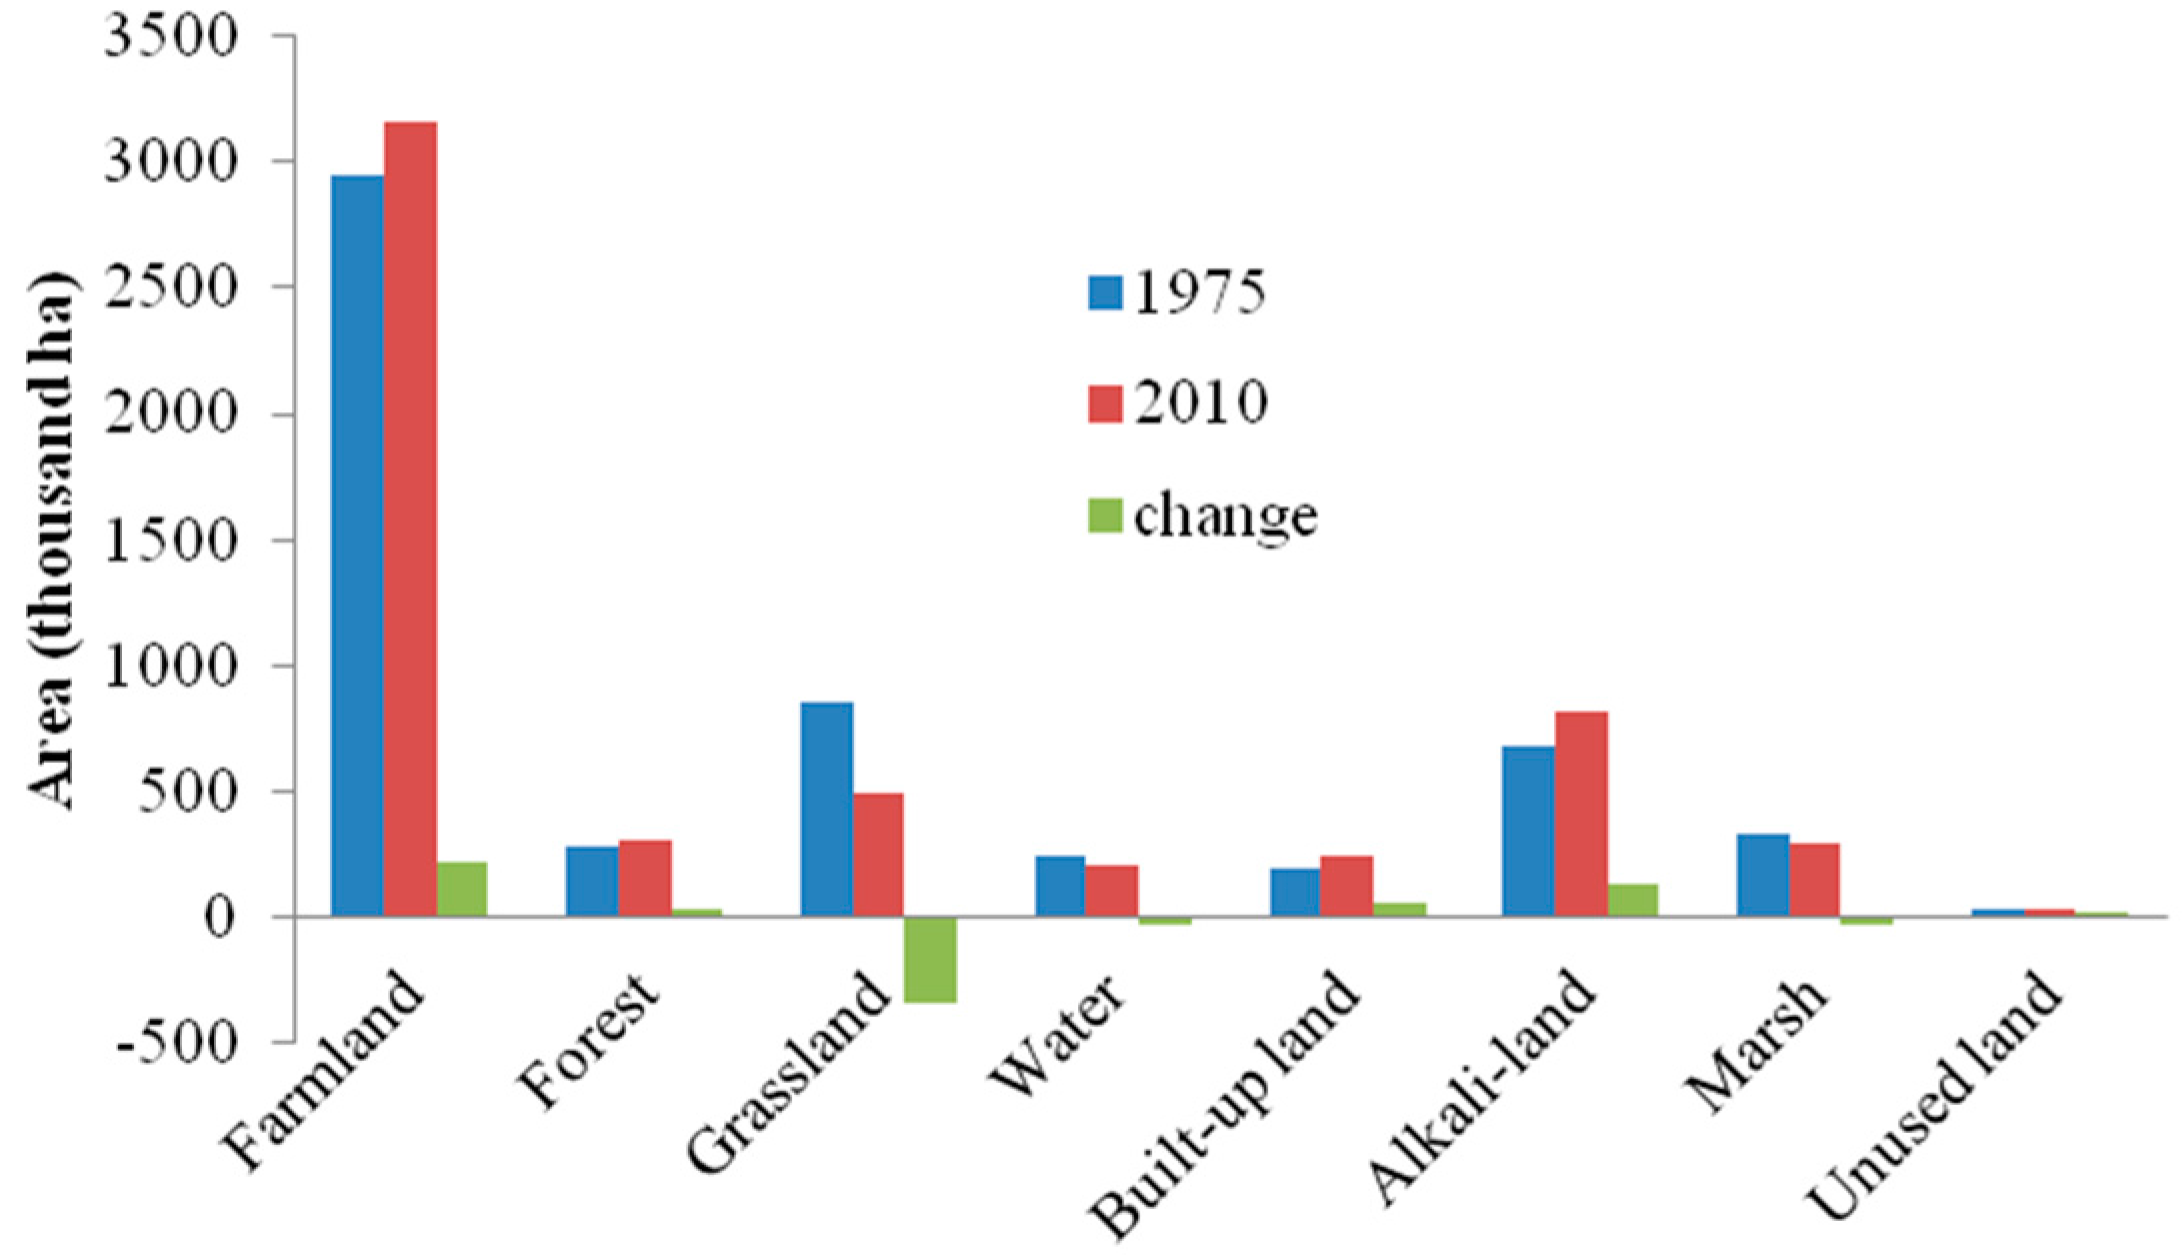
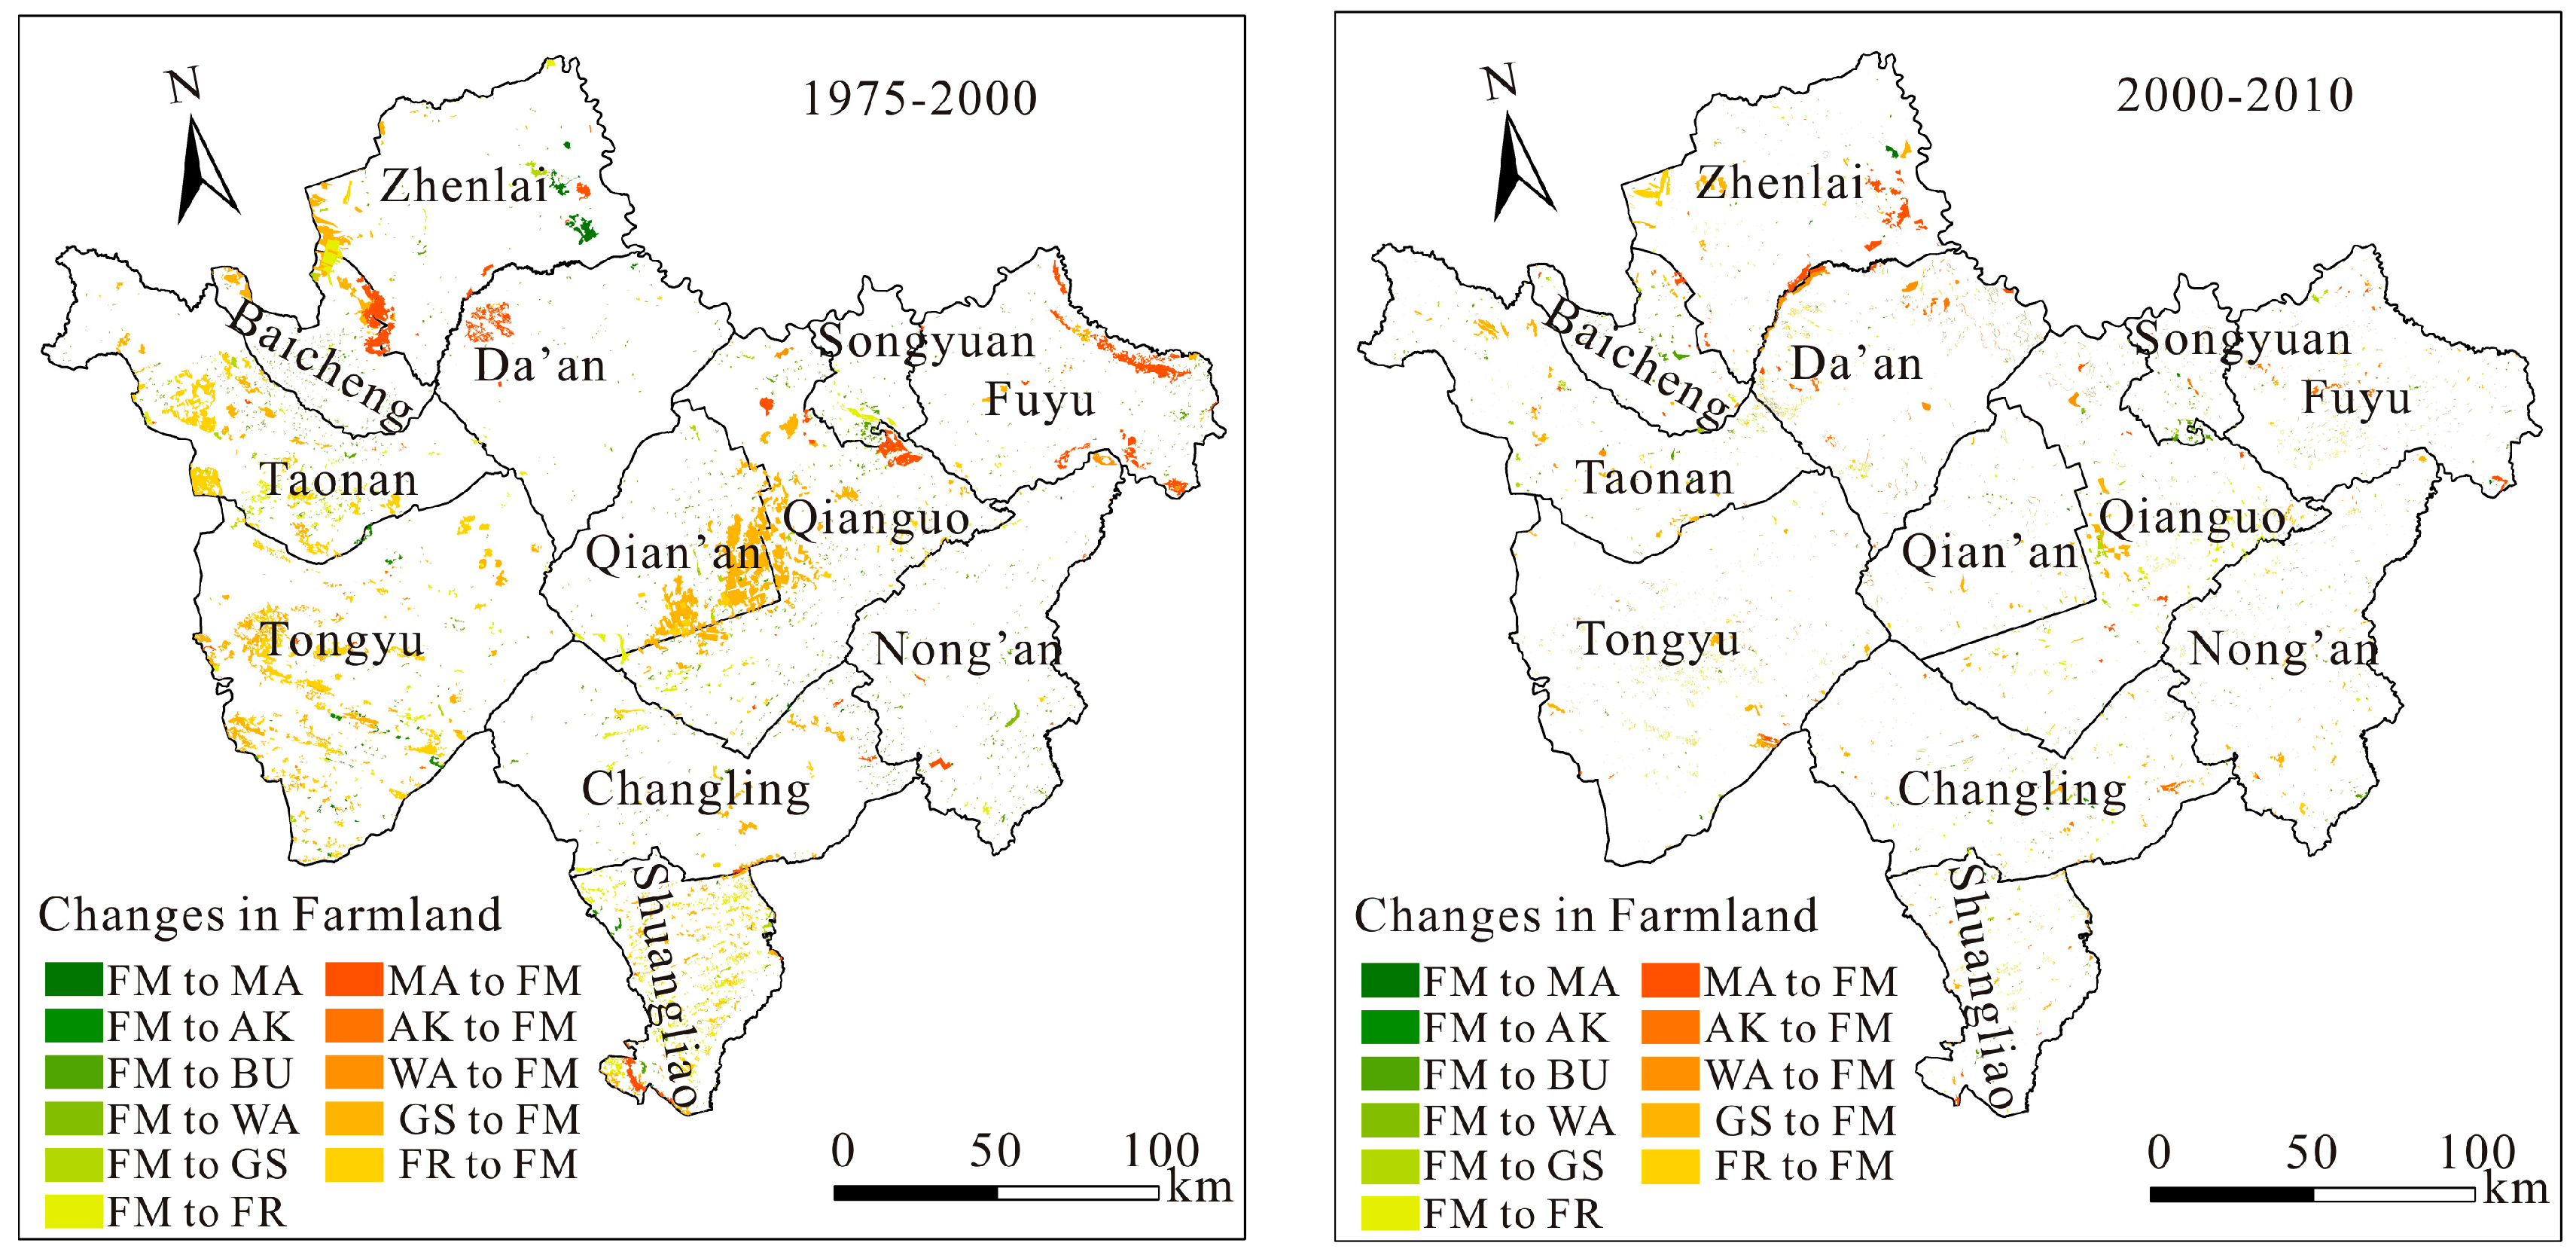
3.2. Land Use Change between 1975 and 2010

As can be seen from Figure 3, a decrease in grassland and marsh and increase in farmland and alkali-land were the most important conversions of land use between 1975 and 2010. The area of grassland was reduced by approximately 353.2 thousand ha during that timeframe. The decreased grassland is mainly converted to farmland, alkali-land and forest. There were other types of land use converted to grassland at the same time, such as forest, alkali-land and farmland; however, the area was small. The increase in the alkali-land was another noteworthy characteristic of land use changes in Western Jilin. The alkali-land area increased by 132.0 thousand ha between 1975 and 2010 and the increased alkali-land mostly came from grassland and marsh. The farmland increased by 208.7 thousand ha in that timeframe, and the area of farmland accounted for 53.4% of the total area in 2010.
Figure 3. Area changes in land use between 1975 and 2010.
Sustainability 07 14729 g003

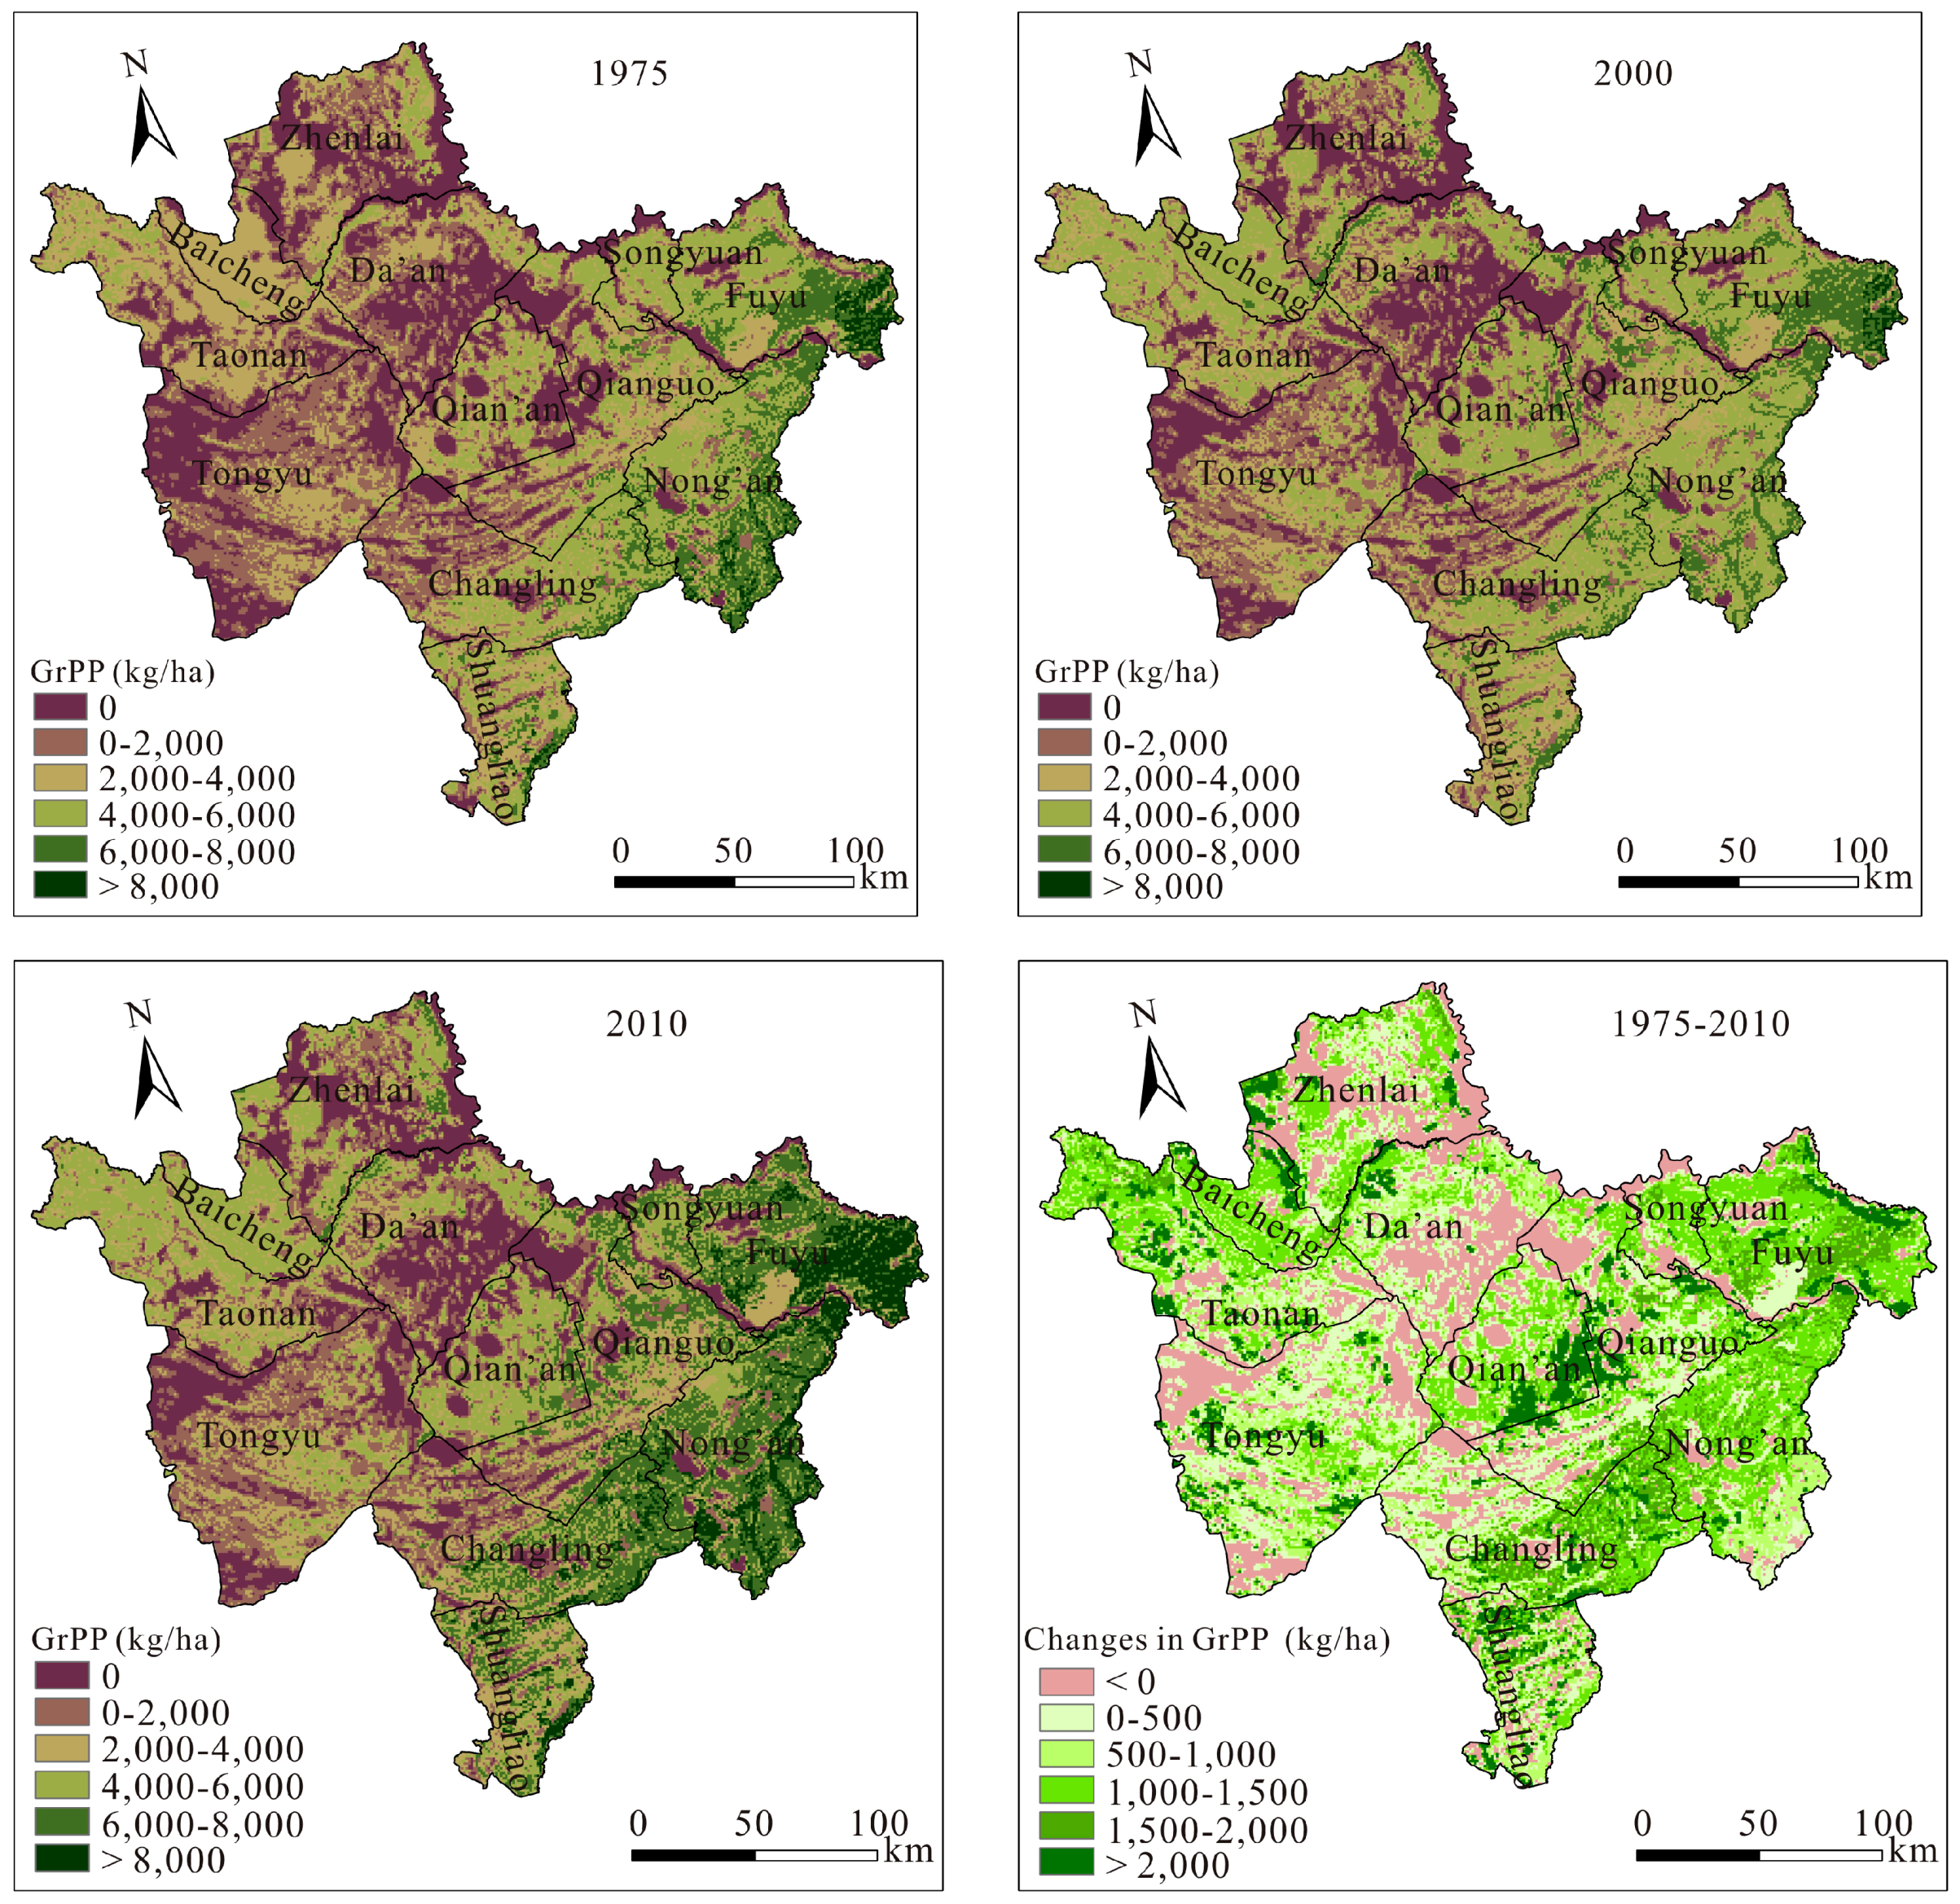
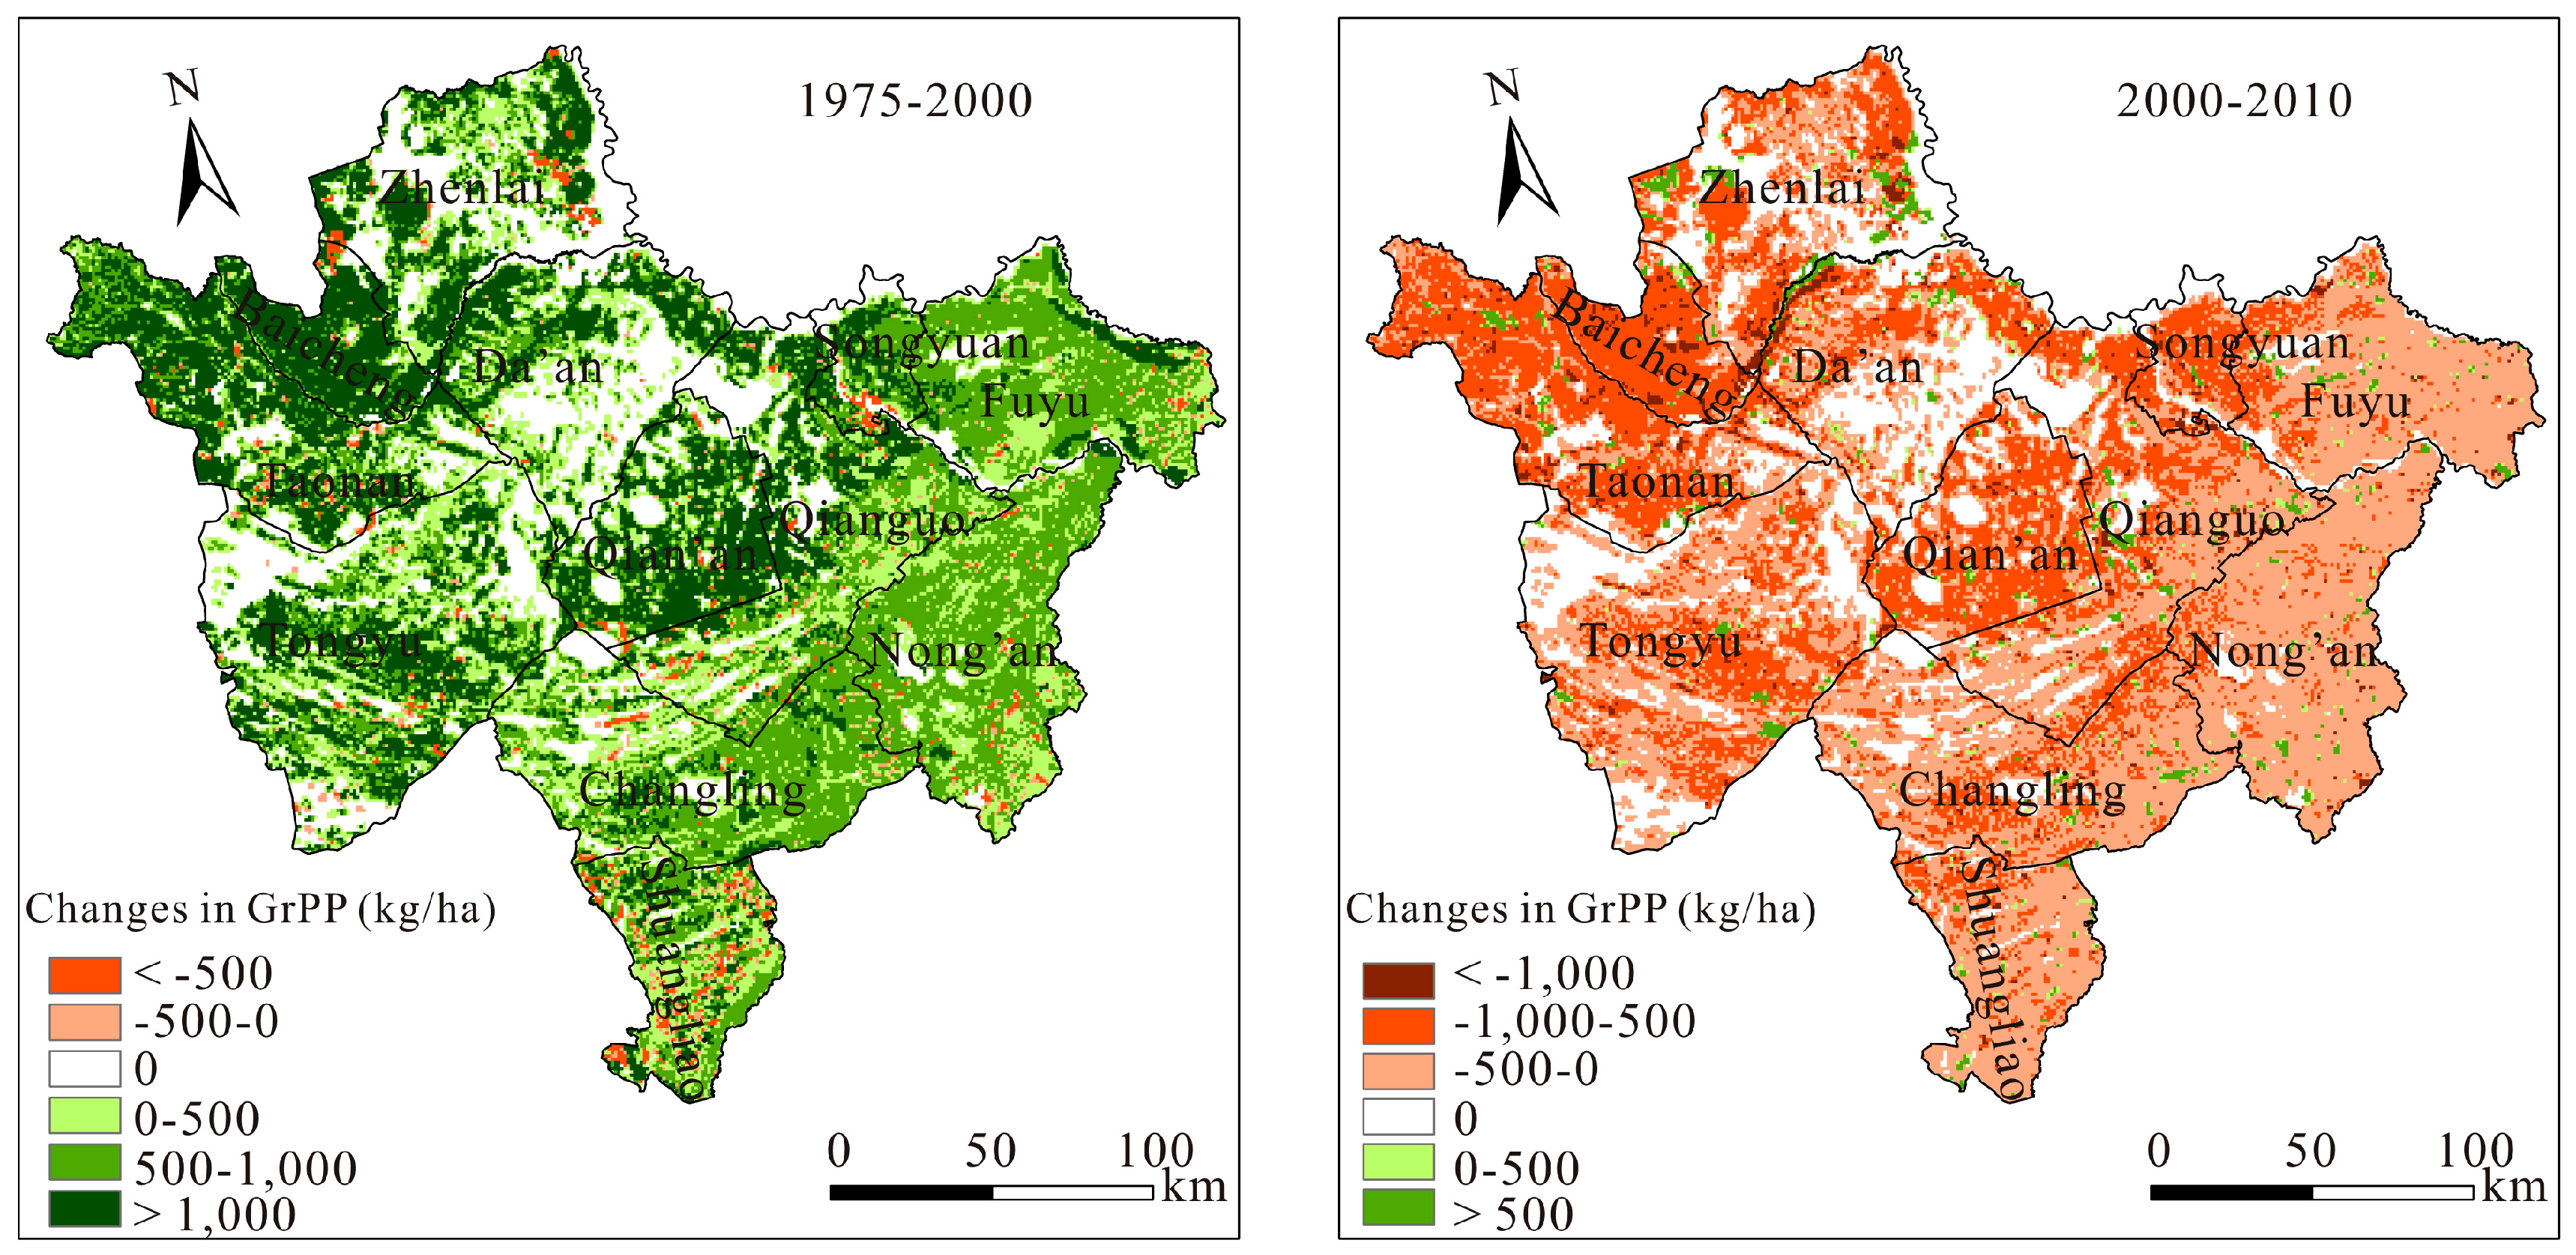
3.3. Changes in Grain Potential Productivity between 1975 and 2010

The total grain potential productivity of Western Jilin in 1975, 2000 and 2010 was 14.18 million tons, 16.62 million tons and 19.12 million tons respectively. There was an increase of 34.8% in total production between 1975 and 2010 (Figure 4). This was mainly because of the changes in farmland and climate. Western Jilin was occupied by cultivated land which increased at a rate of 6000 ha/year between 1975 and 2010 [34]. At the same time, the irrigation percentage increased from 15.9% to 24.3% due to technological progress and economic development. The temperature in Western Jilin increased by about 2 °C, and it also experienced a 100 mm decreases in precipitation in recent 50a, which affected the grain potential productivity [35,36].
Figure 4. Grain potential productivity (GrPP) of Western Jilin in 1975, 2000 and 2010 and its change between 1975 and 2010.
Sustainability 07 14729 g004
The farmland was located mainly in the east of the study area and the precipitation and temperature diminished from east to west. This impacted the grain potential productivity particularly in the east, with more than 6000 kg/ha. The grain potential productivity in the central area was the smallest since it was occupied by grassland and alkali-land.
The grain potential productivity in Western Jilin generally increased between 1975 and 2010; however, the changes of grain potential productivity were different in spatial (Figure 4). Specifically, there was no change in grain potential productivity or it decreased in the southeast of Da’an, the central and east of Zhenlai and the northeast, south and northwest of Tongyu. Meanwhile, the east of Qian’an had an increase of more than 2000 kg/ha in grain potential productivity which was the greatest increase. In addition, the ratio between grain potential productivity and actual production also changed with time. As mentioned above, the ratio between grain potential productivity and actual production was 10.3 in 1975. However, it dropped to 3.6 in 2000 and to 1.6 in 2010.

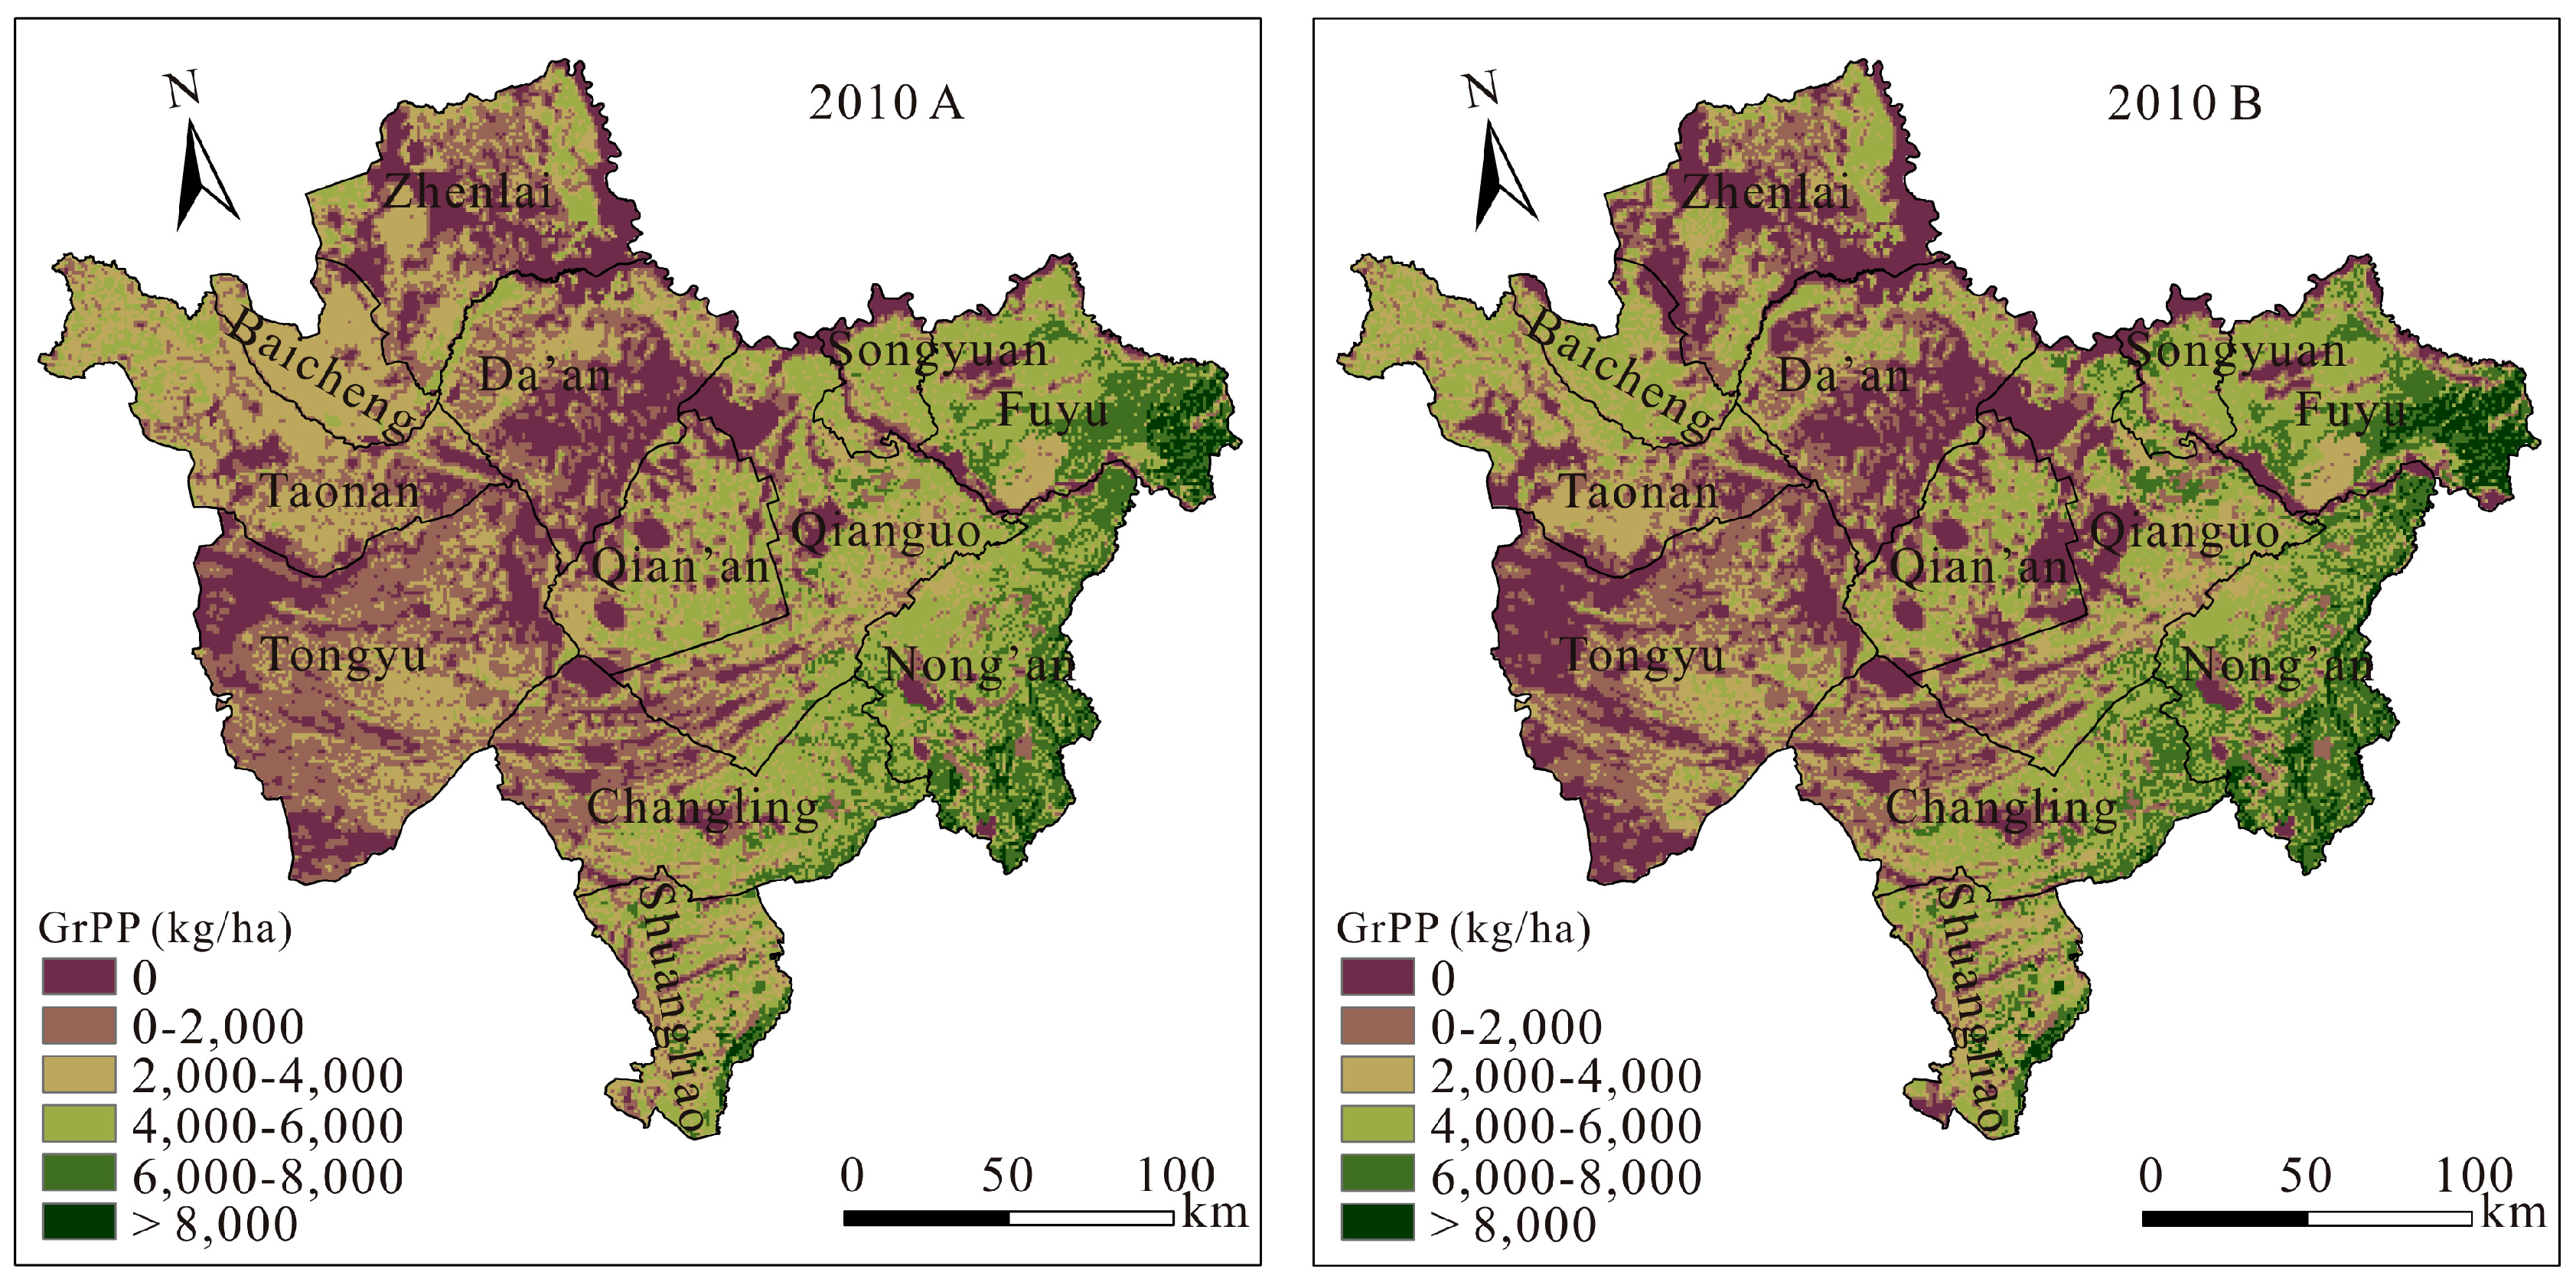
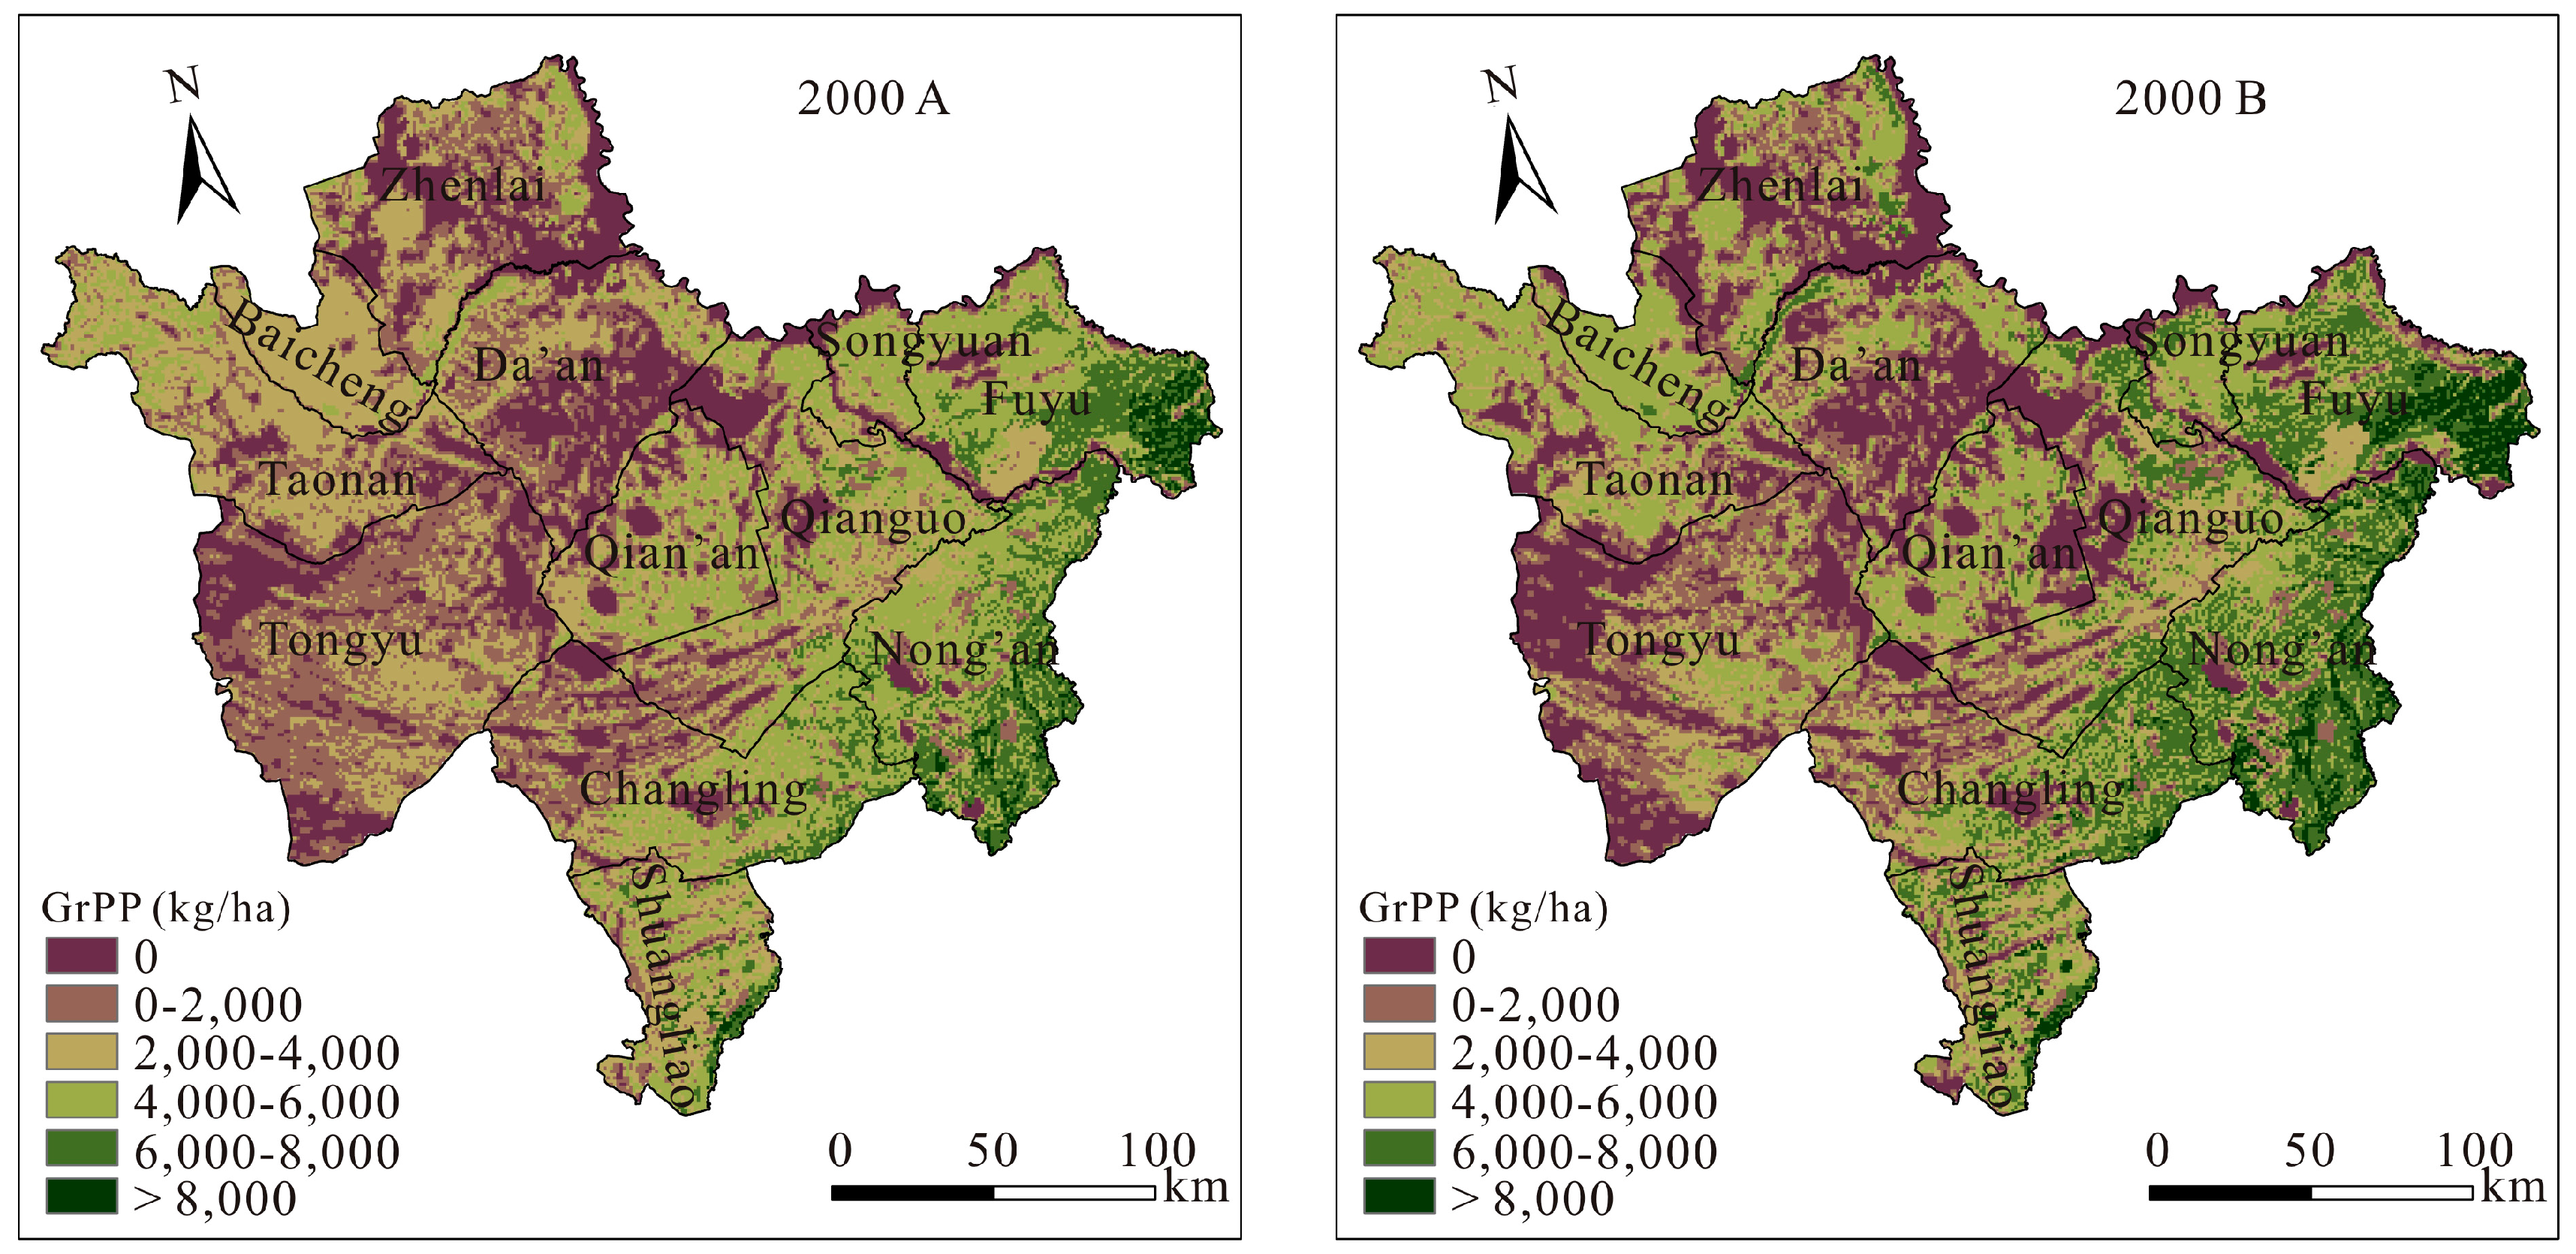
3.4. Grain Potential Productivity Changes Caused by Land Use Change

In general, the responses of grain potential productivity to land use change in two periods (1975–2000 and 2000–2010) were different (Figure 5). Between 1975 and 2000, the increment in total grain potential productivity caused by land use change was 4.05 million tons (Table 1) which mainly occurred in the northwest and central of study area, for example, the grain potential productivity increased by more than 2000 kg/ha in Baicheng and Qian’an. However, there was an opposite trend between 2000 and 2010. Because of the change in land use, total grain potential productivity of Western Jilin decreased by 1.80 million tons and the grain potential productivity of most of the study area had a reduction of more than 500 kg/ha during this period, especially in Baicheng, Songyuan and Qian’an.
Table 1. Grain potential productivity in different conditions and years (unit: million ton).
ScenariosGrPP in 1975GrPP in 2000GrPP in 2010
Climate and land use both changed between 1975 and 201014.1816.6219.12
Land use changed only between 1975 and 2010 *14.1818.2316.43
Land use type converted only between 1975 and 201014.1814.8715.04
Irrigation percentage altered only between 1975 and 201014.1817.3015.42
* Land use change include land use conversions and changes in irrigation percentage.
Figure 5. Grain potential productivity changes caused by land use change in Western Jilin.
Sustainability 07 14729 g005

4. Discussion

In this article, land use change contains two aspects: conversion between different types of land use and changes in irrigation percentage. To discuss the effect of irrigation percentage change and land use conversion on grain potential productivity, the grain potential productivity was calculated for 2000 and 2010 under different hypothetical scenarios. In scenario A: only land use type changed between 1975 and 2010 as climate conditions and irrigation percentage in 2000 and 2010 were same as 1975. In scenario B: only irrigation percentage changed between 1975 and 2010, climate conditions and land use type in 2000 and 2010 were same as 1975.

4.1. Response of Grain Potential Productivity to Land Use Change between 1975 and 2000

In 2000, the total grain potential productivity of Western Jilin only was 14.87 million tons under hypothetical scenario A; however, it was more than 17.30 million tons under hypothetical scenario B (Figure 6). This indicated that land use conversion and irrigation percentage increase led to the total grain potential productivity in Western Jilin increased 0.69 million tons and 3.12 million tons severally between 1975 and 2000.
Figure 6. Grain potential productivity in 2000 under different hypothetical scenarios (hypothetical scenario A: only land use type altered between 1975 and 2010; hypothetical scenario B: only irrigation percentage changed between 1975 and 2010).
Sustainability 07 14729 g006
The most notable feature of the land use type conversion in Western Jilin was the conversion between farmland and other land use types between 1975 and 2000. In this period, there were 252,600 ha of non-cultivated land converted into farmland and 84,600 thousand ha of arable land converted to non-cultivated land, which resulted in a net increase of 168,000 ha of arable land. The increase in arable land mostly came from grassland (126,200 ha), forest (72,300 ha) and marsh (49,600 ha); the decrease in arable land mostly converted into forest (35,300 ha), built-up land (30,400 ha), grassland (7800 ha), marsh (5500 ha) and alkali-land (4300 ha) (Figure 7).
The most important land use conversion for the increase in grain potential productivity was the conversion of grassland to farmland between 1975 and 2000 which caused the total grain potential productivity to increase by 0.43 million tons. Although the conversion of grassland to farmland increased the total grain potential productivity in Western Jilin, it caused serious damages to the environment [37,38]. For example, grassland reclamation not only destroyed the grassland resources and reduced the coverage rate of vegetation, but it also broke the balance between salt and water in soil, exacerbated soil moisture evaporation and the salt accumulation process, and triggered soil salinization [39,40,41].
Figure 7. Land use conversion between 1975 and 2000 and between 2000 and 2010 (FM: farmland; GS: grassland; FR: forest; WA: water; BU: built-up land; AK: alkali-land; MA: marsh).
Sustainability 07 14729 g007
The conversion of marsh to farmland also was important for the increase in grain potential productivity between 1975 and 2000 and caused the total grain potential productivity to increase by 0.21 million tons. Although the area of forest converted into farmland was greater than the area of marsh converted into farmland, the increase in grain potential productivity caused by the conversion of forest to farmland (0.19 million ton) was less than that caused by the conversion of marsh to farmland. This was because forest is often found in regions of higher elevation or greater slope which are not suitable for growing crops [41,42,43,44].
The construction of Three-North Shelterbelt in China resulted in a large area of farmland converted into forest [45,46], which was the most important reason for the decline in grain potential productivity between 1975 and 2000. More specifically, about 0.07 million tons total grain potential productivity were lost due to the conversion of farmland to forest. Moreover, farmland converted into built-up land was another significant reason for the reduction in grain potential productivity. Since the reform and opening up, China’s economy has continued to develop rapidly, and the urbanization has continued to increase [47]. This has led to an increased demand for residential land and construction land [48,49]. However, the expansion of urban and rural built-up land occupied arable land resources with flat terrain, excellent hydrothermal conditions and a high degree of intensification [50], and reduced the total grain potential productivity by 0.03 million tons. In addition, the reduction in total grain potential productivity due to farmland converted into grassland and marsh respectively was 0.02 million tons and 0.02 million tons between 1975 and 2010.
Considering the irrigation percentage increase from 15.9% to 36.6%, the conversion of non-cultivated land to farmland caused the total grain potential productivity to increase by 0.85 million tons between 1975 and 2010. The greatest contributor was grassland, followed by forest and marsh. More specifically, the increases in total grain potential productivity as a result of the conversion of grassland, forest and marsh to farmland respectively were 0.45 million tons, 0.21 million tons and 0.20 million tons.

4.2. Response of Grain Potential Productivity to Land Use Change between 2000 and 2010

The negative response of grain potential productivity to land use change between 2000 and 2010 was mainly attributed the irrigation percentage decline from 36.6% in 2000 to 24.3% in 2010. In this period, the land use conversion that resulted in total grain potential productivity experienced an increment of 0.17 million tons, while the total grain potential productivity lost 1.88 million tons because of the decline in the irrigation percentage (Figure 8). The decline in irrigation percentage occurred primarily because of the increase in rainfall (The annual precipitation of Western Jilin in 2000 was 356 mm; it increased to 515 mm in 2010).
Figure 8. Grain potential productivity in 2010 under different hypothetical scenarios (hypothetical scenario A: only land use type altered between 1975 and 2010; hypothetical scenario B: only irrigation percentage changed between 1975 and 2010).
Sustainability 07 14729 g008
Between 2000 and 2010, the farmland in Western Jilin had a net gain of 40.6 thousand ha, including 77.7 thousand ha of non-cultivated land converted to farmland and 37.1 thousand ha of farmland converted to other types of land use (Figure 7). The total grain potential productivity was reduced by 0.06 million tons due to the conversion of farmland to non-cultivated land. The built-up land occupation of farmland was the greatest contributor for the reduction in grain potential productivity (0.02 million ton), followed by the conversion of farmland to grassland (less than 0.02 million ton) and forest (0.01 million ton) due to the implementation of replacing agriculture with forestation policy in recent years [51]. More importantly, the newly added farmland mainly came from grassland (28,900 ha), marsh (14,700 ha) and forest (12,800 ha). These three conversions respectively resulted in grain potential productivity grew 0.1 million tons, 0.06 million tons and 0.03 million tons. However, the amount of growth reduced by 0.08 million tons, 0.05 million tons and 0.02 million ton when taking the decline in irrigation percentage. Although the increase in farmland caused a growth of 0.23 million tons in total grain potential productivity, it weakened the structure and functions of the ecosystem and led to a reduction in the value of the ecosystem service by about $165.8 million [52,53,54,55]. There should be a trade-off between food security and ecological security [56].

4.3. Limitations

This study had some limitations. Extreme weather conditions—which can have a tremendous impact on the grain potential productivity—were not considered. Also, it was assumed that the supply of water for crop growth was sufficient in the irrigation scenario; however, the actual availability of water provided by irrigation still posed limitations on crop growth in actual practice [2]. In addition, the irrigation percentage was the mean level in Western Jilin and was difficult to express the difference in spatial terms, which would inevitably lead to some bias in the results.
Moreover, most of the grain potential productivity data were simulated data, which was not compared with actual yield. Thus, future research should focus on the yield gap between grain potential productivity and actual yield. This could guide land-use optimization and cultivated land renovation.

5. Conclusions

This research intended to make a contribution to the response of grain potential productivity to land use change on a regional scale and presented some advice for land use planning. The spatial characteristics and grain potential productivity of three major crops in Western Jilin were analyzed using the GAEZ model, and the impact of land use changes on grain potential productivity in different timeframe in Western Jilin were studied. The grain potential productivity has shown a continuous increase in recent decades, from 14.18 million tons in 1975 to 16.62 million tons in 2000 and 19.12 million tons in 2010. However, the trends were different when only the impact of land use changes was considered.
Land use change caused a growth of 4.05 million tons in grain potential productivity between 1975 and 2000 and a reduction of 1.80 million tons between 2000 and 2010. This was mainly because of the change in irrigation percentage and land use type conversion. In the former period, increases in the irrigation percentage and land use conversion led to the total grain potential productivity increased 3.13 million tons and 0.70 million tons respectively. Meanwhile, the total grain potential productivity was reduced by 1.88 million tons due to a decline in the irrigation percentage between 2000 and 2010. However, the land use conversion resulted in a total grain potential productivity increase of 0.17 million tons.
Overall, farmland area in Western Jilin generally has increased continually since 1975; the conversion of nonagricultural land to farmland has led to an upward trend in the total grain potential productivity. The irrigation percentage was an important land use factor that affected the change of grain potential productivity. In some senses, it was even more significant than the land use conversion. Therefore, only increasing the area of farmland might not be the optimal way to ensure food security. Increasing investment in agriculture, improving land quality and raising the conversion rate of grain potential productivity to actual production seems be a better choice to ensure national food security and achieve sustainable land use.

Acknowledgments

National Natural Science Foundation of China, NO.41271416; National Science and Technology infrastructure work project, NO.2013FY112800.

Author Contributions

Fei Li designed and performed the study, reviewed the literature and conducted the interviews. Shuwen Zhang and Xinliang Xu assisted in fine-tuning the literature and results. Jiuchun Yang, Qing Wang, Kun Bu and Liping Chang collected and collated the basic data. All the authors contributed immensely to the conceptualization and development of the paper. Both authors have read and approved the final manuscript.

Conflicts of Interest

The authors declare no conflict of interest.

References

  1. Shi, S.; Chen, Y.; Yao, Y.; Zhibin, L.; Yingbin, H. Impact assessment of cultivated land change upon grain productive capacity in Northeast China. Acta Geogr. Sin. 2008, 63, 574–586. [Google Scholar]
  2. Liu, L.; Xu, X.; Liu, J.; Chen, X.; Ning, J. Impact of farmland changes on production potential in China during 1990–2010. J. Geogr. Sci. 2015, 25, 19–34. [Google Scholar] [CrossRef]
  3. Fu, Z.; Cai, Y.; Yang, Y.; Dai, E. Research on the relationship of cultivated land change and food security in China. J. Nat. Resour. 2001, 16, 313–319. [Google Scholar]
  4. Turner, B.L., II; Skole, D.L.; Sanderson, S.; Fischer, G.; Fresco, L.; Leemans, R. Land-use and land-cover change: Science/research plan. Glob. Chang. Rep. 1995, 43, 669–679. [Google Scholar]
  5. Turner, B.L., II; Lambin, E.F.; Reenberg, A. The emergence of land change science for global environmental change and sustainability. Proc. Natl. Acad. Sci. USA 2007, 104, 20666–20671. [Google Scholar] [CrossRef] [PubMed]
  6. Lambin, E.F.; Turner, B.L.; Geist, H.J.; Agbola, S.B.; Angelsen, A.; Bruce, J.W.; Coomes, O.T.; Dirzo, R.; Fischer, G.; Folke, C.; et al. The causes of land-use and land-cover change: Moving beyond the myths. Glob. Environ. Chang. 2001, 11, 261–269. [Google Scholar] [CrossRef]
  7. Lambin, E.F.; Geist, H.J.; Lepers, E. Dynamics of land-use and land-cover change in tropical regions. Annu. Rev. Environ. Resour. 2003, 28, 205–241. [Google Scholar] [CrossRef]
  8. Rounsevell, M.D.A.; Arneth, A.; Brown, D.G. Incorporating Human Behavior and Decision Making Processes in Land Use and Climate System Models; GLP Report No. 7; GLP International Project Office: São José dos Campos, Brazil, 2013. [Google Scholar]
  9. GLP. Land Transformations: Between Global Challenges and Local Realities; Humboldt Universität: Berlin, Germany, 2014. [Google Scholar]
  10. Xu, X.; Liu, J.; Cao, M.; Zhang, S. Impact of Recent Climate Fluctuation and LUCC Process on Potential Productivity for Crops in Northeast China. Sci. Geogr. Sin. 2007, 27, 318–324. [Google Scholar]
  11. Pan, P.; Yang, G.; Weizhong, S.U. Progress on Effects of Land Use Change on Land Productivity. Prog. Geogr. 2012, 31, 539–550. [Google Scholar]
  12. Ittersum, M.K.V.; Leffelaar, P.A.; Keulen, H.V. On approaches and applications of the Wageningen crop models. Eur. J. Agron. 2003, 18, 201–234. [Google Scholar] [CrossRef]
  13. Jones, P.G.; Thornton, P.K. The potential impacts of climate change on maize production in Africa and Latin America in 2055. Glob. Environ. Chang. 2003, 13, 51–59. [Google Scholar] [CrossRef]
  14. Yun, J.I. Predicting regional rice production in South Korea using spatial data and crop-growth modeling. Agric. Syst. 2003, 77, 23–38. [Google Scholar] [CrossRef]
  15. Easterling, W.E.; Weiss, A.; Hays, C.J.; Mearns, L.O. Spatial scales of climate information for simulating wheat and maize productivity: The case of the US Great Plains. Agric. For. Meteorol. 2003, 90, 51–63. [Google Scholar] [CrossRef]
  16. Priya, S.; Shibasaki, R. National spatial crop yield simulation using GIS-based crop production model. Ecol. Model. 2001, 135, 113–129. [Google Scholar] [CrossRef]
  17. Basso, B.; Ritchie, J.T.; Pierce, F.J.; Braga, R.P.; Jones, J.W. Spatial validation of crop models for precision agriculture. Agric. Syst. 2001, 68, 97–112. [Google Scholar] [CrossRef]
  18. Batchelor, W.D.; Basso, B.; Paz, J.O. Examples of strategies to analyze spatial and temporal yield variability using crop models. Eur. J. Agron. 2002, 18, 141–158. [Google Scholar] [CrossRef]
  19. Fischer, G.; Velthuizen, H.V.; Shah, M.; Nachtergaele, F. Global agro-ecological assessment for agriculture in the 21st century. J. Henan Vocat.-Tech. Teacher’s Coll. 2002, 11, 371–374. [Google Scholar]
  20. Fischer, G.; Shah, M.; Tubiello, F.N.; Velthuizen, H.V. Socio-economic and climate change impacts on agriculture: An integrated assessment, 1990–2080. Philos. Trans. R. Soc. B 2005, 360, 2067–2083. [Google Scholar] [CrossRef] [PubMed]
  21. Fischer, G.; Shah, M.; Velthuizen, H.V.; Nachtergaele, F. Agro-ecological zones assessments. Land Use Land Cover Soil Sci. 2006, 3, 1–9. [Google Scholar]
  22. Fischer, G.; Tubiello, F.N.; Velthuizen, H.V.; Wiberg, D. Climate change impacts on irrigation water requirements: Effects of mitigation, 1990–2080. Technol. Forecast. Soc. Chang. 2007, 74, 1083–1107. [Google Scholar] [CrossRef]
  23. Fischer, G.; Velthuizen, H.V.; Hizsnyik, E.; Wiberg, D. Potentially obtainable yields in the semi-arid tropics. In Global Theme on Agroecosystems Report No. 54; ICRISAT: Andhra Pradesh, India, 2009. [Google Scholar]
  24. Fischer, G.; Sun, L.X. Model based analysis of future land-use development in China. Agric. Ecosyst. Environ. 2001, 85, 163–176. [Google Scholar] [CrossRef]
  25. International Institute for Applied Systems Analysis (IIASA). Global Agro-Ecological Zones. Available online: http://www.gaez.iiasa.ac.at/ (accessed on 22 October 2015).
  26. Fischer, G.; Teixeira, E.; Hizsnyik, E.T. Land use dynamics and sugarcane production. In Sugarcane Ethanol: Contribution to Climate Change Mitigation and the Environment; Wageningen Academic: Wageningen, The Netherland, 2008; pp. 29–62. [Google Scholar]
  27. Teixeira, E.I.; Fischer, G.; Velthuizen, H.V.; Walter, C.; Ewert, F. Global hot-spots of heat stress on agricultural crops due to climate change. Agric. For. Meteorol. 2013, 170, 206–215. [Google Scholar] [CrossRef]
  28. Deng, X.; Huang, J.; Rozelle, S.D.; Uchida, E. Cultivated land conversion and potential agricultural productivity in China. Land Use Policy 2006, 23, 372–384. [Google Scholar] [CrossRef]
  29. Shortridge, A.; Messina, J. Spatial structure and landscape associations of SRTM error. Remote Sens. Environ. 2011, 115, 1576–1587. [Google Scholar] [CrossRef]
  30. Hutchinson, M.F. Interpolating mean rainfall using thin plate smoothing splines. Int. J. Geogr. Inf. Syst. 1995, 9, 385–403. [Google Scholar] [CrossRef]
  31. Hutchinson, M.F. Interpolation of rainfall data with thin plate smoothing splines. Part I: Two dimensional smoothing of data with short range correlation. J. Geogr. Inf. Decis. Anal. 1998, 2, 139–151. [Google Scholar]
  32. Hutchinson, M.F. Interpolation of rainfall data with thin plate smoothing splines. Part II: Analysis of topographic dependence. J. Geogr. Inf. Decis. Anal. 1998, 2, 152–167. [Google Scholar]
  33. Tatsumi, K.; Yamashiki, Y.; Valmir da Silva, R.; Takara, K.; Matsuoka, Y.; Takahashi, K.; Maruyama, K.; Kawahara, N. Estimation of potential changes in cereals production under climate change scenarios. Hydrol. Process. 2011, 25, 2715–2725. [Google Scholar] [CrossRef]
  34. Li, F.; Zhang, S.; Bu, K.; Yang, J.; Wang, Q.; Chang, L. The relationships between land use change and demographic dynamics in Western Jilin province. J. Geogr. Sci. 2015, 25, 617–636. [Google Scholar] [CrossRef]
  35. Chen, S.; Lu, W.; Luo, J. Multifractal characteristic of meteorological drought in western of Jilin province. J. Jilin Univ. 2013, 43, 245–250. [Google Scholar]
  36. Shen, X.; Wu, Z.; Du, H. Characteristics of climatic change in semiarid region of Western Jilin in recent 50a. J. Arid Land Resour. Environ. 2014, 28, 190–196. [Google Scholar]
  37. Alix-Garcia, J.; Bartlett, A.; Saah, D. The landscape of conflict: IDPs, aid and land-use change in Darfur. J. Econ. Geogr. 2013, 13, 589–617. [Google Scholar] [CrossRef]
  38. Gingrich, S.; Niedertscheider, M.; Kastner, T.; Haberl, H.; Cosor, G.; Krausmann, F.; Kuemmerle, T.; Müller, D.; Reith-Musel, A.; Jepsen, M.R.; et al. Exploring long-term trends in land use change and aboveground human appropriation of net primary production in nine European countries. Land Use Policy 2015, 47, 426–438. [Google Scholar] [CrossRef]
  39. Wang, Y.; Li, Y. Land exploitation resulting in soil salinization in a desert-oasis ecotone. Catena 2013, 100, 50–56. [Google Scholar] [CrossRef]
  40. Tanner, C.C.; Howard-Williams, C.; Tomer, M.D.; Lowrance, R. Bringing together science and policy to protect and enhance marsh ecosystem services in agricultural landscapes. Ecol. Eng. 2013, 56, 1–4. [Google Scholar] [CrossRef]
  41. Szöcs, E.; Coring, E.; Bäthe, J.; Schäfer, R.B. Effects of anthropogenic salinization on biological traits and community composition of stream macroinvertebrates. Sci. Total Environ. 2014, 468–469, 943–949. [Google Scholar] [CrossRef] [PubMed]
  42. Garrett, R.D.; Lambin, E.F.; Rosamond, L.N. The new economic geography of land use change: Supply chain configurations and land use in the Brazilian Amazon. Land Use Policy 2013, 34, 265–275. [Google Scholar] [CrossRef]
  43. Li, Z.; Liu, X.; Ma, T. Retrieval of the surface evapotranspiration patterns in the alpine grassland-marsh ecosystem applying SEBAL model in the source region of the Yellow River, China. Ecol. Model. 2013, 270, 64–75. [Google Scholar] [CrossRef]
  44. Tan, B.; Masek, J.G.; Wolfe, R.; Gao, F.; Huang, C. Improved forest change detection with terrain illumination corrected Landsat images. Remote Sens. Environ. 2013, 136, 469–483. [Google Scholar] [CrossRef]
  45. Liu, W.; Zhu, J.; Jia, Q.; Zheng, X.; Li, J.; Lou, X.; Hu, L. Carbon sequestration effects of shrublands in Three-North Shelterbelt Forest region, China. Chin. Geogr. Sci. 2014, 24, 444–453. [Google Scholar] [CrossRef]
  46. Wang, Q.; Zhang, B.; Zhang, Z.; Zhang, X.; Dai, S. The Three-North Shelterbelt Program and dynamic changes in vegetation cover. J. Resour. Ecol. 2014, 5, 53–59. [Google Scholar] [CrossRef]
  47. Wei, Y.; Xiu, C.; Sun, P. Dynamic mechanism of urbanization in China since 2000. Geogr. Res. 2013, 32, 1679–1687. [Google Scholar]
  48. Camagni, R.; Gibelli, M.C.; Rigamonti, P. Urban mobility and urban form: The social and environmental costs of different patterns of urban expansion. Ecol. Econ. 2002, 40, 199–216. [Google Scholar] [CrossRef]
  49. Lerner, A.; Sweeney, S.; Eakin, H. Growing buildings in corn fields: Urban expansion and the persistence of maize in the Toluca Metropolitan Area, Mexico. Urban Stud. 2013, 51, 2185–2201. [Google Scholar] [CrossRef]
  50. Batisani, N.; Yarnal, B. Urban expansion in Centre County, Pennsylvania: Spatial dynamics and landscape transformations. Appl. Geogr. 2009, 29, 235–249. [Google Scholar] [CrossRef]
  51. Du, F. Impacts of replacing agriculture with forestation policy on agricultural production in Zhuozi County. J. Arid Land Resour. Environ. 2008, 22, 86–90. [Google Scholar]
  52. Zhao, B.; Kreuter, U.; Li, B.; Ma, Z.; Chen, J.; Nakagoshi, N. An ecosystem service value assessment of land-use change on Chongming Island, China. Land Use Policy 2004, 21, 139–148. [Google Scholar] [CrossRef]
  53. Schröter, D.; Cramer, W.; Leemans, R.; Prentice, I.C.; Araújo, M.B.L.; Arnell, N.W.; Bondeau, A.; Bugmann, H.; Carter, T.R.; Gracia, C.A.; et al. Ecosystem service supply and vulnerability to global change in Europe. Science 2005, 310, 1333–1337. [Google Scholar] [CrossRef] [PubMed]
  54. Nelson, E.; Sander, H.; Hawthorne, P.; Conte, M.; Ennaanay, D.; Wolny, S.; Manson, S.; Polasky, S. Projecting global land-use change and its effect on ecosystem service provision and biodiversity with simple models. PLoS ONE 2010. [Google Scholar] [CrossRef]
  55. Mendoza-González, G.; Martínez, M.L.; Lithgow, D.; Pérez-Maqueoc, O.; Simonind, P. Land use change and its effects on the value of ecosystem services along the coast of the Gulf of Mexico. Ecol. Econ. 2012, 82, 23–32. [Google Scholar] [CrossRef]
  56. Carreño, L.; Frank, F.C.; Viglizzo, E.F. Tradeoffs between economic and ecosystem services in Argentina during 50 years of land-use change. Agric. Ecosyst. Environ. 2012, 154, 68–77. [Google Scholar] [CrossRef]

