
Assessment of the Sustainable Development Capacity with the Entropy Weight Coefficient Method


Abstract
:1. Introduction
2. Models
2.1. Construction of the Index System
2.2. Model Development of EWCM
2.2.1. Data Standardization

| First order | Second order | 2000 | 2001 | 2002 | 2003 | 2004 | 2005 | 2006 | 2007 | 2008 | 2009 | 2010 | 2011 | 2012 | 2013 |
|---|---|---|---|---|---|---|---|---|---|---|---|---|---|---|---|
| Economy sub-system | EC1 | 9326 | 10,195 | 11,340 | 13,268 | 16,413 | 19,934 | 23,603 | 27,604 | 32,936 | 35,894 | 41,106 | 47,335 | 51,768 | 56,323 |
| EC2 | 254.27 | 280.78 | 350.93 | 532.84 | 762.90 | 1054.29 | 1113.61 | 1253.70 | 1543.59 | 1903.10 | 2327.67 | 2676.97 | 3125.60 | 3678.91 | |
| EC3 | 14.64 | 23.62 | 6.46 | 16.97 | 16.05 | 29.55 | 26.38 | 23.53 | 16.81 | 12.34 | 25.05 | 25.70 | 17.46 | 12.33 | |
| EC4 | 654.48 | 683.99 | 795.81 | 1084.21 | 1491.23 | 2226.33 | 2826.14 | 3541.65 | 4164.33 | 4701.36 | 5668.96 | 6848.58 | 7802.45 | 8914.02 | |
| EC5 | 6.05 | 6.94 | 6.86 | 6.95 | 6.82 | 8.05 | 10.83 | 12.16 | 12.69 | 13.44 | 13.21 | 13.67 | 15.76 | 16.36 | |
| EC6 | 14.8 | 14.4 | 13.2 | 11.9 | 11.8 | 10.6 | 9.7 | 9.7 | 9.6 | 9.5 | 9.2 | 8.8 | 8.6 | 8.7 | |
| EC7 | 49.7 | 49.3 | 50.3 | 53.5 | 56.5 | 57.4 | 57.7 | 56.9 | 57 | 55.8 | 54.2 | 52.9 | 51.4 | 50.1 | |
| EC8 | 35.5 | 36.3 | 36.5 | 34.6 | 31.7 | 32.0 | 32.6 | 33.4 | 33.4 | 34.7 | 36.6 | 38.3 | 40.0 | 41.2 | |
| EC9 | 256.2 | 258.2 | 259.8 | 257.3 | 251.7 | 253.4 | 255.5 | 257.1 | 257.2 | 259.9 | 264 | 267.8 | 271.4 | 273.7 | |
| EC10 | 49.95 | 49.98 | 49.99 | 49.80 | 49.55 | 48.30 | 47.89 | 47.67 | 47.32 | 47.36 | 46.80 | 46.32 | 46.64 | 46.40 | |
| EC11 | 33.4 | 38.9 | 32.7 | 29.6 | 29.2 | 32.1 | 31.9 | 33 | 37.5 | 30.2 | 35.8 | 38.2 | 37.1 | 35.3 | |
| Resource sub-system | RE1 | 56.245 | 52.10 | 49.25 | 48.97 | 34.95 | 41.59 | 19.98 | 38.71 | 32.87 | 28.50 | 30.91 | 34.76 | 27.41 | 29.17 |
| RE2 | 96.49 | 115.50 | 132.42 | 143.84 | 143.95 | 139.96 | 140.83 | 146.17 | 146.15 | 146.00 | 160.56 | 163.52 | 172.62 | 151.88 | |
| RE3 | 7.60 | 10.80 | 11.40 | 2.2. | 4.90 | 16.00 | 18.20 | 9.50 | 27.40 | 156.60 | 334.80 | 533.50 | 791.90 | 1161.90 | |
| RE4 | 0.58 | 0.98 | 1.14 | 0.86 | 1.15 | 1.11 | 1.04 | 1.00 | 0.32 | 0.33 | 0.5 | 0.24 | 0.43 | 0.92 | |
| RE5 | 835.4 | 1033.4 | 910.7 | 983.6 | 1118.4 | 1230.3 | 1034.6 | 992.2 | 1130.5 | 1199.7 | 1290.1 | 691.60 | 798.00 | 679.30 | |
| RE6 | 99.77 | 116.50 | 131.21 | 159.75 | 196.06 | 256.88 | 287.86 | 311.94 | 321.16 | 345.36 | 362.99 | 385.07 | 400.36 | 408.37 | |
| RE7 | 74.09 | 76.87 | 81.84 | 79.47 | 75.98 | 80.76 | 79.8 | 80.47 | 77.98 | 77.13 | 76.17 | 76.47 | 75.21 | 73.82 | |
| RE8 | 312.23 | 363.51 | 413.5 | 472.6 | 537.52 | 603.00 | 643.66 | 690.73 | 733.55 | 734.44 | 775.69 | 801.1 | 819.5 | 807.9 | |
| Environment sub-system | EN1 | 77.18 | 84.05 | 86.96 | 89.21 | 90.77 | 91.64 | 92.42 | 93.32 | 93.72 | 94.79 | 95.40 | 95.68 | 96.08 | 96.29 |
| EN2 | 82.3 | 85.5 | 84.6 | 87.7 | 90.5 | 89.9 | 92.2 | 91.5 | 88.7 | 92.3 | 92.8 | 93.2 | 95.1 | 94.2 | |
| EN3 | 92.6 | 94.4 | 93.7 | 92.2 | 95.5 | 97.5 | 96.6 | 95.9 | 97.7 | 98 | 98.2 | 97.9 | 98.4 | 98.1 | |
| EN4 | 1.05 | 1.13 | 1.22 | 1.58 | 1.75 | 1.99 | 2.22 | 2.37 | 2.59 | 2.86 | 3.15 | 3.68 | 3.87 | 4.63 | |
| EN5 | 54.07 | 62.15 | 65.59 | 67.86 | 79.22 | 91.75 | 110.11 | 119.35 | 129.88 | 141.38 | 160.38 | 195.33 | 183.43 | 181.72 | |
| EN6 | 2290.00 | 2352.71 | 2307.09 | 2457.82 | 2640.14 | 2830.38 | 3026.37 | 3342.55 | 3589.10 | 3867.31 | 4363.71 | 4433.31 | 4791.00 | 4945.70 | |
| EN7 | 1.80 | 1.72 | 1.69 | 1.84 | 1.82 | 2.00 | 1.96 | 1.82 | 1.69 | 1.59 | 1.54 | 1.86 | 1.75 | 1.64 | |
| EN8 | 670 | 650 | 620 | 620 | 520 | 620 | 580 | 460 | 440 | 420 | 390 | 780 | 700 | 700 | |
| EN9 | 951.2 | 921.9 | 859.4 | 829.5 | 778.9 | 770.3 | 758.1 | 719.9 | 678.6 | 647.0 | 620.5 | 1982.5 | 1921.2 | 1845.7 | |
| EN10 | 86,017 | 84,415 | 83,668 | 77,456 | 80,884 | 84,259 | 83,235 | 76,697 | 70,375 | 67,305 | 66,484 | 172,945 | 168,583 | 161,517 | |
| Society sub-system | SO1 | 33.77 | 49.70 | 64.26 | 83.44 | 103.06 | 126.65 | 143.75 | 153.77 | 162.90 | 168.21 | 170.31 | 170.76 | 171.24 | 174.51 |
| SO2 | 26.78 | 27.84 | 29.00 | 31.05 | 32.15 | 34.03 | 34.68 | 36.68 | 37.51 | 37.47 | 40.08 | 40.93 | 41.51 | 53.75 | |
| SO3 | 6490 | 7101 | 7615 | 8400 | 9437.8 | 10,744.8 | 12,192 | 14,265 | 16,305 | 17,811 | 19,946 | 22,792 | 25,755 | 28,264 | |
| SO4 | 33.86 | 35.15 | 34.59 | 34.38 | 34.76 | 35.48 | 35.12 | 37.81 | 38.06 | 36.64 | 37.54 | 38.26 | 36.59 | 38.27 | |
| SO5 | 1.9 | 1.8 | 2.0 | 1.9 | 2.1 | 2.2 | 2.0 | 2.1 | 2.1 | 1.9 | 2.0 | 2.2 | 2.1 | 2.2 | |
| SO6 | 18.0 | 17.9 | 18.3 | 17.1 | 17.8 | 18.2 | 19.5 | 20 | 20.4 | 18.8 | 18.6 | 20.9 | 22.2 | 20.9 | |
| SO7 | 3.19 | 3.31 | 3.22 | 3.55 | 3.47 | 3.51 | 3.20 | 3.38 | 3.44 | 3.25 | 3.43 | 3.63 | 3.86 | 3.97 | |
| SO8 | 13.14 | 12.79 | 12.69 | 12.79 | 13.05 | 13.20 | 13.25 | 13.40 | 13.97 | 14.29 | 14.55 | 14.88 | 15.41 | 16.56 | |
| SO9 | 17.87 | 18.67 | 18.87 | 20.21 | 21.28 | 22.30 | 22.95 | 23.94 | 25.31 | 26.40 | 27.69 | 29.41 | 31.48 | 34.34 | |
| SO10 | 4.695 | 8.953 | 11.32 | 12.30 | 13.48 | 14.75 | 16.71 | 18.35 | 20.46 | 40.36 | 43.28 | 45.45 | 47.32 | 55.44 | |
| SO11 | 0.48 | 0.53 | 0.57 | 0.65 | 0.76 | 0.81 | 0.85 | 0.94 | 1.02 | 1.29 | 1.38 | 1.47 | 1.53 | 1.56 | |
| SO12 | 15.62 | 13.12 | 16.89 | 16.75 | 17.93 | 17.64 | 19.28 | 20.97 | 23.16 | 24.97 | 26.70 | 27.53 | 31.29 | 33.42 | |
| SO13 | 6.258 | 6.696 | 7.445 | 8.806 | 10.102 | 11.387 | 12.272 | 13.396 | 14.371 | 15.522 | 16.489 | 17.181 | 18.208 | 19.063 | |
| SO14 | 6962 | 6724 | 7293 | 9067 | 9733 | 10,743 | 15,937 | 22,821 | 26,688 | 34,513 | 51,490 | 58,843 | 75,522 | 76,976 |
| Second order | Indicators referred | Unit |
|---|---|---|
| GDP per Capita | EC1 | RMB |
| Total investment in fixed Assets | EC2 | Billion RMB |
| Growth rate of government revenue | EC3 | % |
| Gross heavy industrial output value | EC4 | Billion RMB |
| Proportion of high-tech industry output value in GDP | EC5 | % |
| Proportion of primary industry in GDP | EC6 | % |
| Proportion of secondary industry in GDP | EC7 | % |
| Proportion of tertiary industry in GDP | EC8 | % |
| Index of industrial structure supererogation | EC9 | / |
| Industrial structure coefficient | EC10 | / |
| Tertiary industry contribution rate | EC11 | % |
| Total amount of water resource | RE1 | Billion M3 |
| Primary energy production | RE2 | Million tons |
| Hydropower and wind power production | RE3 | Thousand tons |
| Electricity production elastic coefficient | RE4 | / |
| Natural gas production | RE5 | Thousand tons |
| primary energy consumption | RE6 | Million tons |
| Proportion of coal in primary energy consumption | RE7 | % |
| Industrial land | RE8 | Km2 |
| Industrial solid waste disposal rate | EN1 | % |
| Treatment of industrial waste water compliance rate | EN2 | % |
| Soot standard discharge rate | EN3 | % |
| Ratio of budget for environmental protection in financial expenditure | EN4 | % |
| Discharge of industrial solid wastes | EN5 | Million tons |
| Waste water discharge | EN6 | Million tons |
| Sulfur dioxide emissions | EN7 | Million tons |
| Soot emissions | EN8 | Thousand tons |
| COD discharge | EN9 | Thousand tons |
| NH3-N discharge | EN10 | Tons |
| Number of ten thousand people in college students | SO1 | Number |
| Proportion of urban population in total population | SO2 | % |
| Urban residents disposable income | SO3 | RMB |
| Engel coefficient | SO4 | / |
| Proportion of fiscal expenditure for science-technology | SO5 | % |
| Proportion of fiscal expenditure for education | SO6 | % |
| Proportion of fiscal expenditure for health | SO7 | % |
| Unemployment insurance rate | SO8 | % |
| Pension insurance rate | SO9 | % |
| Medical insurance rate | SO10 | % |
| Road density | SO11 | Km/Km2 |
| Number of hospital beds for ten thousand people | SO12 | Number |
| Green space area per capita park | SO13 | Hectare/ten thousand people |
| Number of patent ownership | SO14 | Number |
2.2.2. Information Entropy Model
3. Results and Discussion
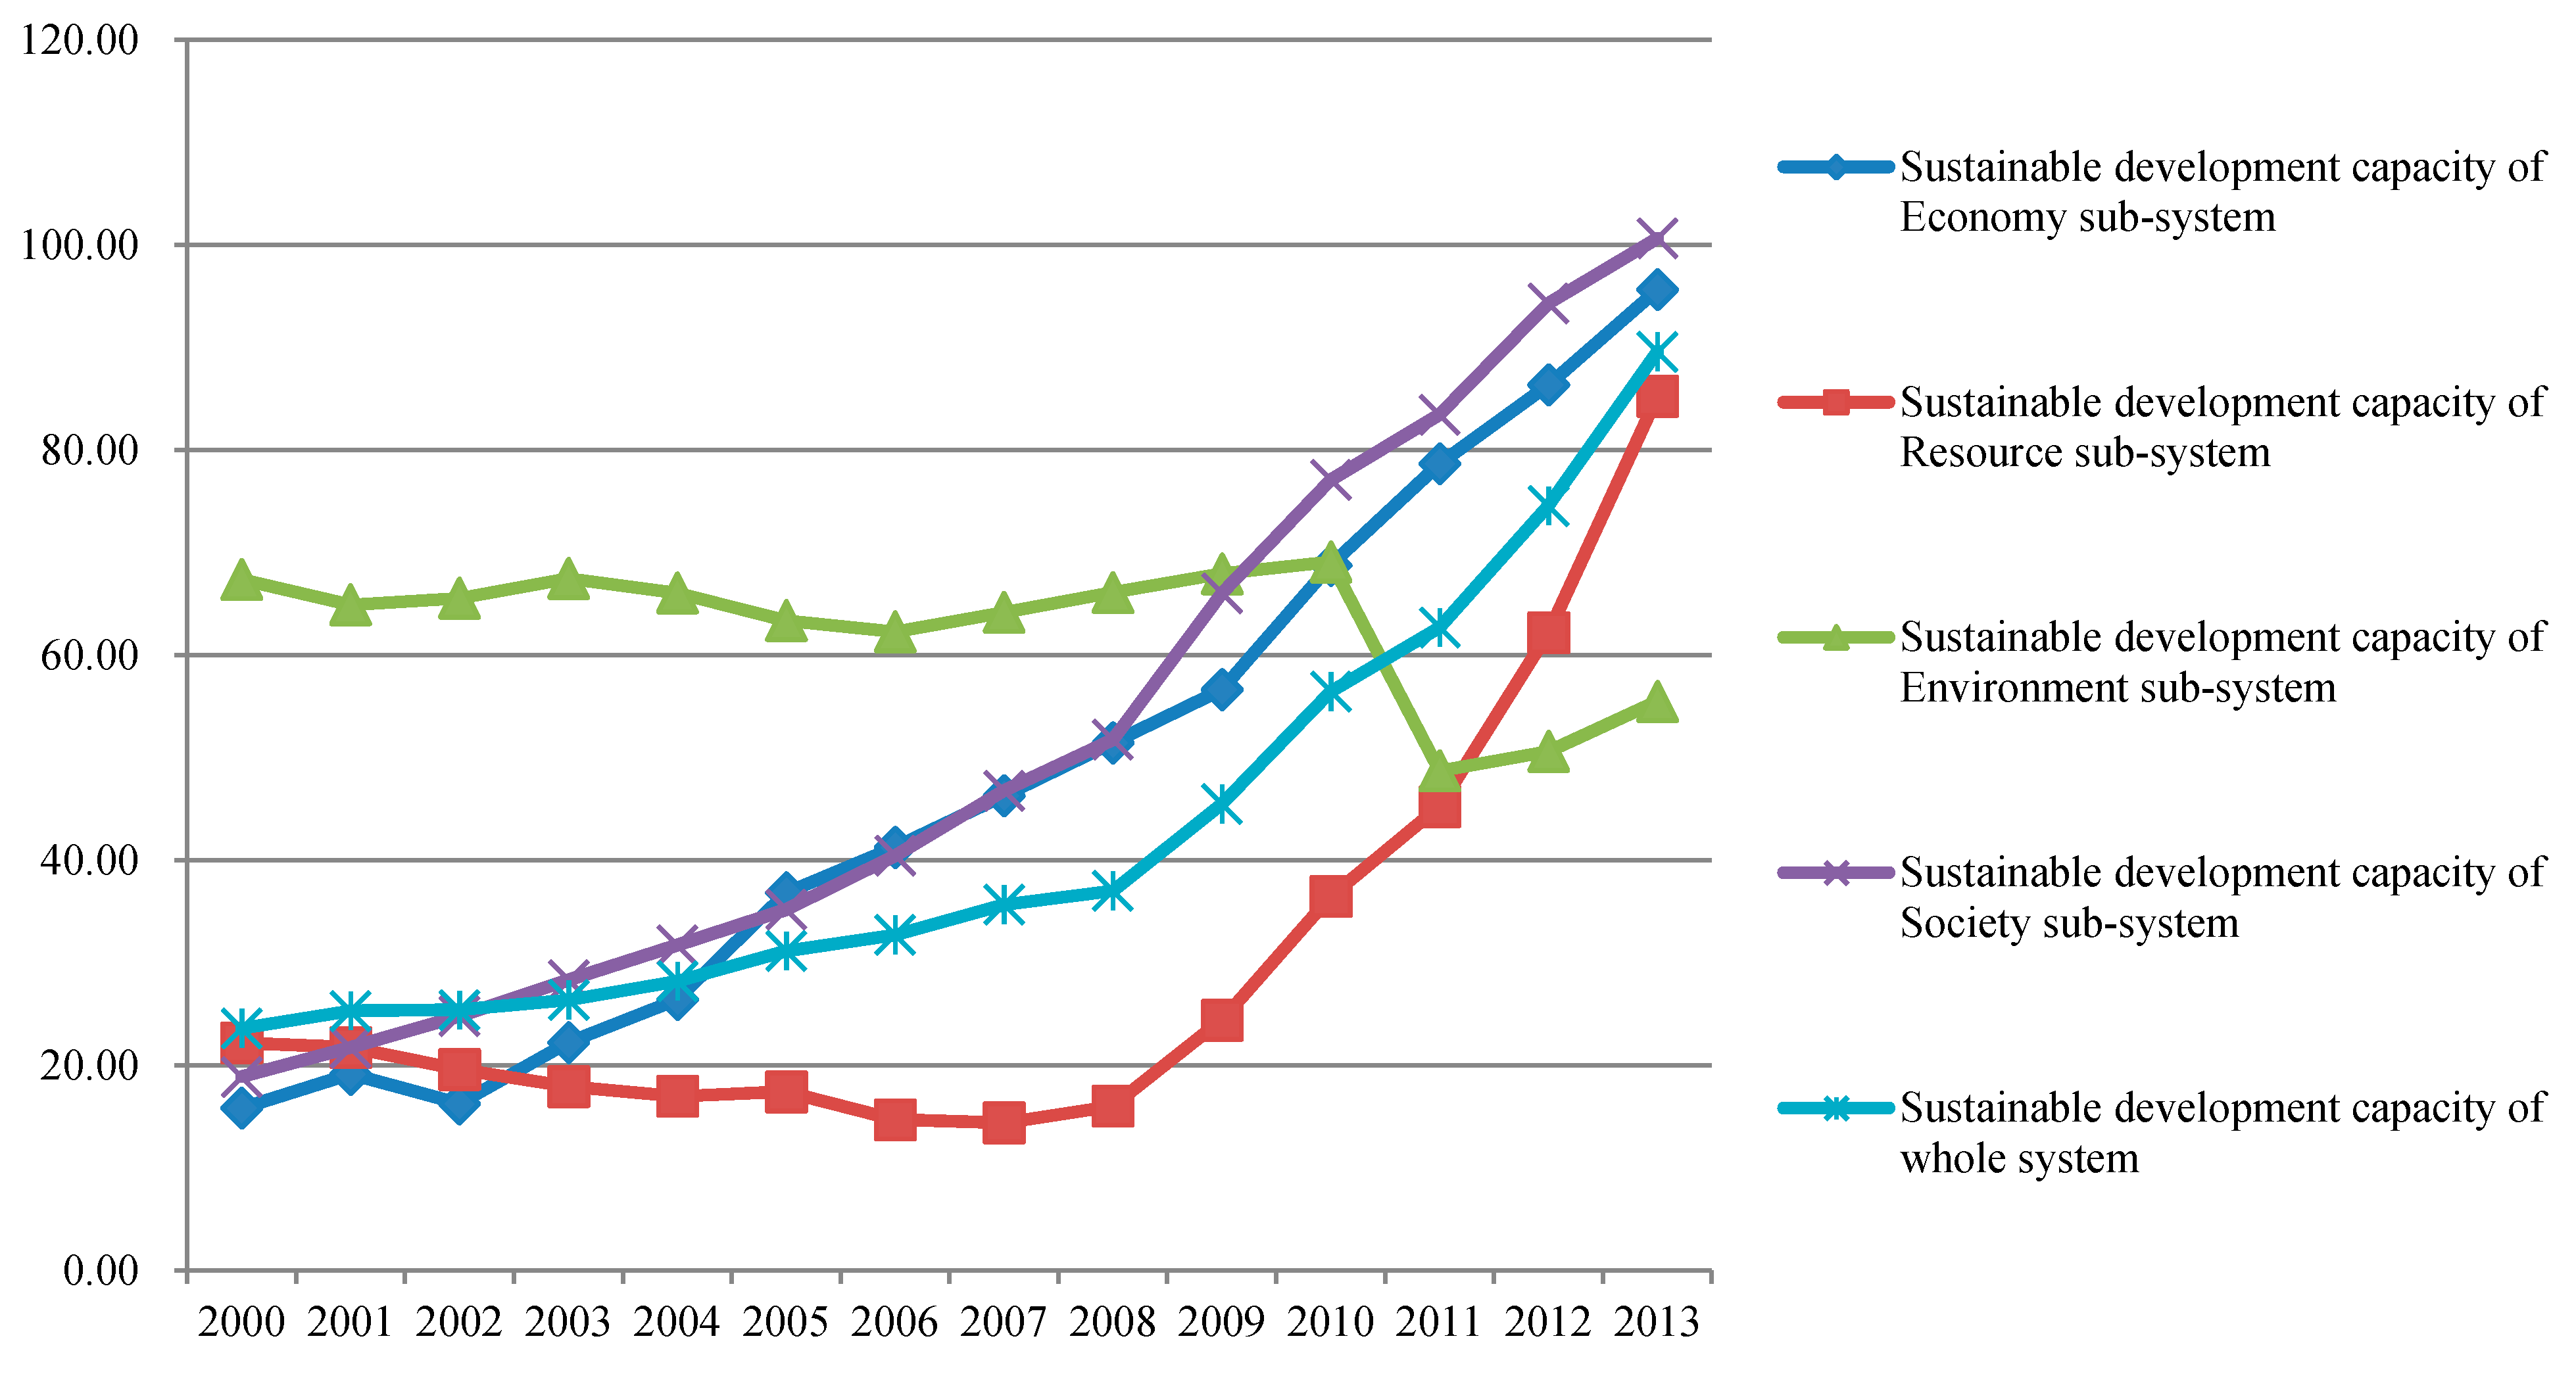
3.1. SDC of Sub-Systems
| First order | Second order | 2000 | 2001 | 2002 | 2003 | 2004 | 2005 | 2006 | 2007 | 2008 | 2009 | 2010 | 2011 | 2012 | 2013 | Weight |
|---|---|---|---|---|---|---|---|---|---|---|---|---|---|---|---|---|
| Economy sub-system | EC1 | 3.06 | 3.34 | 3.72 | 4.35 | 5.38 | 6.53 | 7.74 | 9.05 | 10.79 | 11.76 | 13.47 | 15.51 | 16.97 | 18.46 | 18.46 |
| EC2 | 2.17 | 2.39 | 2.99 | 4.54 | 6.50 | 8.98 | 9.48 | 10.68 | 13.15 | 16.21 | 19.82 | 22.80 | 26.62 | 31.33 | 31.33 | |
| EC3 | 3.63 | 5.85 | 1.60 | 4.20 | 3.97 | 7.32 | 6.53 | 5.83 | 4.16 | 3.06 | 6.20 | 6.36 | 4.32 | 3.05 | 7.32 | |
| EC4 | 2.44 | 2.55 | 2.97 | 4.04 | 5.56 | 8.30 | 10.54 | 13.21 | 15.53 | 17.53 | 21.14 | 25.54 | 29.10 | 33.24 | 33.24 | |
| EC5 | 2.47 | 2.84 | 2.80 | 2.84 | 2.79 | 3.29 | 4.43 | 4.97 | 5.19 | 5.49 | 5.40 | 5.59 | 6.44 | 6.68 | 6.68 | |
| EC6 | 1.05 | 1.08 | 1.17 | 1.30 | 1.31 | 1.46 | 1.60 | 1.60 | 1.61 | 1.63 | 1.68 | 1.76 | 1.80 | 1.78 | 1.80 | |
| EC7 | 0.20 | 0.20 | 0.19 | 0.18 | 0.17 | 0.17 | 0.17 | 0.17 | 0.17 | 0.18 | 0.18 | 0.19 | 0.19 | 0.20 | 0.20 | |
| EC8 | 0.32 | 0.33 | 0.33 | 0.31 | 0.29 | 0.29 | 0.29 | 0.30 | 0.30 | 0.31 | 0.33 | 0.34 | 0.36 | 0.37 | 0.37 | |
| EC9 | 0.03 | 0.03 | 0.03 | 0.03 | 0.03 | 0.03 | 0.03 | 0.03 | 0.03 | 0.03 | 0.03 | 0.04 | 0.04 | 0.04 | 0.04 | |
| EC10 | 0.05 | 0.05 | 0.05 | 0.05 | 0.05 | 0.05 | 0.05 | 0.05 | 0.05 | 0.05 | 0.05 | 0.05 | 0.05 | 0.05 | 0.05 | |
| EC11 | 0.44 | 0.51 | 0.43 | 0.39 | 0.39 | 0.42 | 0.42 | 0.44 | 0.50 | 0.40 | 0.47 | 0.50 | 0.49 | 0.47 | 0.51 | |
| Sustainable development capacity | 15.84 | 19.16 | 16.28 | 22.24 | 26.43 | 36.84 | 41.28 | 46.31 | 51.48 | 56.65 | 68.78 | 78.68 | 86.37 | 95.67 | ||
| Resource sub-system | RE1 | 2.72 | 2.52 | 2.38 | 2.37 | 1.69 | 2.01 | 0.97 | 1.87 | 1.59 | 1.38 | 1.50 | 1.68 | 1.33 | 1.41 | 2.72 |
| RE2 | 0.35 | 0.42 | 0.49 | 0.53 | 0.53 | 0.51 | 0.52 | 0.54 | 0.54 | 0.53 | 0.59 | 0.60 | 0.63 | 0.56 | 0.63 | |
| RE3 | 0.49 | 0.70 | 0.74 | 0.14 | 0.32 | 1.03 | 1.17 | 0.61 | 1.77 | 10.10 | 21.60 | 34.41 | 51.08 | 74.94 | 74.94 | |
| RE4 | 0.84 | 1.04 | 0.91 | 0.99 | 1.12 | 1.23 | 1.04 | 1.00 | 1.13 | 1.20 | 1.29 | 0.69 | 0.80 | 0.68 | 1.29 | |
| RE5 | 4.81 | 5.95 | 5.24 | 5.66 | 6.44 | 7.08 | 5.96 | 5.71 | 6.51 | 6.91 | 7.43 | 3.98 | 4.59 | 3.91 | 7.43 | |
| RE6 | 9.06 | 7.75 | 6.88 | 5.66 | 4.61 | 3.52 | 3.14 | 2.90 | 2.81 | 2.62 | 2.49 | 2.35 | 2.26 | 2.21 | 9.06 | |
| RE7 | 0.04 | 0.03 | 0.03 | 0.03 | 0.03 | 0.03 | 0.03 | 0.03 | 0.03 | 0.03 | 0.03 | 0.03 | 0.03 | 0.04 | 0.04 | |
| RE8 | 3.89 | 3.34 | 2.94 | 2.57 | 2.26 | 2.01 | 1.89 | 1.76 | 1.66 | 1.65 | 1.57 | 1.52 | 1.48 | 1.50 | 3.89 | |
| Sustainable development capacity | 22.19 | 21.76 | 19.61 | 17.95 | 17.00 | 17.44 | 14.71 | 14.42 | 16.04 | 24.43 | 36.49 | 45.26 | 62.21 | 85.26 | ||
| Environment sub-system | EN1 | 0.40 | 0.43 | 0.45 | 0.46 | 0.47 | 0.47 | 0.48 | 0.48 | 0.48 | 0.49 | 0.49 | 0.49 | 0.49 | 0.50 | 0.50 |
| EN2 | 0.21 | 0.22 | 0.22 | 0.23 | 0.24 | 0.23 | 0.24 | 0.24 | 0.23 | 0.24 | 0.24 | 0.24 | 0.25 | 0.25 | 0.25 | |
| EN3 | 0.07 | 0.07 | 0.07 | 0.07 | 0.07 | 0.07 | 0.07 | 0.07 | 0.07 | 0.07 | 0.07 | 0.07 | 0.07 | 0.07 | 0.07 | |
| EN4 | 6.23 | 6.71 | 7.24 | 9.38 | 10.38 | 11.81 | 13.17 | 14.06 | 15.37 | 16.97 | 18.69 | 21.84 | 22.96 | 27.47 | 27.47 | |
| EN5 | 25.93 | 22.56 | 21.37 | 20.66 | 17.70 | 15.28 | 12.73 | 11.75 | 10.79 | 9.92 | 8.74 | 7.18 | 7.64 | 7.71 | 25.93 | |
| EN6 | 10.33 | 10.05 | 10.25 | 9.62 | 8.96 | 8.36 | 7.82 | 7.08 | 6.59 | 6.12 | 5.42 | 5.34 | 4.94 | 4.78 | 10.33 | |
| EN7 | 0.65 | 0.68 | 0.70 | 0.64 | 0.65 | 0.59 | 0.60 | 0.65 | 0.70 | 0.74 | 0.76 | 0.63 | 0.67 | 0.72 | 0.76 | |
| EN8 | 3.89 | 4.01 | 4.20 | 4.20 | 5.01 | 4.20 | 4.49 | 5.67 | 5.92 | 6.21 | 6.68 | 3.34 | 3.72 | 3.72 | 6.68 | |
| EN9 | 10.67 | 11.01 | 11.81 | 12.24 | 13.03 | 13.18 | 13.39 | 14.10 | 14.96 | 15.69 | 16.36 | 5.12 | 5.28 | 5.50 | 16.36 | |
| EN10 | 9.00 | 9.18 | 9.26 | 10.00 | 9.58 | 9.19 | 9.31 | 10.10 | 11.01 | 11.51 | 11.65 | 4.48 | 4.59 | 4.80 | 11.65 | |
| Sustainable development capacity | 67.38 | 64.92 | 65.57 | 67.49 | 66.08 | 63.38 | 62.29 | 64.18 | 66.12 | 67.94 | 69.11 | 48.73 | 50.63 | 55.52 | ||
| Society sub-system | SO1 | 1.74 | 2.56 | 3.31 | 4.29 | 5.30 | 6.52 | 7.40 | 7.91 | 8.38 | 8.66 | 8.76 | 8.79 | 8.81 | 8.98 | 8.98 |
| SO2 | 0.88 | 0.92 | 0.95 | 1.02 | 1.06 | 1.12 | 1.14 | 1.21 | 1.24 | 1.23 | 1.32 | 1.35 | 1.37 | 1.77 | 1.77 | |
| SO3 | 2.60 | 2.85 | 3.06 | 3.37 | 3.79 | 4.31 | 4.89 | 5.72 | 6.54 | 7.15 | 8.00 | 9.14 | 10.33 | 11.34 | 11.34 | |
| SO4 | 0.08 | 0.08 | 0.08 | 0.08 | 0.08 | 0.08 | 0.08 | 0.09 | 0.09 | 0.09 | 0.09 | 0.09 | 0.09 | 0.09 | 0.09 | |
| SO5 | 0.16 | 0.16 | 0.17 | 0.16 | 0.18 | 0.19 | 0.17 | 0.18 | 0.18 | 0.16 | 0.17 | 0.19 | 0.18 | 0.19 | 0.19 | |
| SO6 | 0.24 | 0.23 | 0.24 | 0.22 | 0.23 | 0.24 | 0.25 | 0.26 | 0.27 | 0.25 | 0.24 | 0.27 | 0.29 | 0.27 | 0.29 | |
| SO7 | 0.73 | 0.76 | 0.74 | 0.82 | 0.80 | 0.81 | 0.74 | 0.78 | 0.79 | 0.75 | 0.79 | 0.83 | 0.89 | 0.91 | 0.23 | |
| SO8 | 0.26 | 0.25 | 0.25 | 0.25 | 0.26 | 0.26 | 0.26 | 0.27 | 0.28 | 0.28 | 0.29 | 0.30 | 0.31 | 0.33 | 0.33 | |
| SO9 | 1.07 | 1.11 | 1.13 | 1.21 | 1.27 | 1.33 | 1.37 | 1.43 | 1.51 | 1.58 | 1.65 | 1.76 | 1.88 | 2.05 | 2.05 | |
| SO10 | 1.87 | 3.58 | 4.52 | 4.91 | 5.38 | 5.89 | 6.67 | 7.33 | 8.17 | 16.12 | 17.28 | 18.15 | 18.90 | 22.14 | 22.14 | |
| SO11 | 2.33 | 2.58 | 2.77 | 3.16 | 3.69 | 3.94 | 4.13 | 4.57 | 4.96 | 6.27 | 6.71 | 7.14 | 7.43 | 7.58 | 7.58 | |
| SO12 | 1.79 | 1.50 | 1.94 | 1.92 | 2.05 | 2.02 | 2.21 | 2.40 | 2.65 | 2.86 | 3.06 | 3.15 | 3.59 | 3.83 | 3.83 | |
| SO13 | 1.97 | 2.11 | 2.34 | 2.77 | 3.18 | 3.58 | 3.86 | 4.22 | 4.52 | 4.89 | 5.19 | 5.41 | 5.73 | 6.00 | 6.00 | |
| SO14 | 3.18 | 3.07 | 3.33 | 4.14 | 4.45 | 4.91 | 7.28 | 10.43 | 12.20 | 15.77 | 23.53 | 26.89 | 34.52 | 35.18 | 35.18 | |
| Sustainable development capacity | 18.91 | 21.76 | 24.83 | 28.34 | 31.73 | 35.20 | 40.47 | 46.79 | 51.78 | 66.05 | 77.09 | 83.47 | 94.31 | 100.67 |
| First order | Second order | 2000 | 2001 | 2002 | 2003 | 2004 | 2005 | 2006 | 2007 | 2008 | 2009 | 2010 | 2011 | 2012 | 2013 | Weight |
|---|---|---|---|---|---|---|---|---|---|---|---|---|---|---|---|---|
| Economy sub-system | EC1 | 0.72 | 0.79 | 0.87 | 1.02 | 1.26 | 1.54 | 1.82 | 2.13 | 2.54 | 2.77 | 3.17 | 3.65 | 3.99 | 4.34 | 4.34 |
| EC2 | 0.51 | 0.56 | 0.70 | 1.07 | 1.53 | 2.11 | 2.23 | 2.51 | 3.09 | 3.81 | 4.66 | 5.36 | 6.26 | 7.36 | 7.36 | |
| EC3 | 0.85 | 1.37 | 0.38 | 0.99 | 0.93 | 1.72 | 1.54 | 1.37 | 0.98 | 0.72 | 1.46 | 1.50 | 1.02 | 0.72 | 1.72 | |
| EC4 | 0.57 | 0.60 | 0.70 | 0.95 | 1.31 | 1.95 | 2.48 | 3.10 | 3.65 | 4.12 | 4.97 | 6.00 | 6.84 | 7.81 | 7.81 | |
| EC5 | 0.58 | 0.67 | 0.66 | 0.67 | 0.65 | 0.77 | 1.04 | 1.17 | 1.22 | 1.29 | 1.27 | 1.31 | 1.51 | 1.57 | 1.57 | |
| EC6 | 0.25 | 0.25 | 0.28 | 0.31 | 0.31 | 0.34 | 0.38 | 0.38 | 0.38 | 0.38 | 0.40 | 0.41 | 0.42 | 0.42 | 0.42 | |
| EC7 | 0.05 | 0.05 | 0.05 | 0.04 | 0.04 | 0.04 | 0.04 | 0.04 | 0.04 | 0.04 | 0.04 | 0.04 | 0.04 | 0.05 | 0.05 | |
| EC8 | 0.08 | 0.08 | 0.08 | 0.07 | 0.07 | 0.07 | 0.07 | 0.07 | 0.07 | 0.07 | 0.08 | 0.08 | 0.08 | 0.09 | 0.09 | |
| EC9 | 0.01 | 0.01 | 0.01 | 0.01 | 0.01 | 0.01 | 0.01 | 0.01 | 0.01 | 0.01 | 0.01 | 0.01 | 0.01 | 0.01 | 0.01 | |
| EC10 | 0.01 | 0.01 | 0.01 | 0.01 | 0.01 | 0.01 | 0.01 | 0.01 | 0.01 | 0.01 | 0.01 | 0.01 | 0.01 | 0.01 | 0.01 | |
| EC11 | 0.10 | 0.12 | 0.10 | 0.09 | 0.09 | 0.10 | 0.10 | 0.10 | 0.11 | 0.09 | 0.11 | 0.12 | 0.11 | 0.11 | 0.12 | |
| Resource sub-system | RE1 | 1.08 | 1.00 | 0.94 | 0.94 | 0.67 | 0.80 | 0.38 | 0.74 | 0.63 | 0.55 | 0.59 | 0.67 | 0.53 | 0.56 | 1.08 |
| RE2 | 0.14 | 0.17 | 0.19 | 0.21 | 0.21 | 0.20 | 0.20 | 0.21 | 0.21 | 0.21 | 0.23 | 0.24 | 0.25 | 0.22 | 0.25 | |
| RE3 | 0.19 | 0.28 | 0.29 | 0.06 | 0.13 | 0.41 | 0.46 | 0.24 | 0.70 | 4.00 | 8.55 | 13.62 | 20.22 | 29.66 | 29.66 | |
| RE4 | 0.33 | 0.41 | 0.36 | 0.39 | 0.44 | 0.49 | 0.41 | 0.39 | 0.45 | 0.48 | 0.51 | 0.27 | 0.32 | 0.27 | 0.51 | |
| RE5 | 1.48 | 2.50 | 2.91 | 2.20 | 2.94 | 2.84 | 2.66 | 2.56 | 0.82 | 0.84 | 1.28 | 0.61 | 1.10 | 2.35 | 2.94 | |
| RE6 | 3.58 | 3.07 | 2.73 | 2.24 | 1.82 | 1.39 | 1.24 | 1.15 | 1.11 | 1.04 | 0.99 | 0.93 | 0.89 | 0.88 | 3.58 | |
| RE7 | 0.01 | 0.01 | 0.01 | 0.01 | 0.01 | 0.01 | 0.01 | 0.01 | 0.01 | 0.01 | 0.01 | 0.01 | 0.01 | 0.01 | 0.01 | |
| RE8 | 1.54 | 1.32 | 1.16 | 1.02 | 0.89 | 0.80 | 0.75 | 0.70 | 0.66 | 0.65 | 0.62 | 0.60 | 0.59 | 0.60 | 1.54 | |
| Environment sub-system | EN1 | 0.04 | 0.04 | 0.04 | 0.04 | 0.05 | 0.05 | 0.05 | 0.05 | 0.05 | 0.05 | 0.05 | 0.05 | 0.05 | 0.05 | 0.05 |
| EN2 | 0.02 | 0.02 | 0.02 | 0.02 | 0.02 | 0.02 | 0.02 | 0.02 | 0.02 | 0.02 | 0.02 | 0.02 | 0.02 | 0.02 | 0.02 | |
| EN3 | 0.01 | 0.01 | 0.01 | 0.01 | 0.01 | 0.01 | 0.01 | 0.01 | 0.01 | 0.01 | 0.01 | 0.01 | 0.01 | 0.01 | 0.01 | |
| EN4 | 0.61 | 0.65 | 0.70 | 0.91 | 1.01 | 1.15 | 1.28 | 1.37 | 1.50 | 1.65 | 1.82 | 2.13 | 2.24 | 2.67 | 2.67 | |
| EN5 | 2.52 | 2.20 | 2.08 | 2.01 | 1.72 | 1.49 | 1.24 | 1.14 | 1.05 | 0.97 | 0.85 | 0.70 | 0.74 | 0.75 | 2.52 | |
| EN6 | 1.01 | 0.98 | 1.00 | 0.94 | 0.87 | 0.81 | 0.76 | 0.69 | 0.64 | 0.60 | 0.53 | 0.52 | 0.48 | 0.47 | 1.01 | |
| EN7 | 0.06 | 0.07 | 0.07 | 0.06 | 0.06 | 0.06 | 0.06 | 0.06 | 0.07 | 0.07 | 0.07 | 0.06 | 0.07 | 0.07 | 0.07 | |
| EN8 | 0.38 | 0.39 | 0.41 | 0.41 | 0.49 | 0.41 | 0.44 | 0.55 | 0.58 | 0.60 | 0.65 | 0.33 | 0.36 | 0.36 | 0.65 | |
| EN9 | 1.04 | 1.07 | 1.15 | 1.19 | 1.27 | 1.28 | 1.30 | 1.37 | 1.46 | 1.53 | 1.59 | 0.50 | 0.51 | 0.54 | 1.59 | |
| EN10 | 0.88 | 0.89 | 0.90 | 0.97 | 0.93 | 0.89 | 0.91 | 0.98 | 1.07 | 1.12 | 1.13 | 0.44 | 0.45 | 0.47 | 1.13 | |
| EN10 | 0.88 | 0.89 | 0.90 | 0.97 | 0.93 | 0.89 | 0.91 | 0.98 | 1.07 | 1.12 | 1.13 | 0.44 | 0.45 | 0.47 | 1.13 | |
| Society sub-system | SO1 | 0.47 | 0.70 | 0.90 | 1.17 | 1.44 | 1.77 | 2.01 | 2.15 | 2.28 | 2.35 | 2.38 | 2.39 | 2.40 | 2.44 | 2.44 |
| SO2 | 0.24 | 0.25 | 0.26 | 0.28 | 0.29 | 0.30 | 0.31 | 0.33 | 0.34 | 0.34 | 0.36 | 0.37 | 0.37 | 0.48 | 0.48 | |
| SO3 | 0.71 | 0.77 | 0.83 | 0.92 | 1.03 | 1.17 | 1.33 | 1.56 | 1.78 | 1.94 | 2.17 | 2.48 | 2.81 | 3.08 | 3.08 | |
| SO4 | 0.02 | 0.02 | 0.02 | 0.02 | 0.02 | 0.02 | 0.02 | 0.03 | 0.03 | 0.02 | 0.03 | 0.03 | 0.02 | 0.03 | 0.03 | |
| SO5 | 0.05 | 0.04 | 0.05 | 0.05 | 0.05 | 0.05 | 0.05 | 0.05 | 0.05 | 0.05 | 0.05 | 0.05 | 0.05 | 0.05 | 0.05 | |
| SO6 | 0.06 | 0.06 | 0.06 | 0.06 | 0.06 | 0.06 | 0.07 | 0.07 | 0.07 | 0.07 | 0.07 | 0.07 | 0.08 | 0.07 | 0.08 | |
| SO7 | 0.05 | 0.05 | 0.05 | 0.05 | 0.05 | 0.05 | 0.05 | 0.05 | 0.05 | 0.05 | 0.05 | 0.06 | 0.06 | 0.06 | 0.06 | |
| SO8 | 0.07 | 0.07 | 0.07 | 0.07 | 0.07 | 0.07 | 0.07 | 0.07 | 0.08 | 0.08 | 0.08 | 0.08 | 0.08 | 0.09 | 0.09 | |
| SO9 | 0.29 | 0.30 | 0.31 | 0.33 | 0.34 | 0.36 | 0.37 | 0.39 | 0.41 | 0.43 | 0.45 | 0.48 | 0.51 | 0.56 | 0.56 | |
| SO10 | 0.51 | 0.97 | 1.23 | 1.34 | 1.46 | 1.60 | 1.81 | 1.99 | 2.22 | 4.38 | 4.70 | 4.93 | 5.14 | 6.02 | 6.02 | |
| SO11 | 0.63 | 0.70 | 0.75 | 0.86 | 1.00 | 1.07 | 1.12 | 1.24 | 1.35 | 1.70 | 1.82 | 1.94 | 2.02 | 2.06 | 2.06 | |
| SO12 | 0.49 | 0.41 | 0.53 | 0.52 | 0.56 | 0.55 | 0.60 | 0.65 | 0.72 | 0.78 | 0.83 | 0.86 | 0.98 | 1.04 | 1.04 | |
| SO13 | 0.54 | 0.57 | 0.64 | 0.75 | 0.86 | 0.97 | 1.05 | 1.15 | 1.23 | 1.33 | 1.41 | 1.47 | 1.56 | 1.63 | 1.63 | |
| SO14 | 0.86 | 0.84 | 0.91 | 1.13 | 1.21 | 1.33 | 1.98 | 2.83 | 3.31 | 4.29 | 6.39 | 7.31 | 9.38 | 9.56 | 9.56 | |
| Sustainable development capacity of whole system | 23.64 | 25.34 | 25.41 | 26.39 | 28.23 | 31.17 | 32.74 | 35.69 | 37.04 | 45.51 | 56.47 | 62.70 | 74.58 | 89.61 | ||

3.2. SDC of the Entire System
4. Conclusions
Acknowledgments
Author Contributions
Conflicts of Interest
References
- Xiao, S.E.; Lei, J.S. Calculation and causes of environmental pollution loss in China. China Popul. Resour. Environ. 2011, 21, 70–74. (In Chinese) [Google Scholar]
- Wang, C.J.; Wang, F.; Zhang, H.G.; Ye, Y.Y.; Wu, Q.T.; Su, Y.X. Carbon Emissions Decomposition and Environmental Mitigation Policy Recommendations for Sustainable Development in Shandong Province. Sustainability 2014, 6, 8164–8179. [Google Scholar] [CrossRef]
- Wang, Q.S.; Liu, P.; Yuan, X.L.; Cheng, X.X.; Ma, R.J.; Mu, R.M.; Zuo, J. Structural Evolution of Household Energy Consumption: A China Study. Sustainability 201 2015, 7, 3919–3932. [Google Scholar] [CrossRef]
- Ang, B.W.; Zhang, F.Q. A survey of index decomposition analysis in energy and environmental studies. Energy 2000, 25, 1149–1176. [Google Scholar] [CrossRef]
- United Nations (UN). Indicators of Sustainable Development: Guidelines and Methodologies; United Nations: New York, NY, USA, 2007. [Google Scholar]
- Cao, B.; Lin, J.Y.; Cui, S.H. Review on Assessment Index of Sustainable Development. Environ. Sci. Technol. 2010, 33, 99–105. (In Chinese) [Google Scholar]
- Organisation for Economic Co-operation and Development (OECD). Towards Sustainable Development: Environmental Indicators; OECD: Paris, France, 1998. [Google Scholar]
- Organisation for Economic Co-operation and Development (OECD). OECD Environmental Indicators: Towards Sustainable Development; OECD: Paris, France, 2001. [Google Scholar]
- Zhang, X.; Chen, W.; Ma, C.; Zhang, G.; Ju, M. Assessment method for regional environmental risk based on Pressure-State-Response model. China Environ. Sci. 2012, 32, 84–87. (In Chinese) [Google Scholar]
- Zhang, X.; Ma, C.; Zhan, S.; Chen, W. Evaluation and simulation for ecological risk based on emergy analysis and pressure-state-response model in a coastal city, China. Procedia Environ. Sci. 2012, 13, 221–231. [Google Scholar] [CrossRef]
- Organisation for Economic Co-operation and Development (OECD). Environmental Indicators for Agriculture: Volume1Concepts and Frameworks; OECD: Paris, France, 1999. [Google Scholar]
- Wang, Q.S.; Yuan, X.L.; Ma, C.Y.; Zhang, Z.; Zuo, J. Research on the Impact Assessment of Urbanization on Air Environment with Urban Environmental Entropy Model: A Case Study. Stoch. Environ. Res Risk Assess. 2012, 26, 443–450. [Google Scholar] [CrossRef]
- Ma, C.; Zhang, X.; Zhang, G.; Ju, M.; Zhou, B.; Li, X. Application of DPSIR framework in environmental impact assessment for port planning. China Environ. Sci. 2012, 32, 107–111. [Google Scholar]
- Zhe, L.P. Sustainable Development Theory and China’s Agenda 21; China Meteorological Press: Beijing, China, 2001. [Google Scholar]
- Kittiya, Y.; James, G. An extended performance reporting framework for social and environmental accounting. Bus. Strategy Environ. 2006, 15, 309–321. [Google Scholar]
- Zhang, K.M.; He, X.Y.; Wen, Z.G. Research on the urban environment sustainable development index system of China. China. Popul. Resour. Environ. 2000, 7, 4–9. (In Chinese) [Google Scholar]
- Reach Group of Strategy of Sustainable Development. China Sustainable Development Strategy Report—Building a Resource-Efficient and Environment-Friendly Society; Science Press: Beijing, China, 2006. [Google Scholar]
- Wang, Q.S.; Yuan, X.L.; Zhang, J.; Mu, R.M.; Yang, H.C.; Ma, C.Y. Key evaluation framework for the impacts of urbanization on air environment—A case study. Ecol. Indic. 2013, 24, 266–272. [Google Scholar] [CrossRef]
- Shi, Y.; Zhou, C.B.; Wang, R.S.; Xu, W.Y. Measuring China’s regional ecological development through “EcoDP”. Ecol. Indic. 2012, 15, 253–262. [Google Scholar] [CrossRef]
- Zhan, S.; Zhang, X.; Ma, C.; Chen, W. Dynamic modelling for ecological and economic sustainability in a rapid urbanizing region. Procedia Environ. Sci. 2012, 13, 242–251. [Google Scholar] [CrossRef]
- Huang, J.L. An Overview and Trend of Sustainability Assessment Methodologies. Ecol. Econ. 2015, 31, 18–23. [Google Scholar]
- Commission on Sustainable Development. Indicators of Sustainable Development: Guidelines and Methodologies; United Nations Department of Economic and Social Affairs: New York, NY, USA, 2001. [Google Scholar]
- Global Reporting Initiative (GRI). Sustainability Reporting Guidelines; Global Reporting Initiative: Amsterdam, The Netherlands, 2002. [Google Scholar]
- Ye, W.H.; Tong, C. Review of Review of the United Nations Sustainable Development Indicators. China. Popul. Resour. Environ. 1997, 7, 83–87. (In Chinese) [Google Scholar]
- Wang, H.Y. The latest index system to measure sustainable development. China. Popul. Resour. Environ. 1996, 6, 39–43. (In Chinese) [Google Scholar]
- European Commission. Towards Environmental Pressure Indicators for the EU; Office for Official Publications of the European Communities: Luxembourg, 1999. [Google Scholar]
- Cao, F.Z. American sustainable development indicators. Environ. Sci. Trends 1996, 2, 5–8. (In Chinese) [Google Scholar]
- Sui, Y.; Zhang, L. Visual Tracking via Locally Structured Gaussian Process Regression. IEEE Signal Process. Lett. 2015, 22, 1331–1335. [Google Scholar] [CrossRef]
- Azarnivand, A.; Chitsaz, N. Adaptive policy responses to water shortage mitigation in the arid regions—A systematic approach based on eDPSIR, DEMATEL and MCDA. Environ. Monit. Assess. 2015, 187. [Google Scholar] [CrossRef] [PubMed]
- Anna, T.D.; Palomeque, F.L. Measuring sustainable tourism at the municipal level. Ann. Tour. Res. 2014, 49, 22–137. [Google Scholar]
- Larry, L.S.; James, K.W. Application of steady state maximum entropy methods to high kinetic energy impacts on ceramic targets. Int. J. Impact Eng. 1999, 23, 869–882. [Google Scholar]
- Allan, J. Entropy and the cost of complexity in industrial production. Exergy 2002, 2, 295–299. [Google Scholar]
- Tan, Y.Z.; Wu, C.F. The laws of the information entropy values of land use composition. J. Nat. Resour. 2003, 18, 112–117. (In Chinese) [Google Scholar]
- Durowoju, O.A.; Chan, K.H.; Wang, X.J. Entropy assessment of supply chain disruption. J. Manuf. Technol. Manag. 2012, 23, 998–1014. [Google Scholar]
- Tomas, K.; Bengt, M. Entropy and economic processes-physics perspectives. Ecol. Econ. 2001, 36, 165–179. [Google Scholar]
- Jowsey, E. Economic aspects of natural resource exploitation. Int. J. Sustain. Dev. World Ecol. 2009, 16, 303–307. [Google Scholar] [CrossRef]
- Peng, H.; Zhao, G.H. Resource industry operation study: Cooperation, constraint and sustainability. Adv. Mater. Res. 2012, 524–527, 2971–2976. [Google Scholar] [CrossRef]
- Gao, J.; Hu, J. Financial crisis, Omori’s law, and negative entropy flow. Int. Rev. Financ. Anal. 2014, 33, 79–86. [Google Scholar] [CrossRef]
- Cheng, X.L.; Zhang, Y.Z. Sediment Treatment Scheme Optimization of Southern Route in the Yellow River Diversion of Xinsanyizhai Based on Principle Component Analysis and Entropy Weight Coefficient Method. Water Resour. Power 2013, 31, 133–135. (In Chinese) [Google Scholar]
- Wan, Q.C. Comprehensive evaluation of urban competitiveness based on entropy weight coefficient method. Stat. Decis. 2009, 11, 59–61. (In Chinese) [Google Scholar]
- Frugoli, P.A.; Almeida, C.M.V.B.; Agostinho, F.; Giannetti, B.F.; Huisingh, D. Can measures of well-being and progress help societies to achieve sustainable development? J. Clean. Prod. 2015, 90, 370–380. [Google Scholar] [CrossRef]
- Wang, T.X.; Xu, S.G. Dynamic successive assessment method of water environment carrying capacity and its application. Ecol. Indic. 2015, 52, 134–146. [Google Scholar] [CrossRef]
- Shortall, R.; Davidsdottir, B.; Axelsson, G. Geothermal energy for sustainable development: A review of sustainability impacts and assessment frameworks. Renew. Sustain. Energy Rev. 2015, 44, 391–406. [Google Scholar] [CrossRef]
- Zhao, H.R.; Guo, S. External Benefit Evaluation of Renewable Energy Power in China for Sustainability. Sustainability 2015, 7, 4783–4805. [Google Scholar] [CrossRef]
- Wang, Q.S.; Yuan, X.L.; Chen, X.X.; Mu, R.M.; Zuo, J. Coordinated development of energy, economy and environment subsystems-a case study. Ecol. Indic. 2014, 46, 514–523. [Google Scholar] [CrossRef]
- Liu, J.J.; Dong, S.C.; Li, Z.H. Comprehensive Evaluation of China’s Water Resources Carrying Capacity. J. Nat. Resour. 2011, 26, 258–269. (In Chinese) [Google Scholar]
- Liu, J.S.; Liu, Y.; Yu, Q.Z.; Sun, J.J. Research on Water Resources Carrying Capacity and Spatial Differences in Shandong Province. Water Resour. Power 2010, 28, 19–21. (In Chinese) [Google Scholar]
- Zhang, J.S.; Qi, Q. Reviews on supply security of China’s vital energy under uncertainties. Resour. Ind. 2013, 15, 11–18. (In Chinese) [Google Scholar]
- He, J.K. The strategic choice of Chinese energy revolution and low carbon development. Wuhan Univ. J. 2015, 68, 5–12. (In Chinese) [Google Scholar]
- Mao, X.Q.; Wen, Y.Y.; Li, D.; Liu, Q. Significance, Ideas and Framework of index system for ecological civilization. China Stat. 2013, 5, 43–45. (In Chinese) [Google Scholar]
- Yuan, X.L.; Mu, R.M.; Zuo, J.; Wang, Q.S. Economic Development, Energy Consumption and Air Pollution—A Critical Assessment in China. Hum. Ecol. Risk Assess. 2015, 21, 781–798. [Google Scholar] [CrossRef]
- Mu, R.M.; Zuo, J.; Yuan, X.L. China’s approach to nuclear safety—From the perspective of policy and institutional system. Energy Policy 2015, 76, 161–172. [Google Scholar] [CrossRef]
© 2015 by the authors; licensee MDPI, Basel, Switzerland. This article is an open access article distributed under the terms and conditions of the Creative Commons Attribution license (http://creativecommons.org/licenses/by/4.0/).
Share and Cite
Wang, Q.; Yuan, X.; Zhang, J.; Gao, Y.; Hong, J.; Zuo, J.; Liu, W. Assessment of the Sustainable Development Capacity with the Entropy Weight Coefficient Method. Sustainability 2015, 7, 13542-13563. https://doi.org/10.3390/su71013542
Wang Q, Yuan X, Zhang J, Gao Y, Hong J, Zuo J, Liu W. Assessment of the Sustainable Development Capacity with the Entropy Weight Coefficient Method. Sustainability. 2015; 7(10):13542-13563. https://doi.org/10.3390/su71013542
Chicago/Turabian StyleWang, Qingsong, Xueliang Yuan, Jian Zhang, Yun Gao, Jinglan Hong, Jian Zuo, and Wei Liu. 2015. "Assessment of the Sustainable Development Capacity with the Entropy Weight Coefficient Method" Sustainability 7, no. 10: 13542-13563. https://doi.org/10.3390/su71013542
APA StyleWang, Q., Yuan, X., Zhang, J., Gao, Y., Hong, J., Zuo, J., & Liu, W. (2015). Assessment of the Sustainable Development Capacity with the Entropy Weight Coefficient Method. Sustainability, 7(10), 13542-13563. https://doi.org/10.3390/su71013542