
Multi-Scale Measurement of Regional Inequality in Mainland China during 2005–2010 Using DMSP/OLS Night Light Imagery and Population Density Grid Data


Abstract
:1. Introduction
2. Study Area and Data
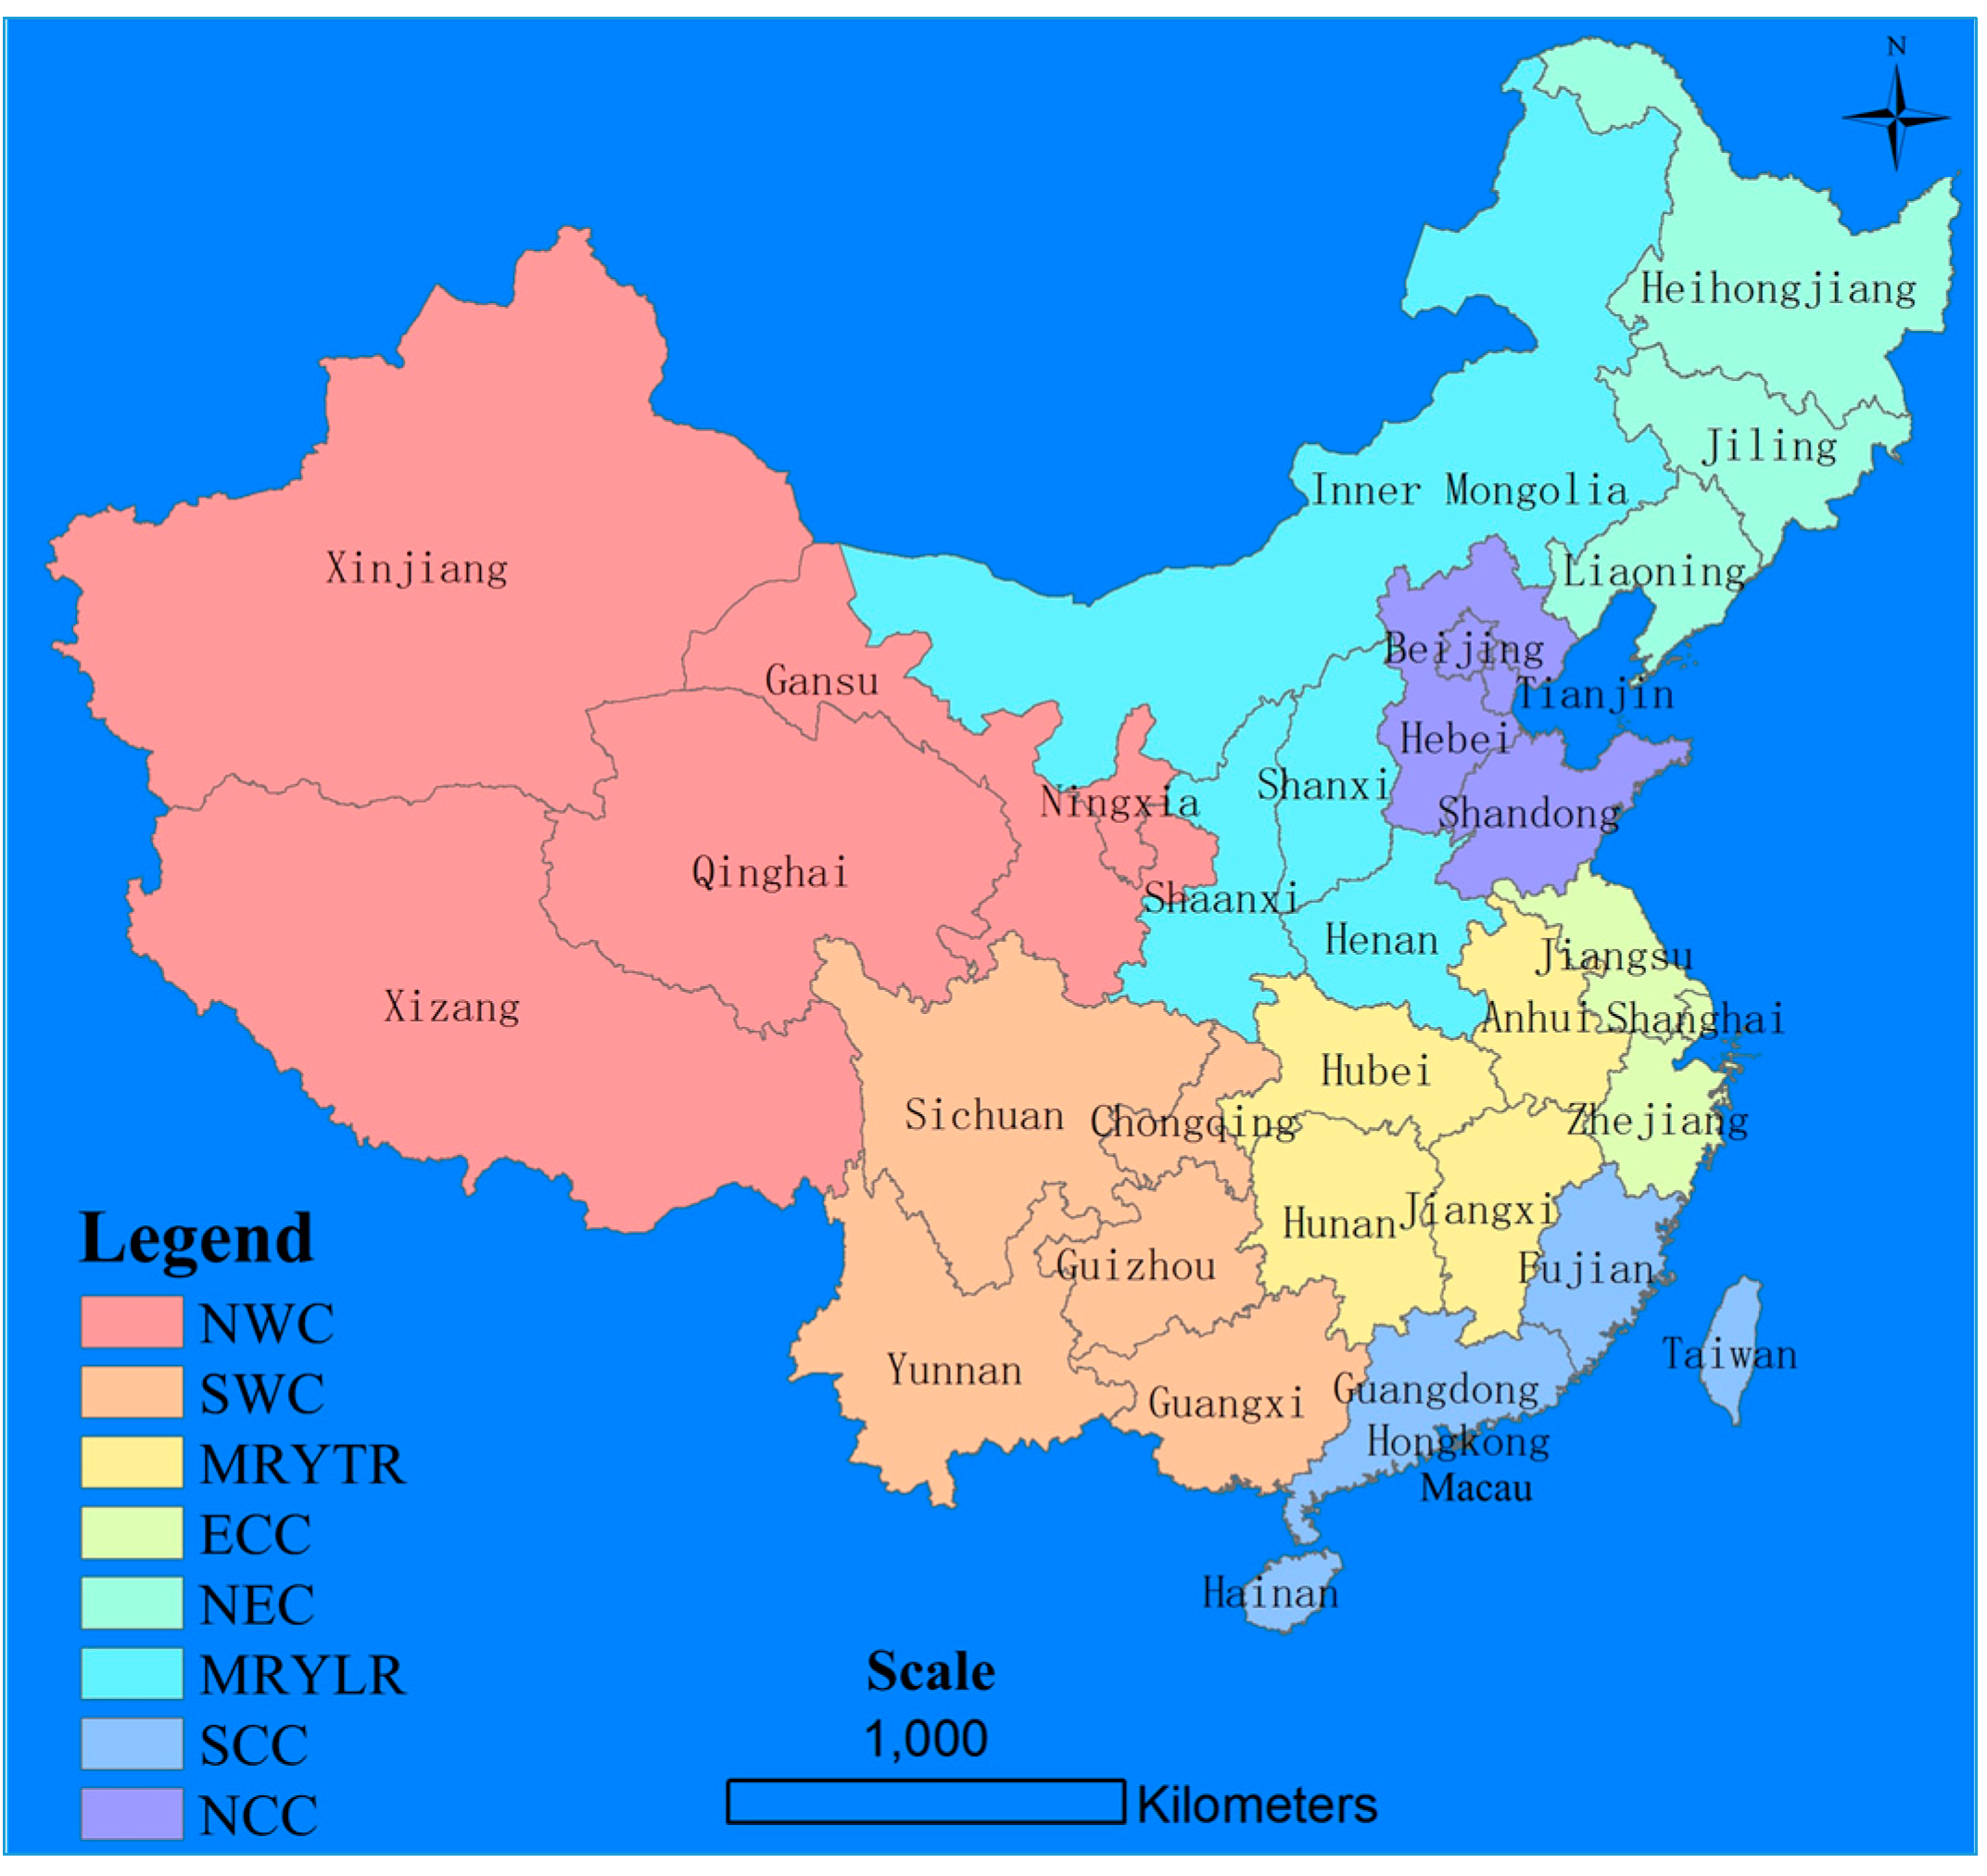
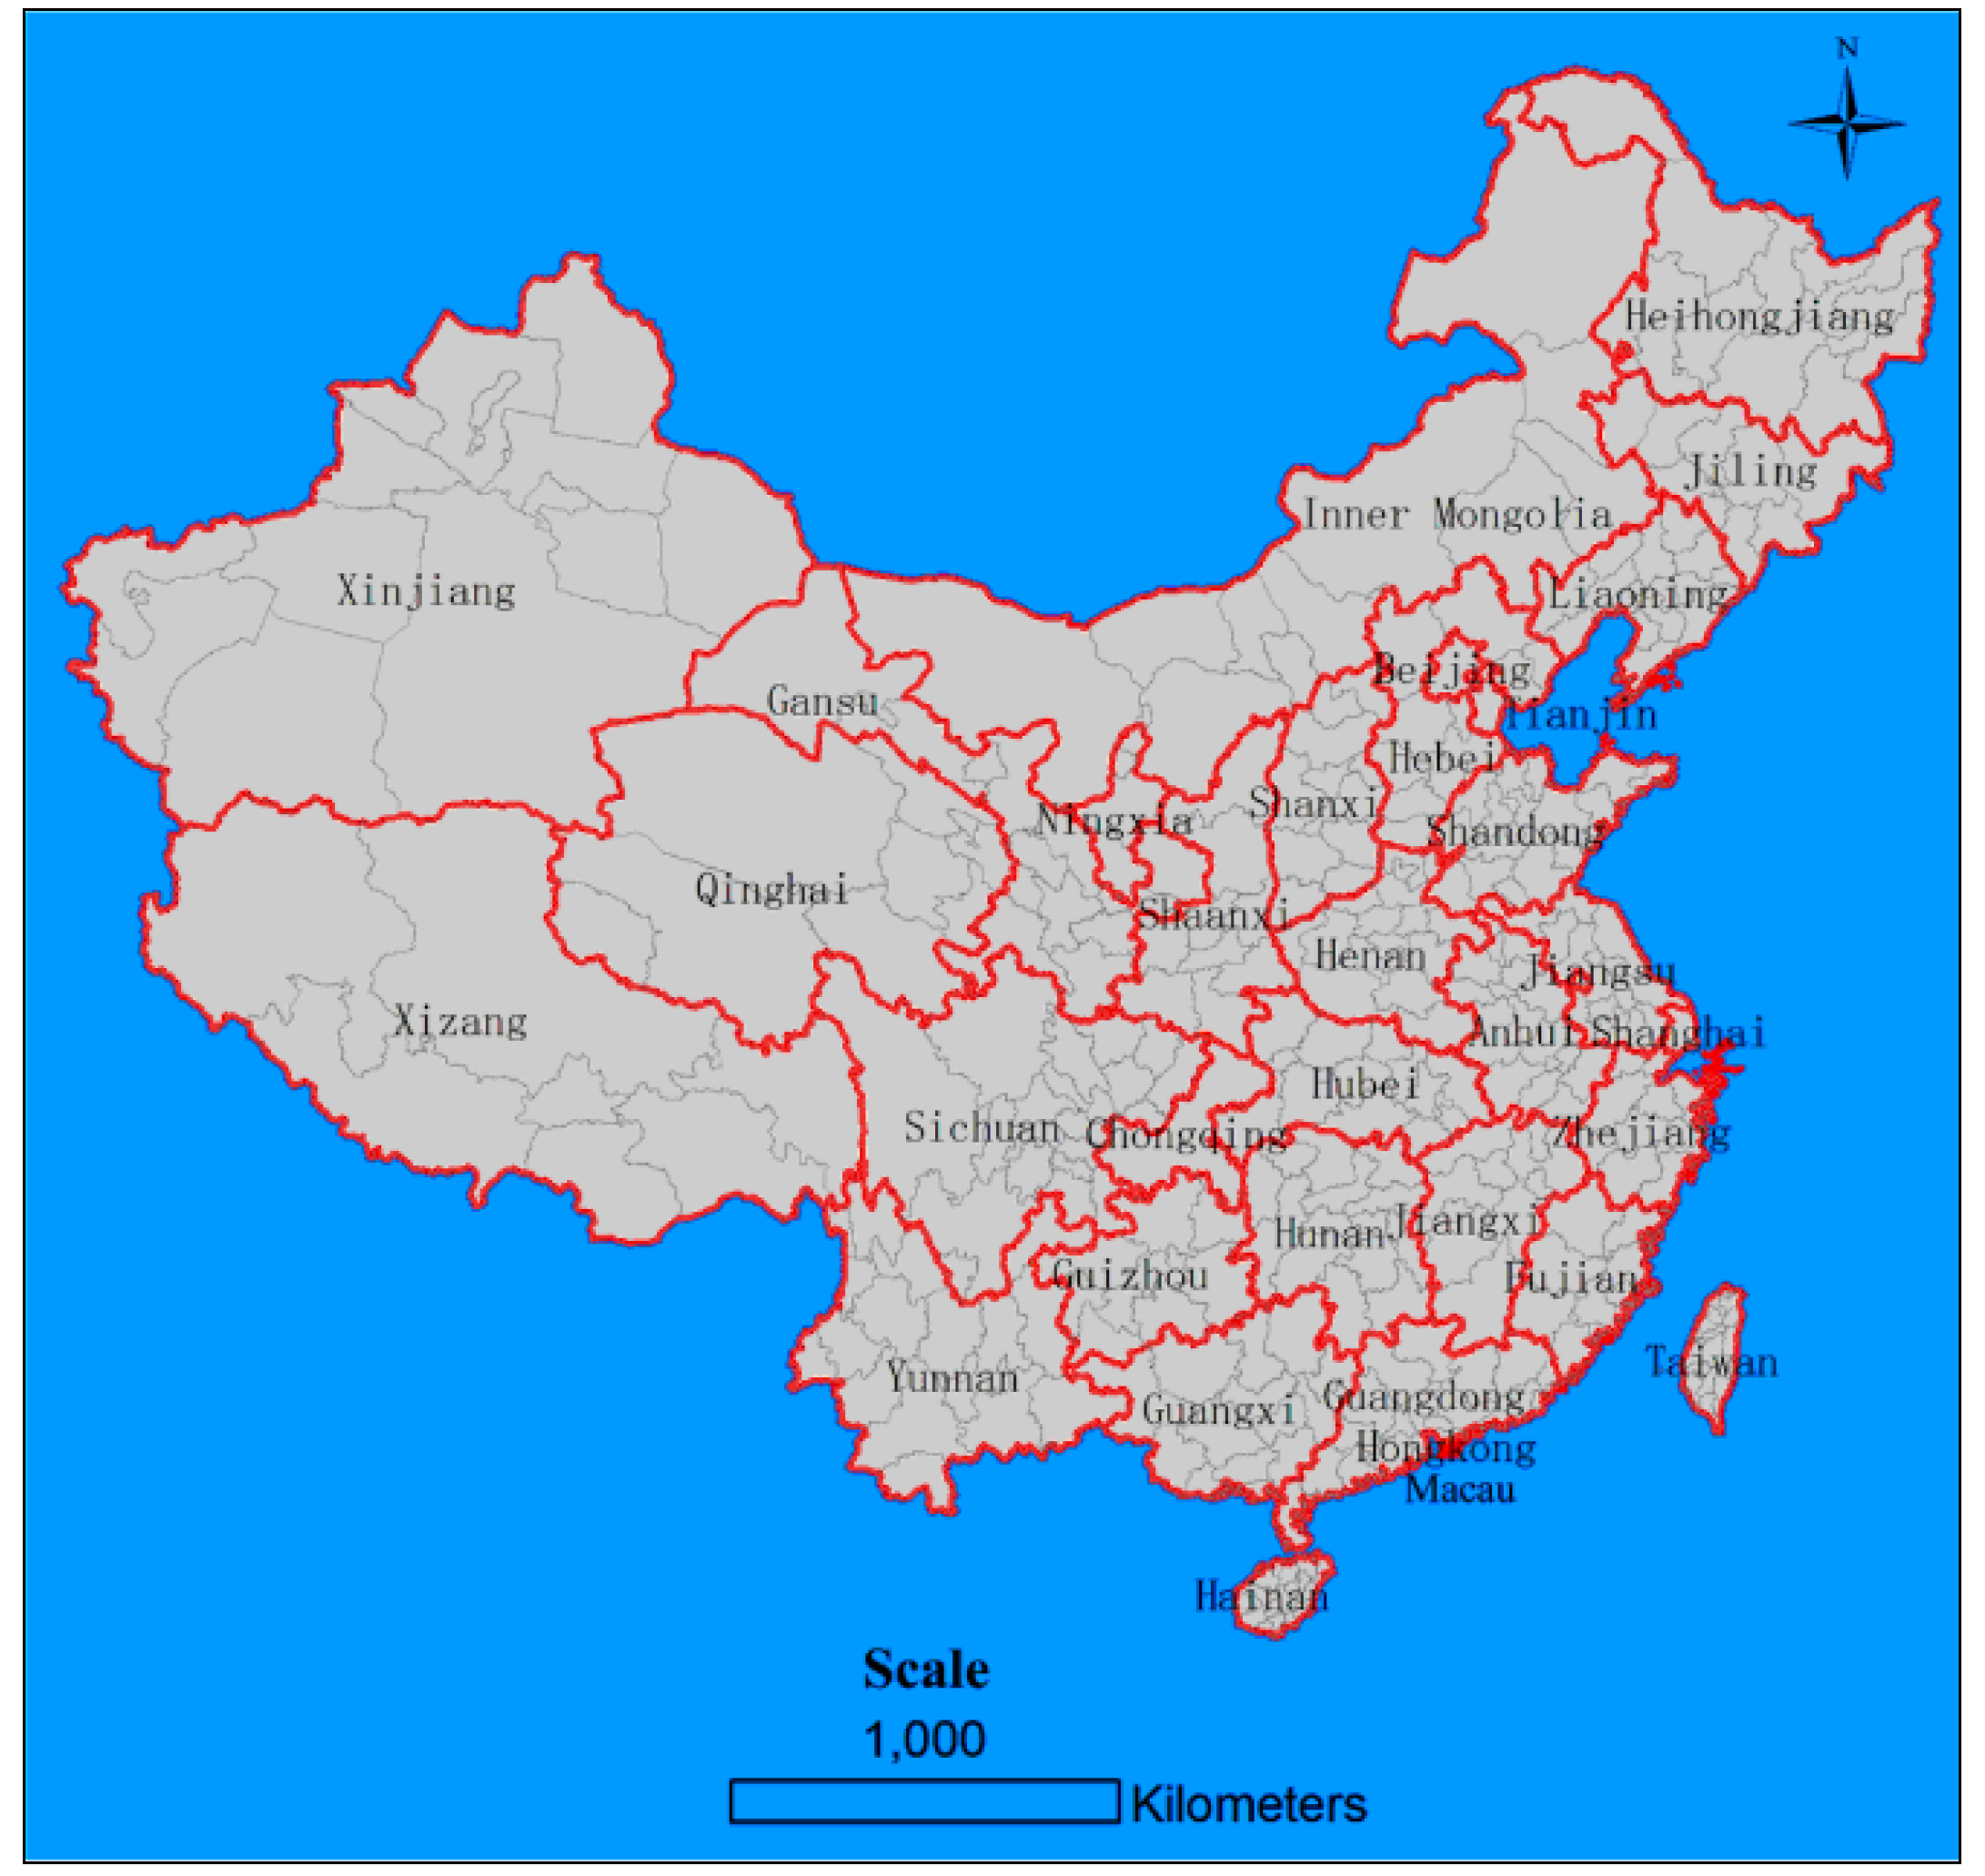
2.1. Study Area and Original Data

| Economic Region | Provinces |
|---|---|
| Northeast China (NEC) | Liaoning, Jilin and Heilongjiang |
| Northern Coastal China (NCC) | Beijing, Tianjin, Hebei and Shandong |
| Southern Coastal China (SCC) | Fujian, Guangdong, and Hainan, Taiwan, Hong Kong and Macao |
| Eastern Coastal China (ECC) | Shanghai, Jiangsu and Zhejiang |
| Middle Reaches of the Yellow River (MRYLR) | Shaanxi, Shanxi, Henan and Inner Mongolia |
| Middle Reaches of the Yangtze River (MRYTR) | Hubei, Hunan, Jiangxi and Anhui |
| Southwest China (SWC) | Yunnan, Guizhou, Sichuan, Chongqing and Guangxi |
| Northwest China (NWC) | Gansu, Qinghai, Ningxia, Xizang(Tibet) and Xinjiang |

| Province | Number of Prefectural Cities | Province | Number of Prefectural Cities |
|---|---|---|---|
| Anhui | 17 | Jiangxi | 11 |
| Beijing | 1 | Jilin | 9 |
| Chongqing | 1 | Liaoning | 14 |
| Fujian | 9 | Ningxia | 4 |
| Gansu | 14 | Qinghai | 8 |
| Guangdong | 22 | Shaanxi | 10 |
| Guangxi | 13 | Shandong | 17 |
| Guizhou | 9 | Shanghai | 1 |
| Hainan | 18 | Shanxi | 11 |
| Hebei | 11 | Sichuan | 21 |
| Heilongjiang | 13 | Tianjin | 1 |
| Henan | 17 | Xinjiang | 15 |
| Hubei | 15 | Xizang | 7 |
| Hunan | 13 | Yunnan | 16 |
| Inner Mongolia | 12 | Zhejiang | 11 |
| Jiangsu | 13 | - | - |
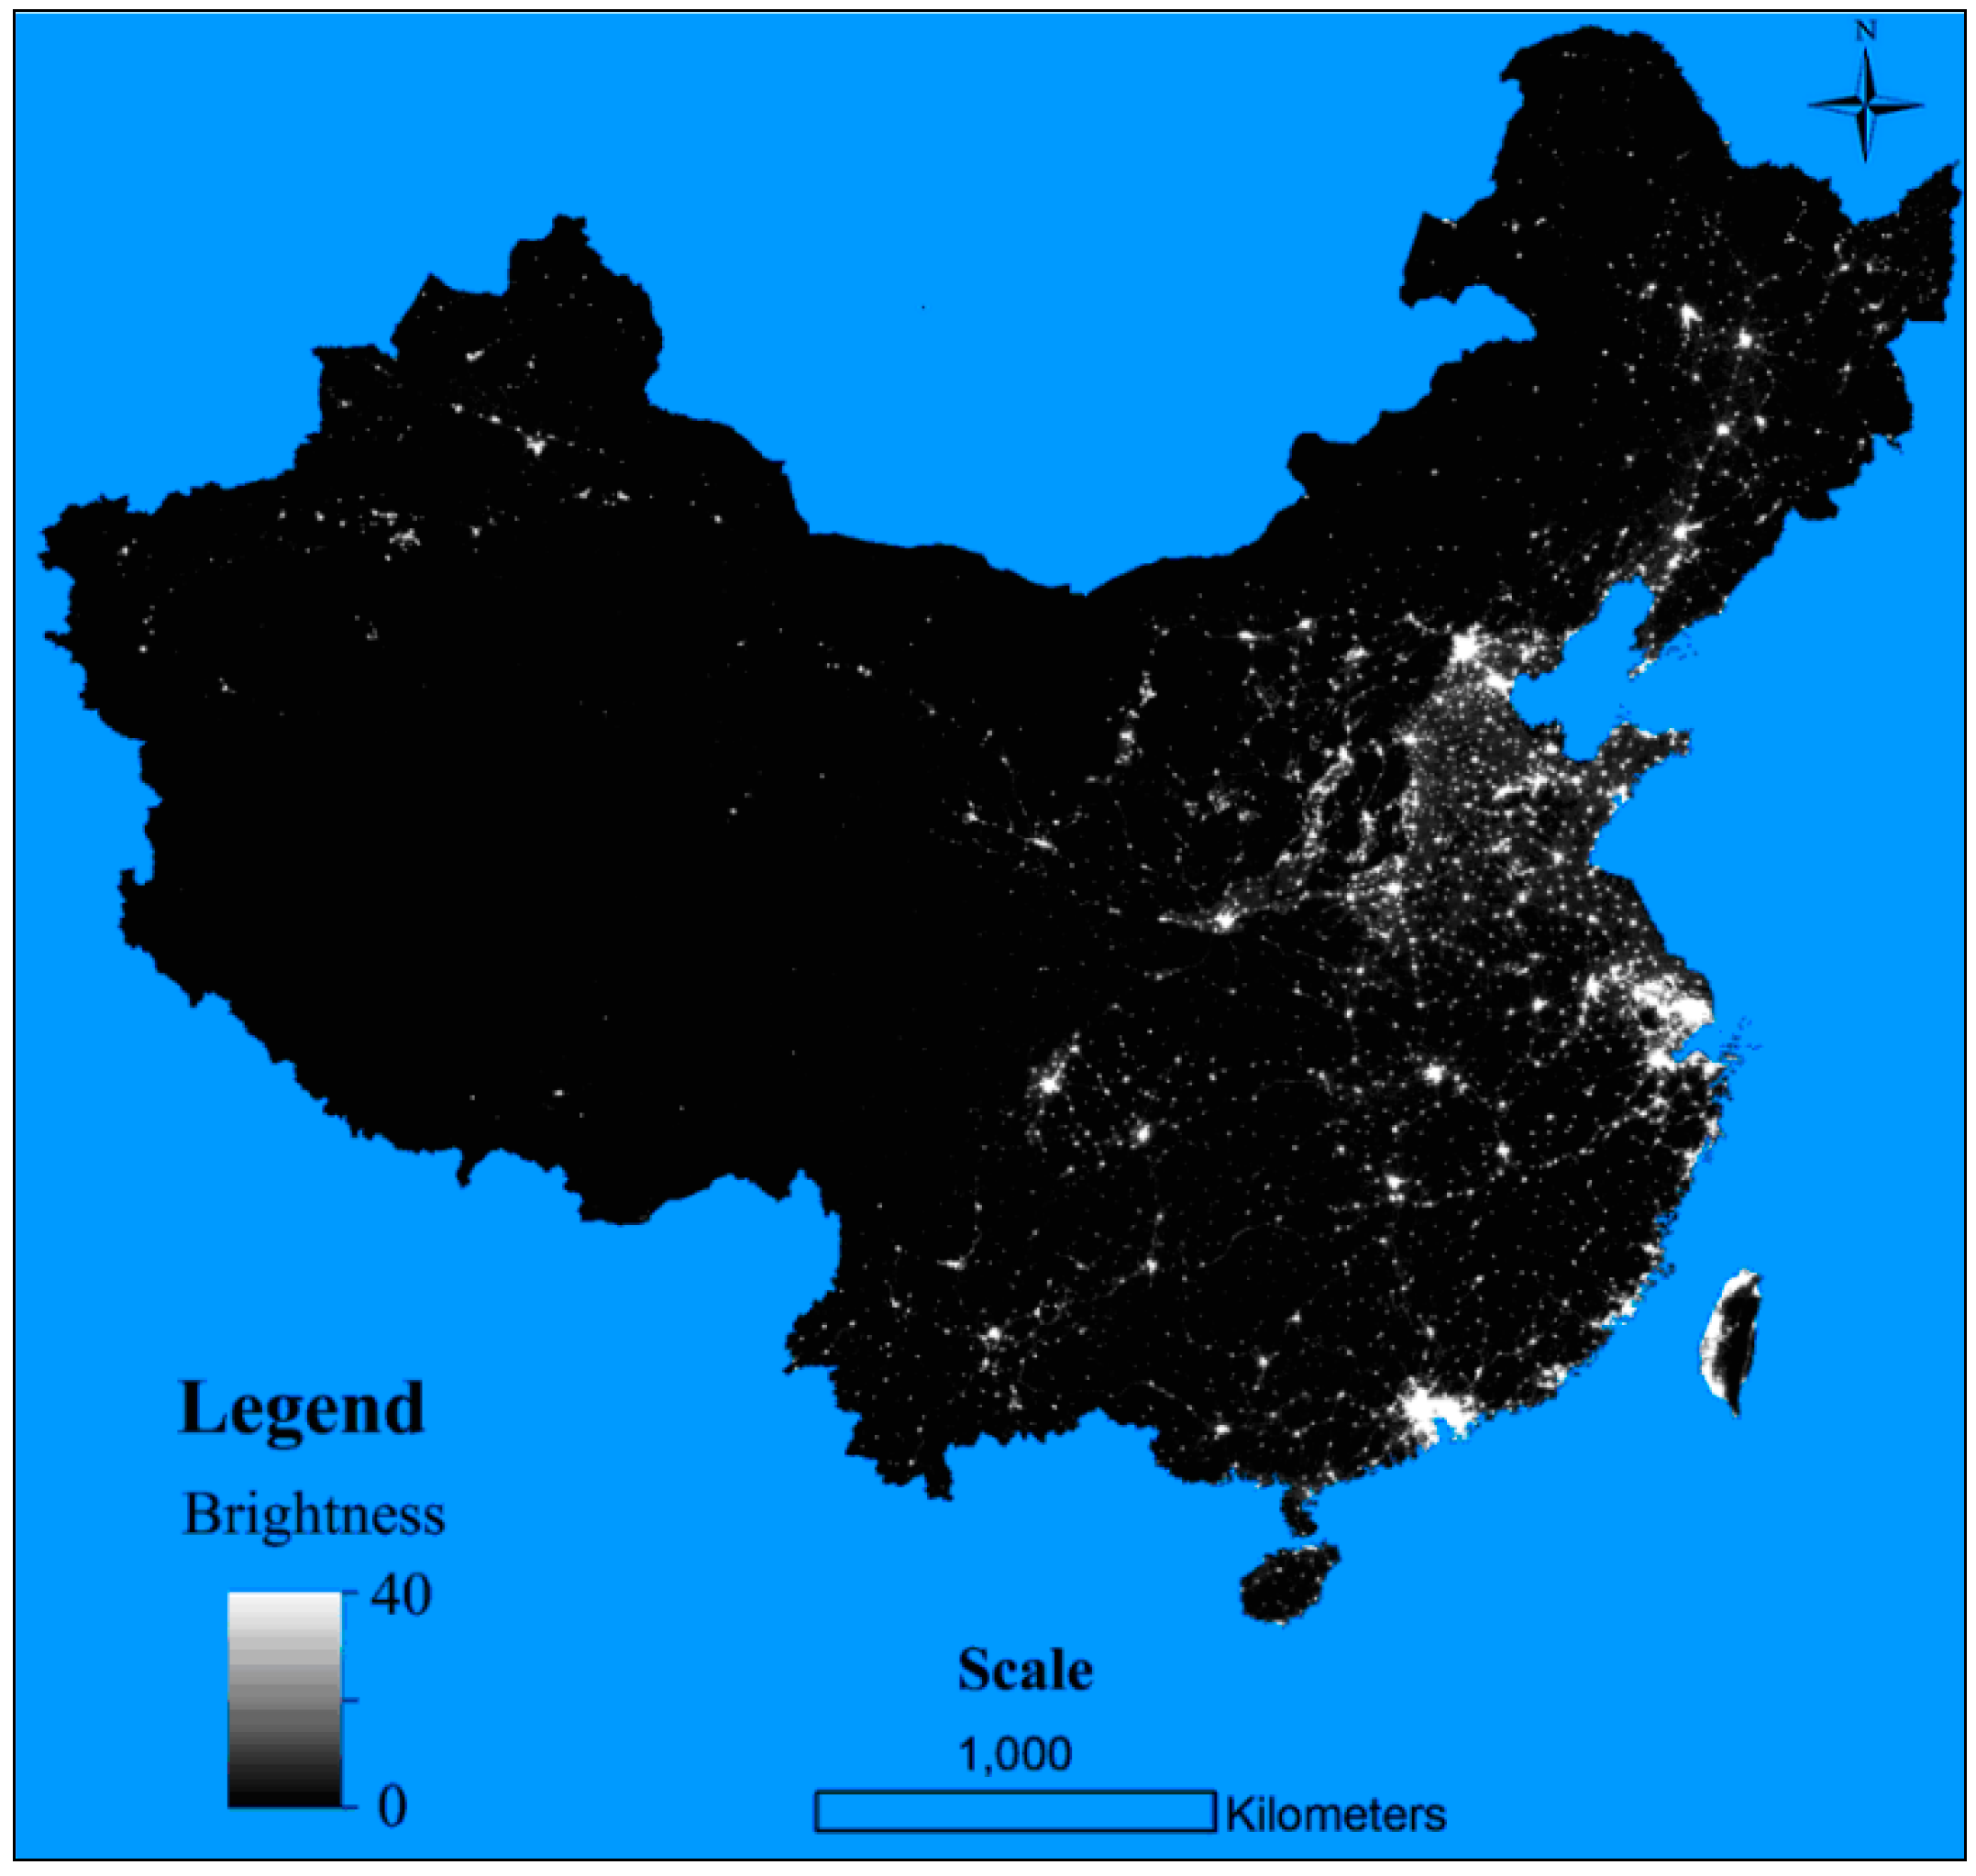
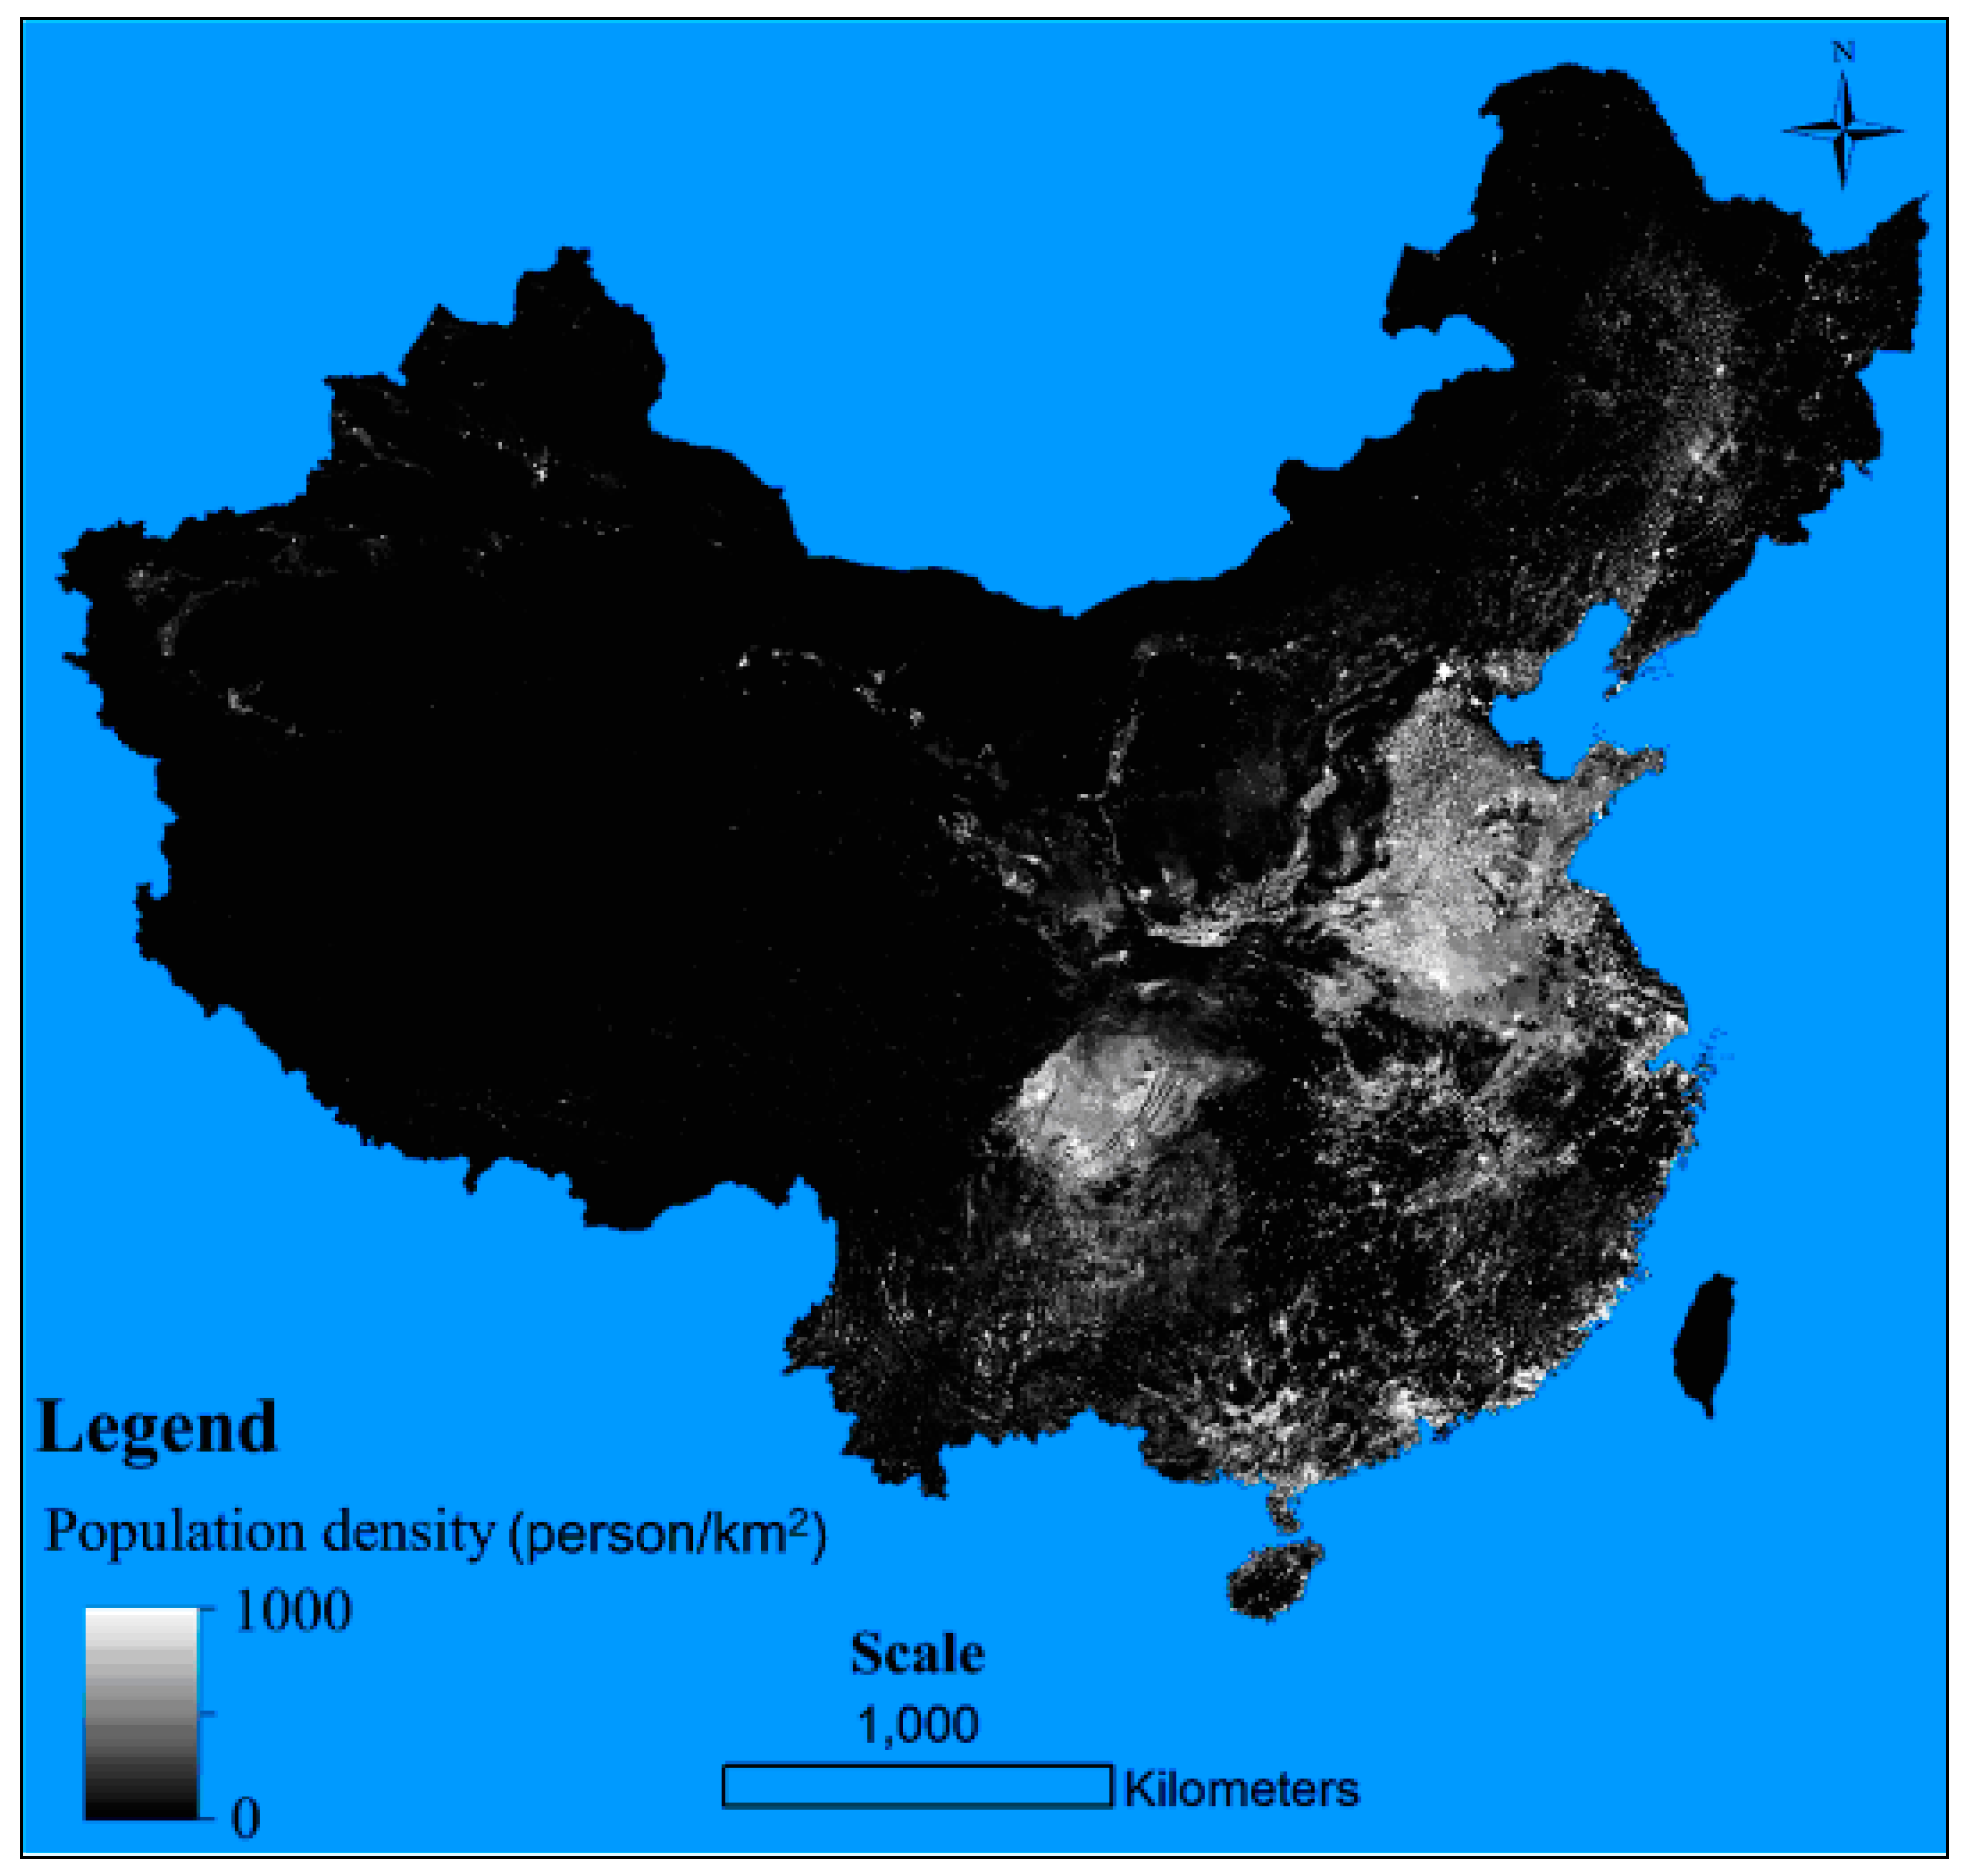
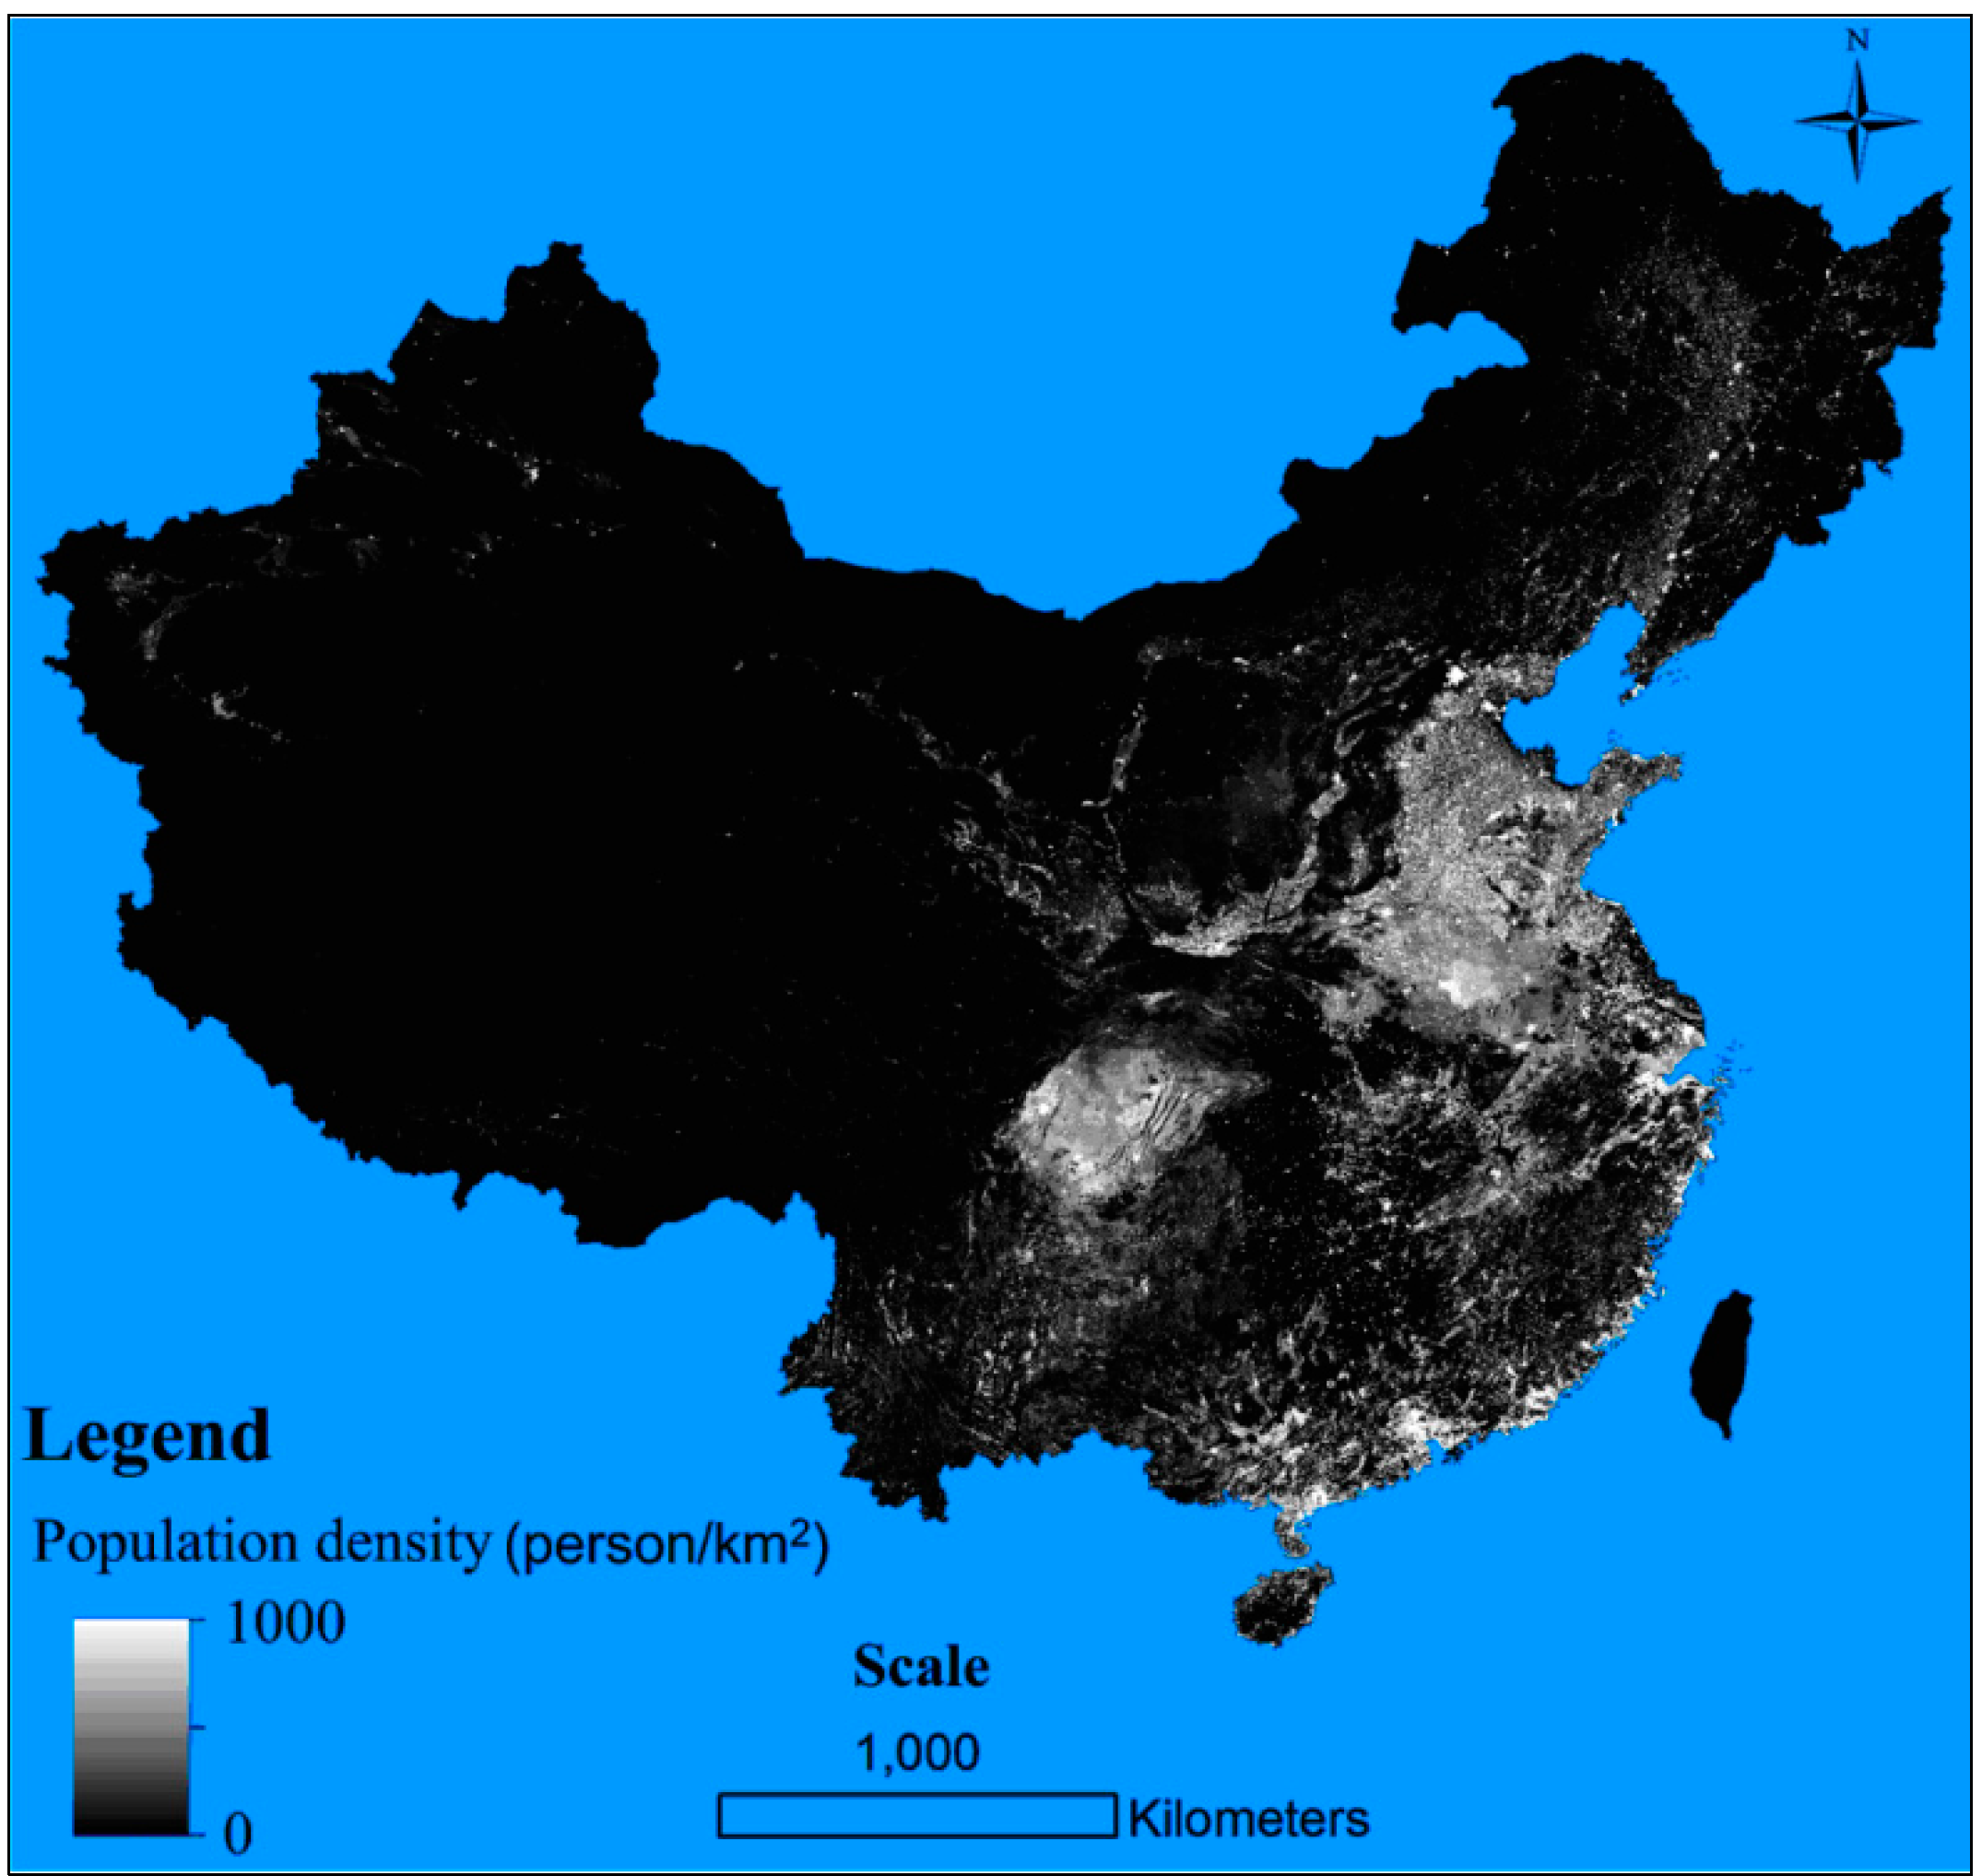
2.2. Aggregating Night Light Images and Population Grids


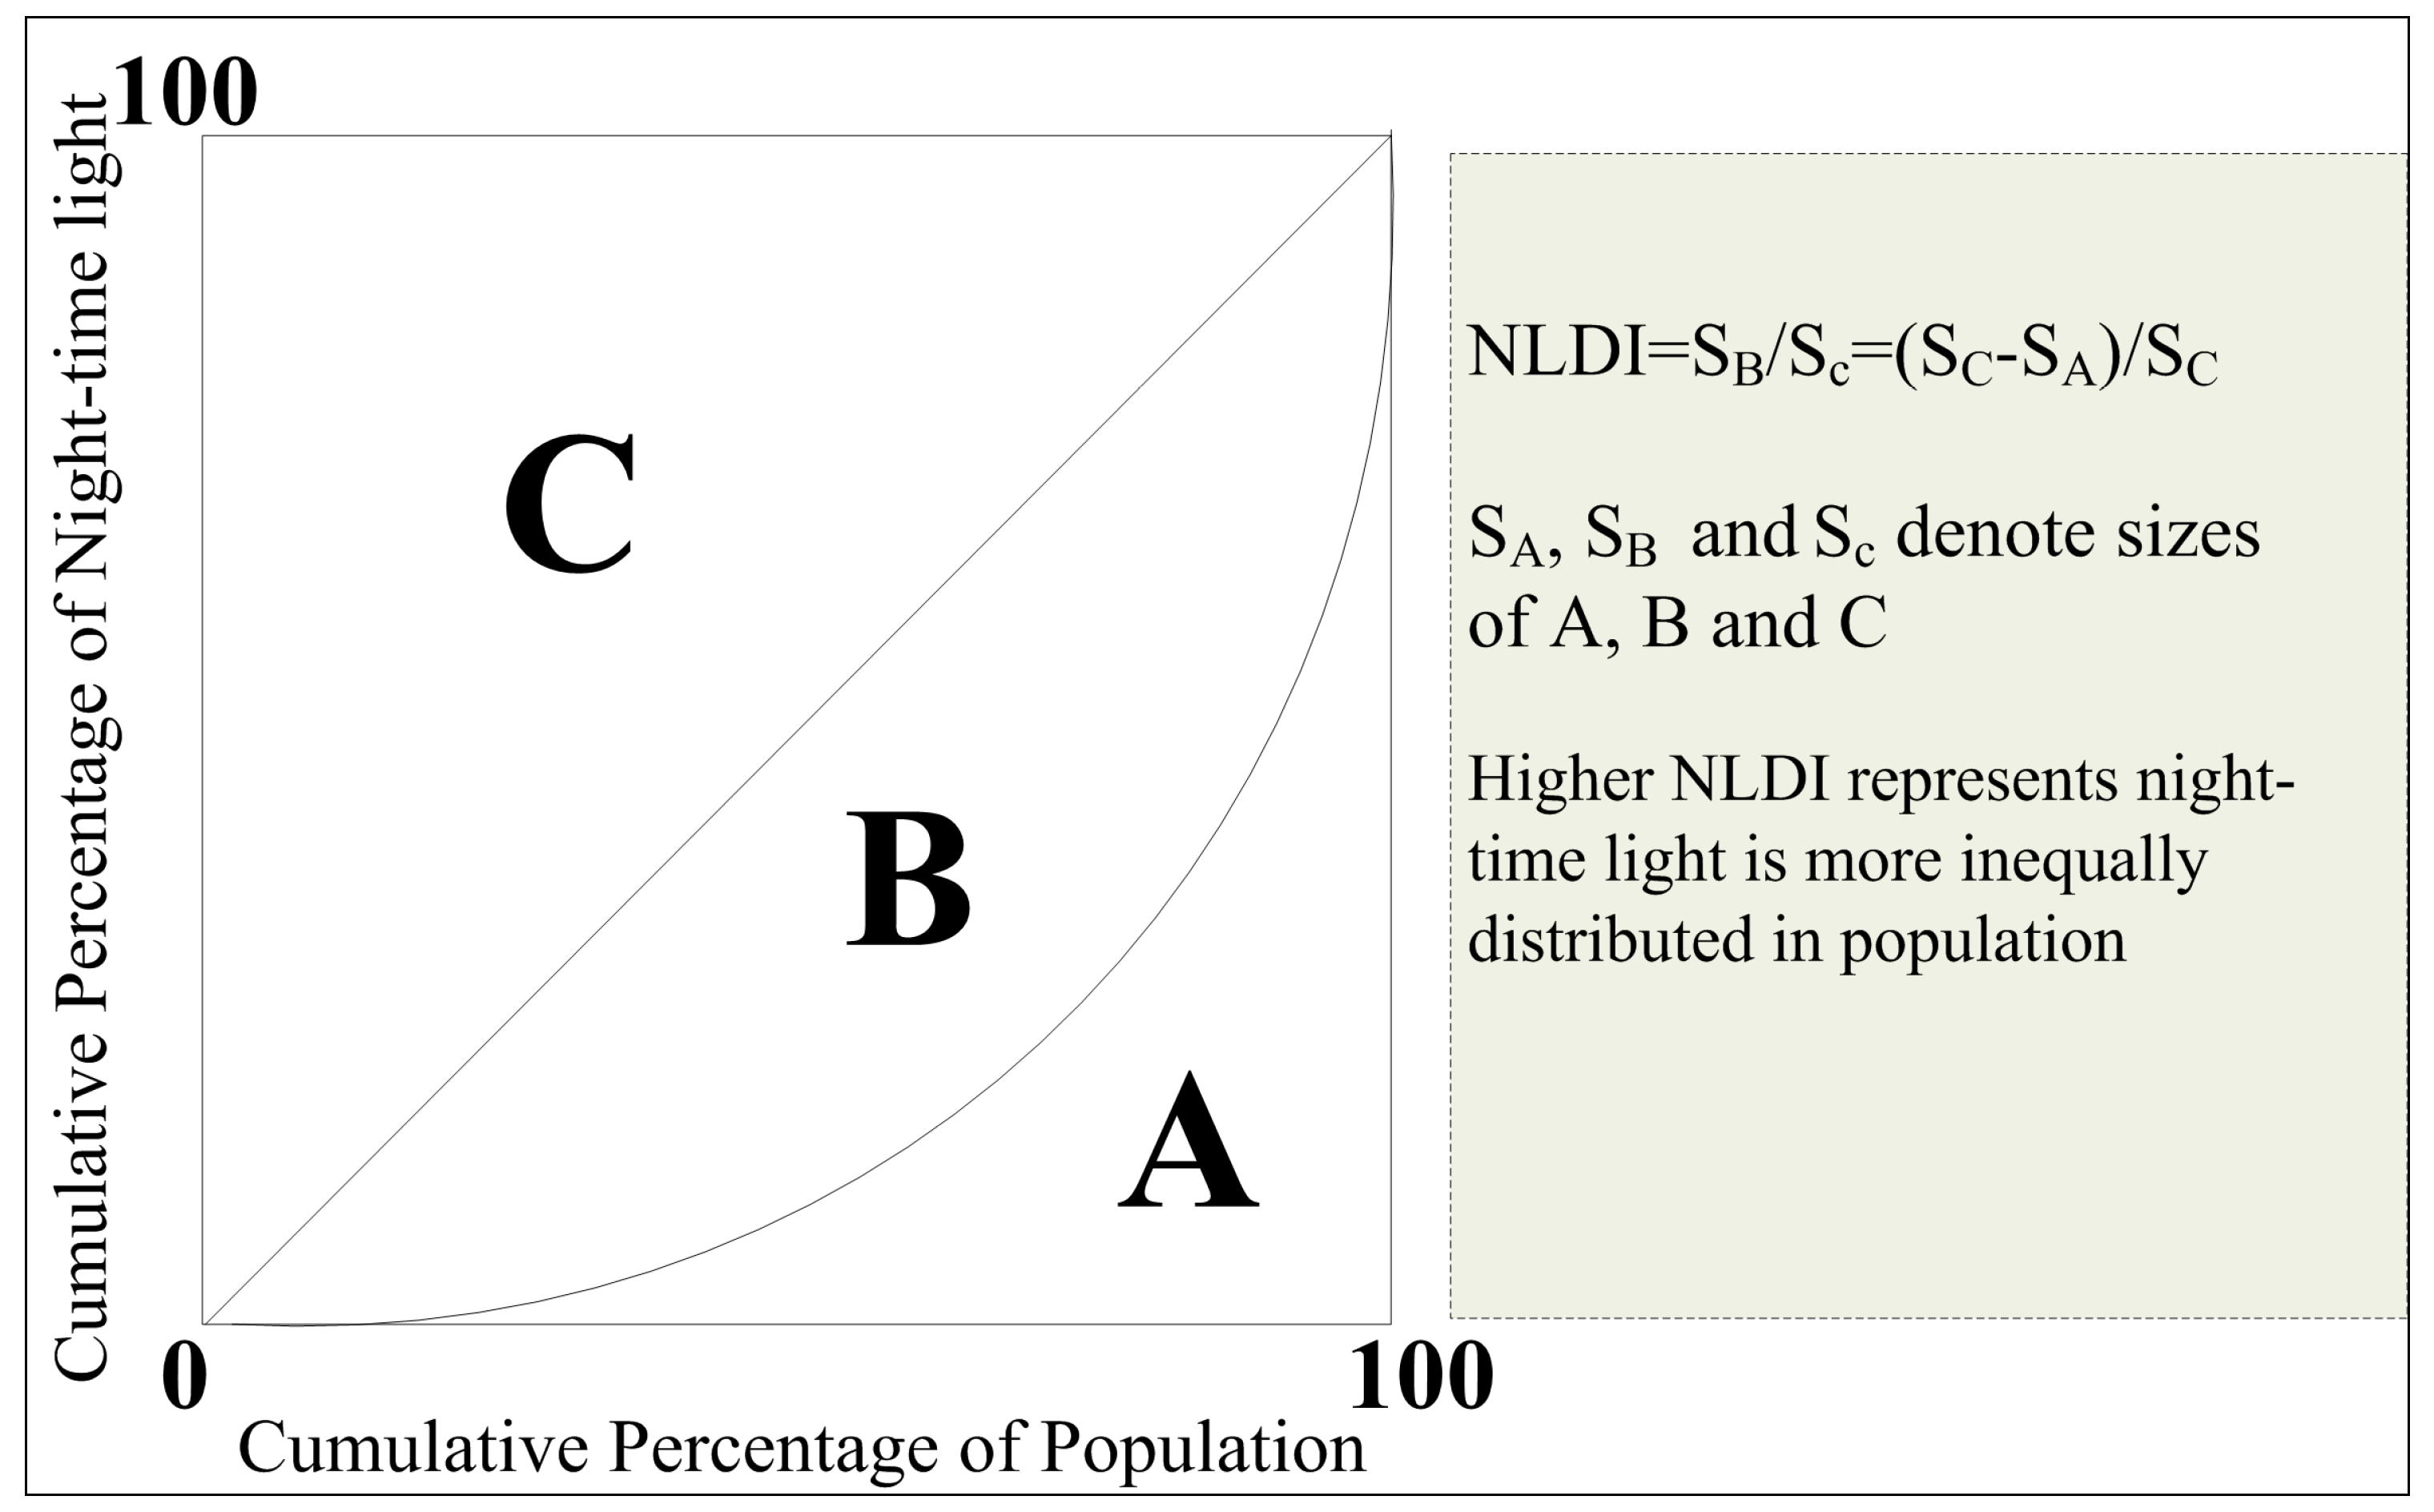
3. Methodology
4. Results and Discussion
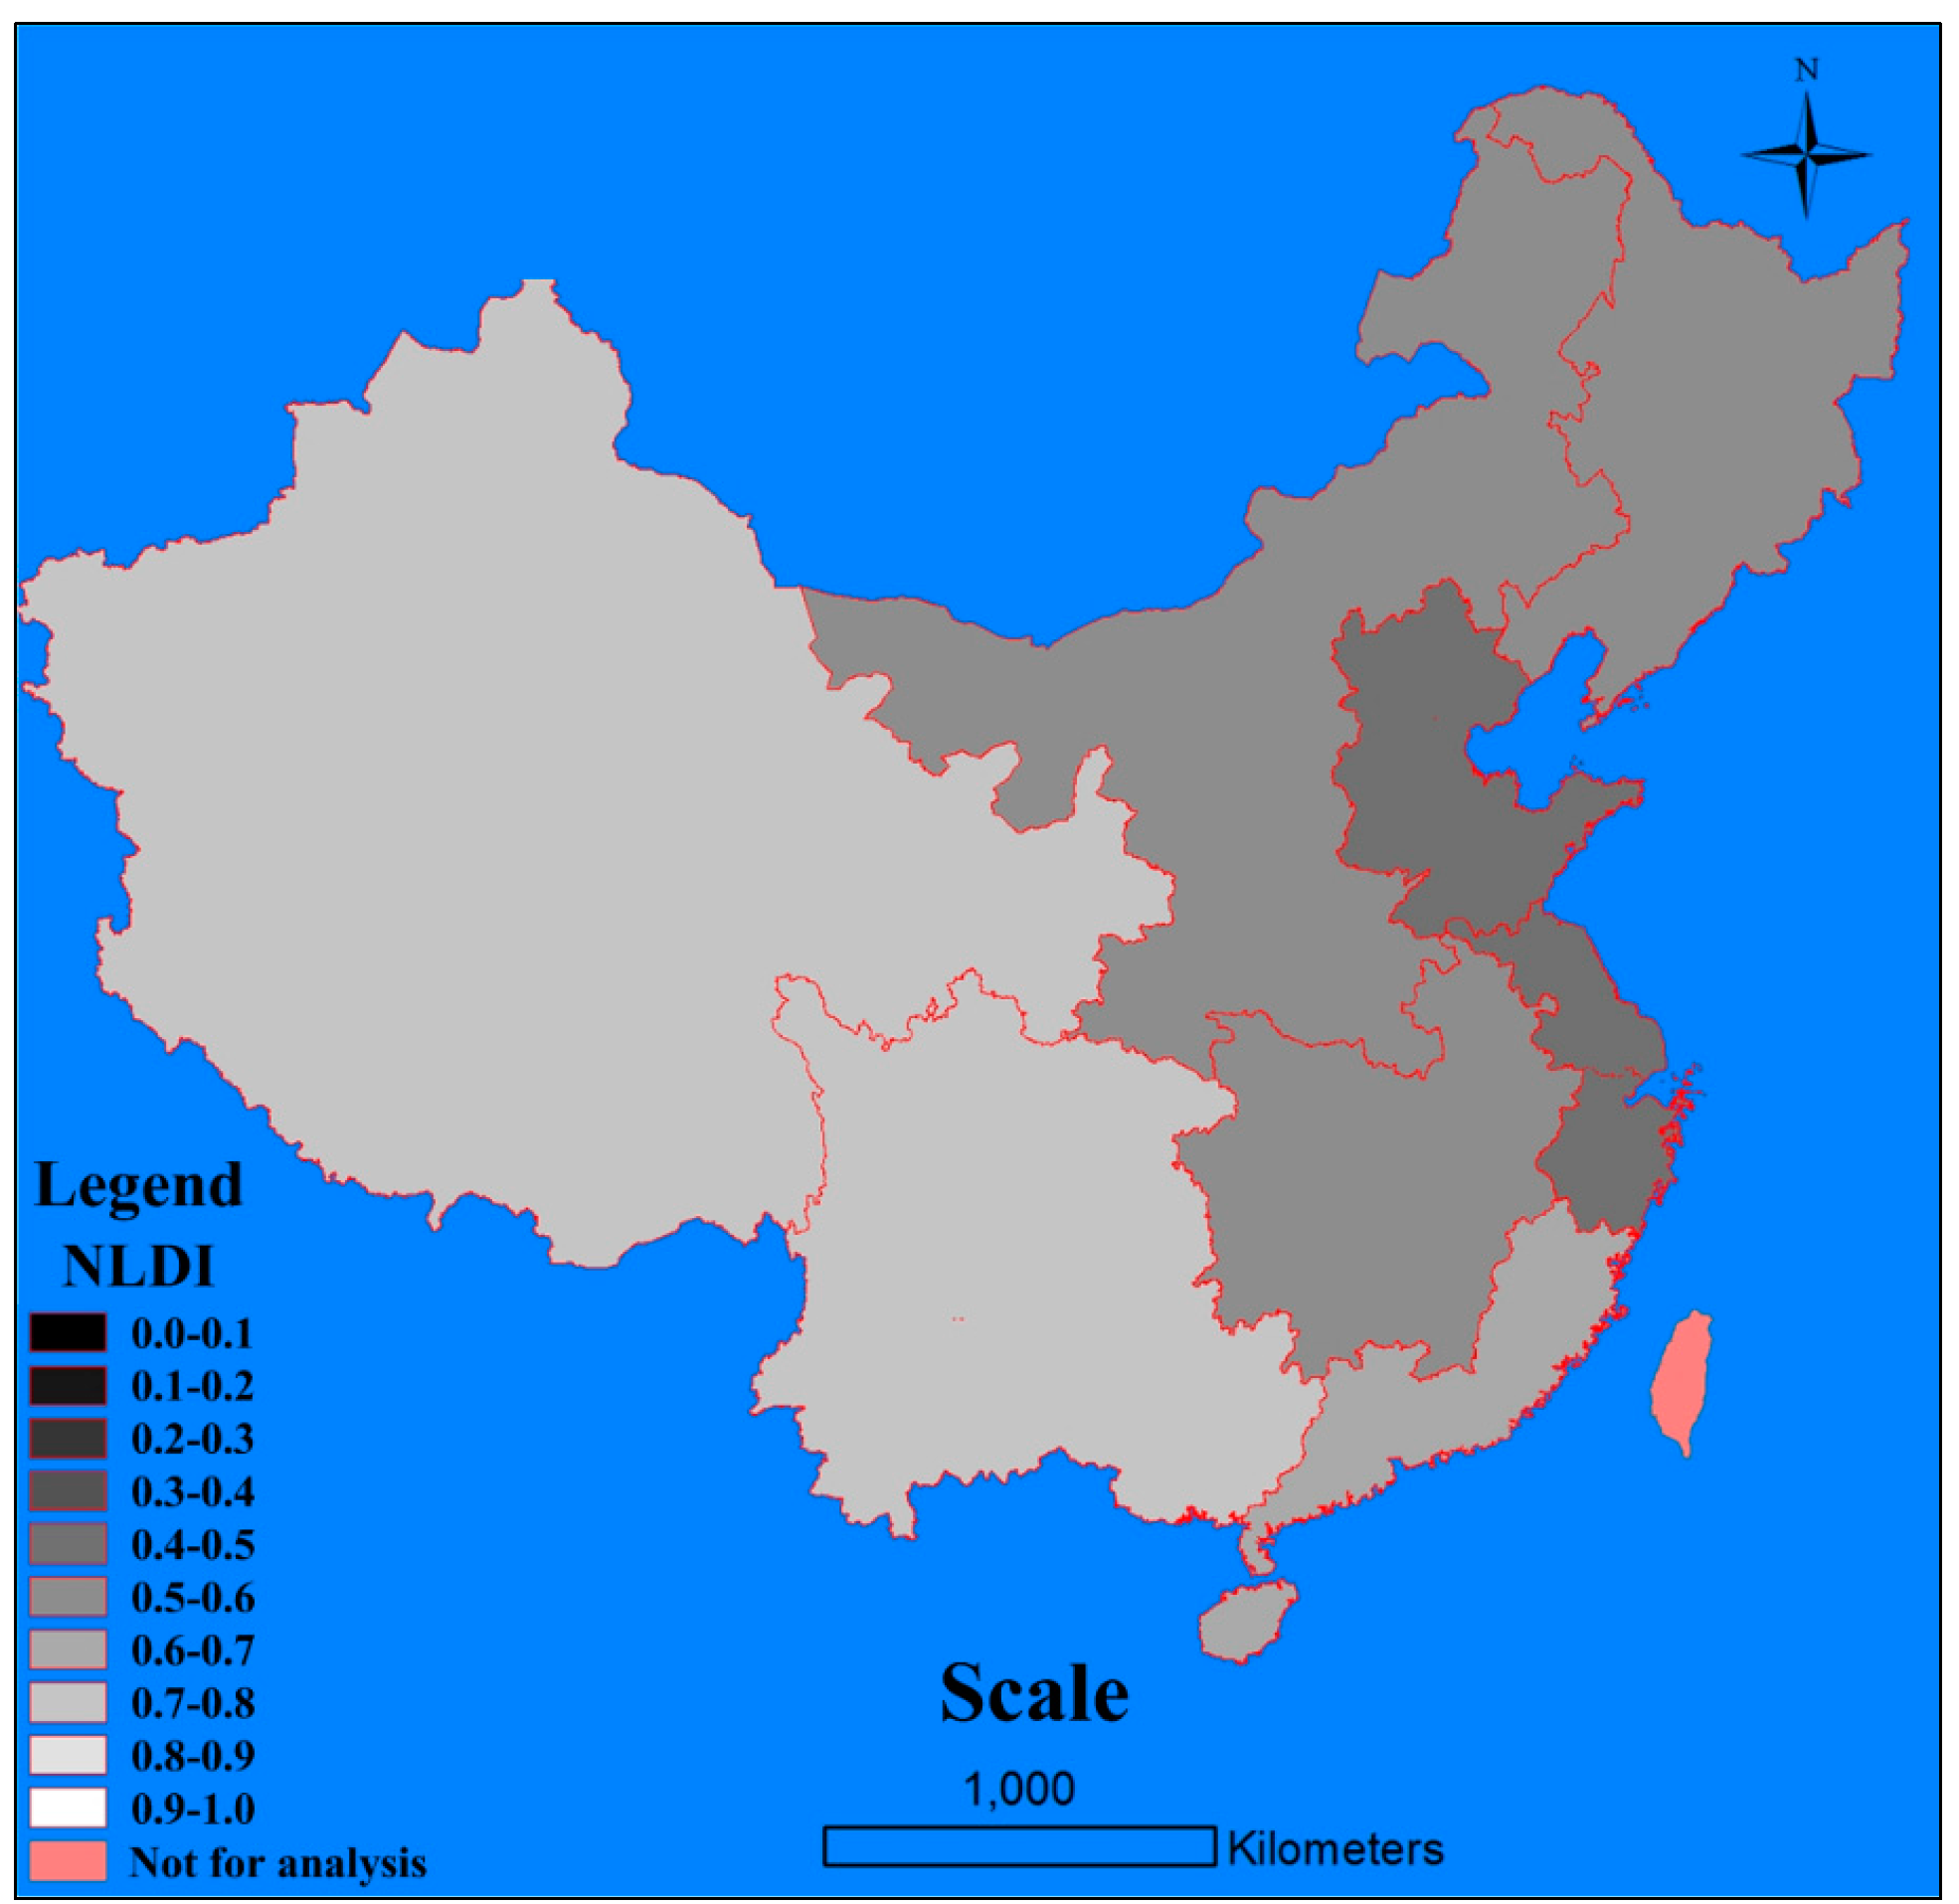
4.1. Regional Inequality of the Economic Regions
| Region | NLDI2005 | NLDI2010 | NLDI Change |
|---|---|---|---|
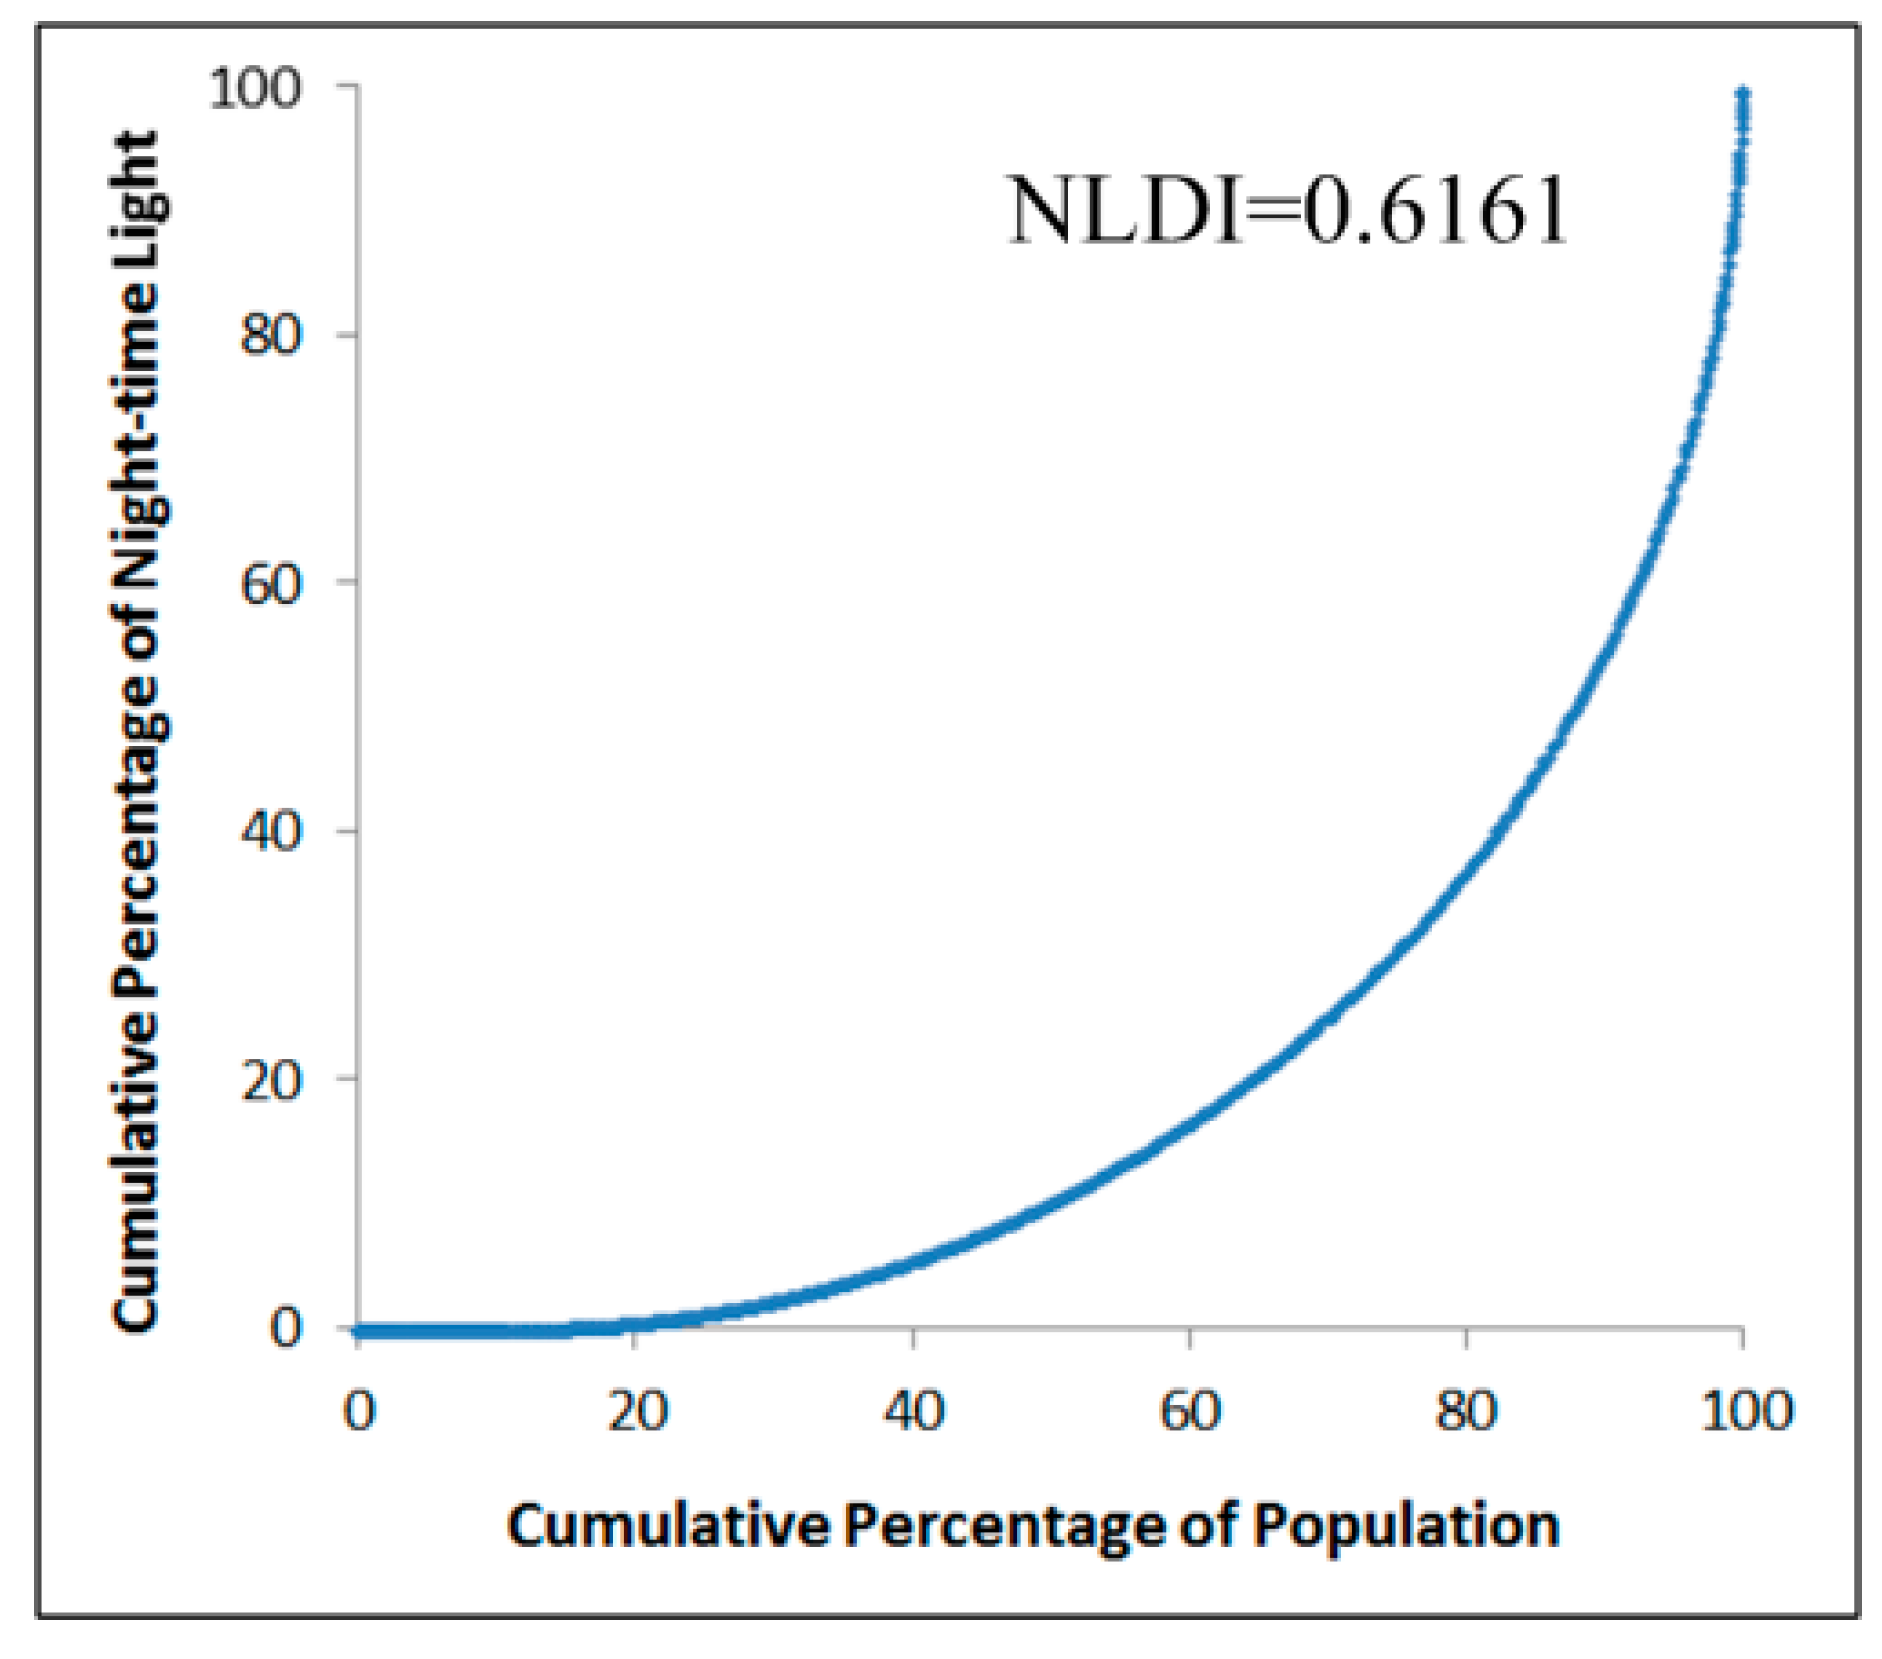
| Mainland China | 0.6161 | 0.5743 | Decrease |
| Northern Coastal China (NCC) | 0.4775 | 0.4312 | Decrease |
| Eastern Coastal China (ECC) | 0.4572 | 0.4882 | Increase |
| Middle Reaches of the Yellow River (MRYLR) | 0.5548 | 0.5190 | Decrease |
| Northeast China (NEC) | 0.5222 | 0.4811 | Decrease |
| Middle Reaches of the Yangtze River (MRYTR) | 0.5798 | 0.5421 | Decrease |
| Southern Coastal China (SCC) | 0.6639 | 0.6081 | Decrease |
| Southwest China (SWC) | 0.7116 | 0.6678 | Decrease |
| Northwest China (NWC) | 0.7251 | 0.6304 | Decrease |

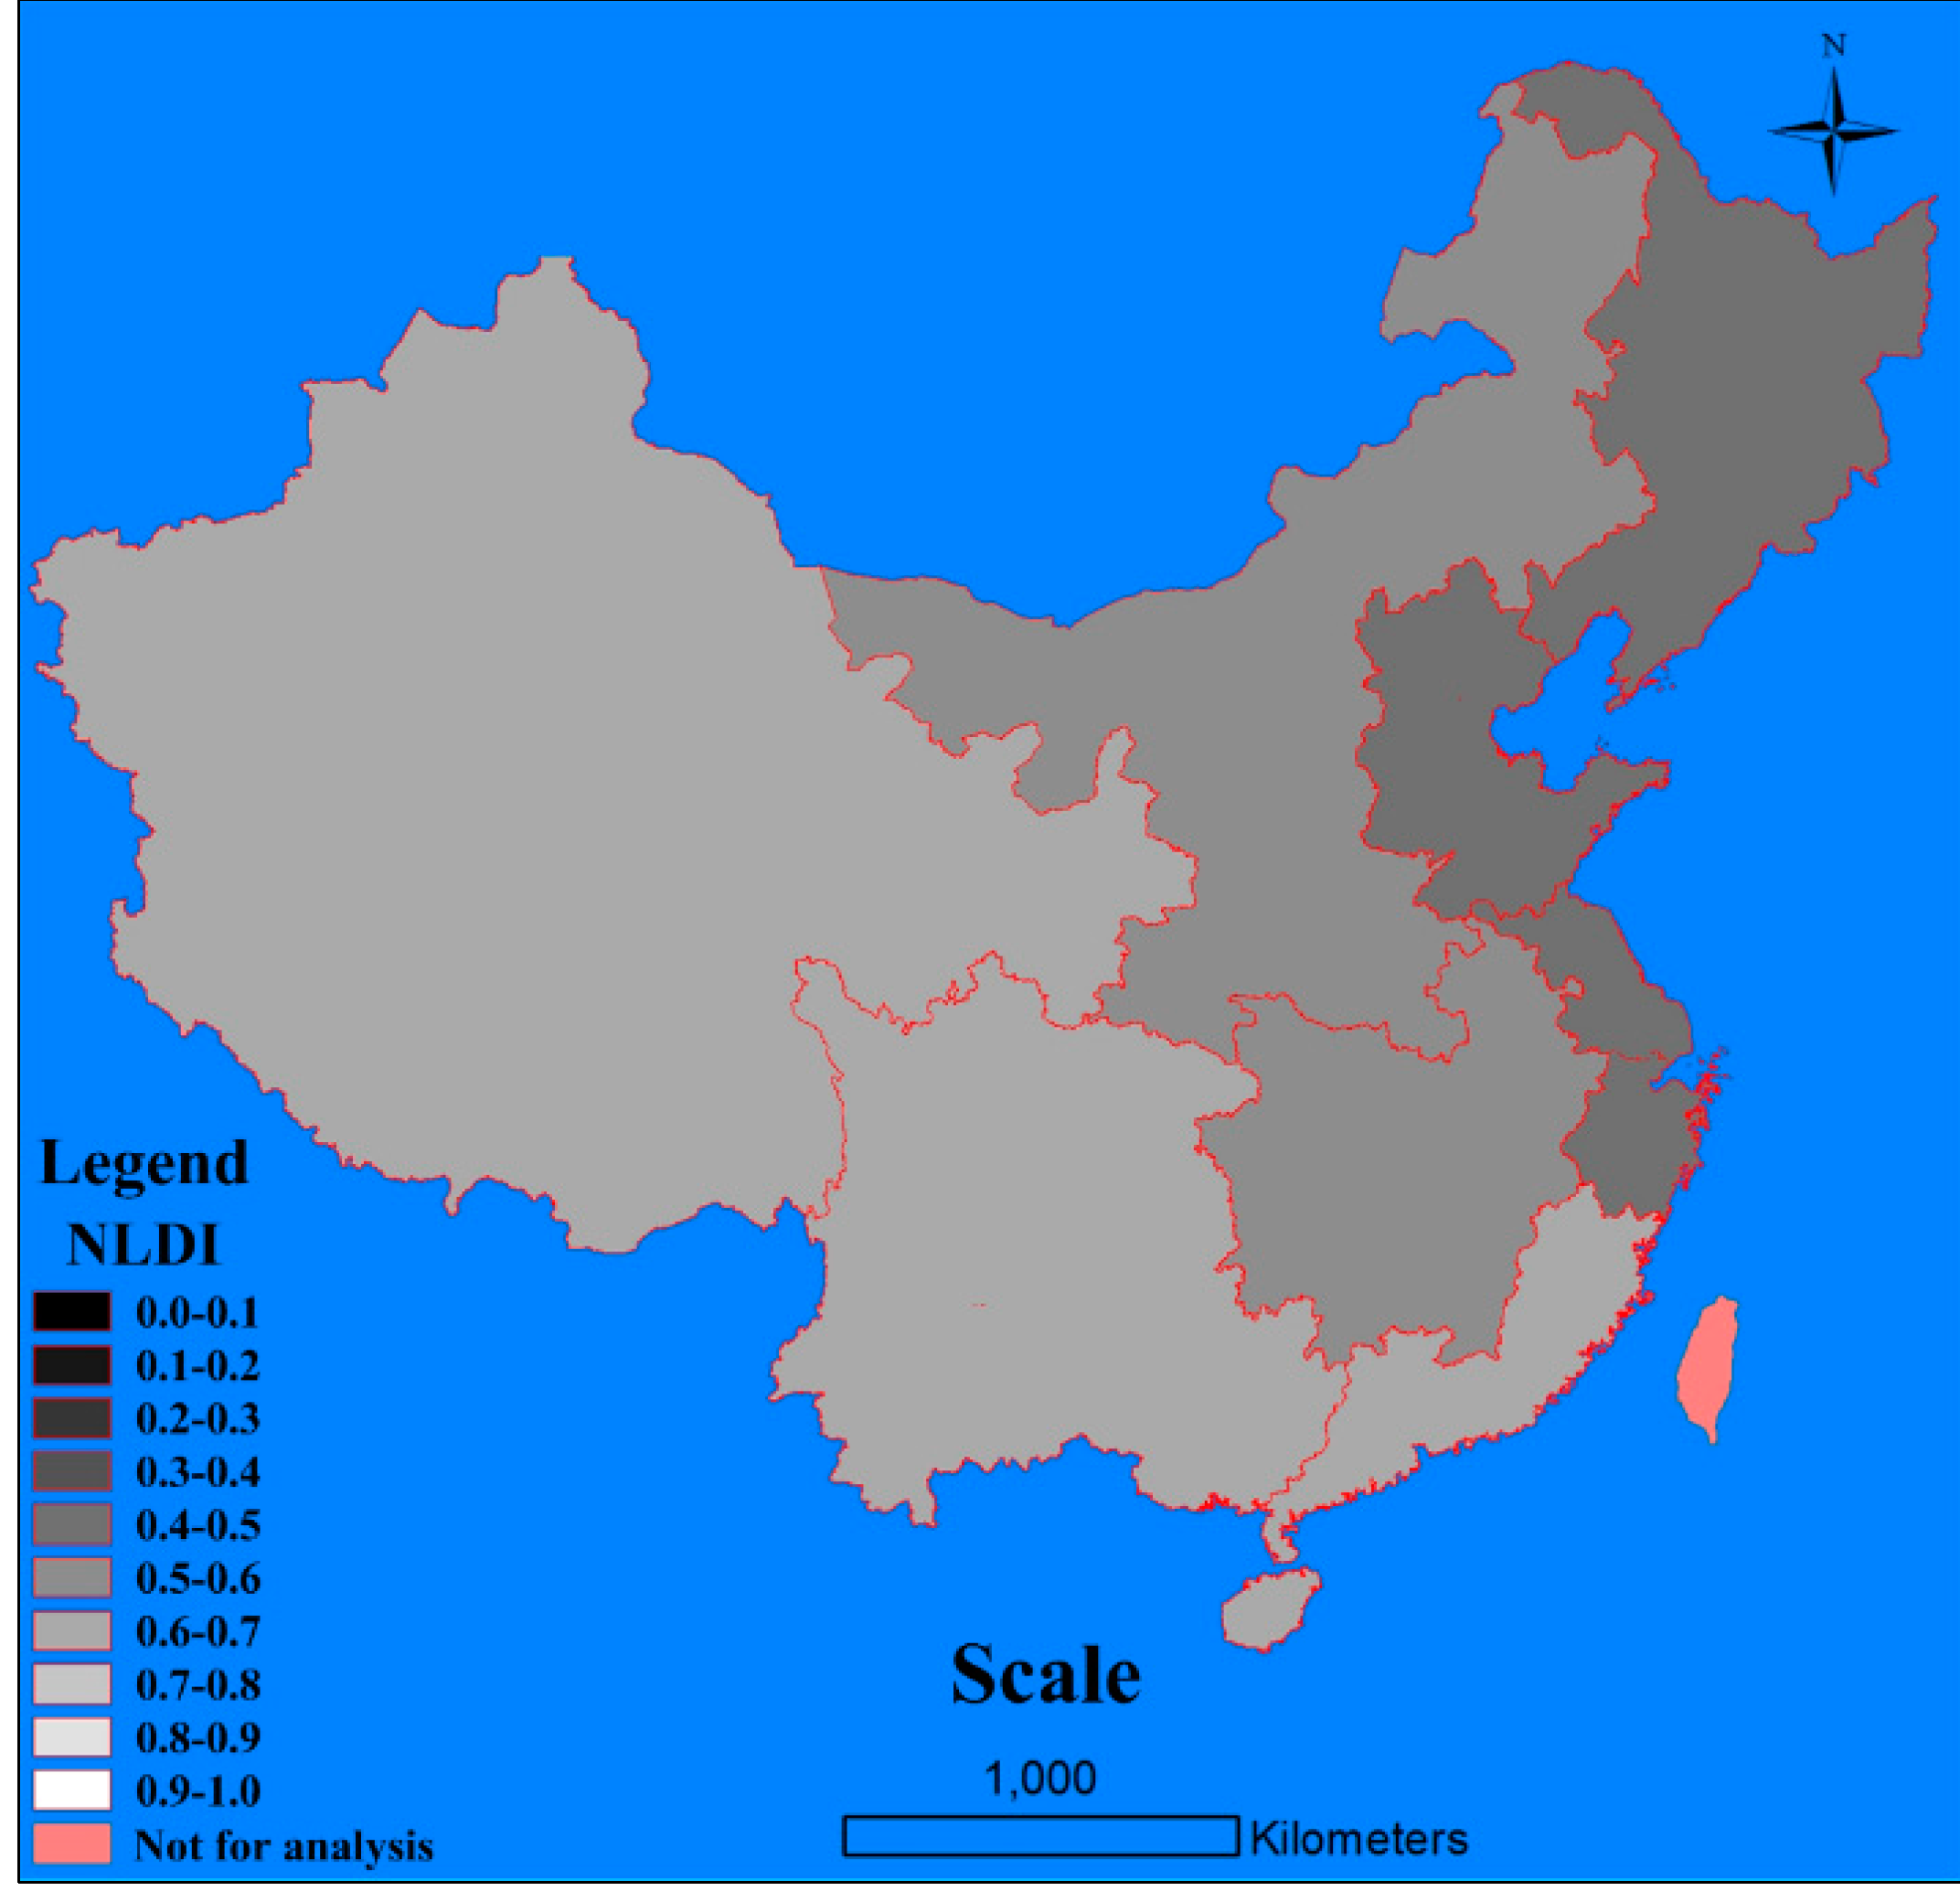
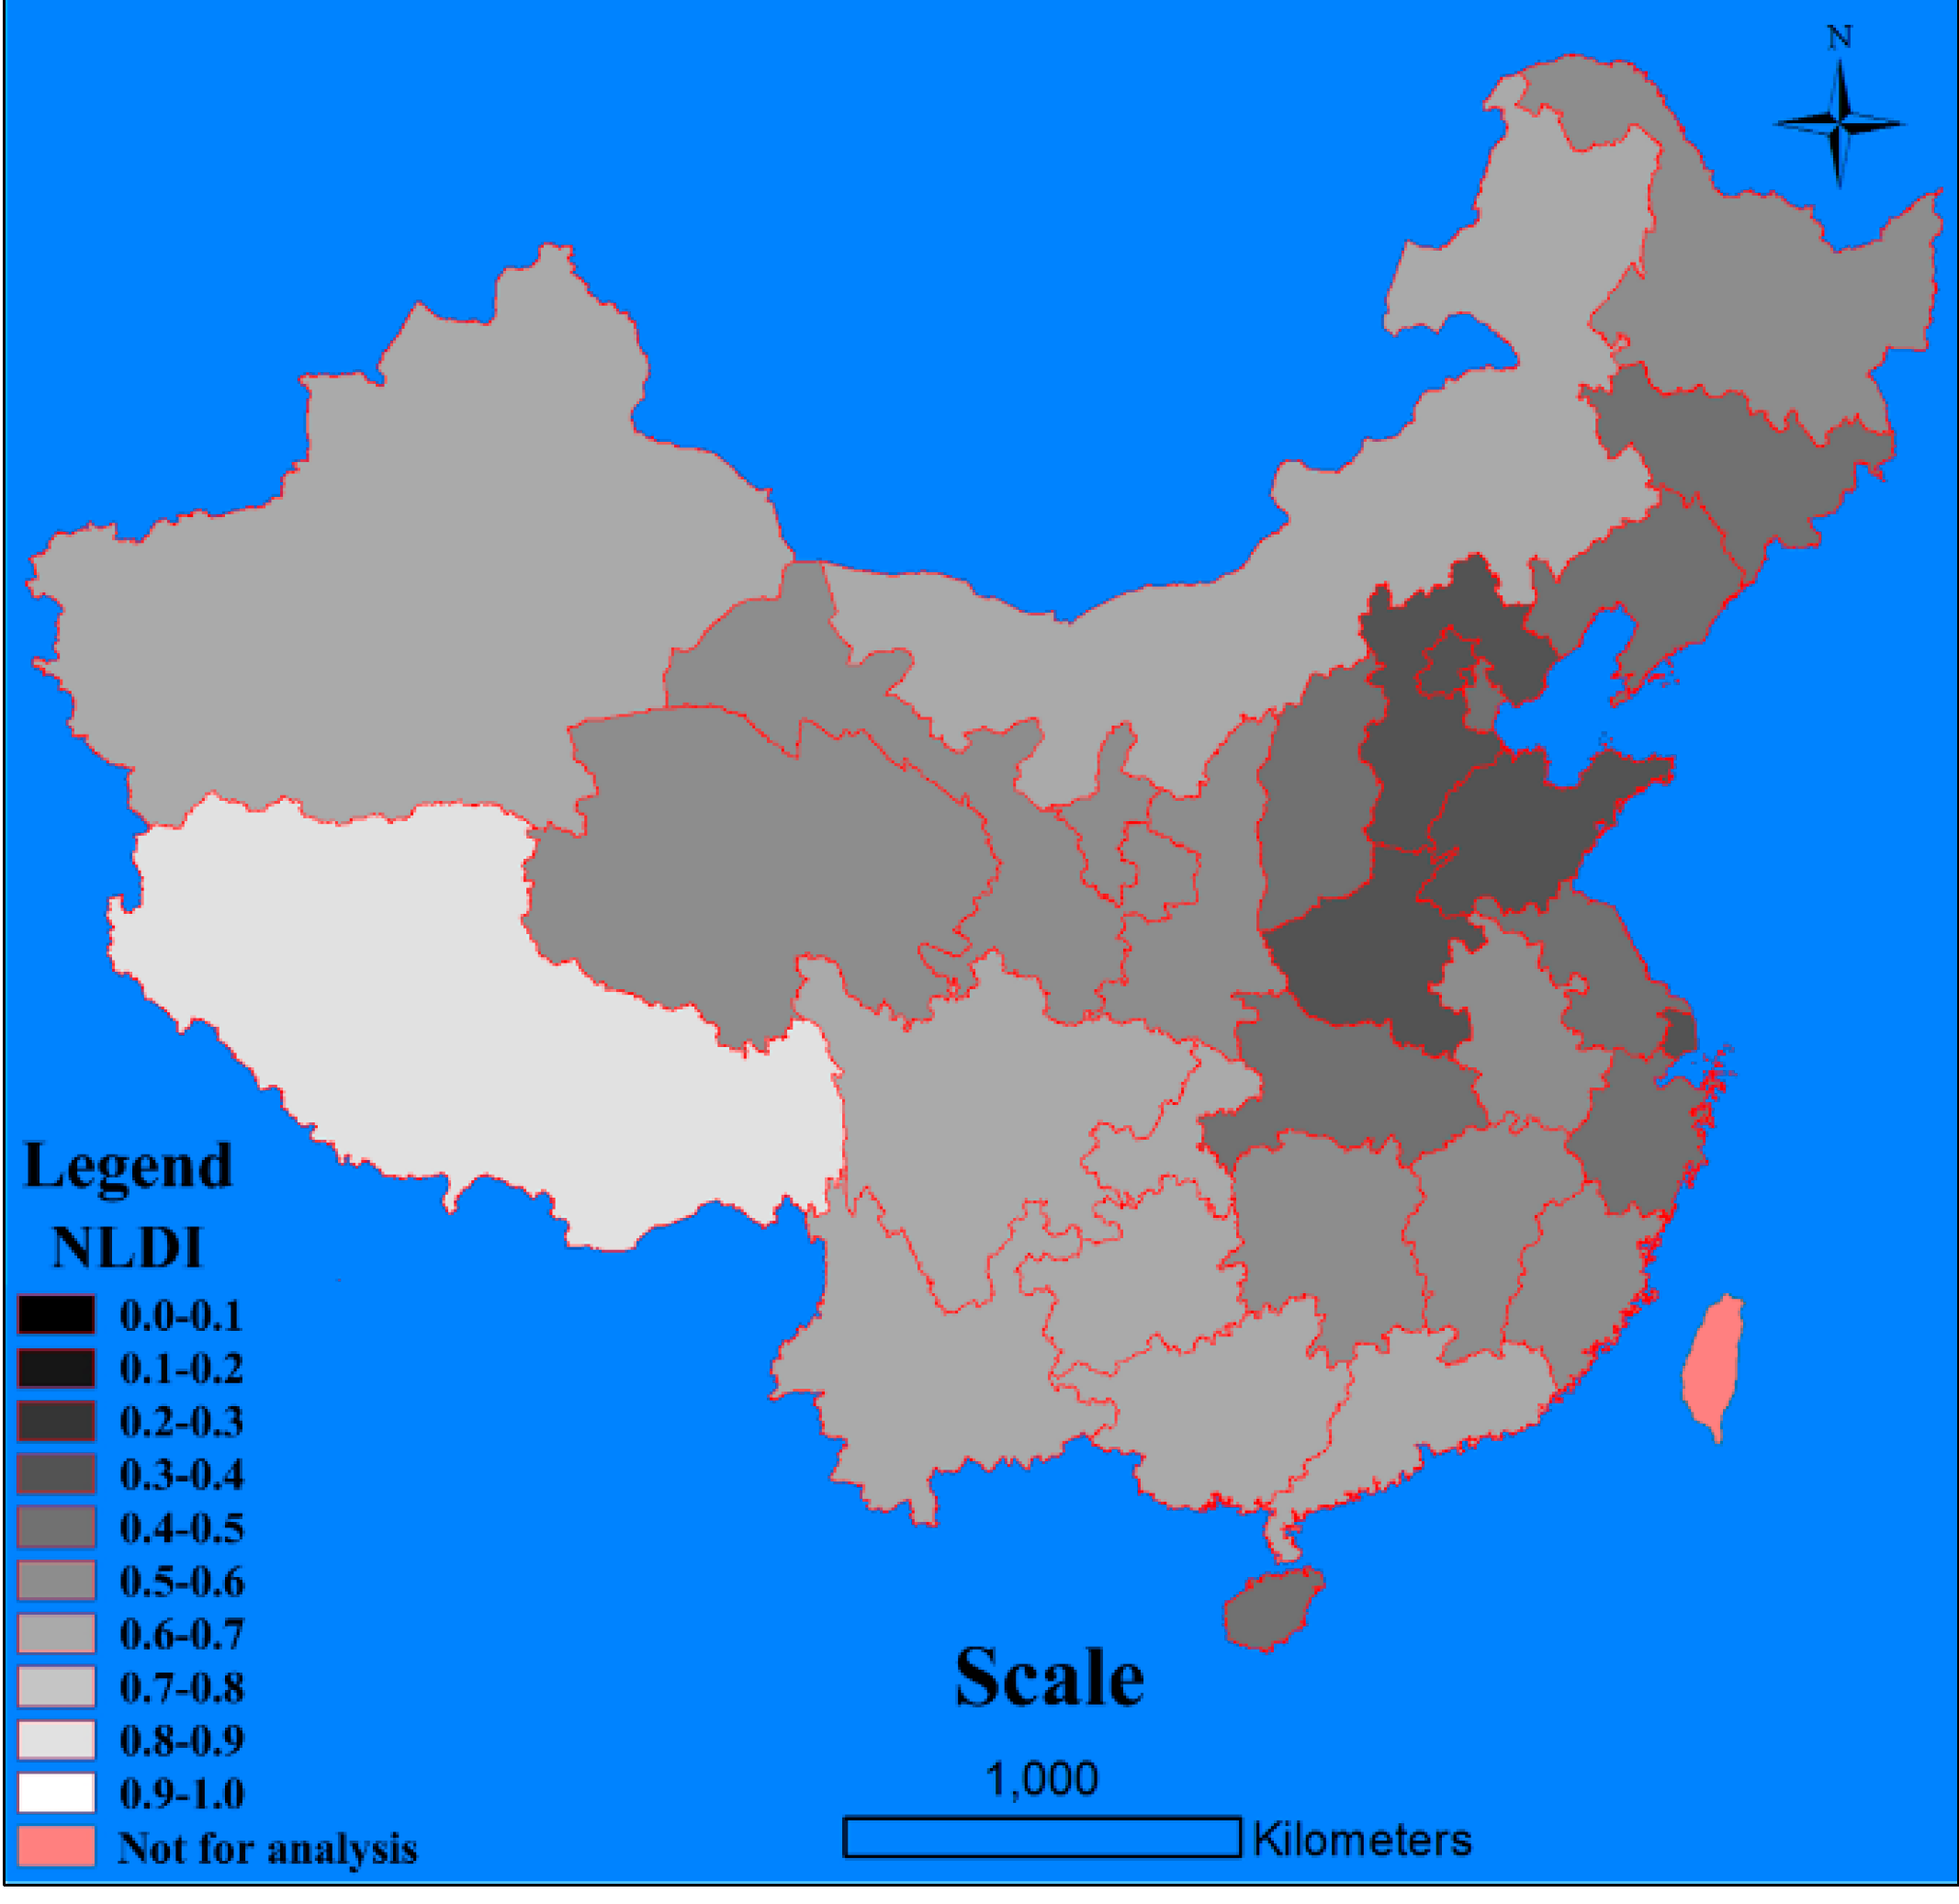
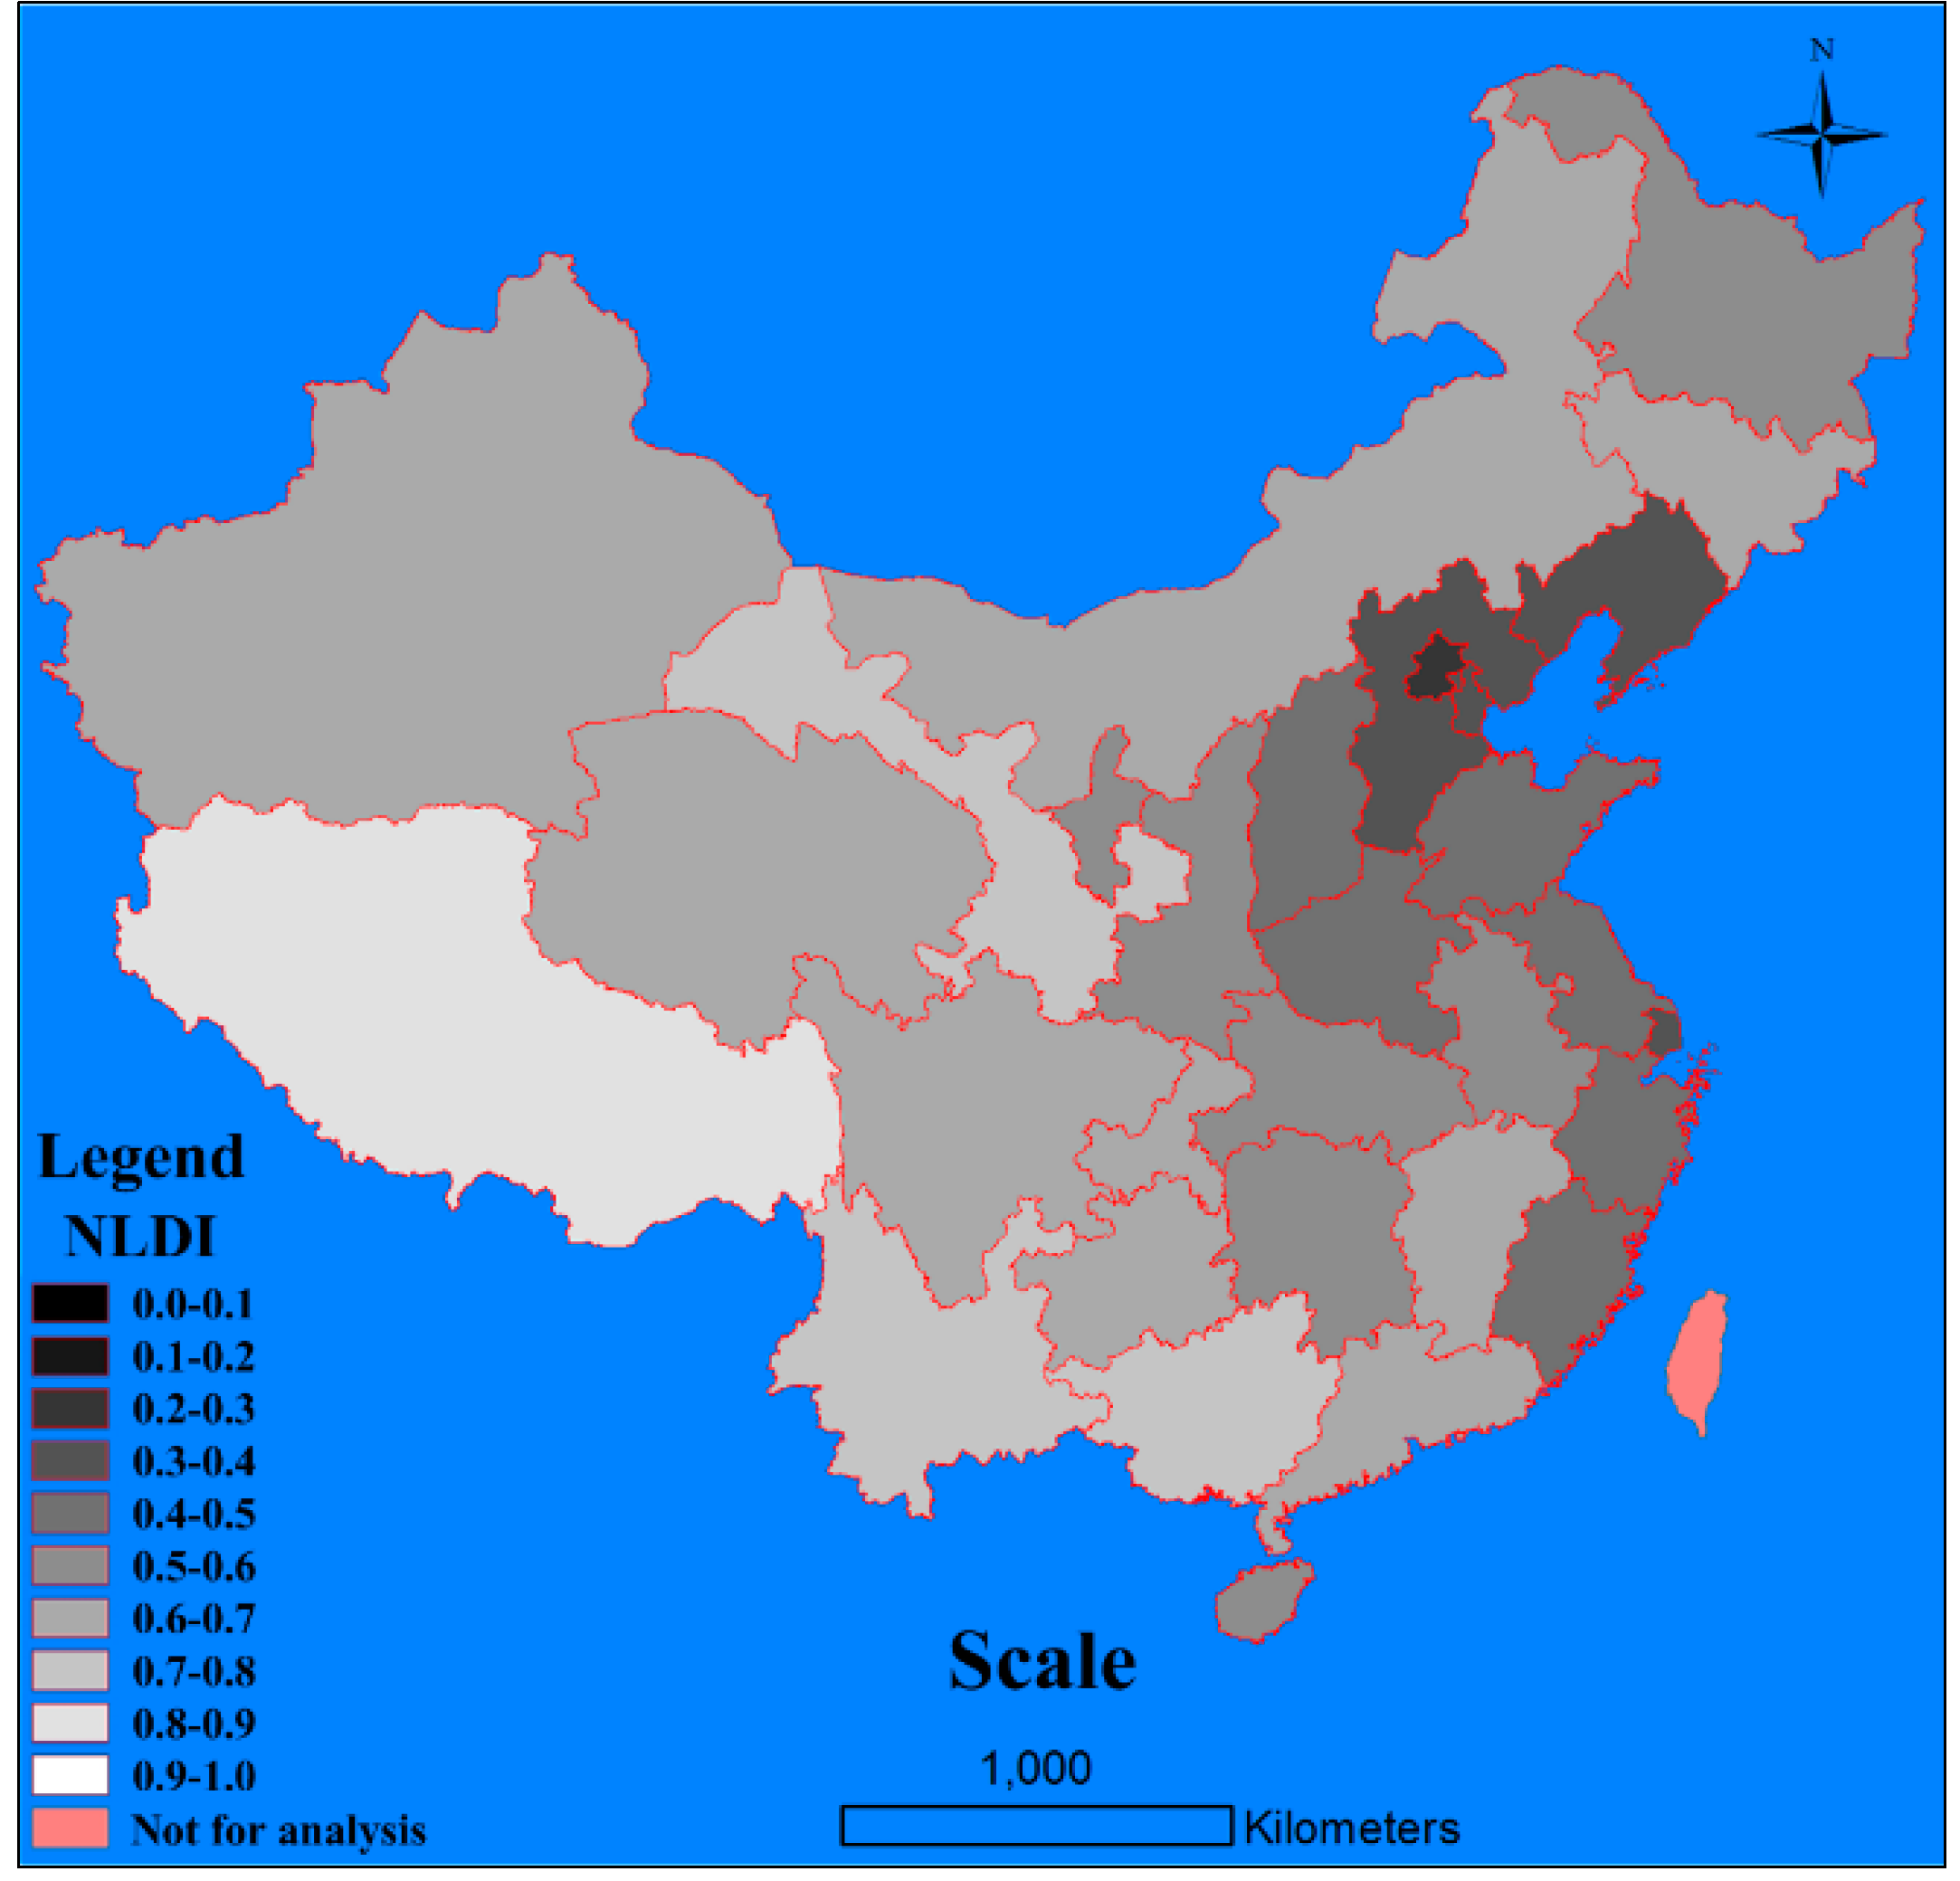
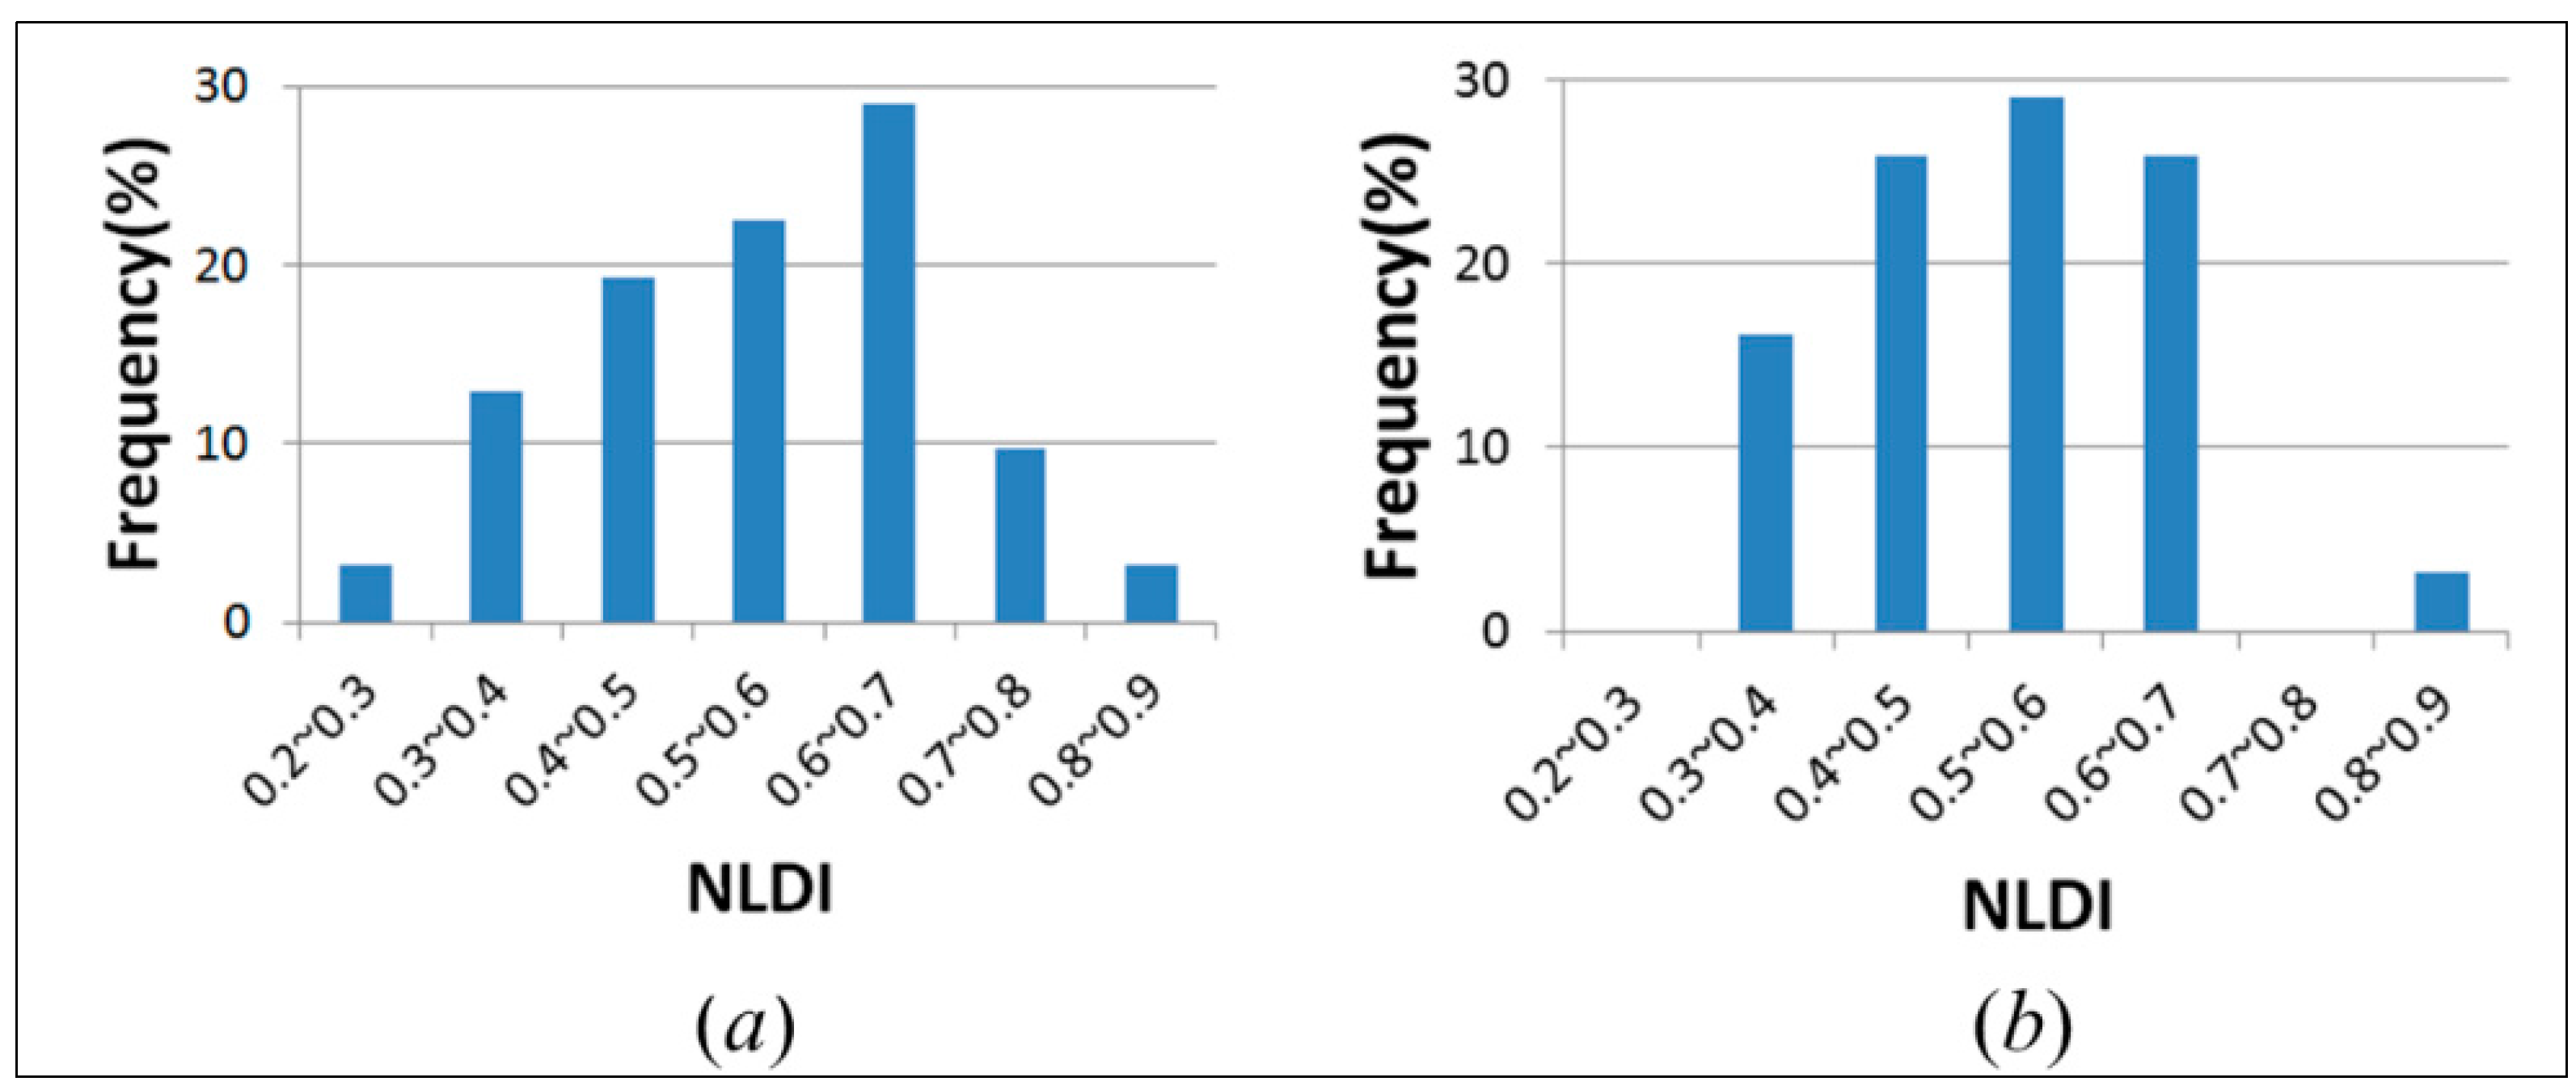
4.2. The Regional Inequality of Provincial Regions
| Province | NLDI2005 | NLDI2010 | NLDI Change | Province | NLDI2005 | NLDI2010 | NLDI Change |
|---|---|---|---|---|---|---|---|
| Beijing | 0.2861 | 0.3526 | Increase | Ningxia | 0.5956 | 0.5833 | Decrease |
| Shanghai | 0.3076 | 0.3045 | Constant | Shaanxi | 0.5989 | 0.5708 | Decrease |
| Tianjin | 0.3181 | 0.4087 | Increase | Chongqing | 0.6248 | 0.6434 | Increase |
| Hebei | 0.3634 | 0.3854 | Increase | Jiangxi | 0.6287 | 0.5817 | Decrease |
| Liaoning | 0.3899 | 0.4419 | Increase | Jilin | 0.6471 | 0.4635 | Decrease |
| Zhejiang | 0.4047 | 0.4944 | Increase | Inner Mongolia | 0.6574 | 0.6476 | Constant |
| Shandong | 0.4186 | 0.3796 | Decrease | Qinghai | 0.6657 | 0.5838 | Decrease |
| Shanxi | 0.4422 | 0.4070 | Decrease | Xinjiang | 0.6689 | 0.6045 | Decrease |
| Fujian | 0.4504 | 0.5173 | Increase | Guizhou | 0.6858 | 0.6559 | Decrease |
| Jiangsu | 0.4628 | 0.4931 | Increase | Guangdong | 0.6969 | 0.6323 | Decrease |
| Henan | 0.4703 | 0.3708 | Decrease | Sichuan | 0.6998 | 0.6740 | Decrease |
| Hainan | 0.5181 | 0.4463 | Decrease | Yunnan | 0.7013 | 0.6497 | Decrease |
| Heihongjiang | 0.5440 | 0.5171 | Decrease | Guangxi | 0.7278 | 0.6233 | Decrease |
| Hunan | 0.5475 | 0.5737 | Increase | Gansu | 0.7862 | 0.5979 | Decrease |
| Hubei | 0.5629 | 0.4971 | Decrease | Xizang | 0.8531 | 0.8292 | Decrease |
| Anhui | 0.5716 | 0.5048 | Decrease | - | - | - | - |

4.3. The Regional Inequality of Prefectural Regions

| Province | Economic Zone of the Province | NPCHN2005 | NPCHN2010 |
|---|---|---|---|
| Gansu | Northwest China (NWC) | 6 | 0 |
| Guangxi | Southwest China (SWC) | 2 | 0 |
| Qinghai | Northwest China (NWC) | 2 | 1 |
| Sichuan | Southwest China (SWC) | 5 | 2 |
| Xizang | Northwest China (NWC) | 5 | 5 |
| Yunnan | Southwest China (SWC) | 5 | 3 |
| Mainland China | 25 | 11 | |
5. Conclusions
Author Contributions
Acknowledgments
Conflicts of Interest
Appendix
| Prefectural City | Province | NLDI2005 | NLDI2010 |
|---|---|---|---|
| Jiayuguan City | Gansu | 0.1871 | 0.2763 |
| Lingshui County | Hainan | 0.2067 | 0.2069 |
| Zaozhuang City | Shandong | 0.2127 | 0.2394 |
| Zhoushan City | Zhejiang | 0.2144 | 0.2163 |
| Tongling City | Anhui | 0.2192 | 0.3070 |
| Jiaxing City | Zhejiang | 0.2216 | 0.2599 |
| Shennongjia Area | Hubei | 0.2245 | 0.4741 |
| Hebi City | Henan | 0.2252 | 0.2232 |
| Xingtai City | Hebei | 0.2394 | 0.2689 |
| Cangzhou City | Hebei | 0.2470 | 0.2912 |
| Langfang City | Hebei | 0.2483 | 0.2466 |
| Changzhou City | Jiangsu | 0.2512 | 0.3326 |
| Shihezi City | Xinjiang | 0.2518 | 0.4350 |
| Panjin City | Liaoning | 0.2586 | 0.3316 |
| Yingkou City | Liaoning | 0.2625 | 0.3632 |
| Taiyuan City | Shanxi | 0.2630 | 0.2541 |
| Huainan City | Anhui | 0.2664 | 0.2486 |
| Dongguan City | Guangdong | 0.2724 | 0.1868 |
| Zhenjiang City | Jiangsu | 0.2736 | 0.2918 |
| Xiamen City | Fujian | 0.2757 | 0.2956 |
| Fuxin City | Liaoning | 0.2789 | 0.4101 |
| Shenyang City | Liaoning | 0.2831 | 0.3438 |
| Pingdingshan City | Henan | 0.2835 | 0.2538 |
| Wulumuqi City | Xinjiang | 0.2841 | 0.3476 |
| Beijing City | Beijing | 0.2861 | 0.3526 |
| Xuchang City | Henan | 0.2869 | 0.2582 |
| Hengshui City | Hebei | 0.2870 | 0.2756 |
| Xining City | Qinghai | 0.2874 | 0.2966 |
| Shijiazhuang City | Hebei | 0.2915 | 0.3036 |
| Yinchuan City | Ningxia | 0.2917 | 0.3518 |
| Wanning City | Hainan | 0.2950 | 0.2692 |
| Anyang City | Henan | 0.2953 | 0.2640 |
| Jiaozuo City | Henan | 0.2975 | 0.2659 |
| Nanjing City | Jiangsu | 0.3015 | 0.3063 |
| Changjiang County | Hainan | 0.3030 | 0.2854 |
| Baoding City | Hebei | 0.3031 | 0.3644 |
| Changsha City | Hubei | 0.3042 | 0.3370 |
| Linyi City | Shandong | 0.3054 | 0.3717 |
| Jinan City | Shandong | 0.3065 | 0.3062 |
| Shanghai City | Shanghai | 0.3076 | 0.3045 |
| Jinzhou City | Liaoning | 0.3104 | 0.4283 |
| Zibo City | Shandong | 0.3106 | 0.3018 |
| Zhoukou City | Henan | 0.3108 | 0.2586 |
| Tieling City | Liaoning | 0.3108 | 0.4303 |
| Ezhou City | Hubei | 0.3110 | 0.2586 |
| Xinxiang City | Henan | 0.3113 | 0.2828 |
| Wuxi City | Jiangsu | 0.3159 | 0.2807 |
| Tianjin City | Tianjin | 0.3181 | 0.4087 |
| Ningbo City | Zhejiang | 0.3193 | 0.4553 |
| Huaibei City | Anhui | 0.3199 | 0.3351 |
| Yantai City | Shandong | 0.3226 | 0.3517 |
| Qionghai City | Hainan | 0.3233 | 0.3077 |
| Luohe City | Henan | 0.3251 | 0.2283 |
| Taizhou City | Zhejiang | 0.3264 | 0.3773 |
| Weihai City | Shandong | 0.3268 | 0.2971 |
| Shuangyashan City | Heilongjiang | 0.3285 | 0.4079 |
| Jincheng City | Shanxi | 0.3289 | 0.3067 |
| Huzhou City | Zhejiang | 0.3293 | 0.2909 |
| Quanzhou City | Fujian | 0.3298 | 0.4969 |
| Wuhan City | Inner Mongolia | 0.3299 | 0.4218 |
| Tangshan City | Hebei | 0.3335 | 0.3366 |
| Xiangtan City | Hunan | 0.3370 | 0.3813 |
| Putian City | Fujian | 0.3373 | 0.4415 |
| Shaoxing City | Zhejiang | 0.3378 | 0.3529 |
| Yuncheng City | Shanxi | 0.3413 | 0.3064 |
| Suzhou City | Jiangsu | 0.3433 | 0.3504 |
| Tai'an City | Shandong | 0.3438 | 0.2551 |
| Qingdao City | Shandong | 0.3451 | 0.3599 |
| Laiwu City | Shandong | 0.3458 | 0.3301 |
| Xian City | Shaanxi | 0.3469 | 0.3258 |
| Dongfang City | Hainan | 0.3470 | 0.3269 |
| Liaoyang City | Liaoning | 0.3479 | 0.3484 |
| Fushun City | Liaoning | 0.3482 | 0.4309 |
| Shangqiu City | Henan | 0.3483 | 0.2610 |
| Weinan City | Shaanxi | 0.3512 | 0.3220 |
| Luoyang City | Henan | 0.3516 | 0.2814 |
| Binzhou City | Shandong | 0.3519 | 0.3379 |
| Hegang City | Heilongjiang | 0.3520 | 0.4583 |
| Hangzhou City | Zhejiang | 0.3528 | 0.6090 |
| Dezhou City | Shandong | 0.3551 | 0.3817 |
| Beihai City | Guangdong | 0.3558 | 0.3237 |
| Handan City | Hebei | 0.3566 | 0.3441 |
| Pingxiang City | Jiangxi | 0.3566 | 0.3373 |
| Chengdu City | Sichuan | 0.3571 | 0.3164 |
| Quzhou City | Zhejiang | 0.3609 | 0.3440 |
| Liaocheng City | Shandong | 0.3613 | 0.2713 |
| Sanmenxia City | Henan | 0.3619 | 0.3524 |
| Benxi City | Liaoning | 0.3631 | 0.4695 |
| Lianyungang City | Jiangsu | 0.3655 | 0.2868 |
| Jining City | Shandong | 0.3664 | 0.3137 |
| Weifang City | Shandong | 0.3669 | 0.3193 |
| Heze City | Shandong | 0.3686 | 0.2983 |
| Jinhua City | Zhejiang | 0.3692 | 0.3998 |
| Shanwei City | Guangdong | 0.3718 | 0.3126 |
| Liaoyuan City | Jilin | 0.3767 | 0.3427 |
| Huaiyin City | Jiangsu | 0.3806 | 0.3955 |
| Lin'gao County | Hainan | 0.3810 | 0.3171 |
| Hami Area | Xinjiang | 0.3816 | 0.5044 |
| Jieyang City | Guangdong | 0.3819 | 0.4081 |
| Xiaogan City | Hubei | 0.3837 | 0.3904 |
| Dalian City | Liaoning | 0.3859 | 0.4614 |
| Zhangzhou City | Fujian | 0.3870 | 0.3723 |
| Jinzhong City | Shanxi | 0.3872 | 0.3969 |
| Xuzhou City | Jiangsu | 0.3874 | 0.4959 |
| Guiyang City | Guizhou | 0.3879 | 0.4405 |
| Kaifeng City | Henan | 0.3907 | 0.3581 |
| Foshan City | Guangdong | 0.3915 | 0.2867 |
| Zhengzhou City | Henan | 0.3942 | 0.2837 |
| Baoji City | Shaanxi | 0.3942 | 0.3560 |
| Wenzhou City | Fujian | 0.3965 | 0.4286 |
| Yangzhou City | Jiangsu | 0.3976 | 0.3826 |
| Huhehaote City | Inner Mongolia | 0.3978 | 0.4516 |
| Tongchuan City | Shaanxi | 0.3992 | 0.4539 |
| Anshan City | Liaoning | 0.4015 | 0.3501 |
| Rizhao City | Shandong | 0.4024 | 0.3711 |
| Wuhan City | Hubei | 0.4024 | 0.3511 |
| Suqian City | Jiangsu | 0.4058 | 0.3775 |
| Shenzhen City | Guangdong | 0.4061 | 0.2684 |
| Chaozhou City | Guangdong | 0.4062 | 0.4119 |
| Nanchang City | Jiangxi | 0.4063 | 0.3765 |
| Lanzhou City | Gansu | 0.4076 | 0.4328 |
| Yangquan City | Shanxi | 0.4091 | 0.4486 |
| Suihua City | Heilongjiang | 0.4091 | 0.4108 |
| Dandong City | Liaoning | 0.4108 | 0.5060 |
| Wenzhou City | Zhejiang | 0.4137 | 0.3942 |
| Qitaihe City | Heilongjiang | 0.4143 | 0.4648 |
| Chaoyang City | Liaoning | 0.4144 | 0.4607 |
| Puyang City | Henan | 0.4163 | 0.2677 |
| Jingzhou City | Hubei | 0.4186 | 0.4027 |
| Zhongshan City | Guangdong | 0.4211 | 0.2874 |
| Deyang City | Sichuan | 0.4216 | 0.4158 |
| Taizhou City | Jiangsu | 0.4243 | 0.4569 |
| Shuozhou City | Shanxi | 0.4286 | 0.4449 |
| Dongying City | Shandong | 0.4288 | 0.3553 |
| Huangshi City | Hubei | 0.4289 | 0.3465 |
| Baoting County | Hainan | 0.4290 | 0.4251 |
| Huludao City | Liaoning | 0.4292 | 0.4694 |
| Jixi City | Heilongjiang | 0.4331 | 0.4561 |
| Nantong City | Jiangsu | 0.4343 | 0.4620 |
| Bo'ertala Autonomous Prefecture | Xinjiang | 0.4352 | 0.4296 |
| Kelamayi City | Xinjiang | 0.4412 | 0.3844 |
| Jiamusi City | Heilongjiang | 0.4421 | 0.5360 |
| Xinzhou City | Shanxi | 0.4426 | 0.4413 |
| Baotou City | Inner Mongolia | 0.4448 | 0.5317 |
| Chenzhou City | Hunan | 0.4452 | 0.4917 |
| Mudanjiang City | Heilongjiang | 0.4455 | 0.4848 |
| Sanya City | Hainan | 0.4507 | 0.3051 |
| Tunchang County | Hainan | 0.4513 | 0.3039 |
| Ledong County | Hainan | 0.4520 | 0.3939 |
| Yancheng City | Jiangsu | 0.4526 | 0.4531 |
| Changzhi City | Shanxi | 0.4526 | 0.3848 |
| Hefei City | Anhui | 0.4534 | 0.4001 |
| Ningde City | Fujian | 0.4542 | 0.4886 |
| Longyan City | Fujian | 0.4557 | 0.5416 |
| Haikou City | Hainan | 0.4565 | 0.2833 |
| Kezilesuke’erkezi Autonomous Prefecture | Xinjiang | 0.4599 | 0.5100 |
| Zhuzhou City | Hunan | 0.4619 | 0.5062 |
| Nanyang City | Henan | 0.4632 | 0.3494 |
| Datong City | Shanxi | 0.4645 | 0.4074 |
| Qinhuangdao City | Hebei | 0.4682 | 0.4144 |
| Bozhou City | Anhui | 0.4687 | 0.4128 |
| Fuxin City | Anhui | 0.4706 | 0.3957 |
| Siping City | Jilin | 0.4708 | 0.4402 |
| Zhumadian City | Henan | 0.4726 | 0.3962 |
| Maanshan City | Anhui | 0.4741 | 0.3683 |
| Hengyang City | Hunan | 0.4797 | 0.5201 |
| Ha'erbin City | Heilongjiang | 0.4798 | 0.4239 |
| Panzhihua City | Sichuan | 0.4822 | 0.3600 |
| Suizhou City | Hubei | 0.4843 | 0.5640 |
| Danzhou City | Hainan | 0.4844 | 0.3926 |
| Xianyang City | Shaanxi | 0.4895 | 0.4091 |
| Yichang City | Hubei | 0.4896 | 0.4910 |
| Ding'an County | Hainan | 0.4920 | 0.5511 |
| Anshun City | Guizhou | 0.4938 | 0.4960 |
| Wenchang City | Hainan | 0.4953 | 0.4317 |
| Shizuishan City | Ningxia | 0.4959 | 0.4537 |
| Zhangjiakou City | Hebei | 0.4987 | 0.5158 |
| Wuzhong City | Ningxia | 0.5029 | 0.5830 |
| Linfen City | Shanxi | 0.5036 | 0.3662 |
| Qiqiha'er City | Heilongjiang | 0.5045 | 0.5095 |
| Zhangjiajie City | Hunan | 0.5054 | 0.6257 |
| Loudi City | Hunan | 0.5087 | 0.4735 |
| Yingtan City | Jiangxi | 0.5089 | 0.5391 |
| Chuzhou City | Anhui | 0.5111 | 0.4282 |
| Yueyang City | Hunan | 0.5116 | 0.4855 |
| Bengbu City | Anhui | 0.5122 | 0.4813 |
| Guangzhou City | Guangdong | 0.5125 | 0.4152 |
| Yichun City | Heilongjiang | 0.5126 | 0.5218 |
| Yuxi Area | Yunnan | 0.5136 | 0.4943 |
| Yongzhou City | Hunan | 0.5159 | 0.5414 |
| Zhanjiang City | Guangdong | 0.5167 | 0.4431 |
| Lishui City | Zhejiang | 0.5174 | 0.5472 |
| Jingmen City | Hubei | 0.5183 | 0.5223 |
| Maoming City | Guangdong | 0.5185 | 0.5104 |
| Changde City | Hunan | 0.5192 | 0.5071 |
| Huaihua City | Hunan | 0.5218 | 0.5869 |
| Suzhou City | Anhui | 0.5231 | 0.3689 |
| Jiangmen City | Guangdong | 0.5233 | 0.4115 |
| Bayannaoer League | Inner Mongolia | 0.5270 | 0.4277 |
| Kunming City | Yunnan | 0.5279 | 0.4816 |
| Heihe City | Heilongjiang | 0.5281 | 0.5378 |
| Neijiang City | Sichuan | 0.5297 | 0.4966 |
| Zhuhai City | Guangdong | 0.5302 | 0.5229 |
| Lvliang Area | Shanxi | 0.5323 | 0.4662 |
| Xinyu City | Jiangxi | 0.5355 | 0.5220 |
| Chaohu City | Anhui | 0.5363 | 0.4613 |
| Anqing City | Anhui | 0.5367 | 0.4534 |
| Yangjiang City | Guangdong | 0.5401 | 0.4890 |
| Huizhou City | Guangdong | 0.5412 | 0.4439 |
| Yiyang City | Hunan | 0.5452 | 0.5623 |
| Qujing City | Yunnan | 0.5466 | 0.5382 |
| Baisha County | Hainan | 0.5470 | 0.3092 |
| Daqing City | Heilongjiang | 0.5490 | 0.5380 |
| Changji Autonomous Prefecture | Xinjiang | 0.5497 | 0.4867 |
| Xiangfan City | Hubei | 0.5504 | 0.5090 |
| Meizhou City | Guangdong | 0.5517 | 0.4652 |
| Leshan City | Sichuan | 0.5523 | 0.5388 |
| Wuhu City | Anhui | 0.5559 | 0.3541 |
| Shiyan City | Hubei | 0.5582 | 0.5302 |
| Enshi Autonomous Prefecture | Hubei | 0.5587 | 0.4624 |
| Linxia Autonomous Prefecture | Gansu | 0.5593 | 0.4226 |
| Yichun City | Jiangxi | 0.5595 | 0.5324 |
| Lasa City | Xizang | 0.5622 | 0.5703 |
| Huanggang City | Hubei | 0.5650 | 0.4297 |
| Shaoyang City | Hunan | 0.5652 | 0.5763 |
| Xianning City | Hubei | 0.5669 | 0.5235 |
| Guigang City | Guangxi | 0.5678 | 0.4829 |
| Tonghua City | Jilin | 0.5707 | 0.4540 |
| Chengmai County | Hainan | 0.5751 | 0.5190 |
| Shaoguan City | Guangdong | 0.5764 | 0.5525 |
| Qiongzhong County | Hainan | 0.5777 | 0.5398 |
| Qingyuan City | Guangdong | 0.5787 | 0.5553 |
| Hulunbei'er City | Inner Mongolia | 0.5788 | 0.6161 |
| Shantou City | Guangdong | 0.5788 | 0.5098 |
| Meishan City | Sichuan | 0.5802 | 0.4899 |
| Yili Autonomous Prefecture | Xinjiang | 0.5896 | 0.5347 |
| Jingdezhen City | Jiangxi | 0.5902 | 0.4734 |
| Huangnan Autonomous Prefecture | Qinghai | 0.5911 | 0.5179 |
| Yulin City | Guangxi | 0.5918 | 0.4278 |
| Zhaoqing City | Guangdong | 0.5944 | 0.5467 |
| Ya'an City | Sichuan | 0.5958 | 0.6188 |
| Xinyang City | Henan | 0.6014 | 0.5833 |
| Tongliao City | Inner Mongolia | 0.6025 | 0.6029 |
| Hanzhong City | Shaanxi | 0.6032 | 0.5665 |
| Sanming City | Fujian | 0.6046 | 0.6091 |
| Yanbian Autonomous Prefecture | Jilin | 0.6049 | 0.4400 |
| Guyuan City | Ningxia | 0.6072 | 0.5863 |
| Xishuangbanna Autonomous Prefecture | Yunnan | 0.6102 | 0.6191 |
| Guangan City | Sichuan | 0.6121 | 0.6529 |
| Liupanshui City | Guizhou | 0.6129 | 0.5681 |
| Honhhe Autonomous Prefecture | Yunnan | 0.6132 | 0.5939 |
| Tongshi City | Hainan | 0.6138 | 0.4251 |
| Chengde City | Hebei | 0.6146 | 0.6001 |
| E'erduosi City | Inner Mongolia | 0.6198 | 0.6319 |
| Liuzhou City | Guangxi | 0.6204 | 0.5283 |
| Qianxinan Autonomous Prefecture | Guizhou | 0.6233 | 0.5972 |
| Chizhou City | Anhui | 0.6236 | 0.5516 |
| Chongqing City | Chongqing | 0.6248 | 0.6434 |
| Shangrao City | Jiangxi | 0.6284 | 0.5557 |
| Shangluo City | Shaanxi | 0.6287 | 0.6328 |
| Haidong Area | Qinghai | 0.6316 | 0.5469 |
| Aletai Area | Xinjiang | 0.6340 | 0.5874 |
| Dali Autonomous Prefecture | Yunnan | 0.6355 | 0.5109 |
| Xuancheng City | Anhui | 0.6363 | 0.4727 |
| Huangshan City | Anhui | 0.6378 | 0.4996 |
| Hezhou City | Guangxi | 0.6380 | 0.6052 |
| Fuzhou City | Jiangxi | 0.6399 | 0.5919 |
| Xiangxi Autonomous Prefecture | Hunan | 0.6400 | 0.7045 |
| Yunfu City | Guangdong | 0.6426 | 0.5410 |
| Daxing'anling Area | Heilongjiang | 0.6427 | 0.6916 |
| Dehong Autonomous Prefecture | Yunnan | 0.6469 | 0.4674 |
| Baishan City | Jilin | 0.6514 | 0.6348 |
| Jilin City | Jilin | 0.6533 | 0.4464 |
| Ganzhou City | Jiangxi | 0.6570 | 0.6306 |
| Suining City | Sichuan | 0.6573 | 0.6077 |
| Mianyang City | Sichuan | 0.6582 | 0.5722 |
| Songyuan City | Jilin | 0.6594 | 0.4761 |
| Fangchenggang City | Guangxi | 0.6600 | 0.5105 |
| Baoshan City | Yunnan | 0.6641 | 0.4672 |
| Bayinguoleng Autonomous Prefecture | Xinjiang | 0.6649 | 0.5387 |
| Lu'an Area | Anhui | 0.6653 | 0.6058 |
| Zigong City | Sichuan | 0.6667 | 0.5875 |
| Wulanchabu League | Inner Mongolia | 0.6725 | 0.6870 |
| Alashan League | Inner Mongolia | 0.6748 | 0.6006 |
| Heyuan City | Guangdong | 0.6769 | 0.6463 |
| Wuzhou City | Guangxi | 0.6773 | 0.5340 |
| Guoluo Autonomous Prefecture | Qinghai | 0.6775 | 0.4940 |
| Changchun City | Jilin | 0.6794 | 0.3849 |
| Jiujiang City | Jiangxi | 0.6829 | 0.6161 |
| Nanping City | Fujian | 0.6842 | 0.6679 |
| Chongzuo City | Guangxi | 0.6857 | 0.5528 |
| Qiannan Autonomous Prefecture | Guizhou | 0.6879 | 0.6971 |
| Xing'an League | Inner Mongolia | 0.6906 | 0.6015 |
| Tulufan City | Xinjiang | 0.6943 | 0.6139 |
| Tacheng Area | Xinjiang | 0.6977 | 0.5936 |
| Guilin City | Guangxi | 0.6979 | 0.5536 |
| Hetian Area | Xinjiang | 0.7001 | 0.5138 |
| Jinchang City | Gansu | 0.7004 | 0.5537 |
| Xilinguole League | Inner Mongolia | 0.7110 | 0.7365 |
| Haixi Autonomous Prefecture | Qinghai | 0.7129 | 0.6887 |
| Zunyi City | Guizhou | 0.7157 | 0.7018 |
| Chifeng City | Inner Mongolia | 0.7164 | 0.6157 |
| Luzhou City | Sichuan | 0.7195 | 0.6763 |
| Yibin City | Sichuan | 0.7201 | 0.6893 |
| Yan'an City | Shaanxi | 0.7213 | 0.7150 |
| Ankang City | Shaanxi | 0.7215 | 0.6330 |
| Qinzhou City | Guangxi | 0.7244 | 0.6168 |
| Dazhou City | Sichuan | 0.7255 | 0.7617 |
| Ji'an City | Jiangxi | 0.7261 | 0.7555 |
| Bijie Area | Guizhou | 0.7373 | 0.6872 |
| Tongren Area | Guizhou | 0.7383 | 0.7620 |
| Wuwei City | Gansu | 0.7434 | 0.5246 |
| Tianshui City | Gansu | 0.7467 | 0.4599 |
| Laibin City | Guangxi | 0.7474 | 0.7774 |
| Chuxiong Autonomous Prefecture | Yunnan | 0.7493 | 0.6666 |
| Kashi Area | Xinjiang | 0.7502 | 0.5330 |
| Akesu Area | Xinjiang | 0.7516 | 0.7050 |
| Qiandong Autonomous Prefecture | Guizhou | 0.7590 | 0.7480 |
| Liangshan Autonomous Prefecture | Sichuan | 0.7666 | 0.7053 |
| Yulin City | Shaanxi | 0.7687 | 0.7471 |
| Nanchong City | Sichuan | 0.7689 | 0.7490 |
| Lincang | Yunnan | 0.7852 | 0.6714 |
| Nanning City | Guangxi | 0.7868 | 0.5697 |
| Baiyin City | Gansu | 0.7886 | 0.6710 |
| Qingyang City | Gansu | 0.7909 | 0.6750 |
| Haibei Autonomous Prefecture | Qinghai | 0.7911 | 0.7233 |
| Baicheng City | Jilin | 0.7925 | 0.5639 |
| Diqing Autonomous Prefecture | Yunnan | 0.7926 | 0.7251 |
| Naqu Area | Xizang | 0.7940 | 0.7673 |
| Ziyang City | Sichuan | 0.7967 | 0.7536 |
| Linzhi Area | Xizang | 0.8080 | 0.7951 |
| Lijiang Area | Yunnan | 0.8082 | 0.6601 |
| Wenshan Autonomous Prefecture | Yunnan | 0.8087 | 0.7963 |
| Zhaotong City | Yunnan | 0.8089 | 0.8142 |
| Bose City | Guangxi | 0.8094 | 0.7153 |
| Simao Area | Yunnan | 0.8128 | 0.8005 |
| Guangyuan City | Sichuan | 0.8137 | 0.7710 |
| Ganzi Autonomous Prefecture | Sichuan | 0.8142 | 0.8402 |
| Ali Area | Xizang | 0.8212 | 0.7963 |
| Longnan City | Gansu | 0.8235 | 0.6177 |
| Pingliang City | Gansu | 0.8265 | 0.5124 |
| Nujiang Autonomous Prefecture | Yunnan | 0.8339 | 0.6910 |
| Gannan Autonomous Prefecture | Gansu | 0.8355 | 0.6051 |
| Aba Autonomous Prefecture | Sichuan | 0.8374 | 0.7806 |
| Yushu Autonomous Prefecture | Qinghai | 0.8390 | 0.8041 |
| Hechi City | Guangxi | 0.8401 | 0.7748 |
| Dingxi Area | Gansu | 0.8446 | 0.5502 |
| Jiuquan City | Gansu | 0.8691 | 0.6475 |
| Shannan Area | Xizang | 0.8807 | 0.8468 |
| Rikaze Area | Xizang | 0.8937 | 0.8506 |
| Hainan Autonomous Prefecture | Qinghai | 0.9021 | 0.7499 |
| Bazhong City | Sichuan | 0.9050 | 0.8715 |
| Changdu Area | Xizang | 0.9123 | 0.8830 |
| Zhangye City | Gansu | 0.9456 | 0.5806 |
References
- Lo, T.W.; Jiang, G. Inequality, crime and the floating population in China. Asian J. Criminol. 2006, 1, 103–118. [Google Scholar] [CrossRef]
- Wei, Y.D. Regional Development in China: States, Globalization and Inequality; Routledge: London, UK, 2013. [Google Scholar]
- Zhang, Z.; Yao, S. Regional inequalities in contemporary China measured by GDP and consumption. Econ. Issues-Stoke Trent 2001, 6, 13–30. [Google Scholar]
- Chan, K.W.; Wang, M. Remapping China’s Regional Inequalities, 1990–2006: A New Assessment of De Facto and De Jure Population Data. Eurasian Geogr. Econ. 2008, 49, 21–56. [Google Scholar] [CrossRef]
- Yu, D.L.; Wei, Y.H.D. Spatial data analysis of regional development in greater Beijing, China, in a GIS environment. Paper. Reg. Sci. 2008, 87, 97–117. [Google Scholar] [CrossRef]
- Liu, T.; Li, K.W. Disparity in factor contributions between coastal and inner provinces in post-reform China. China Econ. Rev. 2006, 17, 449–470. [Google Scholar] [CrossRef]
- Demurger, S. Infrastructure development and economic growth: An explanation for regional disparities in China? J. Comp. Econ. 2001, 29, 95–117. [Google Scholar] [CrossRef]
- Kanbur, R.; Zhang, X. Fifty years of regional inequality in China: A journey through central planning, reform, and openness. Rev. Dev. Econ. 2005, 9, 87–106. [Google Scholar] [CrossRef]
- Measurement of GDP Per Capita and Regional Disparities in China, 1979–2009. Available online: http://ggl.rieb.kobe-u.ac.jp/academic/ra/dp/English/DP2011–17.pdf (accessed on 16 September 2015).
- Li, Y.; Wei, Y.D. The spatial-temporal hierarchy of regional inequality of China. Appl. Geogr. 2010, 30, 303–316. [Google Scholar] [CrossRef]
- Li, C.; Gibson, J.R. Regional inequality in China: Fact or artifact? World Dev. 2013, 47, 16–29. [Google Scholar] [CrossRef]
- Rigall-I-Torrent, R. Sustainable development in tourism municipalities: The role of public goods. Tour. Manag. 2008, 29, 883–897. [Google Scholar] [CrossRef]
- Liu, Y.X.; Wei, L.S.; Qiu, M.J. Status and problem analysis on public service supply in Pastoral Areas of inner mongolia-based on perspective of sustainable development. In Proceedings of 2013 International Conference on Public Administration, Cape Town, South Africa, 31 October 2013; Zhu, X.N., Zhao, S.R., Eds.; University of Electronic Science and Technology of China Press: Chengdu, China, 2013; pp. 530–536. [Google Scholar]
- Liang, X.P. Functions of public service in the sustainable development of regional economy: A case study of Tianjin. Appl. Mech. Mater. 2014, 472, 1105–1111. [Google Scholar] [CrossRef]
- Argyriades, D. Values for public service: Lessons learned from recent trends and the millennium summit. Int. Rev. Adm. Sci. 2003, 69, 521–533. [Google Scholar] [CrossRef]
- Zhang, X.; Kanbur, R. Spatial inequality in education and health care in China. China Econ. Rev. 2005, 16, 189–204. [Google Scholar] [CrossRef]
- Li, Y.; Wei, Y.D. Multidimensional inequalities in health care distribution in provincial China: A case study of Henan Province. Tijdschr. Voor Econo. En Soc. Geogr. 2014, 105, 91–106. [Google Scholar] [CrossRef]
- Feng, X.L.; Zhu, J.; Zhang, L.; Song, L.; Hipgrave, D.; Guo, S.; Ronsmans, C.; Guo, Y.; Yang, Q. Socio-economic disparities in maternal mortality in China between 1996 and 2006. Bjog-An Int. J. Obstet. Gynaecol. 2010, 117, 1527–1536. [Google Scholar] [CrossRef] [PubMed]
- Chou, W.L.; Wang, Z.J. Regional inequality in China’s health care expenditures. Health Econ. 2009, 18, S137–S146. [Google Scholar] [CrossRef] [PubMed]
- Fan, C.C.; Sun, M. Regional inequality in China, 1978–2006. Eurasian Geogr. Econ. 2008, 49, 1–18. [Google Scholar] [CrossRef]
- Liao, F.H.; Wei, Y.D. Dynamics, space, and regional inequality in provincial china: A case study of Guangdong province. Appl. Geogr. 2012, 35, 71–83. [Google Scholar] [CrossRef]
- Yue, W.; Zhang, Y.; Ye, X.; Cheng, Y.; Leipnik, M.R. Dynamics of Multi-scale Intra-provincial Regional Inequality in Zhejiang, China. Sustainability 2014, 6, 5763–5784. [Google Scholar] [CrossRef]
- Margono, B.A.; Bwangoy, J.R.B.; Potapov, P.V.; Hansen, M.C. Mapping Wetlands in Indonesia using Landsat and PALSAR Data-Sets and Derived Topographical Indices. Geo-Spat. Inf. Sci. 2014, 17, 60–71. [Google Scholar] [CrossRef]
- Xu, Y.; Huang, B. Spatial and Temporal Classification of Synthetic Satellite Imagery: Land Cover Mapping and Accuracy Validation. Geo-Spat. Inf. Sci. 2014, 17, 1–7. [Google Scholar] [CrossRef]
- Hansen, M.C.; Loveland, T.R. A Review of Large Area Monitoring of Land Cover Change Using Landsat Data. Remote Sens. Environ. 2012, 122, 66–74. [Google Scholar] [CrossRef]
- Zhai, K.; Wu, X.; Qin, Y.; Du, P. Comparison of Surface Water Extraction Performances of Different Classic Water Indices using OLI and TM Imageries in Different Situations. Geo-Spat. Inf. Sci. 2015, 18, 32–42. [Google Scholar] [CrossRef]
- Du, P.; Liu, S.; Liu, P.; Tan, K.; Cheng, L. Sub-pixel Change Detection for Urban Land-cover Analysis via Multi-temporal Remote Sensing Images. Geo-Spat. Inf. Sci. 2014, 17, 26–38. [Google Scholar] [CrossRef]
- Friedl, M.A.; Brodley, C.E. Decision Tree Classification of Land Cover from Remotely Sensed Data. Remote Sens. Environ. 1997, 61, 399–409. [Google Scholar] [CrossRef]
- Jiang, B.; Bamutaze, Y.; Pilesjö, P. Climate Change and Land Degradation in Africa: A Case Study in the Mount Elgon Region, Uganda. Geo-Spat. Inf. Sci. 2014, 17, 39–53. [Google Scholar] [CrossRef]
- Brown, M.; De Beurs, K.; Marshall, M. Global Phenological Response to Climate Change in Crop Areas Using Satellite Remote Sensing of Vegetation, Humidity and Temperature Over 26years. Remote Sens. Environ. 2012, 126, 174–183. [Google Scholar] [CrossRef]
- Bello, O.M.; Aina, Y.A. Satellite Remote Sensing as A Tool in Disaster Management and Sustainable Development: Towards A Synergistic Approach. Proced.-Soc. Behav. Sci. 2014, 120, 365–373. [Google Scholar] [CrossRef]
- Elvidge, C.D.; Baugh, K.E.; Kihn, E.A.; Kroehl, H.W.; Davis, E.R.; Davis, C.W. Relation Between Satellite Observed Visible-near Infrared Emissions, Population, Economic Activity and Electric Power Consumption. Int. J. Remote Sens. 1997, 18, 1373–1379. [Google Scholar] [CrossRef]
- Ghosh, T.; Powell, R.L.; Elvidge, C.D.; Baugh, K.E.; Sutton, P.C.; Anderson, S. Shedding Light on the Global Distribution of Economic Activity. Open Geogr. J. 2010, 3, 148–161. [Google Scholar]
- Henderson, J.V.; Storeygard, A.; Weil, D.N. Measuring Economic Growth from Outer Space. Am. Econ. Rev. 2012, 102, 994–1028. [Google Scholar] [CrossRef] [PubMed]
- Amaral, S.; Câmara, G.; Monteiro, A.M.V.; Quintanilha, J.A.; Elvidge, C.D. Estimating Population and Energy Consumption in Brazilian Amazonia using DMSP Night-time Satellite Data. Computers, Environ. Urban Syst. 2005, 29, 179–195. [Google Scholar] [CrossRef]
- Li, X.; Xu, H.; Chen, X.; Li, C. Potential of NPP-VIIRS Nighttime Light Imagery for Modeling the Regional Economy of China. Remote Sens. 2013, 5, 3057–3081. [Google Scholar] [CrossRef]
- Gibson, J.; Li, C.; Boe-Gibson, G. Economic Growth and Expansion of China’s Urban Land Area: Evidence from Administrative Data and Night Lights, 1993–2012. Sustainability 2014, 6, 7850–7865. [Google Scholar] [CrossRef]
- Liu, Z.F.; He, C.Y.; Zhang, Q.F.; Huang, Q.X.; Yang, Y. Extracting the Dynamics of Urban Expansion in China using DMSP-OLS Nighttime Light Data from 1992 to 2008. Lands. Urban Plan. 2012, 106, 62–72. [Google Scholar] [CrossRef]
- Waluda, C.M.; Griffiths, H.J.; Rodhouse, P.G. Remotely Sensed Spatial Dynamics of the Illex Argentinus Fishery, Southwest Atlantic. Fish. Res. 2008, 91, 196–202. [Google Scholar] [CrossRef]
- Shi, K.; Yu, B.; Huang, Y.; Hu, Y.; Yin, B.; Chen, Z.; Chen, L.; Wu, J. Evaluating the Ability of NPP-VIIRS Nighttime Light Data to Estimate the Gross Domestic Product and the Electric Power Consumption of China at Multiple Scales: A Comparison with DMSP-OLS Data. Remote Sens. 2014, 6, 1705–1724. [Google Scholar] [CrossRef]
- Shi, K.; Huang, C.; Yu, B.; Yin, B.; Huang, Y.; Wu, J. Evaluation of NPP-VIIRS Night-time Light Composite Data for Extracting Built-up Urban Areas. Remote Sens. Lett. 2014, 5, 358–366. [Google Scholar] [CrossRef]
- Huang, Q.; He, C.; Gao, B.; Yang, Y.; Liu, Z.; Zhao, Y.; Dou, Y. Detecting the 20 Year City-size Dynamics in China with a Rank Clock Approach and DMSP/OLS Nighttime Data. Lands. Urban Plan. 2015, 137, 138–148. [Google Scholar] [CrossRef]
- Zhou, Y.; Smith, S.J.; Elvidge, C.D.; Zhao, K.; Thomson, A.; Imhoff, M. A Cluster-based Method to Map Urban Area from DMSP/OLS nightlights. Remote Sens. Environ. 2014, 147, 173–185. [Google Scholar] [CrossRef]
- Li, X.; Zhang, R.; Huang, C.; Li, D. Detecting 2014 Northern Iraq Insurgency Using Night–Time Light Imagery. Int. J. Remote Sens. 2015, 36, 3446–3458. [Google Scholar] [CrossRef]
- Li, X.; Li, D. Can Night-time Light Images Play a Role in Evaluating the Syrian Crisis? Int. J. Remote Sens. 2014, 35, 6648–6661. [Google Scholar] [CrossRef]
- Li, X.; Ge, L.; Chen, X. Detecting Zimbabwe’s Decadal Economic Decline Using Nighttime Light Imagery. Remote Sens. 2013, 5, 4551–4570. [Google Scholar] [CrossRef]
- Doll, C.N.H.; Muller, J.P.; Morley, J.G. Mapping Regional Economic Activity from Night-time Light Satellite Imagery. Ecol. Econ. 2006, 57, 75–92. [Google Scholar] [CrossRef]
- Chen, X.; Nordhaus, W.D. Using Luminosity Data as a Proxy for Economic Statistics. Proc. Natl. Acad. Sci. 2011, 108, 8589–8594. [Google Scholar] [CrossRef] [PubMed]
- Doll, C.N.H.; Muller, J.P.; Elvidge, C.D. Night-time Imagery as a Tool for Global Mapping of Socioeconomic Parameters and Greenhouse Gas Emissions. Ambio 2000, 29, 157–162. [Google Scholar] [CrossRef]
- He, C.; Ma, Q.; Liu, Z.; Zhang, Q. Modeling the Spatiotemporal Dynamics of Electric Power Consumption in Mainland China Using Saturation-corrected DMSP/OLS Nighttime Stable Light Data. Inter. J. Digit. Earth 2013, 7, 1–22. [Google Scholar] [CrossRef]
- Min, B. Democracy and Light: Electoral Accountability and the Provision of Public Goods. In Proceedings of Annual Meeting of the Midwest Political Science Association, Chicago, IL, USA, 3 April 2008.
- Better Life For All? Democratization and Electrification in Post-Apartheid South Africa. Available online: http://personal.lse.ac.uk/LARCINES/electrification%202014%20working%20paper.pdf (accessed on 16 September 2015).
- Yang, Y.; He, C.Y.; Zhang, Q.F.; Han, L.J.; Du, S.Q. Timely and Accurate National-scale Mapping of Urban Land in China Using Defense Meteorological Satellite Program’s Operational Linescan System Nighttime Stable Light Data. J. Appl. Remote Sens. 2013, 7, 1–35. [Google Scholar] [CrossRef]
- Yi, K.; Tani, H.; Li, Q.; Zhang, J.; Guo, M.; Bao, Y.; Wang, X.; Li, J. Mapping and Evaluating the Urbanization Process in Northeast China Using DMSP/OLS Nighttime Light Data. Sensors 2014, 14, 3207–3226. [Google Scholar] [CrossRef] [PubMed]
- Tan, M. Urban Growth and Rural Transition in China Based on DMSP/OLS Nighttime Light Data. Sustainability 2015, 7, 8768–8781. [Google Scholar] [CrossRef]
- Elvidge, C.; Baugh, K.; Anderson, S.; Sutton, P.; Ghosh, T. The Night Light Development Index (NLDI): A Spatially Explicit Measure of Human Development from Satellite Data. Soc. Geogr. 2012, 7, 23–35. [Google Scholar] [CrossRef]
- Zhou, Y.K.; Ma, T.; Zhou, C.H.; Xu, T. Nighttime Light Derived Assessment of Regional Inequality of Socioeconomic Development in China. Remote Sens. 2015, 7, 1242–1262. [Google Scholar] [CrossRef]
- Liu, J.; Li, W. A Nighttime Light Imagery Estimation of Ethnic Disparity in Economic Well-being in Mainland China and Taiwan (2001–2013). Eurasian Geogr. Econ. 2014, 55, 691–714. [Google Scholar] [CrossRef]
- Kuechly, H.U.; Kyba, C.C.M.; Ruhtz, T.; Lindemann, C.; Wolter, C.; Fischer, J.; Holker, F. Aerial Survey and Spatial Analysis of Sources of Light Pollution in Berlin, Germany. Remote Sens. Environ. 2012, 126, 39–50. [Google Scholar] [CrossRef]
- Keola, S.; Andersson, M.; Hall, O. Monitoring Economic Development from Space: Using Nighttime Light and Land Cover Data to Measure Economic Growth. World Dev. 2015, 66, 322–334. [Google Scholar] [CrossRef]
- Wang, M. Key Issues in China’s Development; China Development Press: Beijing, China, 2005. [Google Scholar]
- 1 KM Grid Population Dataset of China. Available online: http://www.geodoi.ac.cn/WebEn/doi.aspx?Id=131 (accessed on 16 September 2015).
- Global Radiance Calibrated Nighttime Lights. Available online: http://ngdc.noaa.gov/eog/dmsp/download_radcal.html (accessed on 16 September 2015).
- Ma, L.; Wu, J.S.; Li, W.F.; Peng, J.; Liu, H. Evaluating Saturation Correction Methods for DMSP/OLS Nighttime Light Data: A Case Study from China’s Cities. Remote Sens. 2014, 6, 9853–9872. [Google Scholar] [CrossRef]
- Letu, H.; Hara, M.; Tana, G.; Nishio, F. A Saturated Light Correction Method for DMSP/OLS Nighttime Satellite Imagery. IEEE Trans. Geosci. Remote Sens. 2012, 50, 389–396. [Google Scholar] [CrossRef]
- National Geophysical Data Center. Version 4 DMSP-OLS Nighttime Lights Time Series. Available online: http://ngdc.noaa.gov/eog/dmsp/downloadV4composites.html (accessed on 16 September 2015).
- Tuttle, B.T.; Anderson, S.J.; Sutton, P.C.; Elvidge, C.D.; Baugh, K. It Used To Be Dark Here. Photogramm. Eng. Remote Sens. 2013, 79, 287–297. [Google Scholar] [CrossRef]
- Wan, G. Understanding Regional Poverty and Inequality Trends in China: Methodological Issues and Empirical Findings. Rev. Income Wealth 2007, 53, 25–34. [Google Scholar] [CrossRef]
- Ye, J.; James, M.; Wang, Y. Left-Behind Children in Rural China; Paths International Limited: Reading, UK, 2011. [Google Scholar]
© 2015 by the authors; licensee MDPI, Basel, Switzerland. This article is an open access article distributed under the terms and conditions of the Creative Commons Attribution license (http://creativecommons.org/licenses/by/4.0/).
Share and Cite
Xu, H.; Yang, H.; Li, X.; Jin, H.; Li, D. Multi-Scale Measurement of Regional Inequality in Mainland China during 2005–2010 Using DMSP/OLS Night Light Imagery and Population Density Grid Data. Sustainability 2015, 7, 13469-13499. https://doi.org/10.3390/su71013469
Xu H, Yang H, Li X, Jin H, Li D. Multi-Scale Measurement of Regional Inequality in Mainland China during 2005–2010 Using DMSP/OLS Night Light Imagery and Population Density Grid Data. Sustainability. 2015; 7(10):13469-13499. https://doi.org/10.3390/su71013469
Chicago/Turabian StyleXu, Huimin, Hutao Yang, Xi Li, Huiran Jin, and Deren Li. 2015. "Multi-Scale Measurement of Regional Inequality in Mainland China during 2005–2010 Using DMSP/OLS Night Light Imagery and Population Density Grid Data" Sustainability 7, no. 10: 13469-13499. https://doi.org/10.3390/su71013469
APA StyleXu, H., Yang, H., Li, X., Jin, H., & Li, D. (2015). Multi-Scale Measurement of Regional Inequality in Mainland China during 2005–2010 Using DMSP/OLS Night Light Imagery and Population Density Grid Data. Sustainability, 7(10), 13469-13499. https://doi.org/10.3390/su71013469