1. Introduction
The rapid changes in technologies and globalization process have altered the previous rules of competition, and innovation has become increasingly essential for companies to remain competitive in the market [
1,
2]. Many studies have indicated that innovation can positively affect industrial firms by enhancing their competitiveness [
3]. Technological innovation in the form of new or improved products and processes can be an important source of market and cost advantages for a firm; it can also increase the demand by product differentiation and enhance the ability of firms to innovate [
4]. Innovation is different from generating an idea, a method of executing works or technology. Instead, innovation must be considered a sustainable and continuous process of identifying and seizing opportunities in the ever-changing business environment [
2,
5]. Consequently, companies must commit to sustainability of their overall innovation capability, which is the critical driver toward sustained competitive advantages [
6]. In fact, the sustainability of overall innovation capability has become a reality for companies through a continuous, evolving, and mastered management of the innovation process [
2]. Rejeb
et al. [
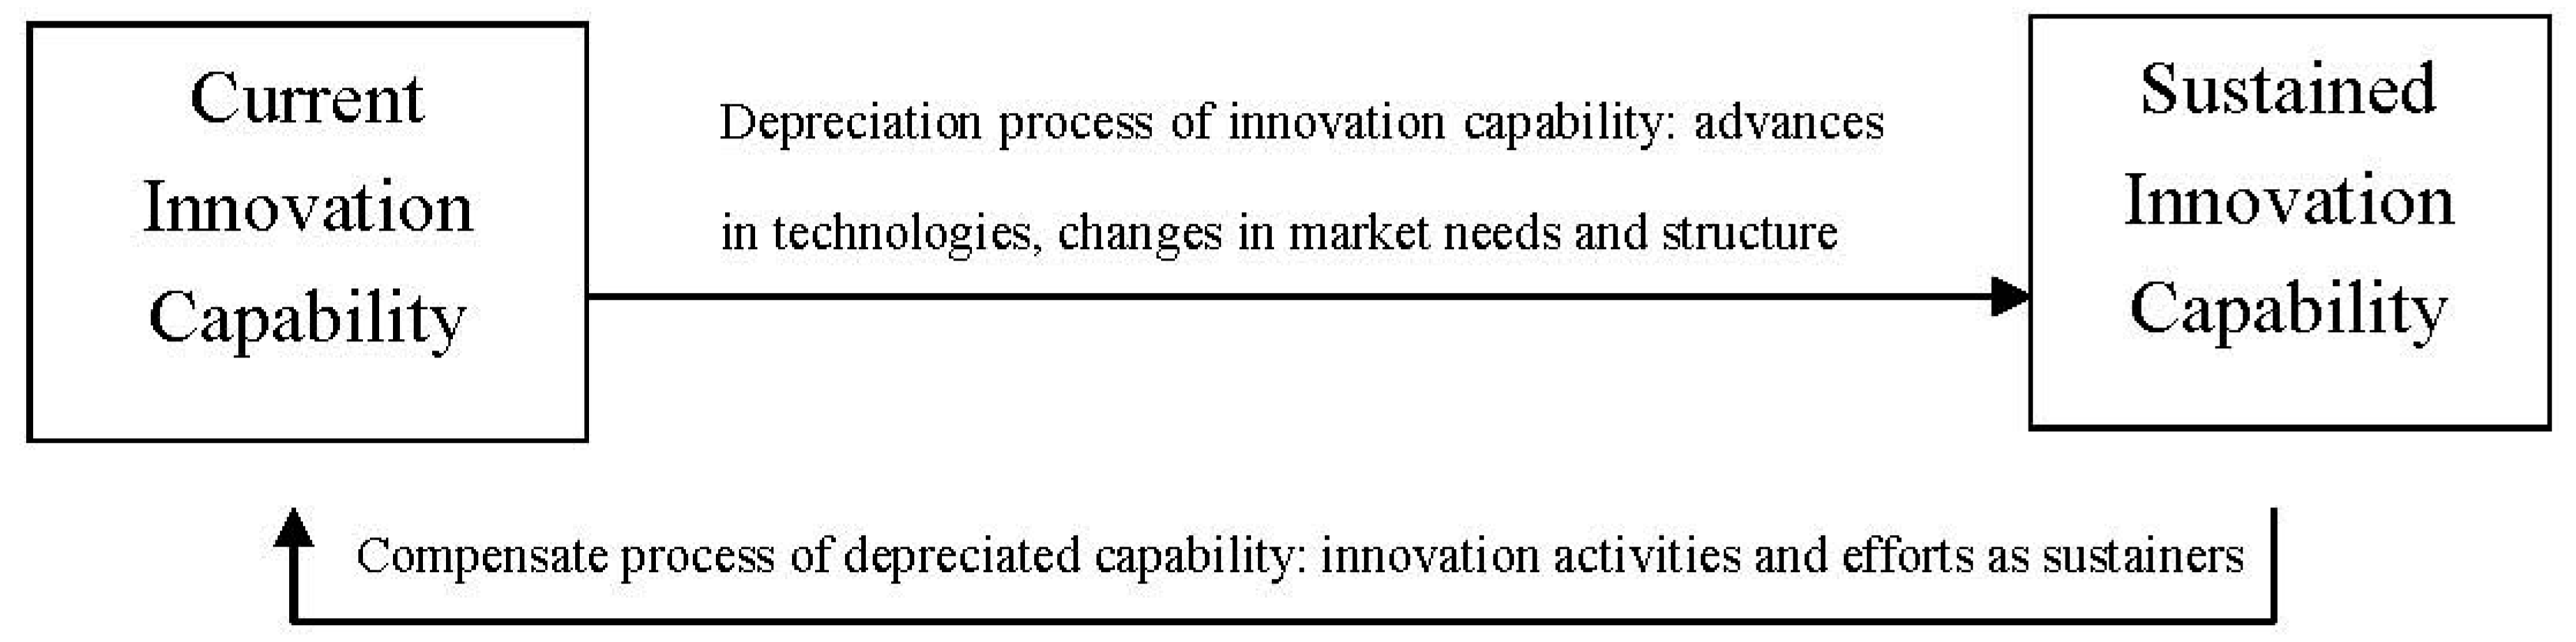
2] concluded that measuring the innovation activities and efforts of a firm is a crucial mechanism of ensuring a sustainable innovation capability via effective innovation management (
Figure 1).
Figure 1.
Innovation activities and efforts as sustainers of innovation capability.
Figure 1.
Innovation activities and efforts as sustainers of innovation capability.
For many companies, quantifying and assessing the process of innovation and its practices is an important and complex issue [
7]. In particular, an important challenge in accomplishing such a process is measuring innovation activities, particularly the complex processes that affect the innovation capabilities of an organization to be optimally managed [
8]. Measuring innovation capability is critical for both practitioners and academicians, yet the literature is characterized by diverse approaches, prescriptions, and practices that can be confusing and contradictory [
9].
The literature indicates a considerable body of research in the field of innovation capability measurement [
9,
10]. The majority of studies focus on measuring the current state of innovation capabilities in terms of inputs and outputs of the innovation process, disregarding the concluding improvement dynamism of the process [
2,
9,
10]. In this case, a strong limitation exists in terms of a dynamic capability standpoint; the activities that sustain the innovation capabilities are not evaluated. Thus, this study focuses on gauging innovation based on managerial activities and efforts instead of the outputs or inputs of the innovation process.
This study aims to develop a scale for measuring the sustainability of overall innovation capability construct based on innovation activities and to assess the psychometric properties of this scale. The remainder of the paper is organized into six sections. Following the Introduction,
Section 2 briefly reviews the literature related to innovation measurement.
Section 3 explains the methods employed in this study for the measurements, sampling, data collection, and analyses.
Section 4 describes the results of the analyses using both descriptive and inferential methods, and
Section 5 discusses the findings. Finally,
Section 6 concludes the paper.
2. Innovation Measurement
Substantial research was conducted in the field of innovation measurement in the national and firm levels [
2,
11]. The majority of these studies evaluated the innovativeness of a firm based on the inputs or outputs of the innovation process to consider the process as inputs, activities, and outputs [
12,
13,
14,
15,
16]. This approach to innovation measurement has certain drawbacks, especially in the cases of Small And Medium-Sized Enterprises (SMEs) and companies of developing countries.
The level of research and development (R&D) expenditures is repeatedly used as the overall measure of the innovativeness of firms [
9,
10]. However, R&D is an input to innovation process that does not essentially lead to innovations [
17,
18]. Therefore, R&D expenditures are assumed as an over-estimated measure of innovativeness because they consider unsuccessful R&D efforts [
10]. Moreover, all new products and processes are not essentially generated in R&D laboratories [
19]. Innovations can emerge in response to a specific problem or a smart idea that the innovator unexpectedly had. In this case, evaluating innovativeness by using R&D expenditures underestimates the level of innovativeness [
10]. Eventually, the R&D data that are used as an indicator of innovation favor large firms than the SMEs because the R&D efforts of the latter are often informal, may not be recorded [
18,
20], or are infrequent [
19].
Patent data are one of the intermediate output measures that are frequently used as the global measure of innovativeness of firms. These data, however, gauge inventions rather than innovations [
17,
21,
22]. Innovation refers to the process of converting an invention into a useful and marketable new or improved product or process. Measuring innovation with patent data has the risk of overestimating the level of innovativeness by counting in the measurement of the inventions that are not transformed into marketable innovations [
10]. The tendency to patent innovations varies between industries [
19]. For various reasons (e.g., high costs, difficulties in patenting process, relatively high imitation costs,
etc.), certain companies prefer to protect their innovations by performing other appropriate methods, such as maintaining a lead time over rivals, industrial secrecy, and technological complexity [
18,
23,
24]. All innovations are not required to be patented. Hence, patent data are an imprecise measurement of innovation [
10].
The literature also indicates two sets of output-based measures of assessing the innovativeness of a firm. These sets of measures are the direct innovation count and firm-based surveys. In the first method, which can be considered an objective approach, the data on innovation are collected from various sources, such as new product/process announcements, databases, and specialized journals [
10]. In the second measurement method, which can be regarded as a subjective approach, the surveys conducted with companies and the information on innovations is collected from firms through interviews and/or surveys [
10].
However, the innovation count and firm-based surveys have some deficiencies. In practice, the innovation count favors product over process innovations [
17,
18,
25] and radical innovations over incremental ones [
22]. Moreover, this approach excludes failed innovations and avoids any comparative analysis of success and failure innovations. In this method, the researcher must assess the innovations under study. However, because the researcher is not a professional in different fields, such assessment may lead to idiosyncratic bias. Consequently, a set of experts are required to measure the innovations [
23].
The major drawbacks of firm-based surveys are the representativeness of the measurement results and the fact that the answer rates are insignificant [
26]. Another disadvantage of this method is related to its methodology, which measures the newness or innovativeness of a firm by asking dichotomous questions; one of which is whether firms have innovated or not. Amara
et al. [
27] noted that the results of this type of question indicated that the proportion of innovative firms has constantly and significantly increased for the last decade; in some countries, the proportion has increased to approximately 80%. However, the research findings based on this approach of innovation measurement are becoming less and less valuable because empirical studies, instead of shedding new light on the nature of innovation process and its related factors, present further evidence, which confirms previous results [
10].
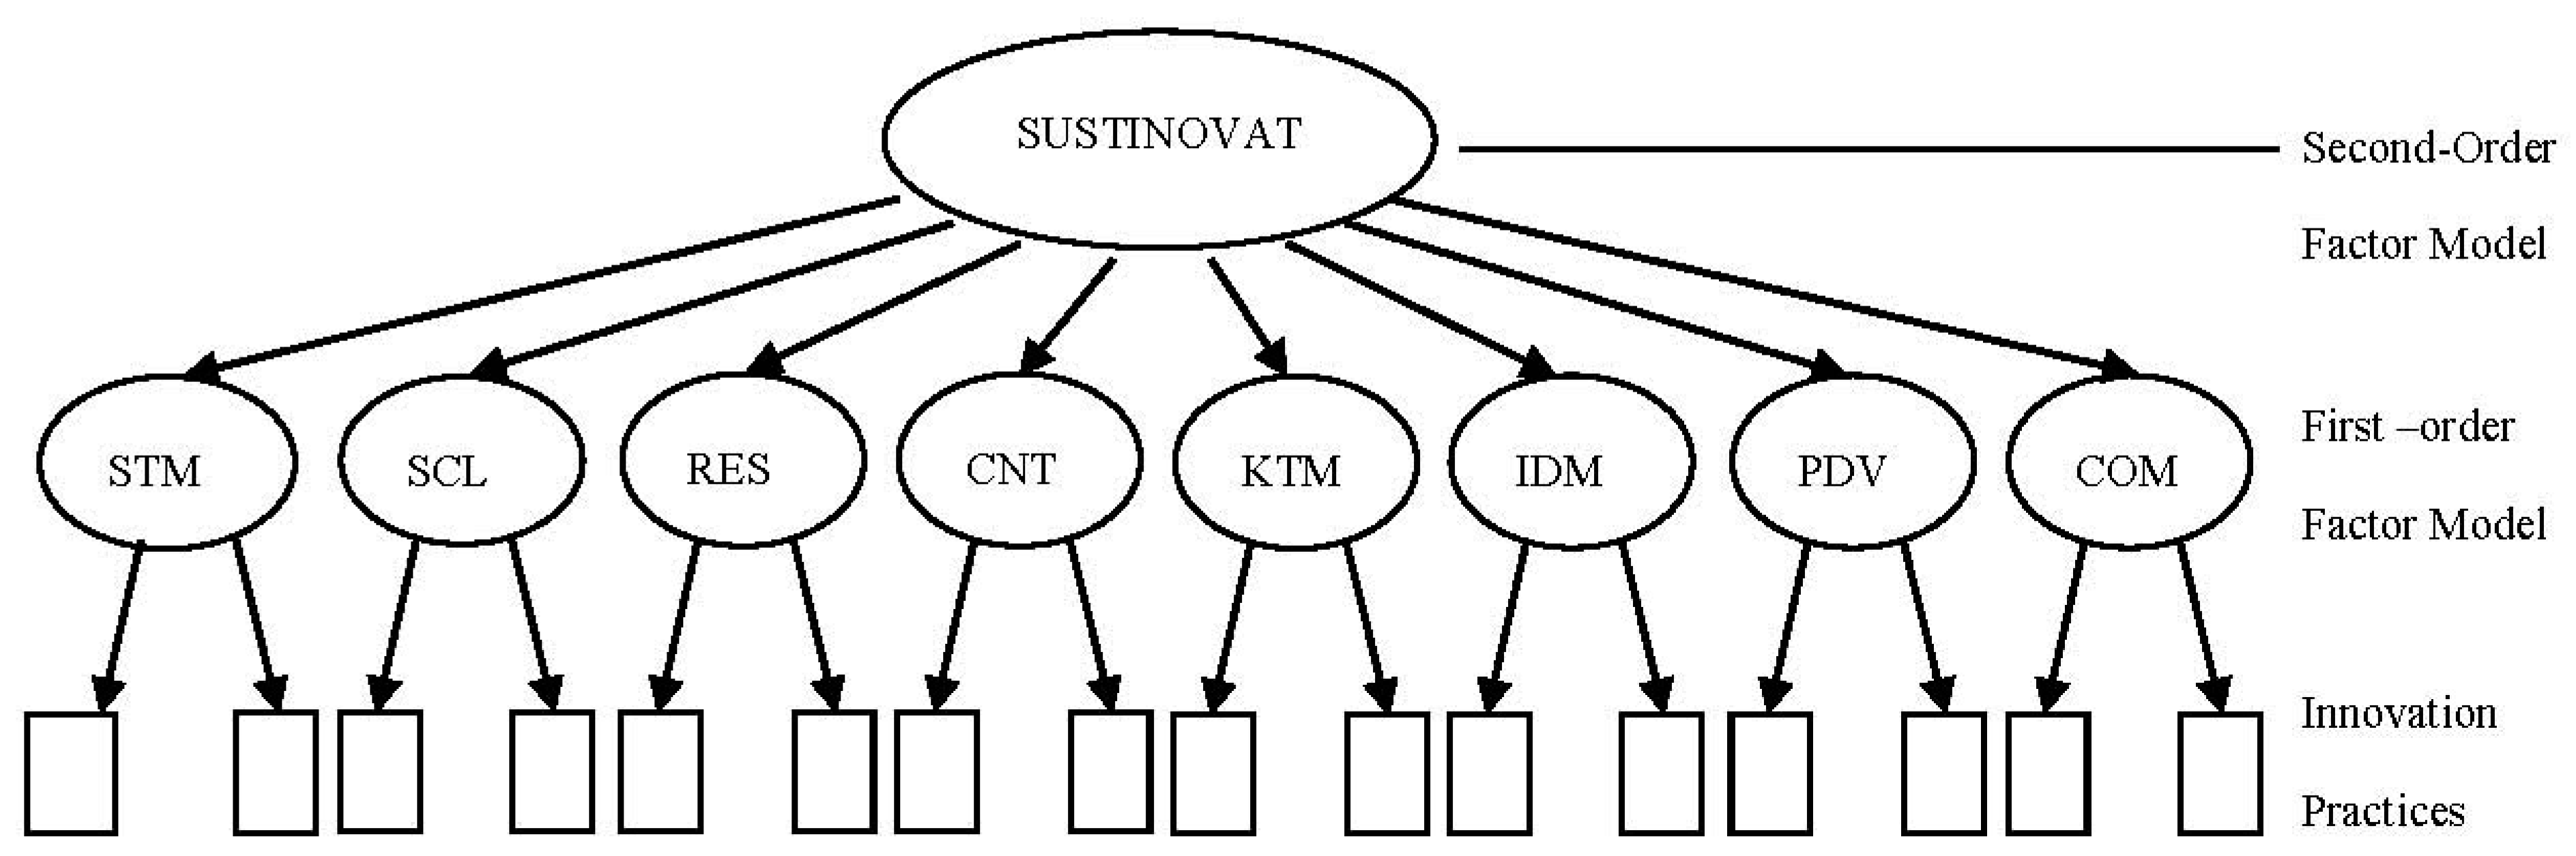
In summary, this research is motivated by reviewing the above limits in the present innovation measurement approaches, which focus only on measuring the inputs and/or outputs of the innovation process. This study proposes a construct termed “Sustainability of Overall Innovation Capability” (SUSTINOVAT) and a measurement model for evaluating the construct. The SUSTINOVAT construct is regarded as a proxy of the ability of a firm to maintain or improve its innovation capabilities for future innovations against factors that depreciate such capabilities over time (e.g., advances in technologies, changes in customers’ expectations or market structures, changes in competitors’ competencies). Sustained innovation capability is achieved by a firm by conducting innovation activities and efforts to compensate its depreciated capabilities or even improve its overall innovation capability over time. The SUSTINOVAT’s measurement model is a developed scale that measures the SUSTINOVAT construct based on evaluating the innovation activities and efforts of a firm rather than innovation inputs or outputs. This new approach of measuring innovation is consistent with the recommendation of OECD [
4] for developing countries, that is, “measurement exercises should focus on the innovation process rather than its output and emphasis on how capabilities efforts and results are dealt with” (p. 139).
3. Research Method
Several procedures, including domain identification, item generation, data collection, scale development, and scale qualification, were completed to develop a scale of measuring the SUSTINOVAT construct [
28].
3.1. Specifying Domain of the Construct
Churchill [
28] elucidated that the first step in developing a scale of measuring a construct is to delineate what must be included in and/or excluded from the definition of the construct. The definition of Szeto [
29], that is, “A continuous improvement of the overall capability of firms to generate innovation” was initially used to delineate the domain of the SUSTINOVAT construct. Innovations may manifest in different forms comprising product, process, organizational and marketing innovations [
4]. This study focuses on product and process innovations. The degree of novelty can vary ranging from the incremental improvements in existing products and process to radical changes in the form of entirely new products and processes. This research included both improvements in the existing products and processes and the generation of entirely new ones. These four types of innovations are very close to the definition provided for technological product and process innovation in the 2nd Edition of the Oslo manual [
22]. However, the manual excludes minor improvements, which are otherwise included in the domain of this study because these improvements are the dominant form of innovations in the low and medium technological industries and in the SMEs in developing countries. This remark implies that the scale developed in this study excludes organizational and marketing innovations, yet incorporates commercialization activities as a major part of product and process innovation capability. Similarly, those organizational activities (e.g., strategic management or establishment of a supportive culture) that enable industrial firms for product and process innovations are also included in the domain of this study. Based on the above discussions, the sustainability of overall innovation capability is “the ability of a firm to maintain or improve its product and process innovation capabilities over time by carrying out activities related to innovation generation, commercialization and management process successfully”.
3.2. Item Generation
The literature review and expert survey were adopted to determine the innovation activities that may potentially sustain the overall innovation capability. A list of innovation practices was extracted. The extracted items were investigated by a multi-disciplinary consultant team, involving the academics and practitioners of innovation, SMEs, and measurement context, to examine the comprehensiveness, appropriateness, and possible overlap of the items. Consequently, some of the primary practices were eliminated, a number of new practices were suggested, and a few of them were combined.
A draft questionnaire was designed. The respondents were asked to specify the extent to which each of the practices is institutionalized in their company. A pilot test was performed in 10 industrial SMEs to improve the wording, sequence, appropriateness, and clarity of the questionnaire. Finally, 45 items were developed as measures of the SUSTINOVAT construct, known as the innovation practices (Ips).
3.3. Sampling Design
The subcontractor-SMEs of Iranian automaker companies were selected as the target population of this research. UNIDO [
30] stated that industrial SMEs have high potential to grow in Iran. Activating this potential depends on improving the competitiveness capacity of the firms. The automobile industry is the second largest in Iran, following oil and gas. This is the only industry of Iran in which the backward linkage between large-scale companies and SMEs has formed very well [
30].
All the active firms in this industry must have ISO-9000 and ISO-TS certification as the minimum requirement. These certificates have formed basic systems and procedures, which have facilitated information generation, documentation, and accessibility. Thus, the tendency of the respondents from the auto-industry to participate in this survey and the quality of their responses are assumed to be higher compared with those of the SMEs of other industries. A randomly-selected list of 400 industrial SMEs in the auto-industry was prepared. The agreement of managers and/or expert members of involved companies were sought at the 7th International Auto Part Exhibition (29 November to 2 December 2012) to participate in this survey in order to improve the response rate of the survey.
3.4. Data Collection
A survey questionnaire was developed to collect the data. The questionnaire involved three sets of questions regarding: (1) the demographic information of respondents and their firms; (2) the innovation practices; and (3) the state of innovation-related competitive performance of the firm. The respondents must be selected from individuals that are well matched to the context of this study. In particular, the potential respondents were recognized as managing directors, R&D managers, engineering managers, and well-informed experts based on the decision of firms. All the potential respondents were familiar with the topic of this study and were involved in the innovation process of their company. The questionnaire was distributed among the sample firms via email, which contained the questionnaire as a web-based link, as adopted by Forsman [
31]. A reminder email was sent to those who did not respond, two weeks after the first email. A total of 181 responses were received, among which six were ignored because they were missing significant data. A total of 175 questionnaires with 43.75% response rate were used for data analysis. The non-response bias was assessed by comparing the means in the last quartile of responses and other three quartiles, as suggested by Armstrong and Overton [
32]. The results of the
t test (
t = 0.932,
sig. = 0.353) verified the absence of significant non-response bias in the data.
5. Discussion of Findings
This research aimed to develop a model of measuring the SUSTINOVAT construct, which is deemed crucial for the further development of innovation research. The findings of this study revealed that SUSTINOVAT can be considered an 8D construct, including strategic management, supportive culture and structure, resource allocation, communication and networking, knowledge and technology management, idea management, project development, and commercialization capabilities. This study also proposed a second-order factor model of gauging the 8D model of SUSTINOVAT. This section aims to systematically evaluate the measurement properties of the second-order measurement model. Achieving such objective requires testing the model in terms of the key component of quality comprising content validity, reliability, unidimensionality and convergent validity, and discriminant and nomological validity.
5.1. Content Validity
An acceptable level of content validity was expected in the developed measurement scale as a result of using a logical process of scale development. The items were initially selected via an extensive related literature review, which improved the comprehensiveness and relevance of the items. Subsequently, the items were screened by an expert team, comprising the academics and practitioners in the context of measurement, innovation, and SME sector. The expert team examined the items in terms of appropriateness, applicability, overlap, and ambiguity. Finally, a draft questionnaire was designed, and a pilot test was performed involving 10 managers or experts of the industrial SMEs as potential respondents to improve the wording, sequence, appropriateness, and clarity of the final version of the questionnaire.
5.2. Reliability
Reliability is the extent to which a set of variables is consistent in what it is intended to measure [
33]. The reliability of the measurement models was assessed with the measures of the coefficient alpha [
37], item-total correlations [
38], indicator reliability [
39], and composite reliability [
40].
Table 3 provides the various reliability estimates of the individual indicators and their respective latent variables (
i.e., SUSTINOVAT dimensions).
Table 3.
Assessment of reliability of measurement models.
Table 3.
Assessment of reliability of measurement models.
| Dimension | Indicator | Item-Total Correlation | Coefficient Alpha | Indicator reliability | Composite Reliability |
|---|
| Strategic Management | | | 0.887 | | 0.894 |
| | STM1 | 0.798 | | 0.867 | |
| | STM2 | 0.826 | | 0.822 | |
| | STM3 | 0.806 | | 0.817 | |
| | STM4 | 0.671 | | 0.394 | |
| Supportive Culture | | | 0.929 | | |
| | SCL1 | 0.863 | | 0.774 | |
| | SCL2 | 0.791 | | 0.627 | |
| | SCL3 | 0.918 | | 0.927 | |
| | SCL4 | 0.770 | | 0.560 | |
| Resource Allocation | | | 0.896 | | 0.896 |
| | RES1 | 0.816 | | 0.793 | |
| | RES2 | 0.791 | | 0.744 | |
| | RES3 | 0.765 | | 0.644 | |
| | RES4 | 0.720 | | 0.565 | |
| Communication and networking | | | 0.935 | | 0.925 |
| | CNT1 | 0.827 | | 0.803 | |
| | CNT2 | 0.868 | | 0.822 | |
| | CNT3 | 0.865 | | 0.752 | |
| | CNT4 | 0.790 | | 0.642 | |
| Knowledge and technology management | | | 0.939 | | 0.939 |
| | KTM1 | 0.927 | | 0.915 | |
| | KTM2 | 0.869 | | 0.855 | |
| | KTM3 | 0.890 | | 0.770 | |
| | KTM4 | 0.856 | | 0.705 | |
| | KTM5 | 0.707 | | 0.541 | |
| Idea Management | | | 0.939 | | 0.929 |
| | IDM1 | 0.829 | | 0.744 | |
| | IDM2 | 0.890 | | 0.857 | |
| | IDM3 | 0.869 | | 0.756 | |
| | IDM4 | 0.842 | | 0.735 | |
| Project Development | | | 0.924 | | 0.918 |
| | PDV1 | 0.764 | | 0.618 | |
| | PDV2 | 0.782 | | 0.665 | |
| | PDV3 | 0.811 | | 0.701 | |
| | PDV4 | 0.845 | | 0.764 | |
| | PDV5 | 0.810 | | 0.712 | |
| Commercialization | | | 0.940 | | 0.928 |
| | COM1 | 0.817 | | 0.698 | |
| | COM2 | 0.873 | | 0.791 | |
| | COM3 | 0.875 | | 0.740 | |
| | COM4 | 0.876 | | 0.730 | |
| | COM5 | 0.641 | | 0.643 | |
The coefficient alpha and composite reliability represent the internal consistency of the set of items for each dimension.
Table 3 indicates that the values of the coefficient alpha range from 0.887 to 0.940, exceeding the commonly accepted level of 0.7 [
38]. The results of the assessment demonstrate that, for each SUSTINOVAT dimension, the various indicators that constitute the scale are strongly correlated with one another.
Table 3 further specifies that the values of the composite reliability estimates range from 0.89 to 0.939, exceeding the threshold level of 0.7 [
41]. In other words, for each latent variable, the trait variance accounts for more than 70% of the overall measure variance.
Table 3 also exhibits the item-total correlation and indicator reliability for each of the indicators. The values of the indicator reliability range from 0.541 to 0.915, which are all greater than the threshold level of 0.5 [
41]. Similarly, all the item-total correlations are greater than 0.5, indicating that each indicator significantly correlates with the rest of the indicators purported to measure the same latent variable [
38]. Overall, the results in
Table 3 provide empirical evidence for the reliability of the measures.
5.3. Unidimensionalty and Convergent Validity
Unidimensionality refers to the existence of a single trait, which governs a set of measures and is achieved when these measuring items contain acceptable factor loadings for the respective latent construct [
33]. Meanwhile, convergent validity is the consistency in measurement across operationalizations and is achieved when all the items in a measurement model are statistically significant [
33].
In this study, the unidimensionality and convergent validity of the second-order model (depicted in
Figure 2) were evaluated with the CFA by assessing the overall model fit. The results of the CFA are summarized in
Table 4.
Table 4.
Assessment of unidimensionality and convergent validity of the second-order model.
Table 4.
Assessment of unidimensionality and convergent validity of the second-order model.
| Dimension | Estimates of β | t-value | Fit Statistics |
|---|
| STM | 0.712 | ** | χ2(552) = 798.970 |
| SCL | 0.623 | 4.355 * | p = 0.000 |
| RES | 0.848 | 5.173 * | χ2/df = 1.447 |
| CNT | 0.483 | 3.525 * | GFI (Goodness of Fit Index) = 0.683 |
| KTM | 0.634 | 4.140 * | NFI (Normed Fit Index) = 0.784 |
| IDM | 0.530 | 3.754 * | CFI (Comparative Fit Index) = 0.920 |
| PDV | 0.564 | 3.967 * | RMSEA (Square Error of Approximation) = 0.072 |
| COM | 0.705 | 4.541 * | |
The 8D second-order model did not provide a good fit to the data when it was evaluated with the chi-square statistic alone. However, the evaluation results revealed that the normed χ
2 (χ
2/df = 1.447) is within an acceptable range (χ
2/df < 2) [
35,
39], also the values of CFI (0.920) is greater than 0.9, whereas the value of GFI (0.864) and NFI (0.784) fall short of the threshold level 0.9. Similarly, the value of RMSEA (0.072) is within an acceptable range (RMSEA < 0.08) [
35].
Table 4 indicates that, for one of the dimensions (CNT), β-value = 0.483. This finding signifies that the CNT and SUSTINOVAT constructs have a relatively weak correlation. Nevertheless, the other β-values are greater than the threshold of 0.50, and the entire second-order factor loadings (β) are statistically significant with associated
t-values at
p < 0.001. The model fit was also examined with the standardized residuals. The standardized residual matrix implies that less than 1% of cells have standardized residuals over 2.5. No more than 10% of the absolute values of the standardized residuals must generally be greater than 2.5 [
42]. Considering the above elements, all of the key statistics consistently support the unidimensionality and convergent validity of the 8D second-order model of measuring the SUSTINOVAT construct.
5.4. Discriminant Validity
Discriminant validity refers to the extent to which the measures of a latent variable (i.e., each SUSTINOVAT dimension) are unique and are thus different from the measures of other constructs. In this study, three different procedures, namely, the chi-square different, confidence intervals, and variance extracted tests, are conducted to assess the discriminant validity.
5.4.1. Chi-square Difference Test
With the chi-square different test [
43,
44], the assessment of discriminant validity is achieved by completing a series of pairwise tests, comparing the unconstrained (Model 1) and constrained (Model 2) models. These pairwise tests aim to examine whether the correlation between any two dimensions is significantly different from the unity. In Model 1, the covariance between two dimensions is unconstrained, that is, the dimensions are allowed to covary. In Model 2, the covariance between two dimensions is constrained to one. Compared with Model 2, Model 1 has a significant lower chi-square statistic that supports the discriminant validity.
Table 5 summarizes the results of the 28 pairwise comparisons of eight SUSTINOVAT dimensions. The estimates of between-dimension correlations (φ) range from 0.007 to 0.690, providing preliminary evidence that the dimensions are not perfectly correlated to one another. The table further indicates that the values of χ
2 difference, each with one degree of freedom, range from 2.962 to 38.332 given that the critical value of chi-square is 10.827 at
p = 0.001. Accordingly, 26 of the 28 chi-square differences are statistically significant, that is, each of the unconstrained models provides a significant better fit than its corresponding constrained model. Consequently, the chi-square tests support discriminant validity among the dimensions.
Table 5.
Chi-Square Difference Test for Assessment of Discriminant Validity.
Table 5.
Chi-Square Difference Test for Assessment of Discriminant Validity.
| Dimensions Compared | χ2 unconstrained | χ2 constrained | χ2 difference | Estimates of φ | Confidence Interval |
|---|
| STM | SCL | 49.935(19) a | 75.444(20) a | 25.509(1) a | 0.384(0.083) b | [0.218, 0.550] |
| | RES | 26.015(19) | 47.541(20) | 21.526(1) | 0.690(0.079) | [0.532, 0.848] |
| | CNT | 25.128(19) | 56.013(20) | 30.885(1) | 0.294(0.080) | [0.134, 0.454] |
| | KTM | 28.336(26) | 50.405(27) | 22.069(1) | 0.448(0.088) | [0.272, 0.624] |
| | IDM | 21.231(19) | 58.468(20) | 37.237(1) | 0.316(0.068) | [0.180, 0.452] |
| | PDV | 49.958(26) | 85.362(27) | 35.404(1) | 0.392(0.066) | [0.260, 0.524] |
| | COM | 46.343(26) | 80.321(27) | 33.978(1) | 0.469(0.065) | [0.339, 0.599] |
| SCL | RES | 26.785(19) | 38.995(20) | 12.210(1) | 0.450(0.117) | [0.216, 0.684] |
| | CNT | 20.528(19) | 26.208(20) | 5.680(1) | 0.508(0.145) | [0.218, 0.798] |
| | KTM | 49.017(26) | 51.979(27) | 2.962(1) | 0.599(0.153) | [0.293, 0.905] |
| | IDM | 17.215(19) | 31.652(20) | 14.437(1) | 0.385(0.113) | [0.159, 0.611] |
| | PDV | 45.469(26) | 70.888(27) | 25.419(1) | 0.191(0.098) | [-0.005, 0.387] |
| | COM | 40.115(26) | 55.082(27) | 14.967(1) | 0.447(0.106) | [0.235, 0.659] |
| RES | CNT | 21.167(19) | 34.537(20) | 13.370(1) | 0.444(0.113) | [0.218, 0.670] |
| | KTM | 23.650(26) | 33.919(27) | 10.269(1) | 0.493(0.121) | [0.251, 0.735] |
| | IDM | 21.954(19) | 40.741(20) | 18.787(1) | 0.431(0.098) | [0.235, 0.627] |
| | PDV | 35.934(26) | 53.339(27) | 17.405(1) | 0.514(0.096) | [0.322, 0.706] |
| | COM | 29.193(26) | 46.395(27) | 17.202(1) | 0.586(0.092) | [0.402, 0.770] |
| CNT | KTM | 39.998(26) | 52.117(27) | 12.119(1) | 0.311(0.135) | [0.041, 0.581] |
| | IDM | 8.758(19) | 25.965(20) | 17.207(1) | 0.338(0.110) | [0.118, 0.558] |
| | PDV | 36.934(26) | 75.266(27) | 38.332(1) | 0.007(0.095) | [-0.197, 0.183] |
| | COM | 35.976(26) | 58.411(27) | 22.435(1) | 0.294(0.097) | [0.100, 0.488] |
| KTM | IDM | 30.922(26) | 50.997(27) | 20.075(1) | 0.249(0.111) | [0.027, 0.471] |
| | PDV | 35.528(34) | 51.671(35) | 16.143(1) | 0.331(0.107) | [0.117, 0.545] |
| | COM | 50.902(34) | 66.262(35) | 15.36(1) | 0.431(0.106) | [0.219, 0.643] |
| IDM | PDV | 31.938(26) | 52.985(27) | 21.047(1) | 0.419(0.091) | [0.237, 0.601] |
| | COM | 40.429(26) | 65.191(27) | 24.762(1) | 0.382(0.084) | [0.214, 0.550] |
| PDV | COM | 64.600(34) | 83.999(35) | 19.399(1) | 0.548(0.088) | [0.372, 0.724] |
5.4.2. Confidence Interval Test
Apart from the chi-square difference test, a confidence interval test can also be performed to assess discriminant validity [
44]. This interval test involves establishing a confidence interval of two standard errors around the correlation between a pair of latent variables of interest. Evidence for the discriminant validity is provided when the interval does not include 1.0.
Table 5 presents the correlation estimates (φ) for the 28 pairs of dimensions and the standard error for each estimate. The confidence interval for KTM and IDM dimensions, for instance, can be calculated as [0.249 − (2 × 0.111), 0.249 + (2 × 0.111)] = [0.027, 0.471].
Table 5 also demonstrates that the confidence intervals were computed for each pair of variables. None of the intervals includes the value of 1.0, suggesting that that the true correlation between the dimensions is not 1.0. Accordingly, the results of the confidence interval tests also support the discriminant validity.
5.5. Nomological Validity
The nomological validity of the developed scale was analyzed by hypothesizing that the sustained innovation capability of a firm is one of the determinants of competitive performance, as noted in the literature [
46,
47,
48]. The hypothesis was examined by measuring the competitive performance of a firm through the product and process competitive performances. The competitive performance of products (PRDCPER) was evaluated using three items, including the constant or increasing market share for the existing products, gaining a share of the market for new requested products, and extending the variety of customers. Meanwhile, the competitive performance of processes (PRCCPER) was assessed using five items, including the reduction of unit cost of manufacturing, improvement of the existing quality of products, flexibility in production capacity, the increasing flexibility of production process, and the reduction of time to respond to the needs of customers [
49]. All items were measured by adopting five-point interval scales ranging from 1 to 5. The respondents were asked to specify the extent to which they were competitive in the performance item in comparison to their main competitors. The score for each performance (product and process) was calculated by the summation of its item’s scores. Two simple regression models were used to examine the hypothesized positive relation between the SUSTINOVAT construct as the independent variable, and the product and process performance as the dependent variables. The findings of the statistical analysis are summarized in
Table 7. The table illustrates that the two regression models are both statistically significant at
p < 0.001. In both models, the coefficient β of the SUSTINOVAT as the independent variable was positive with values of 0.462 and 0.571 and was statistically significant in the model based on the
t values 4.828 and 6.453. The R
2 values of the two models indicate that the variation in the independent variable accounts for 23.311% and 41.635% of the variation in the competitive performances of products and processes as dependent variables, respectively. The above-mentioned results verify the nomological validity of the developed scale.
Table 7.
Assessment of nomological validity.
Table 7.
Assessment of nomological validity.
| | R | R2 | F | P-value | β | t |
|---|
| PRDCPER a,c | 0.462 | 0.213 | 23.311 | 0.000 | 0.462 | 4.828 |
| PRCCPER b,c | 0.571 | 0.326 | 41.635 | 0.000 | 0.571 | 6.453 |
5.6. Discussion of the Findings
Figure 3 summarizes four major findings of this study. Firstly, the findings suggest the (8D) eight dimensions of SUSTINOVAT construct, which were extracted from the study, that are expected to sustain the overall innovation capacity of SMEs in the auto-industry in Iran. The eight-dimensional construct which comprised of strategic management, supportive culture and structure, resource allocation, communication and networking, knowledge and technology management, project development, idea management, and commercialization capabilities are the key drivers to sustain the innovation capacity among the SMEs. This findings provide a more holistic approach to measurement that recognizes all aspects of innovation capacity and sustainability. This multiplicity nature of innovation capability construct has been well recognized in the innovation literature [
5,
9].
Figure 3.
Summary of findings.
Figure 3.
Summary of findings.
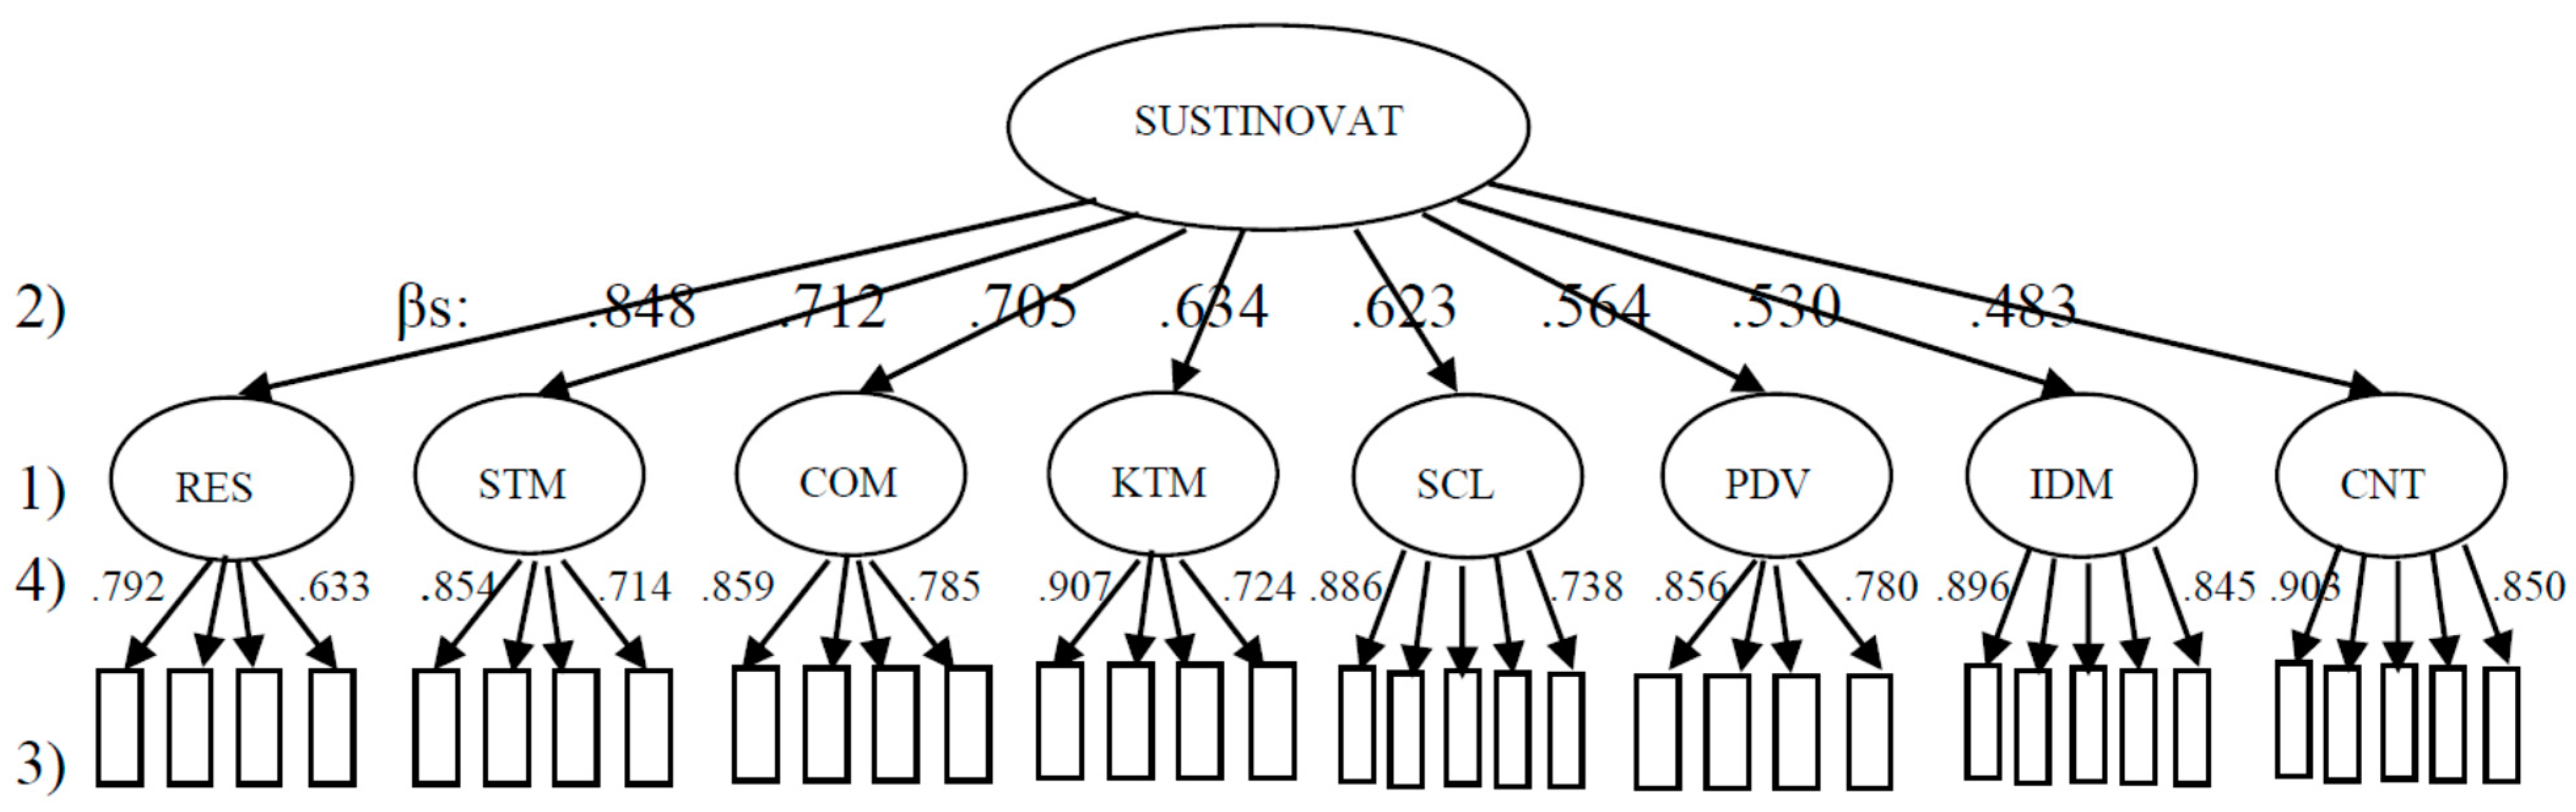
Secondly, the findings highlight the relative contributions of each dimension (j), to sustain the overall innovation capacity (β
j). Although the importance of such factors in the creation of innovation capability is available in the literature, there has been little research in the way of formal studies to examine the relative importance of such capabilities in SME sector. The findings suggest the resource allocation capability is the strongest driver of the overall innovation capacity among auto-maker SMEs in Iran (β = 0.848), while communication and networking capability was found to be the least important but yet significant contribution to sustain the overall innovation capacity. This finding is partially inconsistent with the part of literature in which communication and networking was identified as the most important factor for SMEs to become innovative [
20,
50]. One possible explanation may be due to the fact that communication and networking is in its infancy stages in Iran resulting to incomplete understanding of the actual benefits achieved through communication and networking. However, this results are consistent with Romijn and Albaladejo [
13] findings where their results did not provide much support for the contention that overall intensity of external networking would be conducive to innovativeness. Moreover, other significant dimensions in sort of their contribution to sustain the overall innovation capacity after the resource allocation (β = 0.848), are strategic management (β = 0.712), commercialization (β = 0.705), knowledge and technology management (β = 0.634), supportive culture and structure (β = 0.623), project development (β = 0.564) and idea management capability (β = 0.530). Collectively, these two findings (dimensions and their relative importance) revealed that SMEs should pay special attention to continuous improvement of the important innovation capabilities if they wish to sustain their overall innovation capacity for future innovations.
Thirdly, the findings suggest related activities (IP
ij) which are pertinent to improve each of the eight dimensions. The input or output-based innovation measurement models presented in the literature do offer valuable insights into the innovation capabilities, however, they do not provide detailed direction on the means to improve these abilities. From a practical standpoint, it is critical for SME managers especially in the auto industry to identify activities and efforts that are needed to improve these capabilities. The most important advantage of the activity-based measurement model developed in this research is its ability to identify innovation activities that are required to improve the identified capabilities. In addition to this, the model has suggested relative importance activities to build and improve their pertained innovation capability. In order to identify the activities required for improving innovative capabilities of the SMEs in the automotive industry in Iran, strategic focus has to be based on the eight bundles of distinct but interrelated activities.
Table 8 shows the eight bundles of activities and their relative importance. Each bundle is expected to improve one of the innovation capabilities.
Finally, the fourth type of findings is relative contributions of each activity (i) to improve its related capability (α
ij). For instance, as presented in
Table 8, the EFA result reveals that most of the SME managers in the Iranian auto industry regard four basic activities as significant for improving resource allocation; qualified human resource with high levels of education, self-esteem, diverse backgrounds and motivation to innovate (0.792); financial support and adequate funding to innovation (0.766); facilitating the use of formal systems and tools in support of innovation (0.744); and allocating facilities and physical resources to innovation (0.633). According to these results, development of qualified human resources is the most important mean to improve resource allocation capability (0.792) while the importance of physical resources is the least but significant activity for this capability in the context of auto industry.
Table 8.
Summary of findings.
Table 8.
Summary of findings.
| Capability | Activities |
|---|
| Resource Allocation (0.848) | Human resource (0.792). | Financial resource (0.766). | Physical resource (0.744). | Slack resource (0.633). | |
| Strategic Management (0.712) | Business vision (0.854). | Innovation strategy (0.830). | Innovation targets and search areas (0.824). | Consistency between innovation strategy and firm’s activities (0.714). | |
| Commercialization (0.705) | Market analysis and monitoring (0.859). | Proficiency of personnel/adequacy of facilities (0.845). | Adherence to a commercialization schedule and formal post-launch reviews (0.828). | Joint venturing and other financing methods (0.803). | Monitoring competitor (0.785). |
| Knowledge and Technology Management (0.634) | Informal R&D and learning activities, internal technological efforts (0.907). | Knowledge and technology acquisition (0.894). | Knowledge and technology assimilation, adaption & transformation (0.871). | Technology trends monitoring and evaluation (0.849). | Integration of internal, external, tacit and explicit knowledge (0.724). |
| Supportive Culture and Structure (0.623) | Supportive culture for innovation, creativity, and risk taking (0.886). | Responsibility of top management for innovation and tolerates changes and failures (0.865). | Encouraging Open communication and efficient cross-linked communication (0.828). | Differentiated, specialized, integrated and flexible structure (0.738). | |
| Project Development (0.564) | Formation of cross-functional project teams (0.856). | Improvement of capabilities of designing, engineering, prototyping, and testing (0.853). | Use of a comprehensive system of innovation project management (835). | Adoption of high-tech tools and equipment (0.804). | Internal and external networking and cooperation (0.780). |
| Idea Management (0.530) | Use of different techniques of creativity and idea generation (0.896). | Acquisition of innovative ideas through networking and external relations (0.886). | Screening of ideas with the overall and innovation strategies of firms (0.859). | Screening of ideas by conducting multi-criteria feasibility study (0.845). | |
| Communication and Networking (0.483) | Intimate communication with customers in all stages of the innovation process (0.903). | Attendance in national and international related exhibitions (0.895). | Membership and networking with industrial and professional associations (0.876). | Communication with competitors and national and international industrial service providers (0.850). | |
In summary, if SME managers of Iranian automaker companies wish to improve their innovation capabilities, they should pay special attention to these bundles of activities.
6. Conclusions
This study aimed to develop a scale of measuring the SUSTINOVAT construct, which is deemed important for the further development of innovation research. However, a psychometrically-valid scale of evaluating the sustainability of overall innovation capability is yet to be developed. The findings of this study suggested that an 8D measuring model, including the strategic management, supportive culture and structure, resource allocation, communication and networking, knowledge and technology management, project development, idea management, and commercialization capabilities, is reliable and valid to evaluate the sustainability of overall innovation capability. The reliability, unidimensionality, discriminant, and convergent validities of the proposed model were tested by performing a series of analyses using the data collected from 175 subcontractor SMEs in the automobile industry of Iran. The reliability measures, unidimensionality, convergent, and discriminant validity tests strongly supported the proposed scale. Moreover, the nomological validity was verified, suggesting the predictive validity of the model.
The remarkable implications of this study are as follows:
(1) For academicians, the study findings indicate that the sustainability of overall innovation capability of a firm can be measured using its innovation activities and efforts instead of its innovation inputs or outputs. This approach of measuring innovation considers the activities and efforts that have not resulted in the innovation output yet. This type of innovative activities is the dominate means of innovating incremental products and processes in the SMEs of developing countries; (2) For practitioners, the developed scale can facilitate in measuring and managing the innovation process as an important competitive weapon. The model presents a practical procedure of gauging the innovation capability of an organization. A key managerial aspect of this scale is its focus on the activities that a firm requires for it to become innovative. Other than firm managers, the external policy and decision makers can also use the developed scale as a comparative measure. For example, large-scale companies, as the customer of industrial SMEs (e.g., approximately 2000 subcontractors in Iran’s automobile industry), can use this scale to discriminate and categorize the subcontractors for substantial decisions such as subcontractor selection for new product development or assigning market share to a certain subcontractor. Policy makers and developmental organizations may also employ the scale to determine their priorities for financial or training support.
This study has certain limitations that must be acknowledged, introducing opportunities for future research. First, the scale of measuring the overall innovation capability was developed and tested only within the industrial SMEs of automobile industry. Thus, more studies must be conducted in other industries such as electronic industry. Second, the single informant bias might be an issue in this research because only one of the general managers, R&D managers, engineering manages, or a well-informed expert completed the questionnaire. Future research must attempt to address such concerns by asking two or more of the above-mentioned informants to complete the questionnaire. Finally, this study was conducted in the economic and industrial environment of Iran, which may be different from other developed or developing countries. Replicating this research in other countries can help check and validate the applicability of the findings of this study in other parts of the world.
The scale developed in this study advances further research opportunities in the field. One research opportunity is to examine the factors that drive or hinder the innovation capability of industrial SMEs. Kumar and Subrahmanya [
51] investigated the influences of large-scale companies and the contribution of Trans National Contributions (TNCs) customers on the innovation capability of the industrial SMEs in India. The other determinants of innovation capability of the industrial SMEs must still be identified and investigated in other countries. The second research opportunity is to explore the performance of industrial SMEs resulting from their innovation capability. The suggested areas for further study can potentially expand the understanding on the field of innovation among industrial SMEs.


