Development of a Geographical Information System (GIS) for the Integration of Solar Energy in the Energy Planning of a Wide Area


Abstract
:1. Introduction
2. Methodology
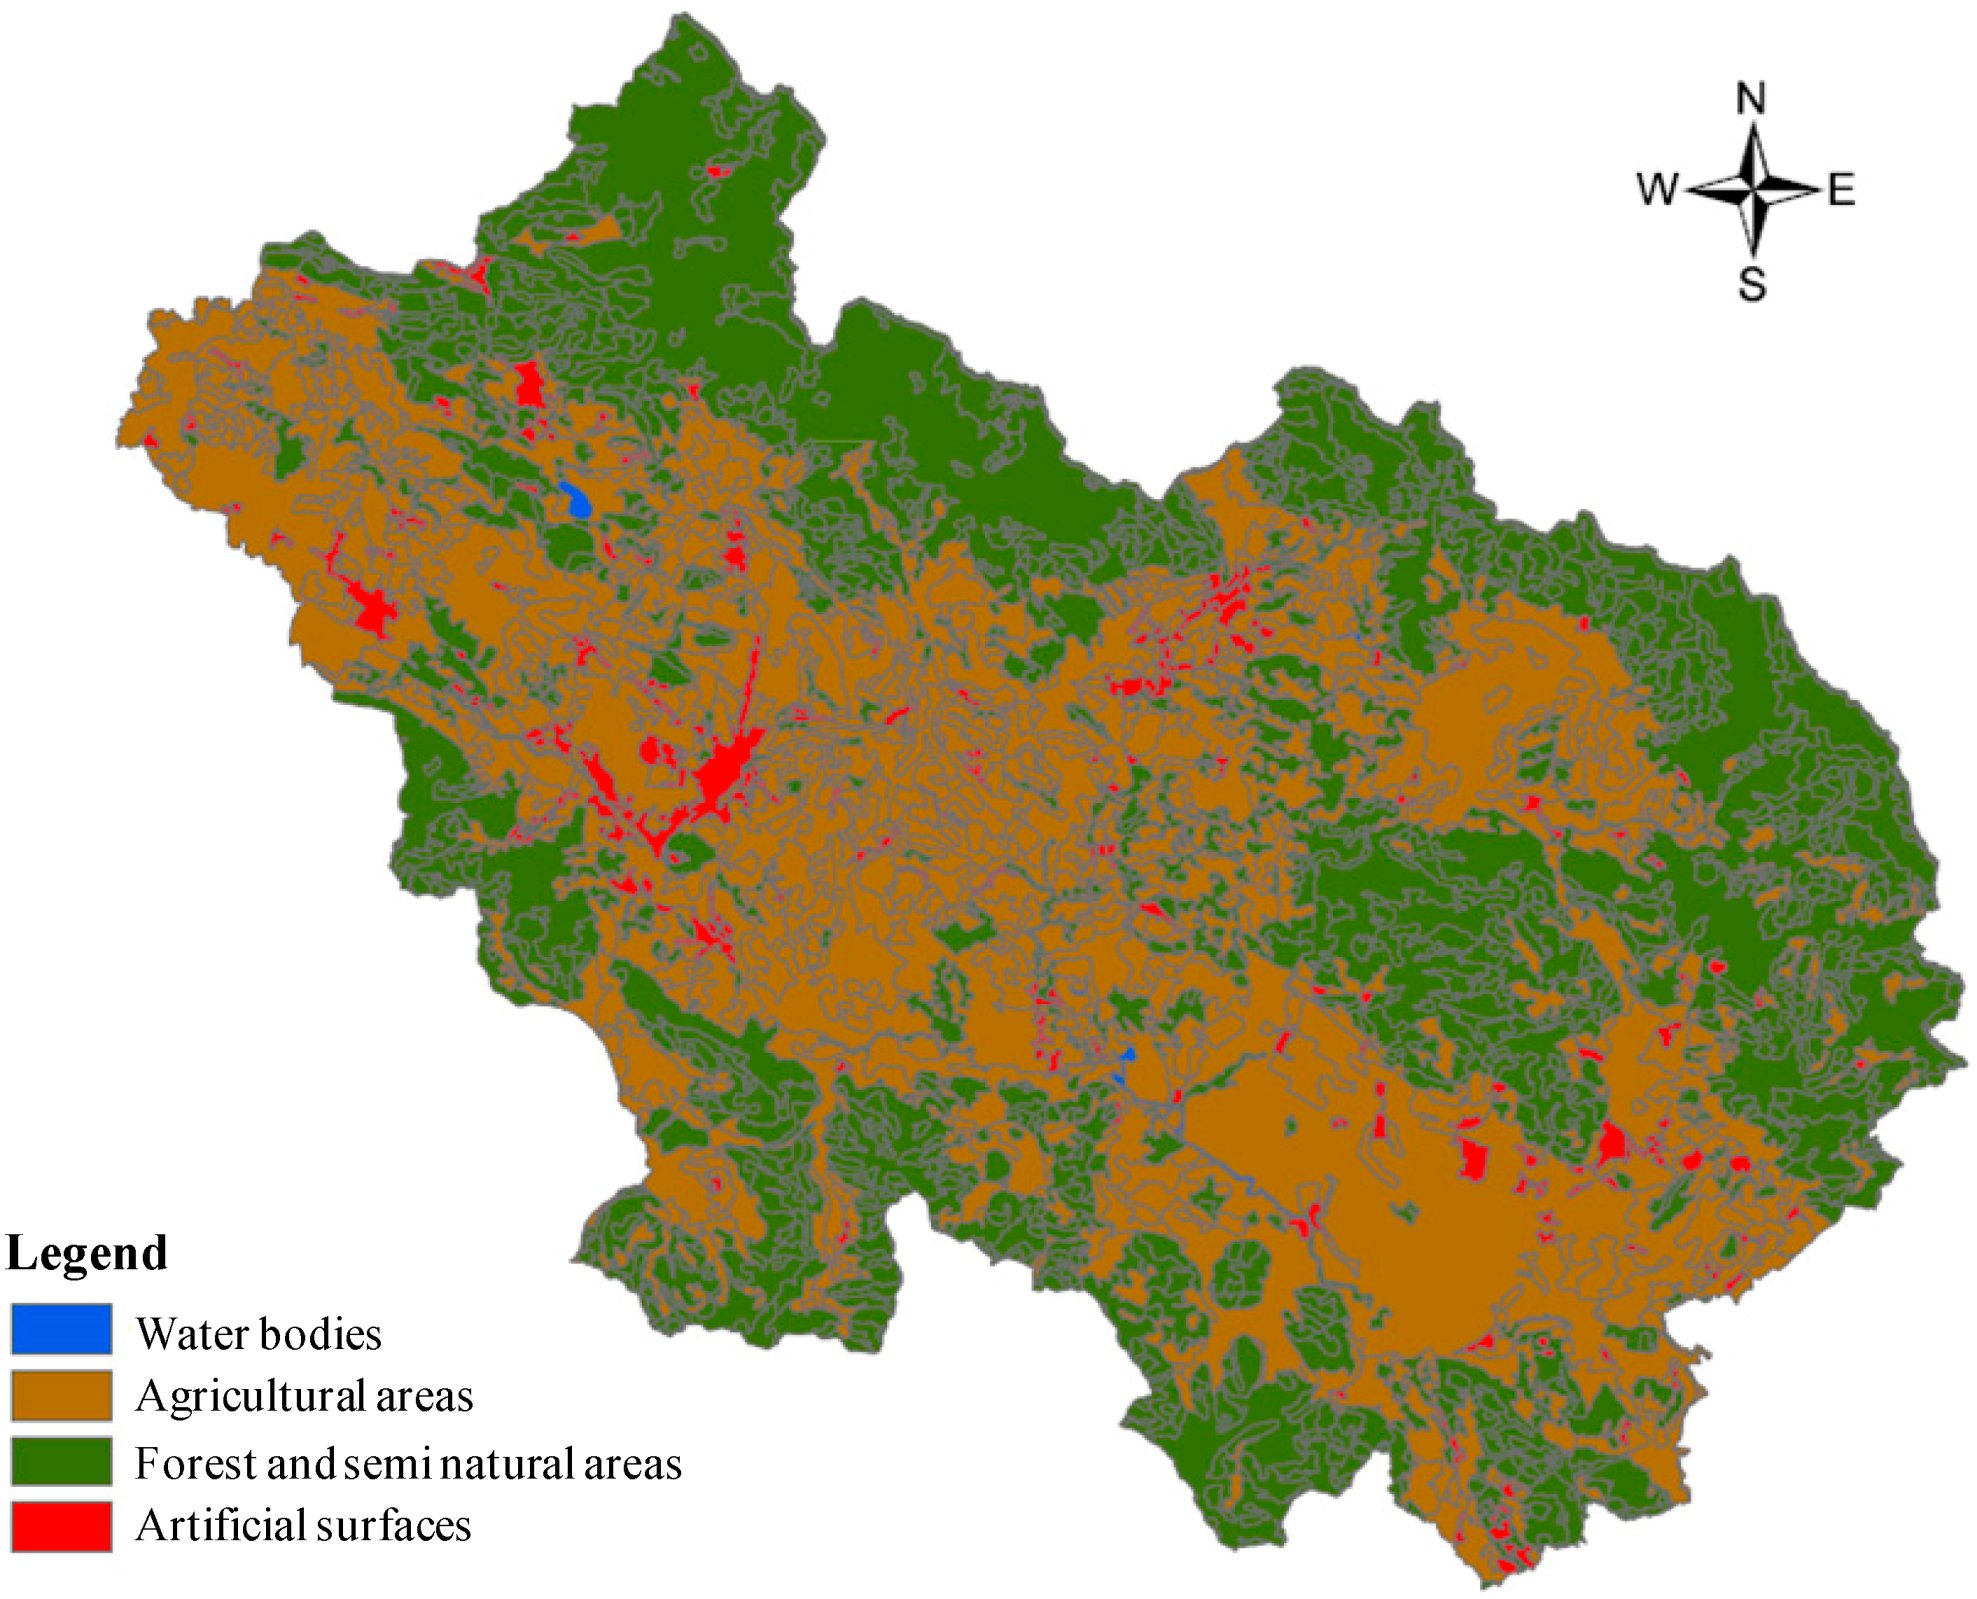
2.1. Land Use

| Arable land | Non-irrigated arable land |
| Permanently irrigated land | |
| Permanent crops | Vineyards |
| Fruit trees and berry plantations | |
| Olive groves | |
| Other permanent crops | |
| Pastures | Pastures |
| Heterogeneous agricultural areas | Annual crops associated with permanent crops |
| Complex cultivation patterns | |
| Land principally occupied by agriculture, with significant areas of natural vegetation | |
| Agro-forestry areas |

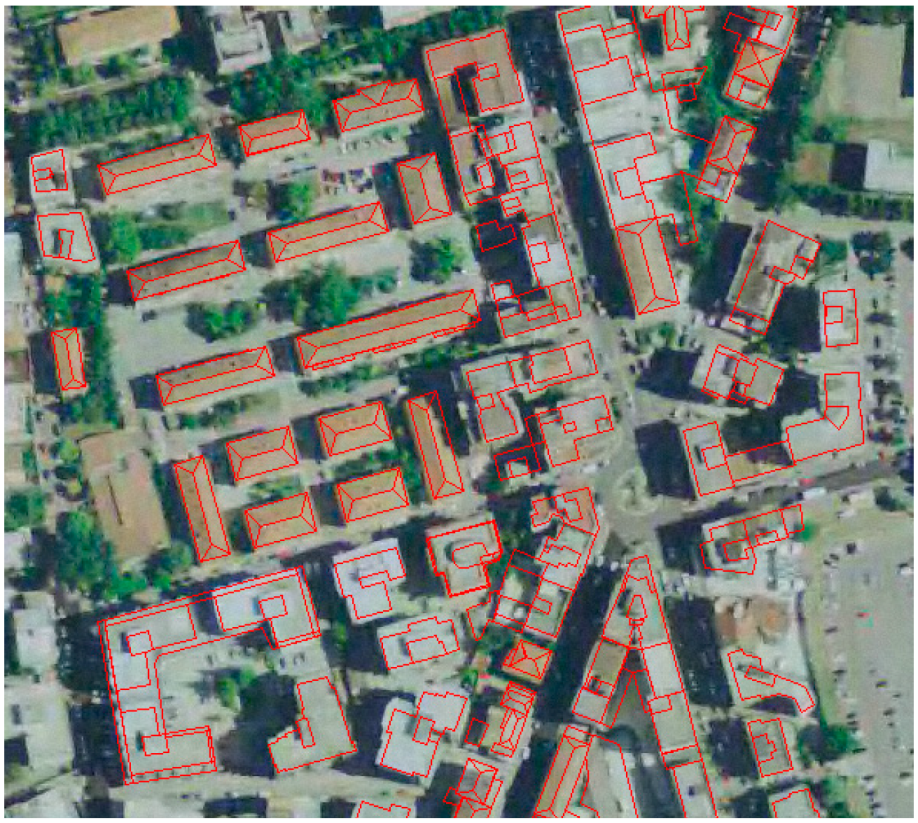
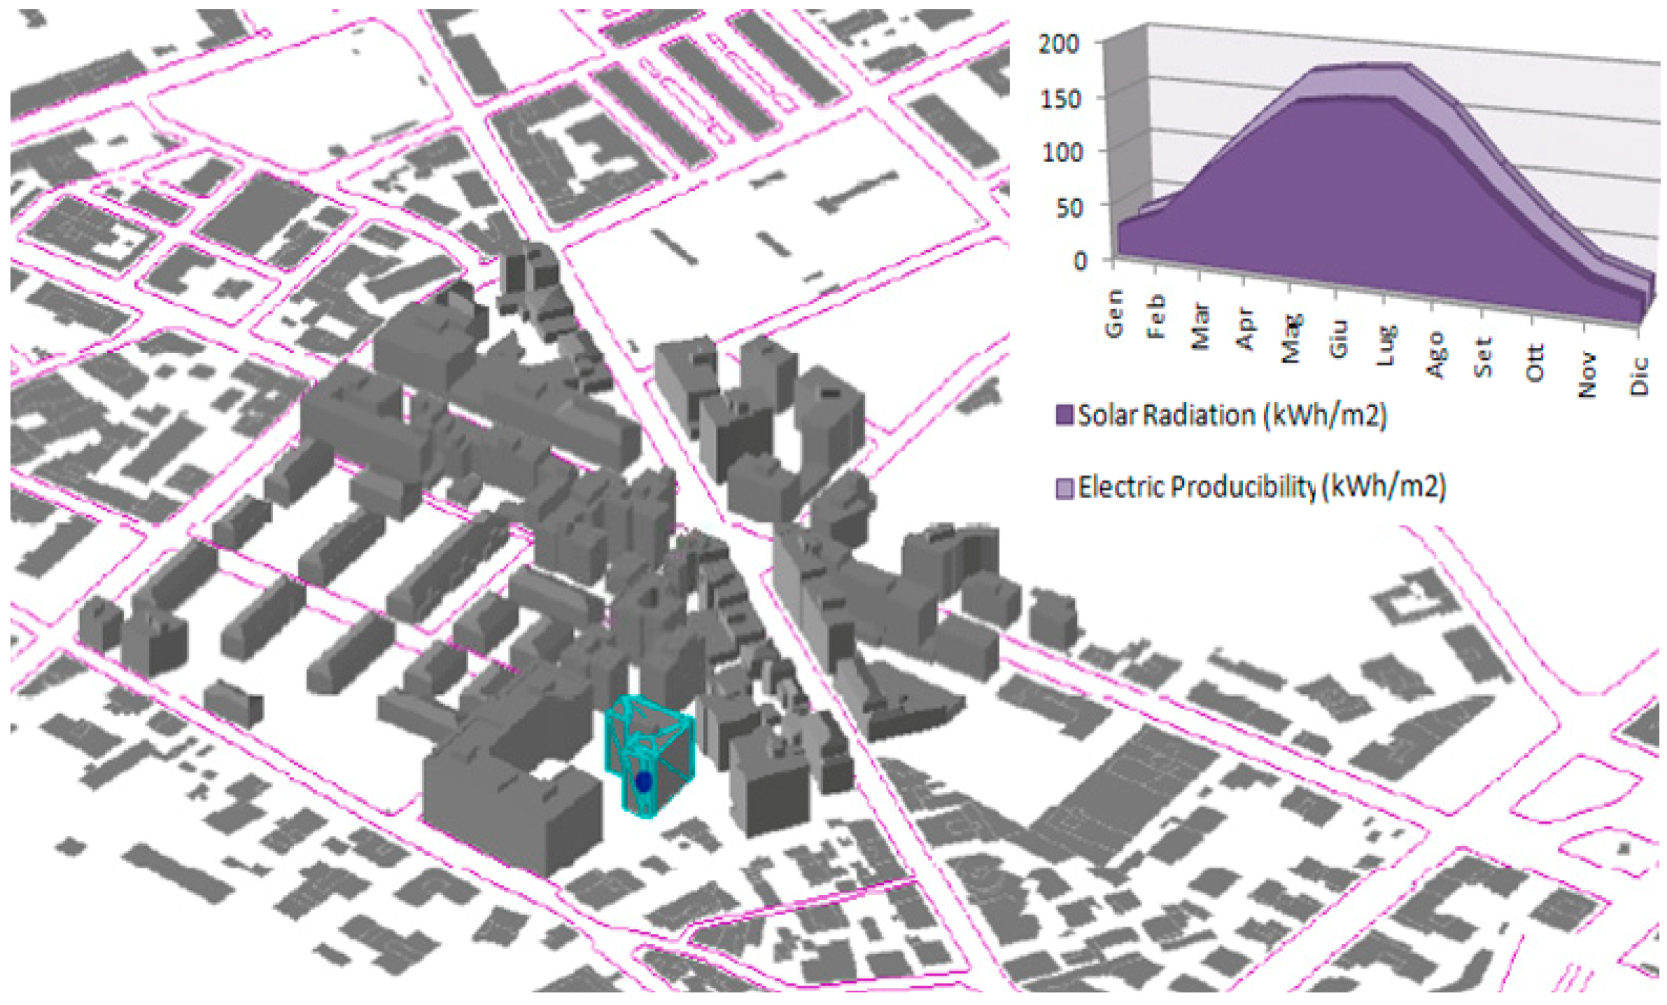
2.2. The Urban Context
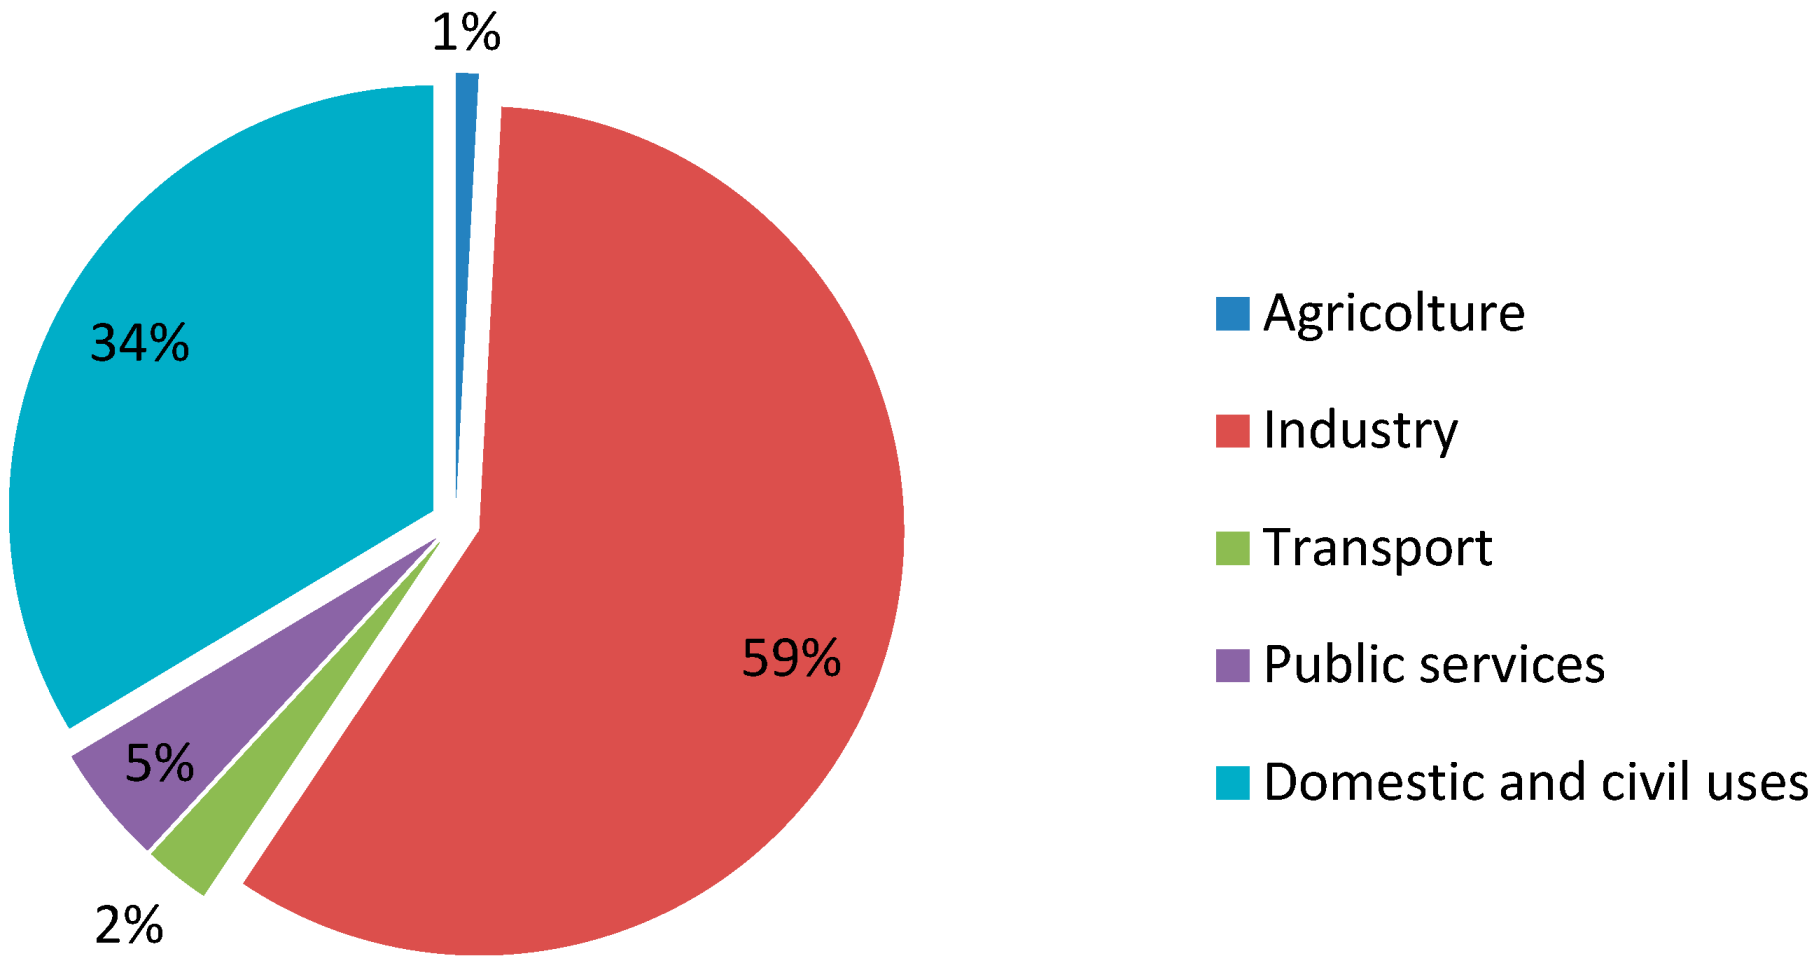
2.3. Analysis of Local Consumption
| Number of Activities | Description of Activities |
|---|---|
| 13–14 | Mineral processing |
| 15 | Food and beverage manufacturing |
| 16 | Tobacco industry |
| 17 | Textile industry |
| 18 | Articles of clothing; fur productions |
| 19 | Tanning and dressing of leather, manufacturing of travel goods, bags, saddlery and footwear |
| 20 | Manufacturing of wood and products of wood and cork; manufacturing of articles of straw and plaiting materials |
| 21 | Paper manufacturing |
| 22 | Publishing, printing and reproduction of recorded media |
| 24 | Chemical products and synthetic and artificial fibers manufacturing |
| 25 | Rubber and plastic manufacturing |
| 26 | Other non-metallic mineral process manufacturing |
| 27 | Metal production |
| 28 | Metal product manufacturing, except machinery and equipment |
| 29 | Machinery and equipment manufacturing, including installation, assembly, repair and maintenance |
| 30 | Computers manufacture |
| 31 | Machinery and apparatus electrical manufacturing |
| 32 | Radios, televisions and communication equipment manufacturing |
| 33 | Medical equipment and optical instruments, watches and clocks manufacturing |
| 34 | Motor vehicles, trailers and semi-trailers manufacturing |
| 35 | Other transport equipment manufacturing |
| 36 | Furniture manufacturing, other manufacturing industries |
| Number of Activities | Alatri | Anagni | Cassino | Ceccano | Ferentino | Frosinone | Isola del Liri | Piedim. San Germano | Pontecorvo | Sora | Veroli |
|---|---|---|---|---|---|---|---|---|---|---|---|
| 13–14 | 311 | 1,300 | 283 | 0 | 254 | 0 | 311 | 0 | 57 | 0 | 28 |
| 15 | 1,793 | 4,850 | 1,724 | 919 | 5,218 | 3,149 | 1,310 | 322 | 965 | 3,011 | 2,184 |
| 16 | 0 | 0 | 0 | 0 | 0 | 0 | 0 | 0 | 0 | 0 | 0 |
| 17 | 1,261 | 110 | 110 | 55 | 2,522 | 28,294 | 4,113 | 0 | 329 | 1,042 | 1,700 |
| 18 | 103 | 132 | 383 | 88 | 162 | 3,045 | 427 | 235 | 206 | 1,986 | 397 |
| 19 | 0 | 141 | 0 | 0 | 56 | 103 | 0 | 0 | 0 | 0 | 0 |
| 20 | 332 | 317 | 202 | 548 | 1,225 | 2,350 | 274 | 58 | 317 | 389 | 259 |
| 21 | 0 | 1,827 | 17,945 | 0 | 1,719 | 645 | 10,745 | 0 | 860 | 44,056 | 322 |
| 22 | 376 | 228 | 524 | 148 | 27 | 1,021 | 363 | 0 | 27 | 403 | 27 |
| 24 | 0 | 23,640 | 3,637 | 0 | 28,239 | 8,878 | 0 | 0 | 107 | 535 | 1,391 |
| 25 | 332 | 32,457 | 1,992 | 415 | 15,564 | 8,343 | 125 | 0 | 83 | 1,702 | 3,486 |
| 26 | 3,006 | 9,896 | 5,324 | 2,317 | 6,764 | 4,259 | 1,315 | 251 | 2,004 | 2,505 | 1,002 |
| 27 | 424 | 1,555 | 2,121 | 2,828 | 9,755 | 4,948 | 566 | 0 | 2,121 | 1,555 | 0 |
| 28 | 2,811 | 8,046 | 11,968 | 4,988 | 5,760 | 10,702 | 371 | 633 | 216 | 0 | 1,344 |
| 29 | 738 | 3,460 | 8,267 | 1,094 | 3,714 | 2,849 | 1,933 | 941 | 1,374 | 2,086 | 483 |
| 30 | 7 | 13 | 20 | 12 | 6 | 41 | 3 | 0 | 1 | 10 | 18 |
| 31 | 53 | 525 | 2,022 | 345 | 0 | 199 | 19 | 461 | 4 | 90 | 19 |
| 32 | 81 | 242 | 254 | 19 | 198 | 1,511 | 105 | 12 | 0 | 180 | 384 |
| 33 | 5 | 5,824 | 0 | 0 | 0 | 15 | 413 | 0 | 0 | 93 | 0 |
| 34 | 3,943 | 1,979 | 8,732 | 48 | 1,373 | 4,550 | 48 | 67,732 | 0 | 0 | 0 |
| 35 | 0 | 4,192 | 0 | 0 | 0 | 6,067 | 0 | 0 | 0 | 0 | 0 |
| 36 | 110 | 81 | 190 | 256 | 542 | 1,047 | 88 | 7 | 395 | 710 | 183 |
| Municipalities | Domestic [MWh] | Tertiary [MWh] | Industrial [MWh] |
|---|---|---|---|
| Alatri | 24,651 | 29,705 | 182,408 |
| Anagni | 21,074 | 26,799 | 1,172,468 |
| Cassino | 33,347 | 40,615 | 764,055 |
| Ceccano | 19,294 | 23,533 | 163,751 |
| Ferentino | 20,163 | 23,428 | 966,457 |
| Frosinone | 56,632 | 56,260 | 1,070,136 |
| Isola del Liri | 10,598 | 12,394 | 261,997 |
| Piedimonte San Germano | 5,412 | 5,741 | 821,695 |
| Pontecorvo | 11,186 | 15,998 | 105,435 |
| Sora | 25,703 | 27,848 | 701,913 |
| Veroli | 19,638 | 22,618 | 153,834 |
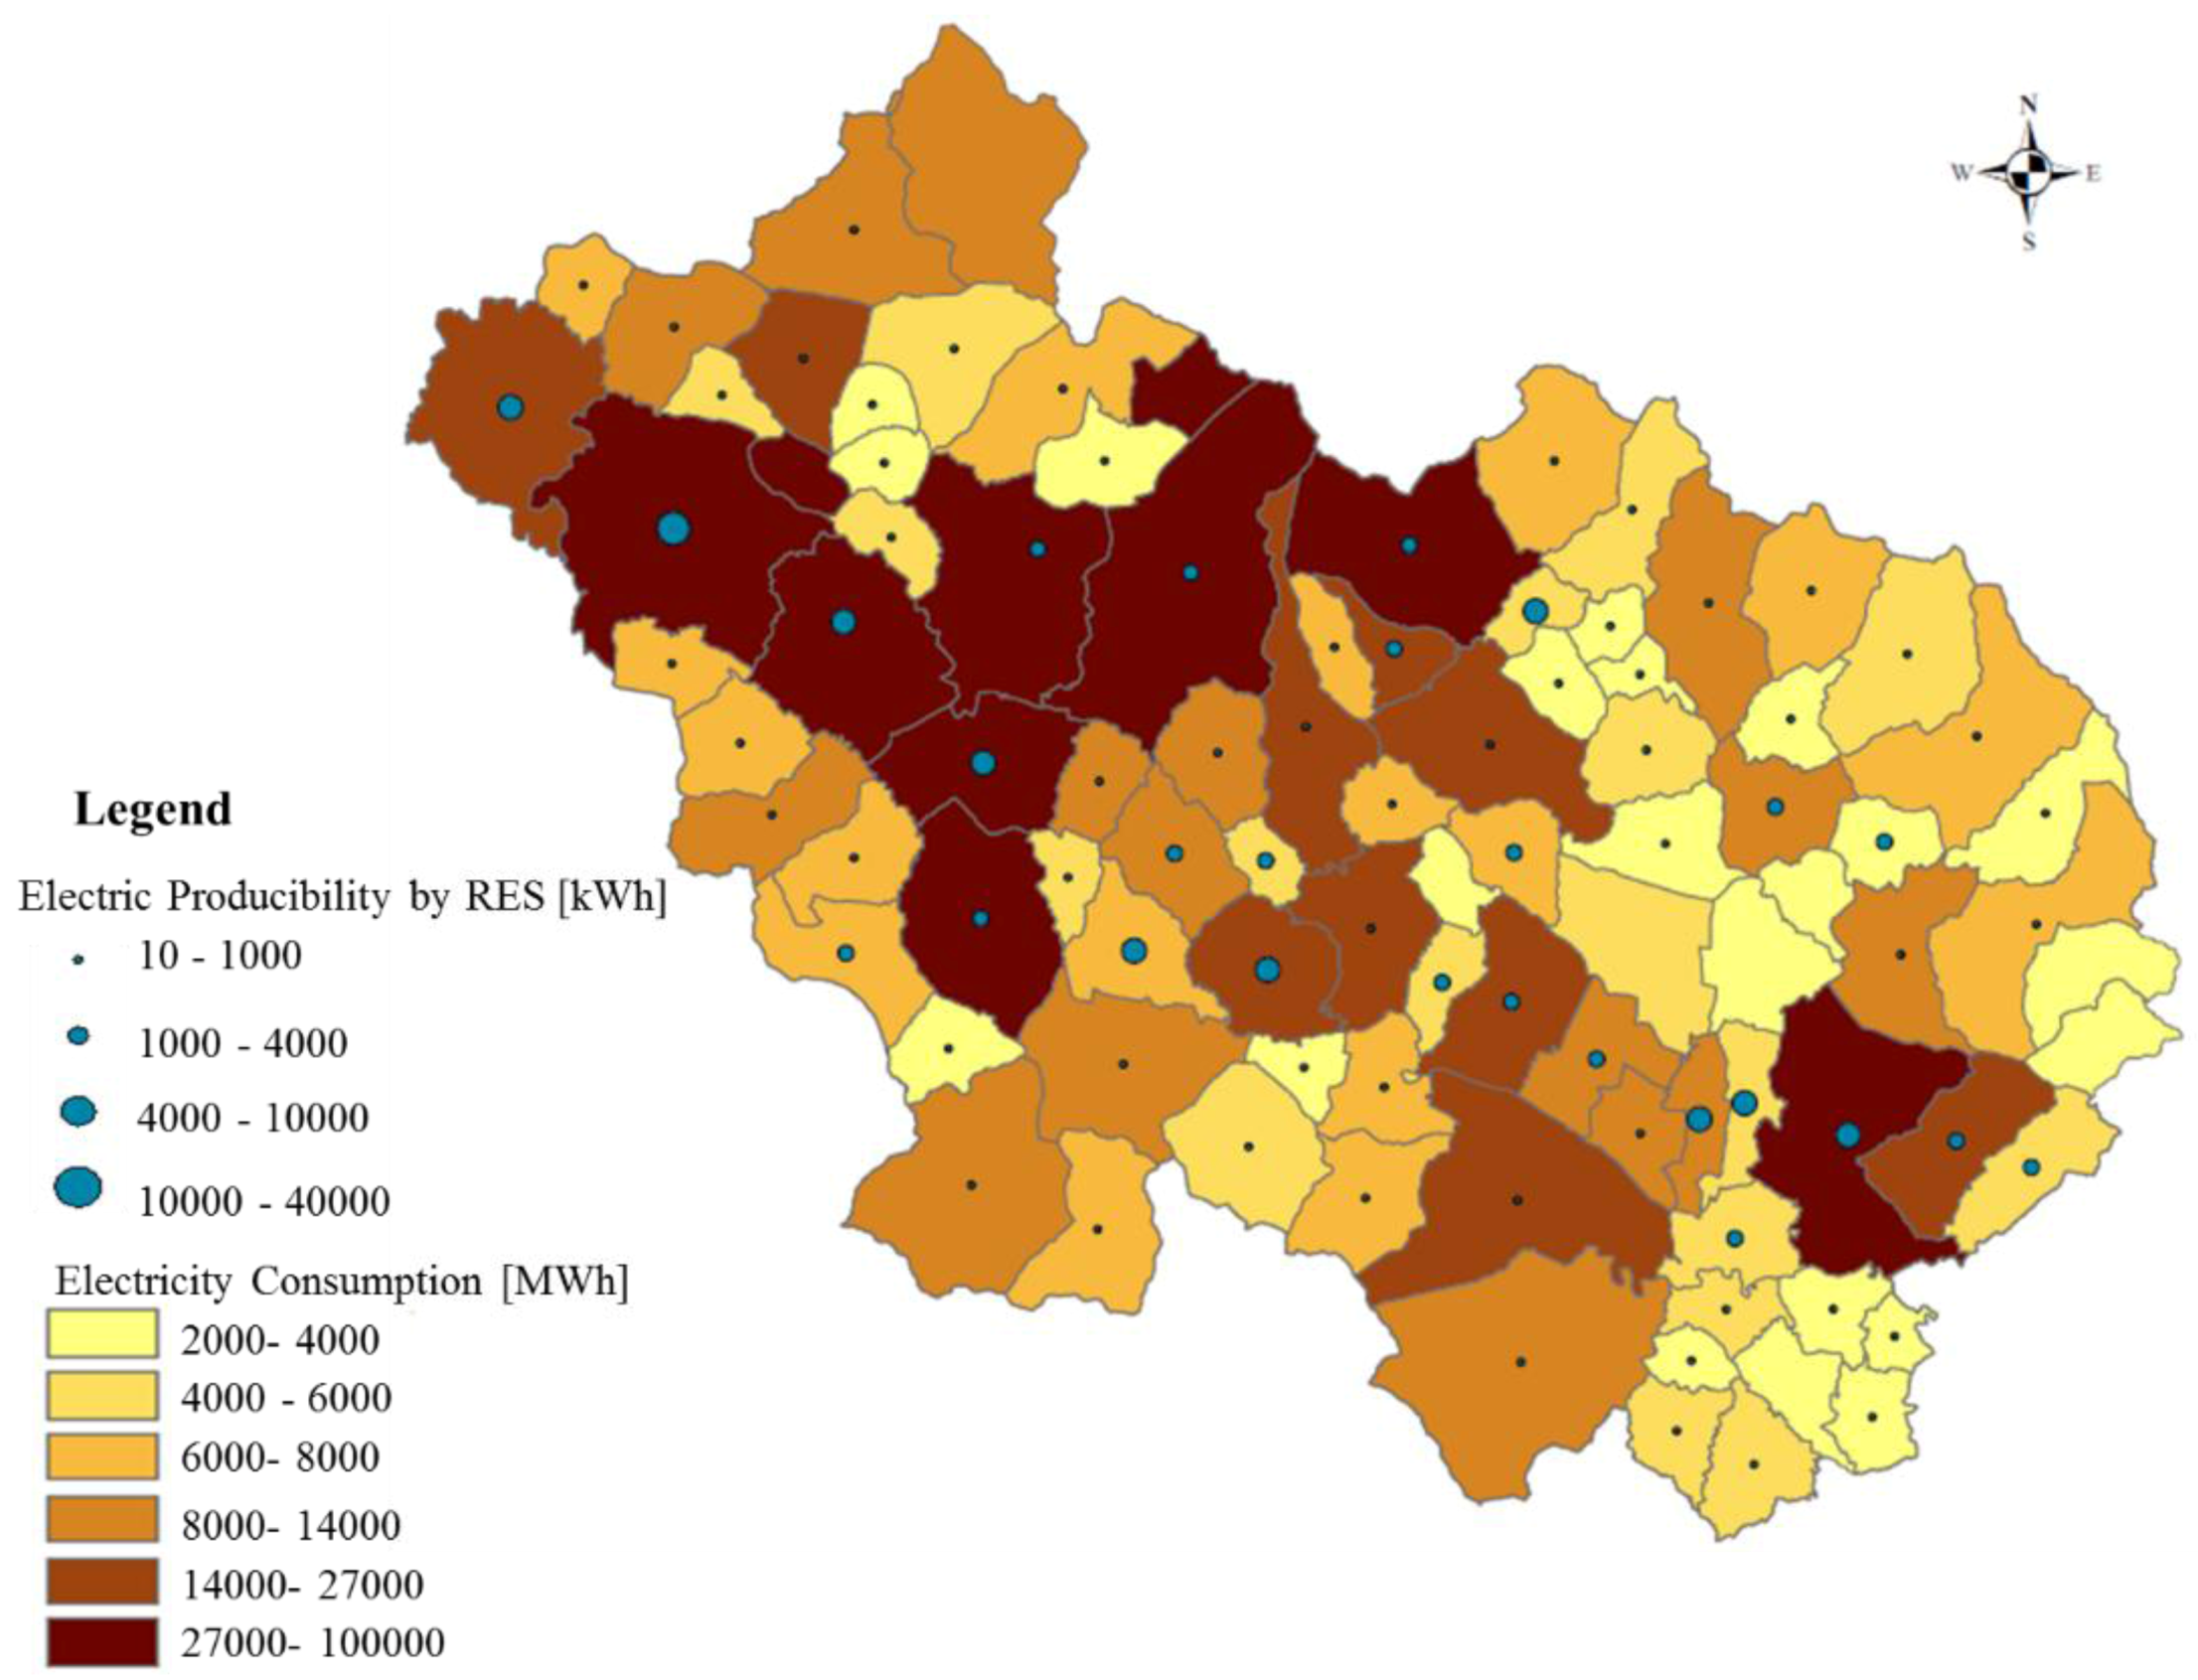
2.4. The Distribution of RES Production at the Local Level
3. Conclusions
- (a)
- forest constraints: the model take into account the classification of land use to evaluate the energy productive potential from RES;
- (b)
- technological constraints: in the model, different data about buildings (such as typology, slope, aspect, and useful surface of the roofs) and theoretical characteristics of solar panels have been integrated;
- (c)
- economic constraints: the electric energy consumption for different uses (industry, domestic, and tertiary) in the most relevant municipalities, in the investigated district, were evaluated.
Acknowledgments
Author Contributions
Conflicts of Interest
References
- Urban Population, Development and the Environment 2011; Department of Economic and Social Affairs, Population Division, United Nations; United Nations: New York, NJ, USA, 2011.
- Council of the European Commission. Directive 2008/50/EC of the European Parliament and of the Council of 21 May 2008 on ambient air quality and cleaner air for Europe. Off. J. Eur. Union L 2008, 152, 1–44. [Google Scholar]
- Council of the European Commission. Directive 2000/60/EC of the European Parliament and of the Council establishing a framework for Community action in the field of water policy. Off. J. Eur. Union L 2000, 327, 1–73. [Google Scholar]
- Council of the European Commission. Council directive 92/43/EEC of 21 May 1992 on the conservation of natural habitats and of wild fauna and flora. Off. J. Eur. Union L 1992, 206, 7–49. [Google Scholar]
- Council of the European Commission. Directive 2010/31/EU of the European Parliament and of the council of 19 May 2010 on the energy performance of buildings. Off. J. Eur. Union L 2010, 153, 13–35. [Google Scholar]
- Council of the European Commission. Directive 2009/28/EC of the European Parliament and of the council of 23 April 2009 on the promotion of the use of energy from renewable sources and amending and subsequently repealing Directives 2001/77/EC and 2003/30/EC. Off. J. Eur. Union L 2009, 140, 16–62. [Google Scholar]
- Europe 2020: A Strategy for Smart, Sustainable and Inclusive Growth; Council of the European Commission: Brussels, Belgium, 2010.
- Asdrubali, F.; Presciutti, A.; Scrucca, F. Development of a greenhouse gas accounting GIS-based tool to support local policy making—Application to an Italian municipality. Energy Policy 2013, 61, 587–594. [Google Scholar] [CrossRef]
- Kanters, J.; Horvat, M. Solar energy as a design parameter in urban planning. Energy Procedia 2012, 30, 1143–1152. [Google Scholar] [CrossRef]
- Cellura, M.; Guarino, F.; Longo, S.; Mistretta, M. Energy life-cycle approach in Net zero energy buildings balance: Operation and embodied energy of an Italian case study. Energy Build. 2014, 72, 371–381. [Google Scholar] [CrossRef]
- Kaygusuz, A.; Keles, C.; Alagoz, B.B.; Karabiber, A. Renewable energy integration for smart sites. Energy Build. 2013, 64, 456–462. [Google Scholar] [CrossRef]
- Missaoui, R.; Joumaa, H.; Ploix, S.; Bacha, S. Managing energy Smart Homes according to energy prices: Analysis of a Building Energy Management System. Energy Build. 2014, 71, 155–167. [Google Scholar] [CrossRef]
- Minghetti, A.; Africani, P.; Lorenzioni, L.; Paselli, E. Bologna Solar City, a web application for the analysis of potential energy: From estimating solar radiation to the realization of the application. In Proceedings of 17th “Building Services, Mechanical and Building Industry Days”, Urban Energy Conference, Debrecen, Hungary, 13–14 October 2011.
- Gal, T.; Unger, J. Solar access and energy gain of the buildings in a densely built urban area. In Proceedings of 17th “Building Services, Mechanical and Building Industry Days”, Urban Energy Conference, Debrecen, Hungary, 13–14 October 2011.
- Rylatt, M.; Gadsden, S.; Lomas, K. GIS-based decision support for solar energy planning in urban environments. Comput. Environ. Urban Syst. 2001, 25, 579–603. [Google Scholar] [CrossRef]
- Amado, M.; Poggi, F. Towards solar urban planning: A new step for better energy performance. Energy Procedia 2012, 30, 1261–1273. [Google Scholar] [CrossRef]
- La Gennusa, M.; Lascari, G.; Rizzo, G.; Scaccianoce, G.; Sorrentino, G. A model for predicting the potential diffusion of solar energy systems in complex urban environments. Energy Policy 2011, 39, 5335–5343. [Google Scholar]
- Sun, Y.W.; Hof, A.; Wang, R.; Liu, J.; Lin, Y.J.; Yang, D.W. GIS-based approach for potential analysis of solar PV generation at the regional scale: A case study of Fujian Province. Energy Policy 2013, 58, 248–259. [Google Scholar] [CrossRef]
- Cellura, M.; Di Gangi, A.; Longo, S.; Orioli, A. Photovoltaic electricity scenario analysis in urban contests: An Italian case study. Renew. Sustain. Energy Rev. 2012, 16, 2041–2052. [Google Scholar] [CrossRef]
- Quinonez-Varela, G.; Cruden, A.; Punton, B.; Blair, L.; Thomson, J. A GIS/PSS planning tool for the initial grid connection assessment of renewable generation. Renew. Energy 2007, 32, 727–737. [Google Scholar]
- Chen, F.; Duic, N.; Alves, L.M.; Carvalho, M.D.G. Renew islands—Renewable energy solutions for islands. Renew. Sustain. Energy Rev. 2007, 11, 1888–1902. [Google Scholar] [CrossRef]
- ESRI Home Page. Available online: http://www.esri.com (accessed on 20 August 2014).
- Niblick, B.; Monnell, J.D.; Zhao, X.; Landis, A.E. Using geographic information systems to assess potential biofuel crop production on urban marginal lands. Appl. Energy 2013, 103, 234–242. [Google Scholar] [CrossRef]
- Hofierka, J.; Kanuk, J. Assessment of photovoltaic potential in urban areas using open-source solar radiation tools. Renew. Energy 2009, 34, 2206–2214. [Google Scholar] [CrossRef]
- Hetrick, W.A.; Rich, P.M.; Barnes, F.J.; Weiss, S.B. GIS-based solar radiation flux models. In ACSM ASPRS: Annual Convention; American Society for Photogrammetry and Remote Sensing Technical Papers, Volume 3; ASPRS: New Orleans, LA, USA, 1993; pp. 132–143. [Google Scholar]
- Batlles, F.J.; Bosch, J.L.; Tovar-Pescador, J.; Martnez-Durban, M.; Ortega, R.; Miralles, I. Determination of atmospheric parameters to estimate global radiation in areas of complex topography: Generation of global irradiation map. Energy Convers. Manag. 2008, 49, 336–345. [Google Scholar] [CrossRef]
- Prianto, E.; Houpert, S.; Depecker, P.; Peneau, J.P. Contribution of numerical simulation with solene to find out the traditional architecture type of Cayenne, Guyane, France. Int. J. Archit. Sci. 2000, 1, 156–180. [Google Scholar]
- Šúri, M.; Hofierka, J. The solar radiation model for Open source GIS: Implementation and Applications. In Proceedings of the Open Source GIS-GRASS Users Conference, Trento, Italy, 11–13 September 2002.
- Forni, A.; Olivetti, I.; Torrez, L.N.; Borioni, S.; Di Giampietro, F. System of geographical information for spatial analysis of areas with perspective of sustainable development (SIGASD). In Proceedings of XXVIII Conferenza Italiana Di Scienze Regionali, Bolzano, Italy, 26–28 September 2007. (In Italian)
- Büttner, G.; Kosztra, B. CLC2006 Technical Guidelines; European Environment Agency Technical Report, No 17; EEA: Copenhagen, Denmark, 2007. [Google Scholar]
- Italian Legislative Decree No 28 of 3 March 2011: Implementation of Directive 2009/28/EC on the Promotion of the Use of Energy from Renewable Sources and Amending and Subsequently Repealing Directives 2001/77/EC and 2003/30/EC; Italian Council of Ministers, Official Gazette No. 78; Istituto Poligrafico e Zecca dello Stato: Rome, Italy, 2011. (In Italian)
- Italian Legislative Decree No. 27 of 24 March 2012: Conversion with Amendments of Decree-Law No. 1 of 24 January 2012, Concerning Urgent Measures on Competition, Infrastructure Development and Competitiveness Known as “The Liberalization Decree” or “The Salva-Italia Decree”; Italian Council of Ministers, Official Gazette No. 71; Istituto Poligrafico e Zecca dello Stato: Rome, Italy, 2012. (In Italian)
- DECRETO 5 luglio 2012-Attuazione dell’art. 25 del decreto legislativo 3 marzo 2011, n. 28, recante incentivazione della produzione di energia elettrica da impianti solari fotovoltaici (c.d. Quinto Conto Energia); Ministero dello Sviluppo Economico, Official Gazette No. 159; Istituto Poligrafico e Zecca dello Stato: Rome, Italy, 2012. (In Italian)
- Bignami, D. E i pannelli colonizzano i campi. Terra e Vita 2010, 43, 16. (In Italian) [Google Scholar]
- Massimo, A.; Torrez-Linares, N.; Frattolillo, A.; Forni, A. Un esempio di pianificazione energetica su scala urbana, problematiche realizzative, punti di forza e di debolezza. In Proceedings of XXXIII Conferenza Scientifica Annuale AISRe (Associazione Italiana di Scienze Regionali), Roma, Italy, 13–15 September 2012. (In Italian)
- Riolo, F.; Vittorio, M. Manuale avanzato di arcgis 9 e 10: Creare e gestire modelli gis con il model builder; Dario Flaccovio Editore: Palermo, Italy, 2010. (In Italian) [Google Scholar]
- Electricity Consumption by Product Sector-Provinces. Available online: http://www.terna.it/default/Home/SISTEMA_ELETTRICO/statistiche/consumi_settore_merceologico/consumi_settore_merceologico_provincie.aspx (accessed on 20 August 2014). (In Italian)
- Istituto Nazionale di Statistica (ISTAT) Home Page. Available online: http://www.istat.it (accessed on 20 August 2014). (In Italian)
- Terna Home Page. Available online: http://www.terna.it (accessed on 20 August 2014). (In Italian)
- Gestore Servizi Energetici (GSE) Home Page. Available online: http://www.gse.it (accessed on 20 August 2014). (In Italian)
- Gestore Servizi Energetici (GSE): ATLASOLE. Available online: http://atlasole.gse.it/atlasole/ (accessed on 22 August 2014). (In Italian)
- Gestore Servizi Energetici (GSE): Rapporto Statistico 2012-Solare Fotovoltaico. Available online: http://www.gse.it/it/Dati%20e%20Bilanci/GSE_Documenti/osservatorio%20statistico/Il%20Solare%20fotovoltaico%202012%20-%20web%20def.pdf (accessed on 20 August 2014). (In Italian)
© 2014 by the authors; licensee MDPI, Basel, Switzerland. This article is an open access article distributed under the terms and conditions of the Creative Commons Attribution license (http://creativecommons.org/licenses/by/3.0/).
Share and Cite
Massimo, A.; Dell'Isola, M.; Frattolillo, A.; Ficco, G. Development of a Geographical Information System (GIS) for the Integration of Solar Energy in the Energy Planning of a Wide Area. Sustainability 2014, 6, 5730-5744. https://doi.org/10.3390/su6095730
Massimo A, Dell'Isola M, Frattolillo A, Ficco G. Development of a Geographical Information System (GIS) for the Integration of Solar Energy in the Energy Planning of a Wide Area. Sustainability. 2014; 6(9):5730-5744. https://doi.org/10.3390/su6095730
Chicago/Turabian StyleMassimo, Angelamaria, Marco Dell'Isola, Andrea Frattolillo, and Giorgio Ficco. 2014. "Development of a Geographical Information System (GIS) for the Integration of Solar Energy in the Energy Planning of a Wide Area" Sustainability 6, no. 9: 5730-5744. https://doi.org/10.3390/su6095730
APA StyleMassimo, A., Dell'Isola, M., Frattolillo, A., & Ficco, G. (2014). Development of a Geographical Information System (GIS) for the Integration of Solar Energy in the Energy Planning of a Wide Area. Sustainability, 6(9), 5730-5744. https://doi.org/10.3390/su6095730