Article

Development of a Sustainable Process for the Solid-Liquid Extraction of Antioxidants from Oat

School of Chemical Science, Autonomous University of Chihuahua, Circuit 1, New University Campus, CP 31125 Chihuahua, Mexico
*
Author to whom correspondence should be addressed.
Sustainability 2014, 6(3), 1504-1520; https://doi.org/10.3390/su6031504
Submission received: 25 November 2013 / Revised: 12 March 2014 / Accepted: 13 March 2014 / Published: 20 March 2014

Abstract

:
This research paper studies the development of a sustainable process for the extraction of antioxidants from oat. Experimentation covered two factorials to evaluate significance among temperature, time, particle size and solvent. Total polyphenolic content (TPC) and oxygen radical absorbance capacity (ORAC) were the response variables. ANOVA was applied to find significance among variables and predict optimum conditions though a regression model. Extractions at different solid/solvent ratios were developed to study solvents’ solubility. Process simulation in Aspen Process Developer was carried out to evaluate energy cost, raw material cost, campaign time, and process mass intensity. Solvent and particle size showed significance as main effects, whereas temperature and time presented significance as interactions. From an industrial and sustainable perspective, ethanol (EtOH) in a 1/20 (w/v) ratio was the best choice since it presented the lowest cost for energy and raw material. It also showed the lowest process mass intensity (PMI), short campaign time, highest g extract/g oat, and a considerable antioxidant capacity.

1. Introduction

Whole grain cereals such as oat are an important source of polyphenols. Polyphenols are of interest because of its high antioxidant capacity and potential health benefits [1,2]. They act as antioxidants over the free radicals inhibiting the formation of oxygen radicals, preventing chronic degenerative diseases such as cancer and coronary disease [3,4]. In the particular case of oat, it contains polyphenols with antioxidants activity such tocotrienols, phenolic acids, avonoids, sterols, phytic acid and avenanthramides. The last is regarded as being unique to oat, presenting good antioxidant activities in vitro and in vivo [5]. As a result, oat extracts have been evaluated for its anti-inflammatory effect [6] and its effect in controlling cholesterol levels [7]. Recently, there has been interest in oat as a bioactive high-value source for human health [8] in industries such as food, pharmaceutical, and cosmetic.
There are studies regarding the extraction of polyphenols from oat in a laboratory scale. Oat exactions with ethanol mixtures have been reported [3] as well as extractions with methanol [9], water, and acetone [6]. From these studies it can be concluded that polyphenols’ extraction is affected by solvent, temperature, and solids particle size. Nevertheless, there is no analysis about the extraction of polyphenols from an industrial and sustainable perspective. This is necessary if industrial development is seen in the near future. The development of a sustainable process relies on evaluating different process alternatives in the early stages of development [10]; this allows taking the best decision without compromising investment. For instance, solvent extraction is known for its high solvent consumption, having a direct effect in the sustainability of the process. Moreover, the solvent with the best performance in the laboratory does not necessarily give the most sustainable process at industrial scale. Aspects such as cost, energy consumption, and HSE (Health, Safety, and Environmental) performance play an important role in process development. As a consequence, a more holistic analysis is necessary when scaling a process.
This research relies on evaluating from an early stage of development the extraction of polyphenols from oat. Compared to other studies, single solvents were considered since information is available regarding its potential recovery [11]. Solvent recovery and recycling are important aspects to consider for extraction scaling, as well as for the development of a sustainable process [12]. Nevertheless, it does not mean that mixtures should not be evaluated. For this particular case there is plenty of literature regarding the performance of mixtures, and as it will be seen in the results section single solvents presented better or similar performance compared to extractions with mixtures already reported. The information obtained from this research will give a more holistic view for developing a sustainable process in the future, considering that a sustainable process has to be economically feasible.

2. Experimental Section

The methodology in this research covered two stages. The first stage consisted in developing key laboratory experiments for scaling the process. Among these, there was the optimization of important variables such as temperature, time, particle size and solvent. Solubility experiments also were carried out in order to optimize the amount of solvent used in the extraction. A second stage consisted in developing process simulation in the software Aspen Process Development 7.3. As a result, sustainable metrics such as raw materials cost, energy cost, yield, process mass intensity (PMI), and campaign time were estimated.

2.1. Laboratory Experimentation

2.1.1. Materials and Methods

Forage oat samples were purchased in a local cattle food distribution center. Ethanol (EtOH), ethylene glycol (EG) and isopropyl alcohol (IPA) were purchased from a local distributor. Folin Ciocalteu reagent, gallic acid, sodium carbonate, 6-hydroxy-2,5,7,8-tetramethylchromane-2-carboxylic acid (Trolox standard), 2-2′-azobis (2-amino-propane) dihydrochloride (AAPH) and fluorescein (FL) all were Sigma-Aldrich Co. reagents purchased with a local distributor.

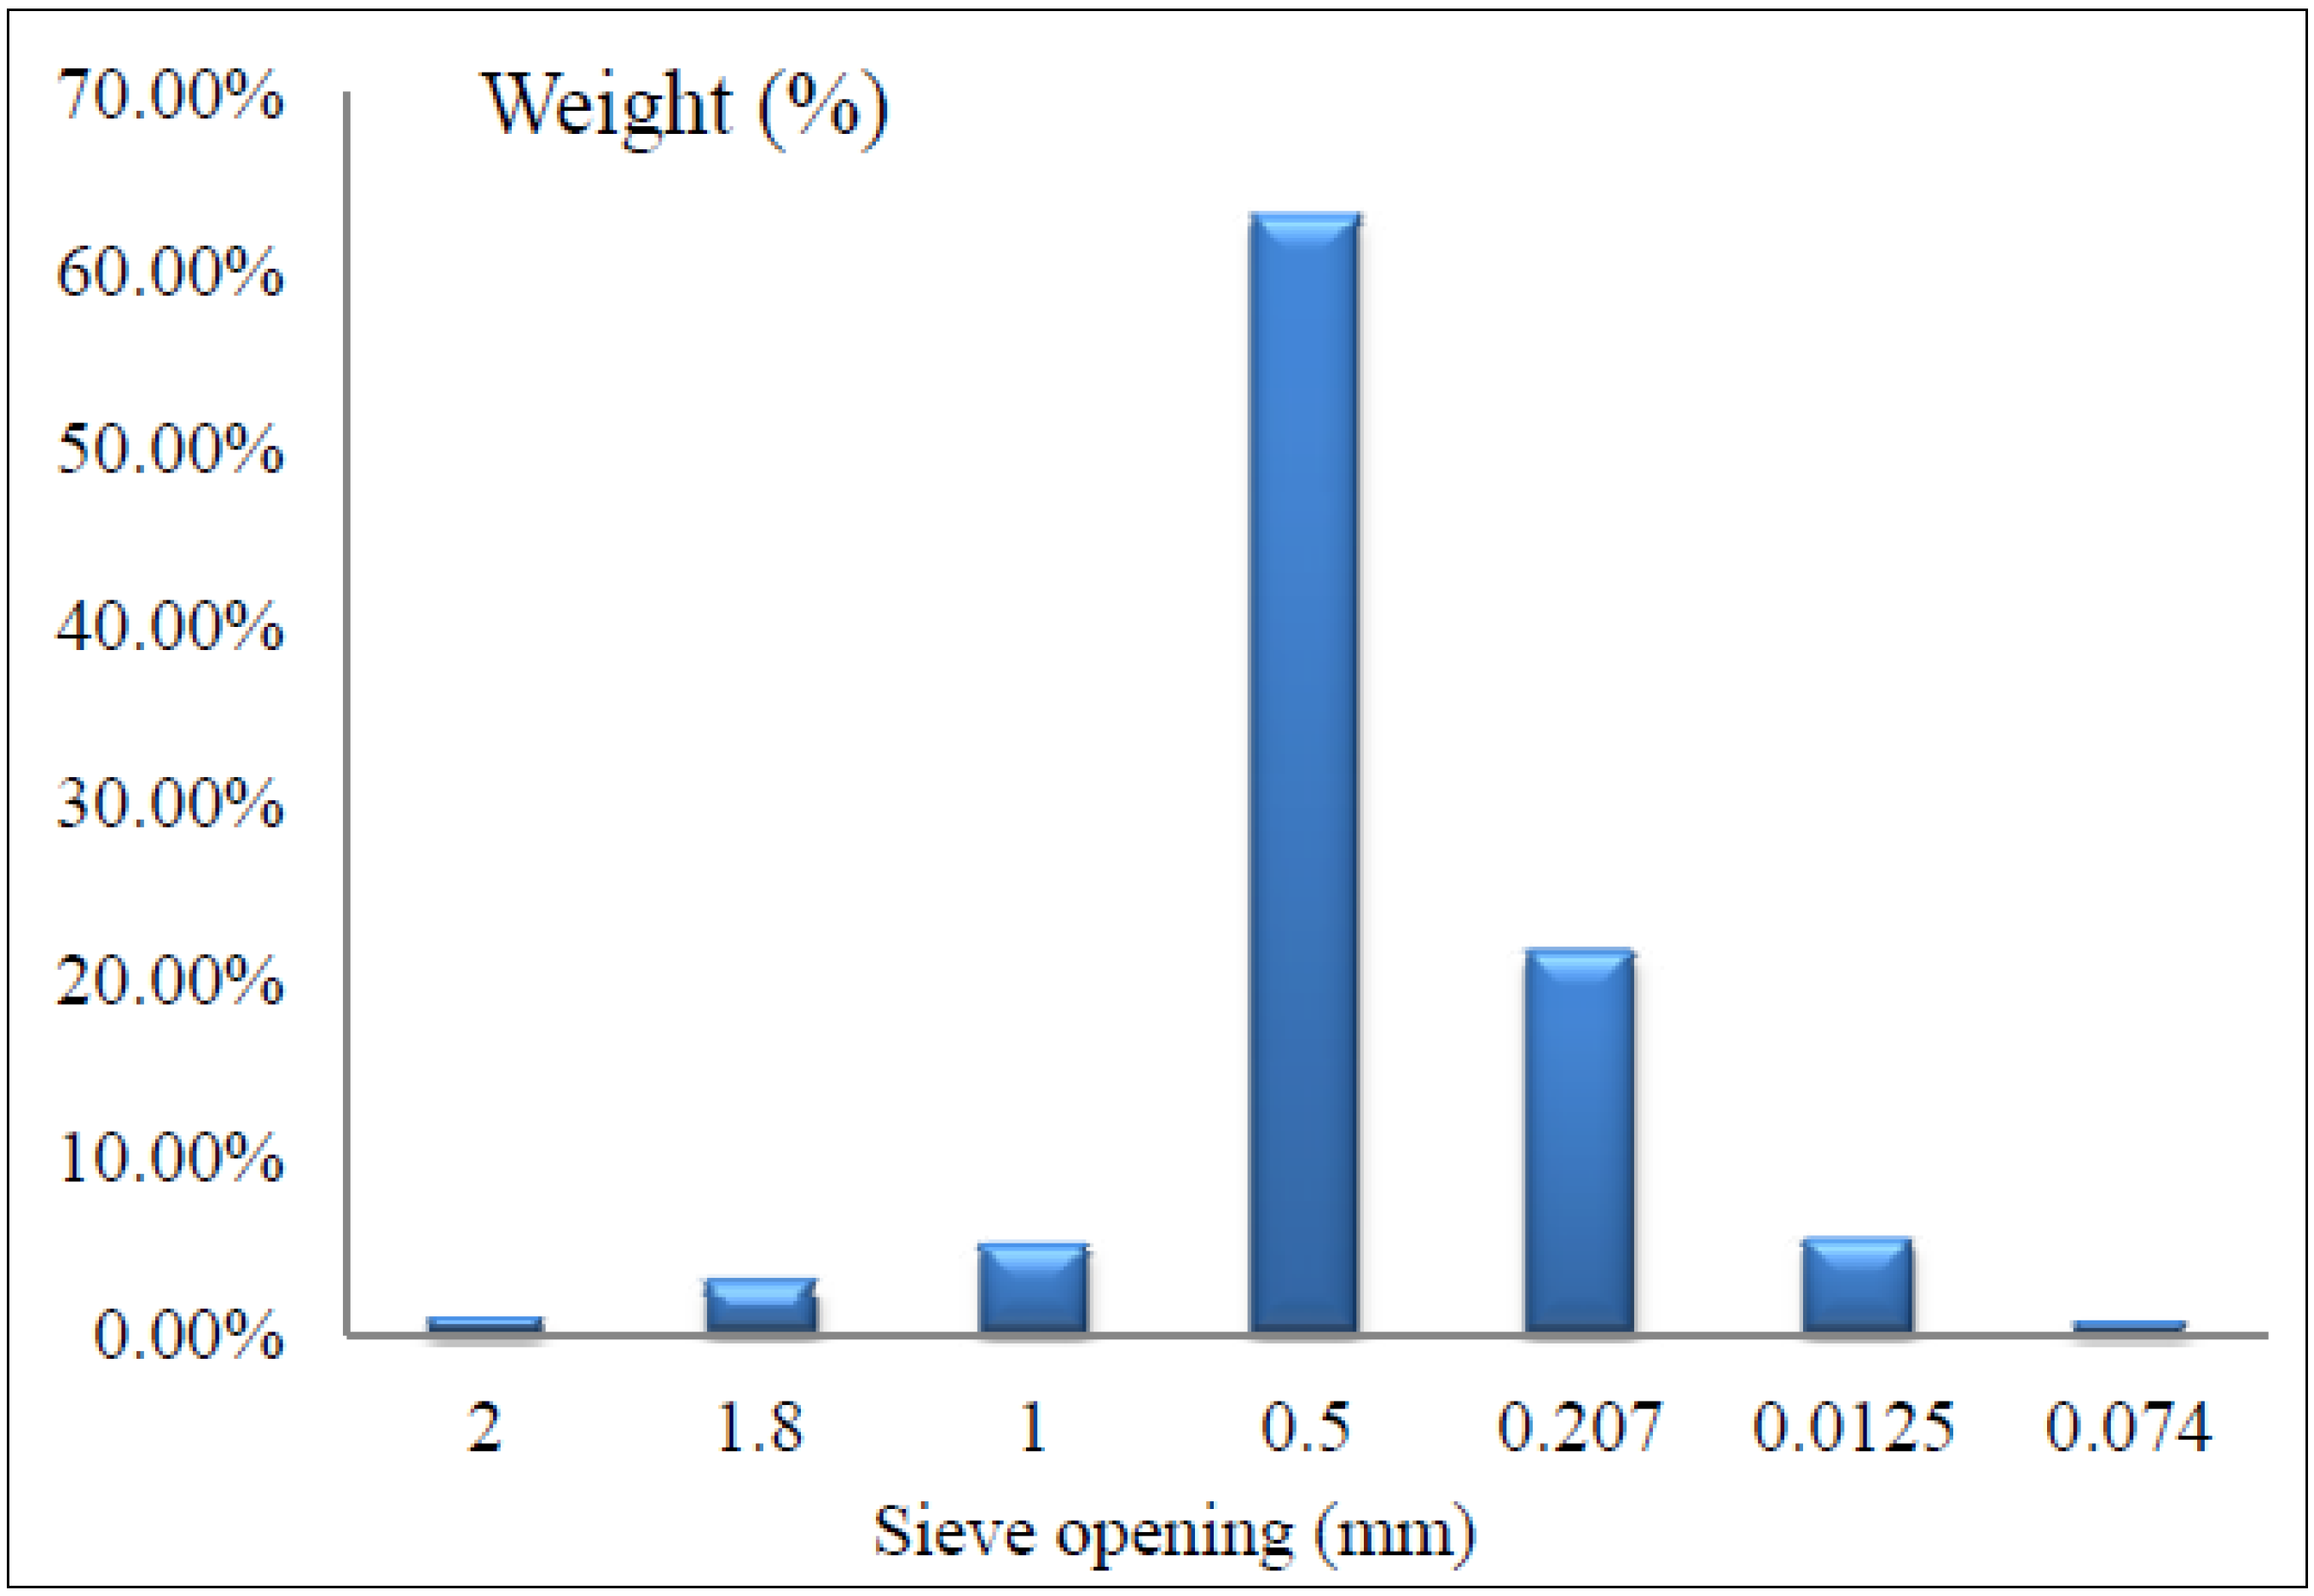
2.1.2. Milling and Sieving

Two kilograms of forage oat were milled with a cross beater mill (Retsch sk 100). Sieving was followed after milling, this with the purpose for getting a particle size distribution. Sieves sizes were in the range of 2.0 mm to 0.074 mm. After sieving, particle size distribution was estimated. Samples were collected on black plastic bags and stored under refrigeration.
Figure 1 displays the results from particle size distribution. From this distribution it was found that 63% of the distribution was in the size of 0.50 mm. This is important since this is the size used in a great deal of reports regarding extraction of antioxidants from oat [3,8,13,14,15,16]. Hence, the experiments proposed in this research covered this range, this to evaluate the effect of particle size in the extraction.
Figure 1. Particle size distribution.
Sustainability 06 01504 g001

2.1.3. Solvent Selection

For this research single solvents were used rather than mixtures, this is because for a future process development single solvents are preferred than mixtures [17]. The reduction in the number of solvent used, the ease to be recovered and handle are important aspects that should be seriously evaluated. Another important aspect is that the solvent selected might be well known by the industry; otherwise industrial implementation might not be feasible.
A solvent selection method [18] was employed for the selection of four solvents. The solvents selected replaced a mixture already reported and used in the laboratory. The method consisted in finding solvents with similar polarity to the mixture. To achieve this, a mixture (80% EtOH) reported from the literature [3,13] was selected. As a result, ethylene glycol (EG) was the most similar solvent to the mixture polarity behavior, following ethanol (EtOH). Isopropyl alcohol (IPA) also was selected for its similarities to the mixture and low cost. Likewise, water was also selected because of its similarities, low cost, and low HSE impact. In terms of toxicity water can be considered as non-toxic, whereas EtOH and IPA can be classified as slightly toxic [19]. Only EG is considered as moderately toxic; nevertheless, this solvent is considered as a good choice [20] from a holistic perspective. Another important aspect is that toxicity will depend on traces left in final product. Cases have been reported [21] where solvents presenting higher toxicities are used in industrial scale since they present more benefits from a holistic perspective. Important aspects to consider when evaluating these solvents are the ease to be separated, to be contained, and to be recycled.

2.1.4. Solvent Extraction

A shaker incubator was employed (311DS, Labnet International: Edison, NJ, USA) for the extraction of polyphenols. Currently, there is plenty of research describing extraction conditions [2,3,8,13,15]. Similar conditions were selected in the different experiments. For instance, it is well known that temperatures higher than 60 °C can lead to polyphenols’ degradation. In the case of time, values up to 60 min have been considered enough for a solid/solvent ratio of 1:4. Higher polyphenol content has been obtained when increasing solvent ratio; however, this may lead to an excessive solvent consumption, affecting the feasibility of the process. Temperature and agitation were controlled according to a design of experiment (DOE). Five grams of milled forage oat were mixed with 20 mL of solvent (1:4) and agitation was set to 150 rpm. After extraction samples were vacuum filtered using a Wattman filter # 42. Extracts were stored in 15 ml falcon flasks under refrigeration (−5 °C) in absence of light until total polyphenol content and antioxidant capacity were measured.

2.1.5. Total Polyphenol Content (TPC)

Folin Ciocateu’s technique was implemented according to literature [22] with some modifications for the quantification of TPC. Gallic acid standards were prepared at 100, 200, 300 and 400 ppm. 10 grams of sodium carbonate (Na2CO3) were dilute in 50 ml of distillate water. 40 µL of a 1:40 crude extract dilution and 40 µL of gallic acid standards were placed in test tubes with 3 mL of distillate water. 200 µL of 2N Folin Ciocalteu’s reagent were added to each tube (standards, samples, and blank) and mixed. After 10 min 600 µL of Na2CO3 solution was added and mixed. Test tubes were placed in a water bath incubator at 40 °C. After 15 min absorbance was measured at 75 using a Helyos spectrophotometer. Calibration curve was plotted with standards’ absorbances. TPC was expressed as mg of Gallic Acid Equivalents (GAE)/g of dry oat. Calibration data is displayed in Table 1.
Table 1. Regression for the calibration of Gallic Acid Equivalents (GAE) standards.
Factorial 1Factorial 2
SlopeInterceptR2SlopeInterceptR2
0.0008−0.05050.99430.0009−0.03620.9909

2.1.6. Oxygen Radical Absorption Capacity (ORAC)

Antioxidant activity was quantified by ORAC assay according to the literature [23] with some modifications. A 75 µM and pH 7.45 phosphate buffer was prepared. All reactive preparation and extract dilutions were in a phosphate buffer matrix. Trolox (6-hydroxy-2, 5, 7, 8-tetramethylchroman-2-carboxylic acid) standard solutions were prepared at 4, 8, 16, 32 and 64 µM. 0.31 M AAPH solution was prepared with 0.86 g in 10 mL buffer. 40 µL of Trolox standards, 40 µL of 1:50 crude extracts dilution and 40 µL of buffer blank were added to a 96-well plate. 200 µL of a 1.4 µM fluorescein solution was added to each well and the plate was incubated at 37 °C for 20 min in a multilabel plate reader (Thermo Scientific Varioskan). After incubation the first fluorescence reading was made (time = 0). After that, 35 µL of AAPH solution was added to each well. Excitation wavelength of 485 nm and an emission wavelength of 535 nm were used. A total of 60 readings were taken for each extract (1 h). Samples and standards were run by triplicate. ORAC was expressed as µmolTE/g oat (micromol equivalents of Trolox per gram of oat). This expression was obtained comparing the net area under curve (AUC) of the samples against the Trolox calibration curve (Table 2).
Table 2. Regression for the calibration of Trolox standards.
Factorial 1Factorial 2
SolventSlopeInterceptR2SolventSlopeInterceptR2
IPA0.778914.19390.9796EtOH0.652614.00510.9627
Water0.9996−0.77540.9836EG0.677913.33670.9432

2.1.7. Design of Experiment

Two factorial designs were proposed for evaluating the significance of time, temperature, particle size and solvent (Table 3). 2k factorials are recommended for early stages of experimentation and when many variables are involved in the response [24].
Table 3. Variables and levels of the design of experiment (DOE).
VariableFactorial 1Factorial 2
LowHighLowHigh
Particle size (mm)0.520.0750.5
Temperature (°C)30503050
Time (min)20602060
SolventIPAWaterEtOHEG
Each factorial consisted in a block of two levels with 32 runs including repetitions. Statistical significance of the model was calculated at 5% probability level (α = 0.05). The software Minitab 16 was used for developing the DOE as well as the statistical analysis. In order to avoid sources of bias experiments were run in a randomly sequence. Maximum and minimum levels of factorial design 1 were obtained from experiments already reported [3,13,14,16]. For solvents, the coded values (1, −1) referred to different polarity levels, the higher level must be the polar solvent. ANOVA was used to test significance (p < 0.05) among main effects and interactions. From the results of factorial 1 it was found that the main effects of solvent and particle size, and the interaction of both presented a very strong effect (p << 0.001) for TPC and ORAC. From this result it was found that very polar solvents such as water and smaller particle size benefit the response. Hence, a second 2k factorial was proposed having smaller particle size than factorial 1 and solvents similar to water.

2.1.8. Solubility Behavior

Solubility plots were developed with optimum conditions for each solvent; this in order to evaluate solubility behavior in the extracts. As a result, it was possible to obtain the amount of extract as the solute/solvent relation changes. Different solvent extractions were developed at different solids/solute (w/v) ratios: 1:2.5, 1:5, 1:7.5, 1:10, 1:12.5, 1:15, 1:17.5, 1:20. To obtain dry extracts, porcelain capsules were taken to constant weight. Eight milliliters of extract were added to a capsule and taken to 40 °C with full vacuum until weight got constant. Initial and final weight was registered. Experiments were run by triplicate. The grams of extract per gram of oat were determined as well as TPC and ORAC.

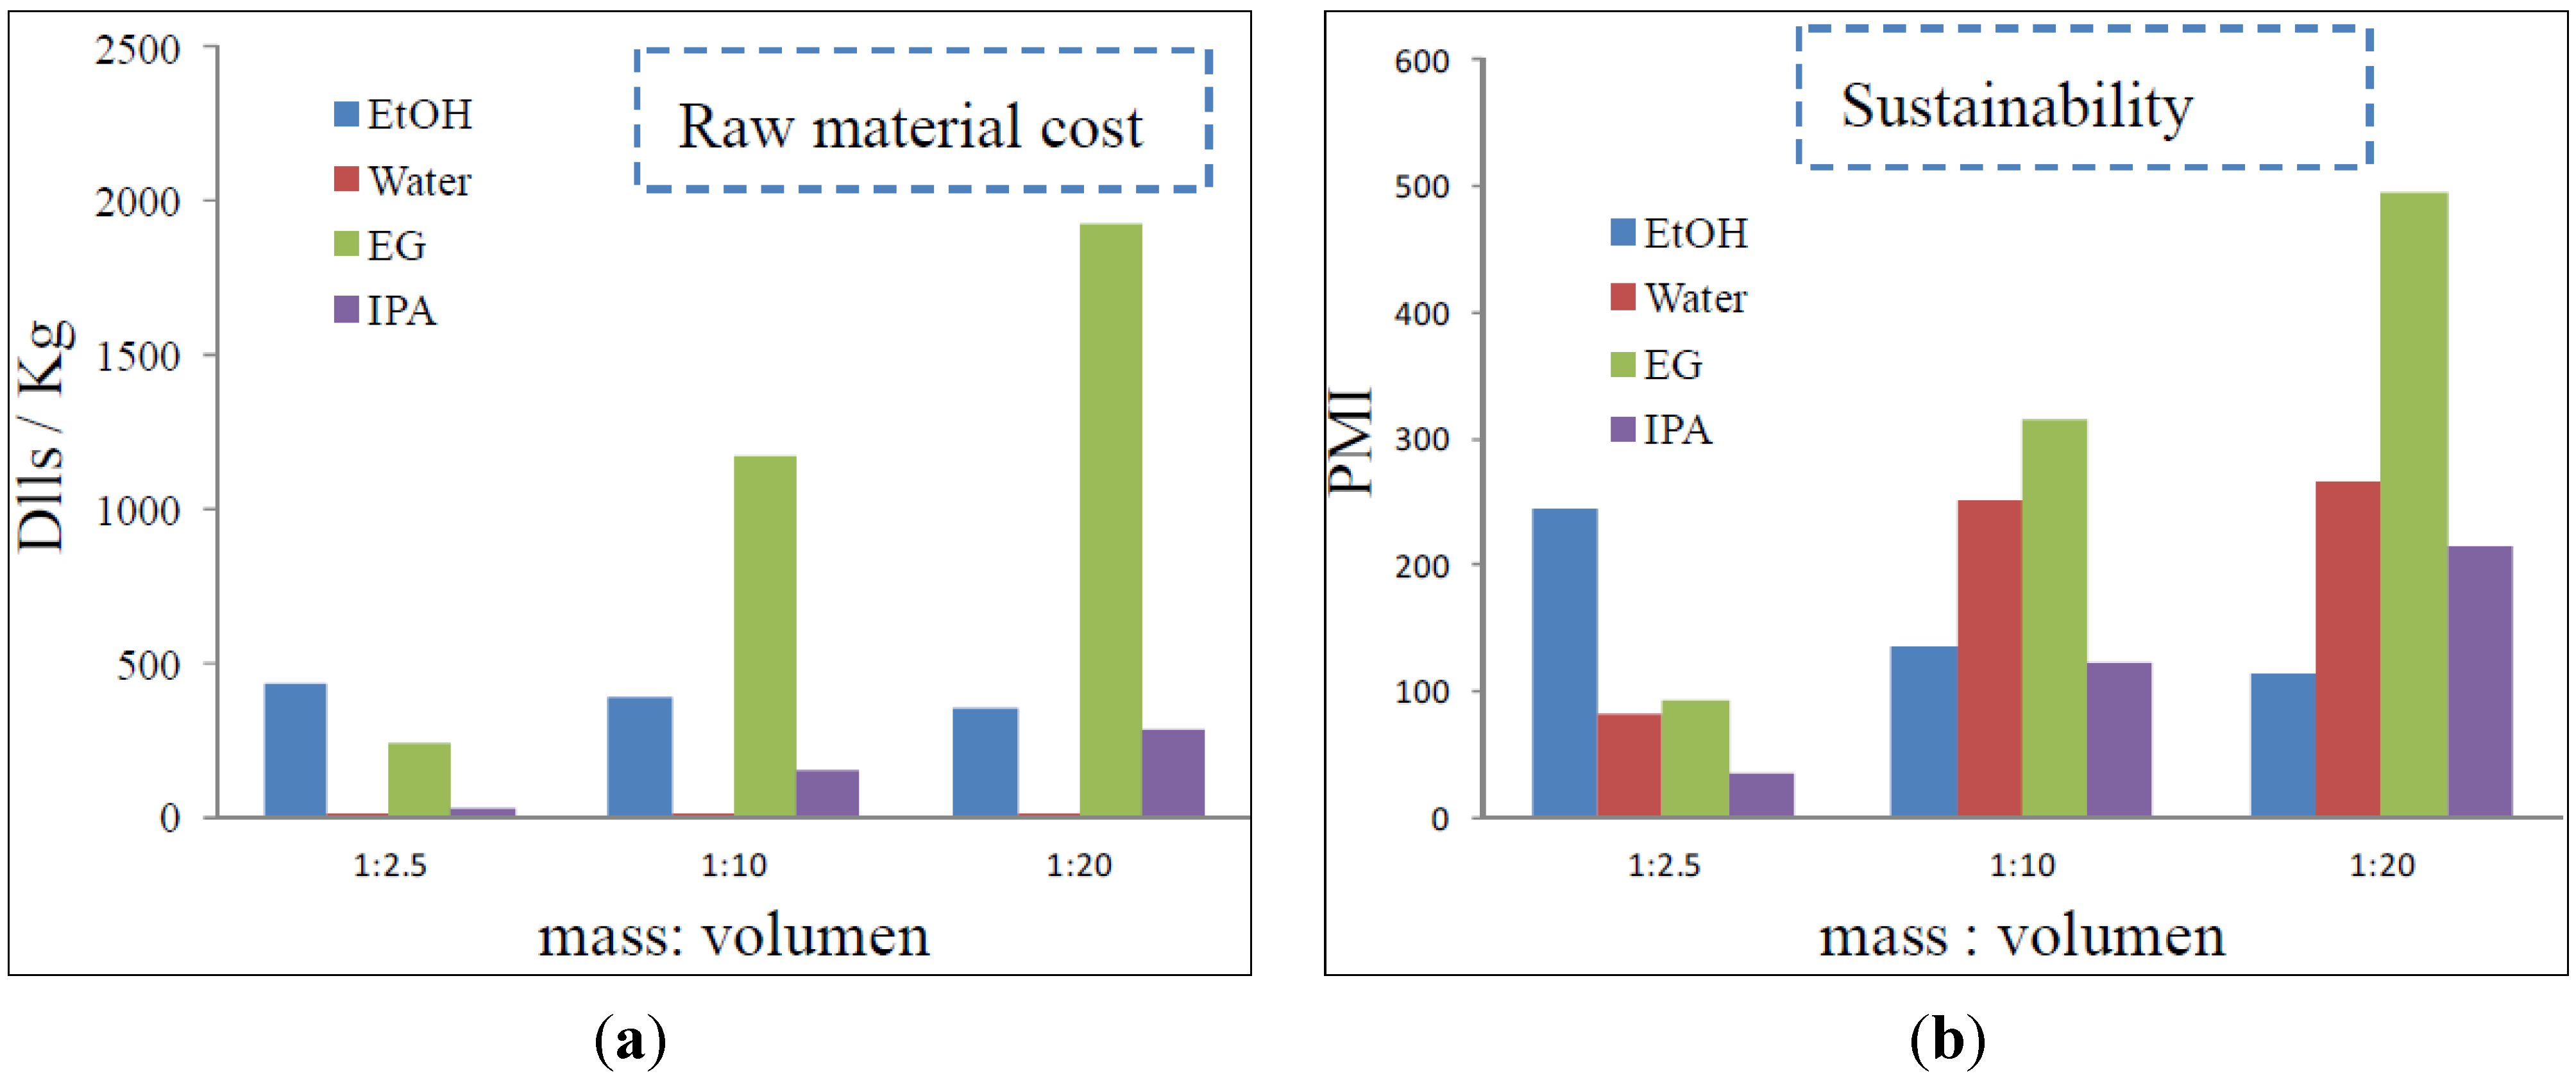
2.2. Process Development and Sustainability Analysis

In order to evaluate the sustainability of the process a simulation was developed with the software Aspen Process Developer 7.3 [25]. Optimum process conditions obtained from the laboratory stage were used to feed the simulation. Two main steps were considered for the production of dry antioxidant extracts: a solvent extraction unit and drying unit (Figure 2). The extraction unit was charged with oat and solvent. After extraction the solvent with the extract goes to a drying unit where a dried extract is obtained. Solvent recycling was considered since this aspect is critical for the development of a sustainable process [12]. A solvent recovery of 90% was considered for each case, since it has been reported that the four solvents can be recovered [11]. Main operations are displayed in Figure 2.
Figure 2. Process main operations and extraction plant layout.
Sustainability 06 01504 g002
From simulation the kilograms of extract produced, energy cost, raw materials cost, and process mass intensity (PMI) were calculated. PMI is a relation between the mass of product produced (antioxidant extract) and the total mass of raw materials utilized in the process. This metric is considered as one of the most important in terms of sustainability [12]. The nearest the PMI is to one (the ideal value) the less waste is produced in the process and the more conversion of the total mass into product takes place, leading to a more sustainable process. It is important to mention that this aspect occurs as a direct effect of the CO2 produced in the process [12].

3. Results and Discussion

ANOVA results for the first and second factorial are shown in Table 4 and Table 5. Table 6 displays ORAC regression coefficients used in the optimization of the response.
Table 4. ANOVA for the first factorial.
TPCORAC
SourceDFSSFpSourceDFSSFp
Main Effects45.338120.100<0.001Main Effects41963.17053.540<0.001
A10.0161.4200.251A116.1201.7600.203
B12.025182.250<0.001B1855.53093.330<0.001
C10.0464.1400.059C137.2404.0600.061
D13.251292.600<0.001D11054.280115.020<0.001
2- Interactions61.38820.820<0.0012- Interactions6312.5205.6800.003
AB10.0454.0000.063AB10.1300.0100.905
AC10.0343.1000.097AC156.6406.1800.024
AD10.0070.6400.436AD12.0900.2300.640
BC10.0020.2200.649BC155.4206.0500.026
BD11.297116.760<0.001BD1188.51020.570<0.001
CD10.0020.1900.669CD19.7301.0600.318
3-Interactions40.1022.3000.1033-Interactions445.821.250.33
ABC10.0060.5300.478ABC110.9501.1900.291
ABD10.0585.2000.037ABD124.4602.6700.122
ACD10.0080.6900.417ACD110.1401.1100.308
BCD10.0312.7900.114BCD10.2600.0300.868
4-Interactions10.0000.0000.9744-Interactions11.7800.1900.665
ABCD10.0000.0000.974ABCD11.7800.1900.665
Residual Error160.178 Residual Error16146.660
Total317.006 Total312469.960
R2 = 0.98 R2 = 0.94
A = Temperature, B = Particle size, C =Time, D = Solvent, DF = Degrees of freedom, SS = Sum of squares.
Table 5. ANOVA for the second factorial.
TPCORAC
SourceDFSSFpSourceDFSSFp
Main Effects45.34330.760<0.001Main Effects43551.07021.130<0.001
A10.0320.7500.400A110.6600.2500.621
B10.0491.1400.302B11.7200.0400.842
C10.0781.8100.198C12.1700.0500.823
D15.183119.360<0.001D13536.53084.170<0.001
2- Interactions61.1884.5600.0072-Interactions6562.3602.2300.094
AB10.0571.3100.270AB120.1700.4800.498
AC10.0511.1700.296AC10.3800.0100.925
AD10.2626.0300.026AD1105.8502.5200.132
BC10.65415.060<0.001BC144.6501.0600.318
BD10.0811.8600.192BD1189.4504.5100.050
CD10.0841.9400.182CD1201.8604.8000.044
3-Interactions41.86910.760<0.0013-Interactions475.5800.4500.771
ABC10.58813.5300.002ABC15.5500.1300.721
ABD10.0611.4000.255ABD12.1800.0500.823
ACD10.0551.2600.278ACD10.0100.0000.988
BCD11.16626.860<0.001BCD167.8501.6100.222
4-Interactions10.53312.2700.0034-Interactions128.3700.6800.423
ABCD10.53312.2700.003ABCD128.3700.6800.423
Residual Error160.695 Residual Error16672.280
Total319.6288 Total314889.670
R = 0.93 R = 0.86
A = Temperature, B = Particle Size, C =Time, D = Solvent, DF = Degrees of Freedom, SS = Sum of squares.
Table 6. Oxygen radical absorbance capacity (ORAC) regression coefficients for the two factorials.
DefinitionCoefficients
Factorial 1Factorial 2
Constant27.353614.7806
Temperature–0.37930.2560
Particle Size–9.278920.5945
Time–0.2975–0.0020
Solvent8.184917.1912
Temperature*Particle Size0.1473–0.7656
Temperature*Time0.0115–0.0023
Temperature*Solvent0.0200–0.1117
Particle Size*Time0.0683–0.1140
Particle Size*Solvent–5.6240–65.5139
Time*Solvent0.2113–0.2312
Temperature*Particle Size*Time–0.00390.0098
Temperature*Particle Size*Solvent0.05371.0090
Temperature*Time*Solvent–0.00480.0065
Particle Size*Time*Solvent–0.05691.2288
Temperature*Particle Size*Time*Solvent0.0016–0.0222

3.1. First Factorial

For the case of TPC, only particle size (B) and solvent (C) showed a significant main effect (p < 0.05). Interactions also were found to be significant for this response. That was the case of the interaction between the particle size and solvent (BC). Moreover, an interaction of three variables (ABD) between the temperature, the particle size, and the solvent were found to be significant. IPA TPC results (0.41–0.86 mg GAE/g) were similar to values already reported [3,6], while water presented higher yields (0.59–1.87 mg GAE/g). Higher water values can be explained because of the use of a more polar solvent. Also, oat and agronomic characteristics can be different due to the culture conditions such as the type of irrigation, temperature in the growing area, and the genotype of the grains [26]. Compared to other sources, oat’s TPC can be considered low. It has been reported that plants’ TPC range from 1.7 to 165 mg GAE/g [27], while fruit TPCs range from 2.38 to 19 mg GAE/g [28]. However, oat contained unique antioxidants such as avenanthramides that have been proven to have beneficial anti-inflammatory effects [6].
For ORAC, particle size (B) and solvent (C) were found significant as main effects. Different two-interaction variables were found significant. That was the case of the interaction between the temperature and time (AC), particle size and time (BC), and particle size and solvent (BC). ORAC results in this study (<0.001–31.10 µmol TE/g oat) were similar to reported values (2.08–28 µmol TE/g oat) from other research [6,14]. These values can be compared to ORAC contained in fruits where values range from 37.42–274 µmol TE/g [28]. From this factorial it can be said that TPC and ORAC were benefited with the smallest particle size (0.5 mm) and most polar solvent, in this case water.
The results can be interpreted as if TPC and ORAC were benefited when the polarity of the solvent was inside high polarity. IPA and water are both considered polar solvent; however, water is more polar than IPA. Polyphenols affinity to water can be explained due to the high polarity behavior of phenolic compounds (like dissolves like). In the case of particle size, small particle size benefited polyphenols extraction due to the greater surface area available. Hence, the two mechanisms were important in order to understand the extraction of TPC and ORAC in oat. In the particular case of ORAC, temperature and time seemed to present a positive effect though different interactions. It is well known that polyphenols are heat sensitive; however, temperature ranges used during this factorial seemed not affecting this variable. In the case of time the variable allow us to keep the necessary contact time between the solvent and the solids to allow the extraction of polyphenols.

3.2. Second Factorial

ANOVA for TPC in the second factorial gave different results than in the first. The solvent was found to be the only variable with significance as a main effect. Nevertheless, many interactions were found significant in this analysis. The interaction temperature-time (AD) and the interaction particle size-solvent (BC) were found to be significant. Three-interaction variable also were found to be significant. That was the case of the interaction between temperature, particle size, and time (ABC) as well as the interaction between the particle size, time, and solvent (BCD). Finally, the four-interaction variable (ABCD) also was found to be significant. From this analysis it can be seen that all the variables presented some degree of significance. The most significant were: solvent main effect and interaction solvent-particle size-time (p < 0.001). TPC of the second factorial ranged from 0.35–2.19 mg GAE/g; being higher than values obtained in factorial one and reported values.
Compared to TPC, ORAC showed few significant variables in the analysis. Only solvent main effect and the interaction time-solvent (CD) were found significant. ORAC results were higher (1.15–47.43 µmol TE/g oat) to those reported (11–27 µmol TE/g oat) by Chu et al. (2013) [6]. EG was the solvent presenting higher TPC and ORAC, this can lead to the supposition that the solvent presented more polyphenol affinity. Avenanthramides represent the major portion of antioxidants in oats [6]; they present an antioxidant capacity 10–30 times higher than other oat polyphenols such as vanillin and caffeic acid [29]. However, no direct relation between ORAC and avenanthramides has been reported, so probably other polyphenols such as tocopherols, sterols, and phytic acid could also affect ORAC [6]. Regarding its molecular structure it has been reported [29] that the hydroxyl group’s arrangement and the nature of substituents in the ring structure play an important role in the total antioxidant capacity.
IPA-water extractions showed an acceptable linear correlation between TPC and ORAC (R2 = 0.83), while EtOH-EG extractions presented a very weak correlation (R2 = 0.31). The poor correlation obtained with EtOH and EG has been explained before [28], where ORAC values are considerably higher than those expected by their actual TPC. This result can be explained due to the different polyphenols extracted. Moreover, in the particular case for oat it has been reported that no correlation has been found between ORAC and TPC [6,30], arguing that this could be attributed to the presence of non-phenolic compounds with antioxidant capacity or the fact that some polyphenols present higher reactivity with peroxyl free radicals [7]. Synergisms among antioxidants in total antioxidant capacity are also considered a potential cause for this response [6]. Other studies consider that this poor correlation can be explained because of the presence of antioxidants such as tocopherols, carotenoids and flovonoids and their ability to not only donate hydrogen but also scavenge oxygen [31].

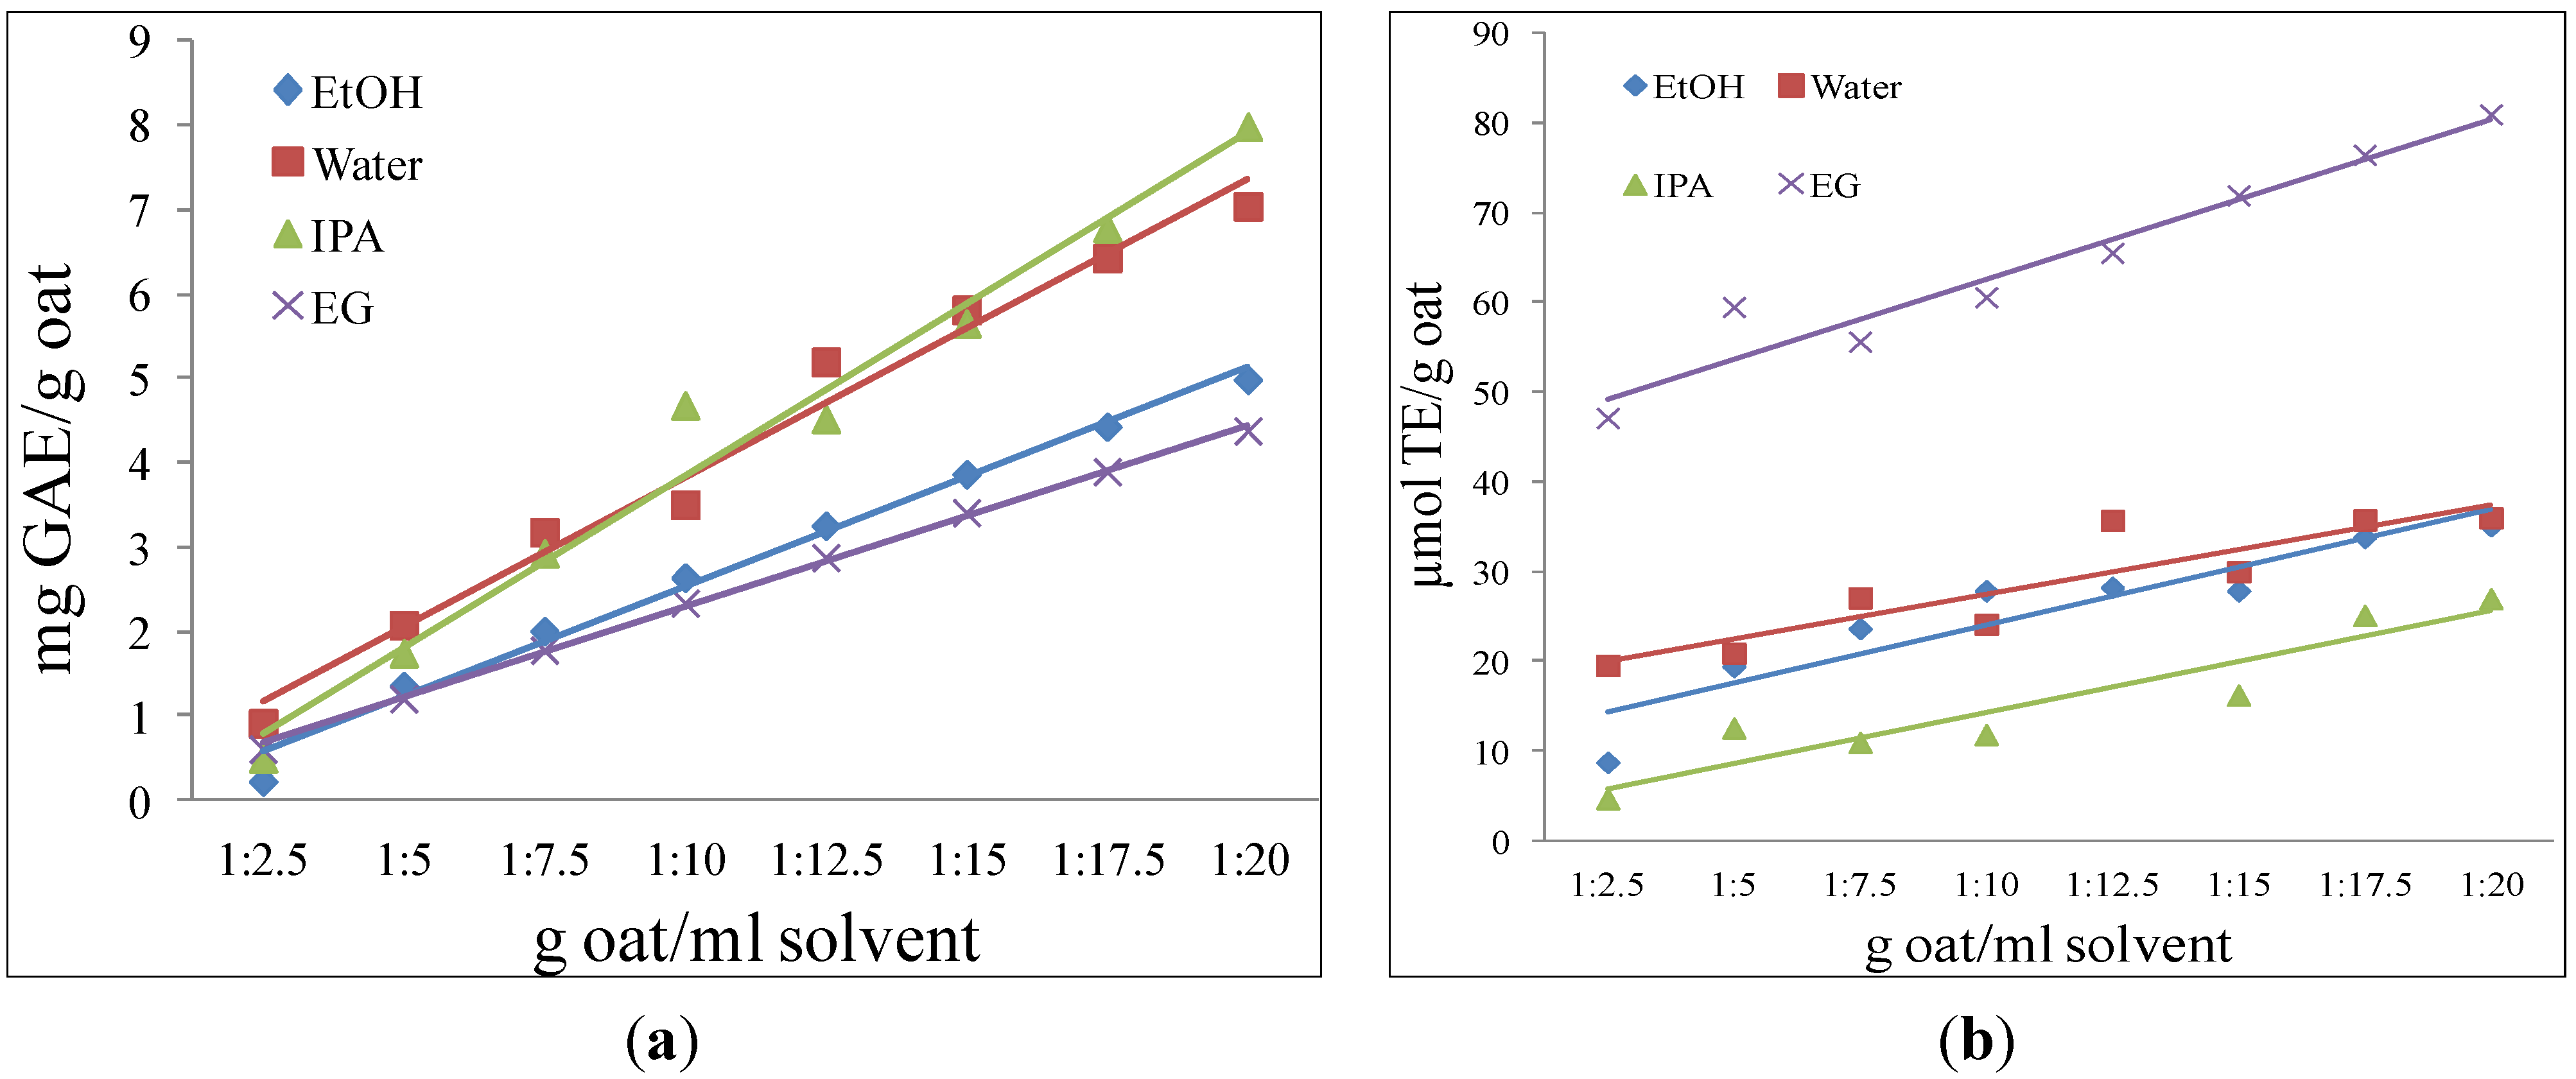
3.3. Extraction Optimization

TPC has been claimed to be a misleading antioxidant capacity indicator [32]. TPC by Folin–Ciocalteu reagent reacts with phenolic and non-phenolic compounds such as vitamin C and Cu (I): as a result, the method may not reflect an accurate amount of phenolic antioxidants [27].
On the other hand, ORAC has been defined as a good method for evaluating antioxidant capacity in bio systems [6,33]. ORAC represents the radical scavenging properties of the polyphenols present in the extract and their possible synergism or antagonism between individual antioxidants. As a result, ORAC was selected for process optimization. From factorial results, linear regression models were obtained for predicting and optimizing process variables. The fitted regression coefficients for the two factorials are displayed in Table 6.
Optimum conditions for maximum ORAC response for each solvent are displayed in Table 7.
Table 7. Optimum extraction conditions.
SolventTemperatureParticle SizeTimeORAC
(°C)(mm)(min)(µmol TE/g oat)
Water500.56027.0621
IPA500.56013.6600
EG500.0756037.5267
EtOH300.52020.5623
As seen in Table 7, solvents such as EG and water presented higher ORAC yields. A temperature of 50 °C, particle size of 0.50 mm, and 60 min time were the optimum conditions for water, and IPA. For EG an optimum temperature of 50 °C, particle size of 0.075 mm, and 60 min time was obtained. Ethanol was the only solvent presenting different optimum conditions of temperature and time. Less temperature and time were necessary for EtOH in order to reach optimum ORAC. These conditions could benefit the operation at the time of scaling since less energy for heating (temperature) might increase the sustainability of the process (low extraction time). Another important aspect is that in the majority of the cases a particle size less than 0.50 mm seemed not to improve the extraction. This is important since it has a direct effect on milling cost.

3.4. Solubility Behavior

Figure 3 shows the solubility behavior of the four solvents over the extract with different mass/volume ratios. As expected, the amount of extract obtained was higher when more solvent was used. However, solvents such as EG and IPA showed few differences when increasing the volume of solvent. EtOH was the solvent that showed a more evident effect when the amount of solvent increased. Hence, it was the solvent that extracted more solute.
Figure 3. Grams of extract at different solvent ratios.
Sustainability 06 01504 g003
TPC and ORAC were also quantified in the extracts as is shown in Figure 4a,b. As expected, the more extract was extracted, the more TPC or ORAC was obtained. Hence, extractions that were run with more solvent (1:20) presented more TPC and ORAC. The solvents presenting higher TPC were IPA and water, following EtOH and EG. In the case of antioxidant capacity, EG was the solvent with the highest ORAC in the extract followed by water, EtOH, and IPA. Figure 3 displays the amount of extract obtained (g/g oat) and Figure 4a,b displays the amount of TPC and ORAC in the different extractions. Figure 3 regards to the mass extracted whereas Figure 4a,b is about the polyphenolic content and the antioxidant capacity in the extract. In the case of ethanol (EtOH), this was the solvent with more solids extracted. However, this does not mean that the extract will present more TPC or ORAC. It has been reported that for the case of oat there is a weak correlation between the TPC and the ORAC [6]. As a result, it would be expected that this correlation would be also weak for the solids extracted. From this analysis it can concluded that IPA and water were the solvents with more TPC in the extract, and EG extract had higher ORAC than the rest of the extracts, even presenting less g/g of oat.
Figure 4. (a) Total polyphenolic content (TPC) on extract, and (b) ORAC on extract.
Sustainability 06 01504 g004

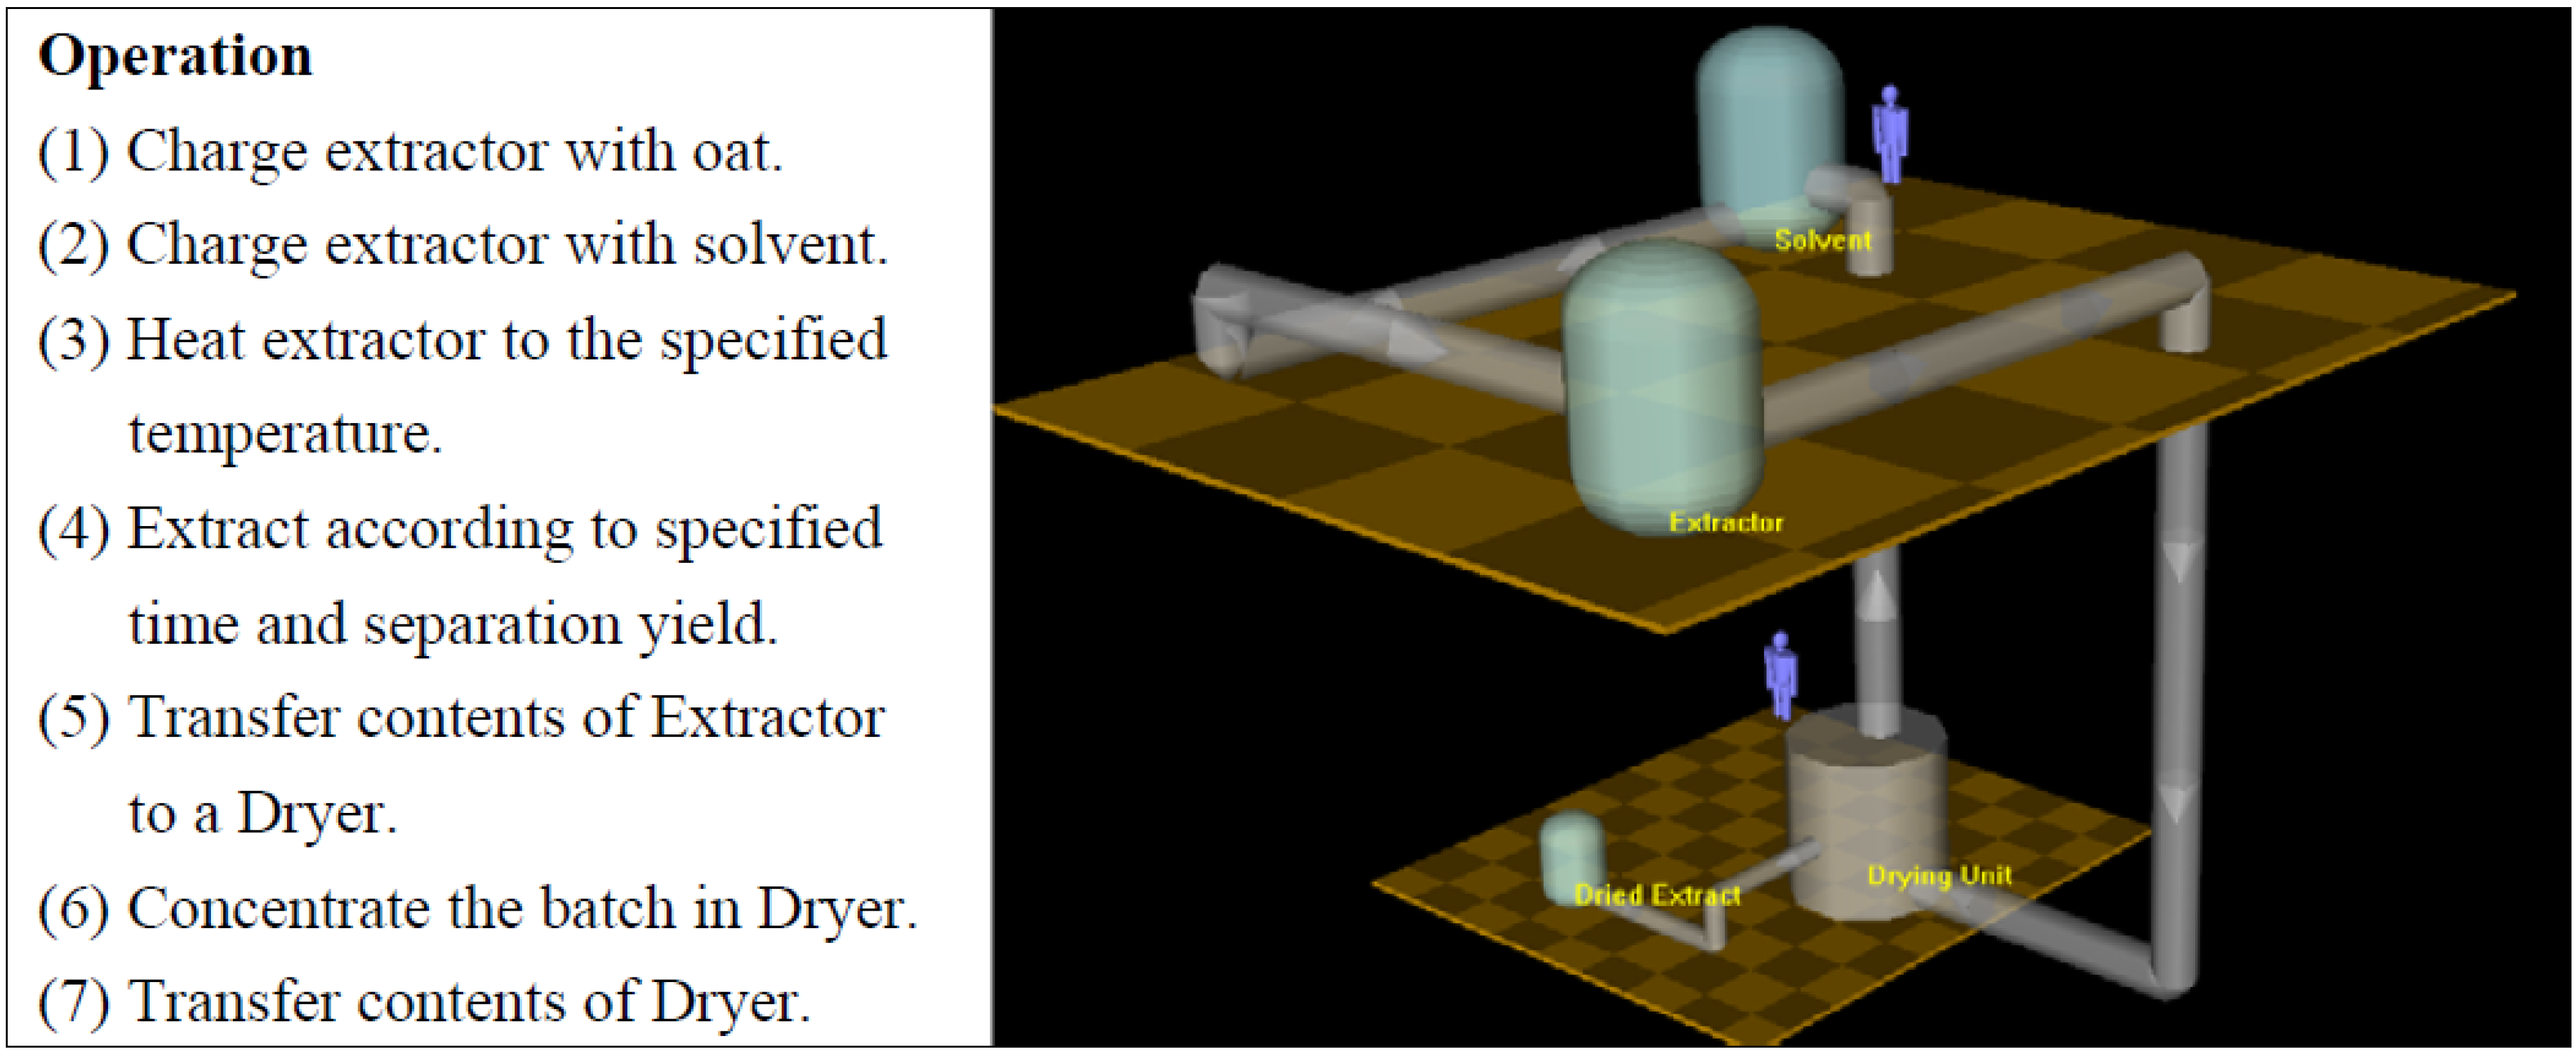
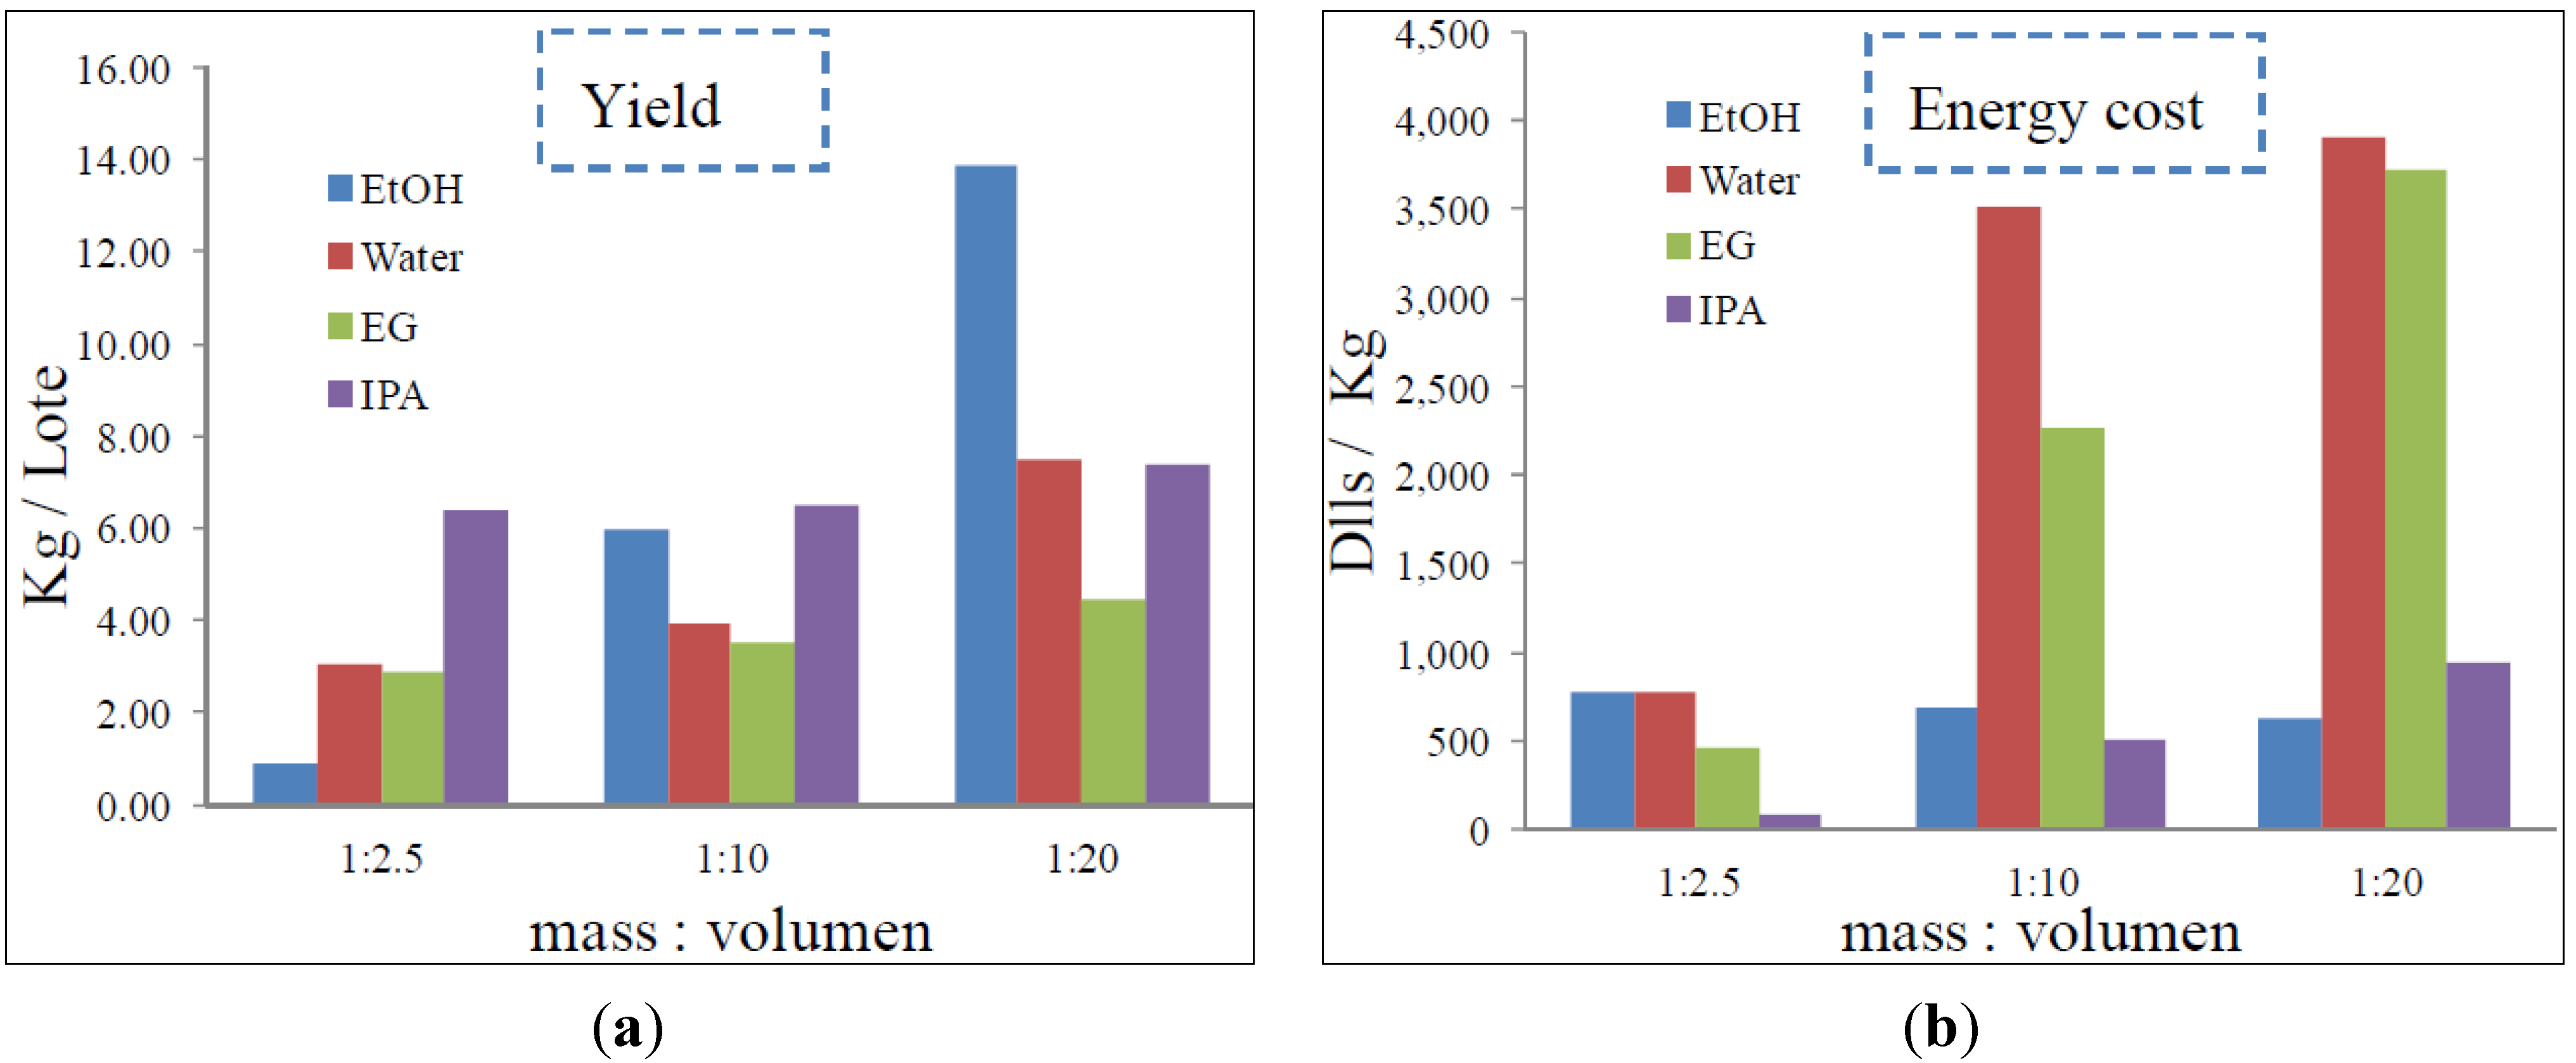
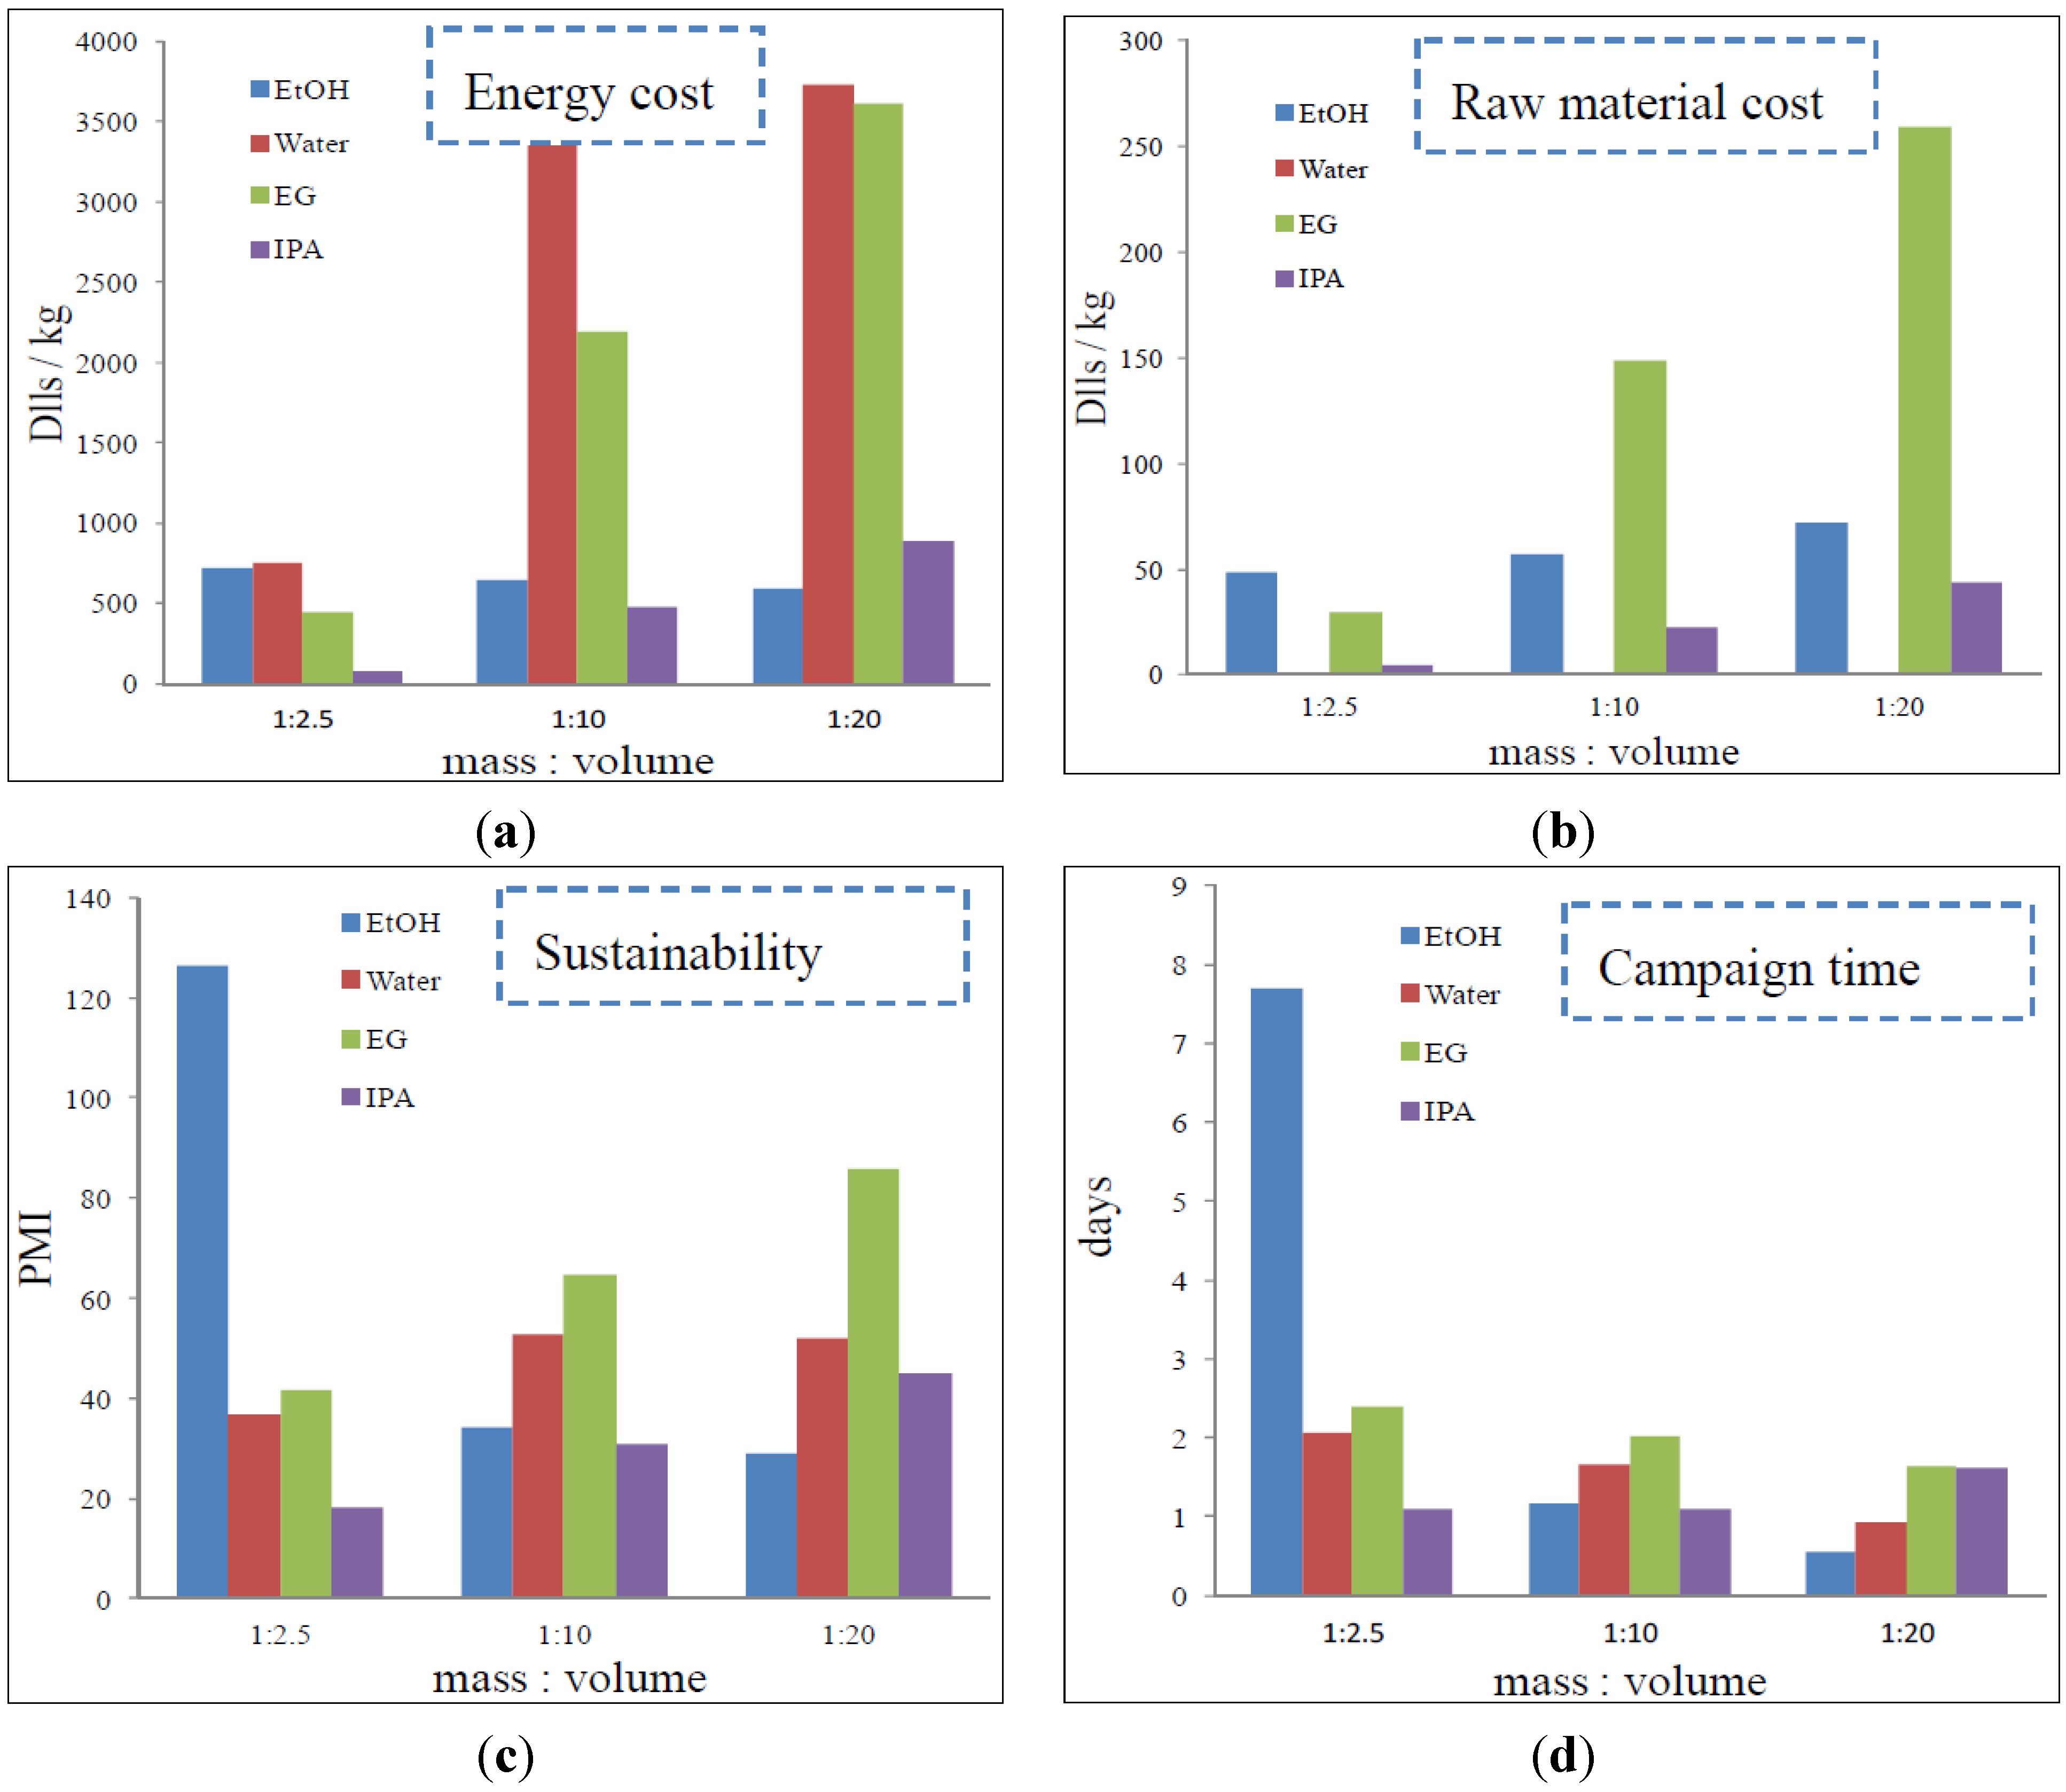
3.5 Process Simulation

The first simulation consisted in processing 100 kg oat into the extraction process. Results from simulation are displayed in Figure 5 and Figure 6.
Figure 5 displays the results for yield and energy cost. As can be seen in Figure 5a there is a tendency to increase the amount of extract when high amounts of solvent are used. This can be explained due to the solubility behavior obtained in the solubility experiments. As stated before, the amount of extract obtained at different ratios is almost the same for EG and IPA, while in the case of water and EtOH there is a considerable increment in the amount of extract obtained when increasing the amount of solvent. Figure 5b displays the energy cost for processing the batch. The energy demanded for heating during the extraction and evaporation was considered in this figure. The solvents presenting higher energy demands were EG and water. This can be explained due to their high boiling point and high heat of vaporization, especially for water. Solvents with low boiling point and low heat of vaporization showed less energy demand.
Figure 5. (a) Kilograms of extract obtained per lot. (b) Energy cost per kg of extract.
Sustainability 06 01504 g005
Raw materials cost (solvent and oat) were included in Figure 6a. For all the cases, solvent cost was >90% of the cost of materials, so the more expensive the solvent, the more the cost for producing a kg of dry extract. EG was the most expensive solvent, costing around 2000 US dlls for the production of 14 kg of dry extract. Water was the most economic choice: the cost was so low that is difficult to see in Figure 6a. IPA also can be considered a good choice due to its solubility behavior. The sustainability of the process was evaluated estimating PMI. Fig 6b displays the results. As it can be seen, the process with less PMI was IPA with a mass/solvent ratio of 1:2.5. EG presented the highest PMI with a mass/solvent ratio of 1:20.
Figure 6. (a) Raw materials cost per kg of extract. (b) process mass intensity (PMI).
Sustainability 06 01504 g006
A second simulation was run considering a campaign for producing 100 kg of dry extract and incorporating solvent recycling. Energy consumption is observed in Figure 7a. Since operations such as extraction and evaporation are directly affected by mass, similar values were obtained in the campaign than in the batch. Solvents such as EG and water still showed the highest energy cost. In the case of raw materials’ cost there was a considerable reduction (Figure 7b). This reduction can be explained because of the reduction in the amount of solvent purchased as a consequence of recycling between the batches in the campaign. Water and IPA were the solvents with the lowest raw material cost and EG the most expensive. PMI values also were reduced due to the implementation of solvent recycling. Solvent such as IPA and EtOH presented the lowest values, so these solvents where the most sustainable in terms of mass utilization. Time necessary to fulfill the campaign also was plotted in Figure 7d were differences among solvents can be seen. Solvents such as IPA (1:2.5, 1:10) and EtOH (1:20) presented less than a day to fulfill the production of 100 kg of dry extract. From an industrial perspective it can be seen that solvents such as IPA and EtOH presented less impact in aspects such as energy cost, raw material cost, PMI, and campaign time. However, solvent vapor control equipment might be necessary for these solvents. As a result, EtOH in a 1–20 oat/solvent ratio was the best choice from a holistic perspective; it presented low energy cost, low raw material cost, low PMI, short campaign time, more extract/oat, and a considerable antioxidant capacity.
Figure 7. (a) Energy cost per kg of extract. (b) Raw materials cost per kg extract. (c) PMI. (d) Campaign time.
Sustainability 06 01504 g007

4. Conclusions

From a laboratory analysis EG and water presented higher values of TPC and ORAC. Solvents with very polar characteristics and low particle size were significant as the main effects for the extraction of antioxidants from oat, whereas time and temperature were significant as interactions. Solubility analysis demonstrates that EtOH was the solvent presenting higher grams of extract per gram of oat. In order to develop a sustainable extraction, solvents such as IPA and EtOH presented a better performance since their energy cost, raw material cost, and PMI were lower than EG and Water. Solvent recycling was an important aspect directly affecting energy cost, raw material cost, and PMI. From a holistic perspective EtOH was the solvent that offered the most sustainable process from the four solvents. The analysis obtained during this research might aid the future development of solvent extraction of added value compounds from oat. Feature work most rely in the quantification of polyphenols contained in the extract as well as expand the sustainability analysis with the incorporation of aspects such as raw materials life cycle or the consideration of other extraction and purification techniques.

Acknowledgments

The authors would like to thank the Mexican Council of Science CONACYT for providing the founding for this research through the project CB-2011-01-168977.

Author Contributions

Samuel Perez-Vega participated with the idea, research planning, data analysis, literature review, research funding and paper writing. Iván Salmerón-Ochoa developed the DOE, analysis of the statistical results, and analytical methods. Enrique Ortega-Rivas was in charge of solids handling activities such as milling and extraction, as well as paper writing. Raul Orozco-Mena developed the experiments, did literature review, implemented analytical methods, and results analysis.

Conflicts of Interest

The authors declare no conflict of interest.

References

  1. Nie, L.; Wise, M.L.; Peterson, D.M.; Meydani, M. Avenanthramide, a polyphenol from oats, inhibits vascular smooth muscle cell proliferation and enhances nitric oxide production. Atherosclerosis 2006, 186, 260–266. [Google Scholar] [CrossRef]
  2. Peterson, D.M.; Dimberg, L.H. Avenanthramide concentrations and hydroxycinnamoyl-CoA: hydroxyanthranilate N-hydroxycinnamoyltransferase activities in developing oats. J. Cereal Sci. 2008, 47, 101–108. [Google Scholar] [CrossRef]
  3. Emmons, L.; Peterson, M. Antioxidant Activity and Phenolic Contents of Oat Groats and Hulls. Ceral Chem. 1999, 76, 902–906. [Google Scholar] [CrossRef]
  4. Peterson, M. Oat Antioxidants. J. Cereal Sci. 2001, 33, 115–129. [Google Scholar] [CrossRef]
  5. Sen, L.; Nan, Y.; Zhao-hua, H.; Yang, Y.; Li, L.; Xian-rong, Z.; Gui-xing, R. Antioxidant Effects of Oats Avenanthramides on Human Serum. Agr. Sci. China 2011, 10, 1301–1305. [Google Scholar] [CrossRef]
  6. Chu, Y.-F.; Wise, M.L.; Gulvady, A.A.; Chang, T.; Kendra, D.F.; van Klinken, B.J.-W.; Shi, Y.; O’Shea, M. In vitro antioxidant capacity and anti-inflammatory activity of seven common oats. Food Chem. 2013, 139, 426–431. [Google Scholar] [CrossRef]
  7. Pietta, P.-G. Flavonoids as Antioxidants. J. Nat. Prod. 2000, 63, 1035–1042. [Google Scholar]
  8. Verardo, V.; Serea, C.; Segal, R.; Fiorenza, C. Free and bound minor polar compounds in oats: Different extraction methods and analytical determinations. J. Cereal Sci. 2011, 54, 211–217. [Google Scholar] [CrossRef]
  9. Karen, D.; Pamela, W. Extraction and identification of antioxidants in oats. J. Am. Oil Chem. Soc. 1991, 68, 365–370. [Google Scholar] [CrossRef]
  10. Curzons, A.D.; Constable, D.; Mortimer, D.; Cunningham, V. So you think your process is green, how do you know? Using principles of sustainability to determine what is green—A corporate perspective. Green Chem. 2001, 3, 1–6. [Google Scholar]
  11. Smallwood, I.M. Solvent Recovery Handbook, 2nd ed.; Blackwell Science: Oxford, UK, 2002. [Google Scholar]
  12. Jimenez-Gonzalez, C.; Poechlauer, P.; Broxterman, Q.B.; Yang, B.-S.; am Ende, D.; Baird, J.; Bertsch, C.; Hannah, R.E.; Dell’Orco, P.; Noorman, H.; et al. Key Green Engineering Research Areas for Sustainable Manufacturing: A Perspective from Pharmaceutical and Fine Chemicals Manufacturers. Org. Process Res. Dev. 2011, 15, 900–911. [Google Scholar] [CrossRef]
  13. Zilic, S.; Sukalovicb, V.H.-T.; Dodiga, D.; Maksimovi, V.; Maksimovi, M.; Basi, Z. Antioxidant activity of small grain cereals caused by phenolics and lipid soluble antioxidants. J. Cereal Sci. 2011, 54, 417–424. [Google Scholar] [CrossRef]
  14. Handelman, G.; Cao, G.; Walter, M.; Nightingale, Z.; Paul, G.; Prior, R.; Blumberg, J. Antioxidant Capacity of Oat (Avena sativa L.) Extracts. 1. Inhibition of Low-Density Lipoprotein Oxidation and Oxygen Radical Absorbance Capacity. J. Agric. Food Chem. 1999, 48, 4888–4893. [Google Scholar]
  15. Lehtinen, P.; Laakso, S. Effect of Extraction Conditions on the Recovery and Potency of Antioxidants in Oat Fiber. J. Agric. Food. Chem. 1998, 46, 4842–4845. [Google Scholar] [CrossRef]
  16. Bryngelsson, S.; Dimberg, L.H.; Eldin, A.K. Effects of Commercial Processing on Levels of Antioxidants in Oats (Avena sativa L.). J. Agric. Food Chem. 2002, 50, 1890–1896. [Google Scholar] [CrossRef]
  17. Anderson, N.G. Practical Process Research & Development, 2nd ed.; Academic Press: Oxford, UK, 2012. [Google Scholar]
  18. Perez-Vega, S.; Peter, S.; Salmeron-Ochoa, I.; Nieva-de la Hidalga, A.; Sharratt, P.N. Analytical hierarchy processes (AHP) for the selection of solvents in early stages of pharmaceutical process development. Process Saf. Environ. Prot. 2011, 89, 261–267. [Google Scholar]
  19. Wypych, G. (Ed.) Handbook of Solvents; ChemTec Publishing: Toronto, Canada, 2001.
  20. Curzons, A.D.; Constable, D.C.; Cunningham, V.L. Solvent selection guide: A guide to the integration of environmental, health and safety criteria into the selection of solvents. Clean Technol. Environ. Pol. 1999, 1, 82–90. [Google Scholar] [CrossRef]
  21. Constable, D.J.C.; Jimenez-Gonzalez, C.; Henderson, R.K. Perspective on Solvent Use in the Pharmaceutical Industry. Org. Process Res. Dev. 2007, 11, 133–137. [Google Scholar] [CrossRef]
  22. Singleton, V.; Orthofer, R.; Lamuelas-Raventos, R. Analysis of Total Phenols and Other Oxidation Substrates and Antioxidants by Means of Folin-Ciocalteu Reagent. Methods Enzymol. 1999, 229, 152–178. [Google Scholar]
  23. Huang, D.; Ou, B.; Hampsch-Woodill, M.; Flanagan, J.A.; Prior, R.L. High-Throughput Assay of Oxygen Radical Absorbance Capacity (ORAC) Using a Multichannel Liquid Handling System Coupled with a Microplate Fluorescence Reader in 96-Well Format. J. Agric. Food. Chem. 2002, 50, 4437–4444. [Google Scholar] [CrossRef]
  24. Montgomery, D.C. Design and Analysis of Experiments, 5th ed.; John Wiley & Sons, Inc.: New York, NY, USA, 2001. [Google Scholar]
  25. Aspen Batch Plus. Available online: http://www.aspentech.com/products/aspen-batch-plus.aspx (accessed on 1 June 2013).
  26. Peterson, D.; Wesenbergb, D.; Burrupb, D.; Charles, A. Relationships among Agronomic Traits and Grain Composition in Oat Genotypes Grown in Different Environments. Crop Sci. 2005, 45, 1249–1255. [Google Scholar] [CrossRef]
  27. Sultana, B.; Anwa, F.; Ashraf, M. Effect of Extraction Solvent/Technique on the Antioxidant Activity of Selected Medicinal Plant Extracts. Molecules 2009, 14, 2167–2180. [Google Scholar] [CrossRef]
  28. Speisky, H.; López-Alarcó, C.; Gómez, M.; Fuentes, J.; Sandoval-Acuña, C. First Web-Based Database on Total Phenolics and Oxygen Radical Absorbance Capacity (ORAC) of Fruits Produced and Consumed within the South Andes Region of South America. J. Agric. Food. Chem. 2012, 60, 8851–8859. [Google Scholar] [CrossRef]
  29. Bratt, K.; Sunnerheim, K.; Brynglesson, S.; Fagerlund, A.; Engman, L.; Andersson, R.E.; Dimberg, L.H. Avenanthramides in Oats (Avena sativa L.) and Structure-Antioxidant Activity Relationships. J. Agric. Food. Chem. 2003, 51, 594–600. [Google Scholar] [CrossRef]
  30. Wu, X.; Beecher, G.R.; Holden, J.M.; Haytowitz, D.B.; Gebhardt, S.E.; Prior, R. Lipophilic and Hydrophilic Antioxidant Capacities of Common Foods in the United States. J. Agric. Food. Chem. 2004, 52, 4026–4037. [Google Scholar] [CrossRef]
  31. Cuppett, S.; Schnepf, M.; Hall, C. Natural antioxidants—Are they a reality. In Natural Antioxidants, Chemistry, Health Effects and Applications; Shahidi, F., Ed.; AOCS Press: Champaign, IL, USA, 1997; pp. 12–24. [Google Scholar]
  32. Kahkonen, M.P.; Hopia, A.I.; Vuorela, H.J.; Rauha, J.-P.; Pihlaja, K.; Kujala, T.S.; Heinonen, M. Antioxidant Activity of Plant Extracts Containing Phenolic Compounds. J. Agric. Food. Chem. 1999, 47, 3954–3962. [Google Scholar] [CrossRef]
  33. Huang, D.; Ou, B.; Prior, R. The Chemistry behind Antioxidant Capacity Assays. J. Agric. Food. Chem. 2005, 53, 1841–1856. [Google Scholar] [CrossRef]

