Unified Efficiency Measurement of Electric Power Supply Companies in China

Abstract
:1. Introduction
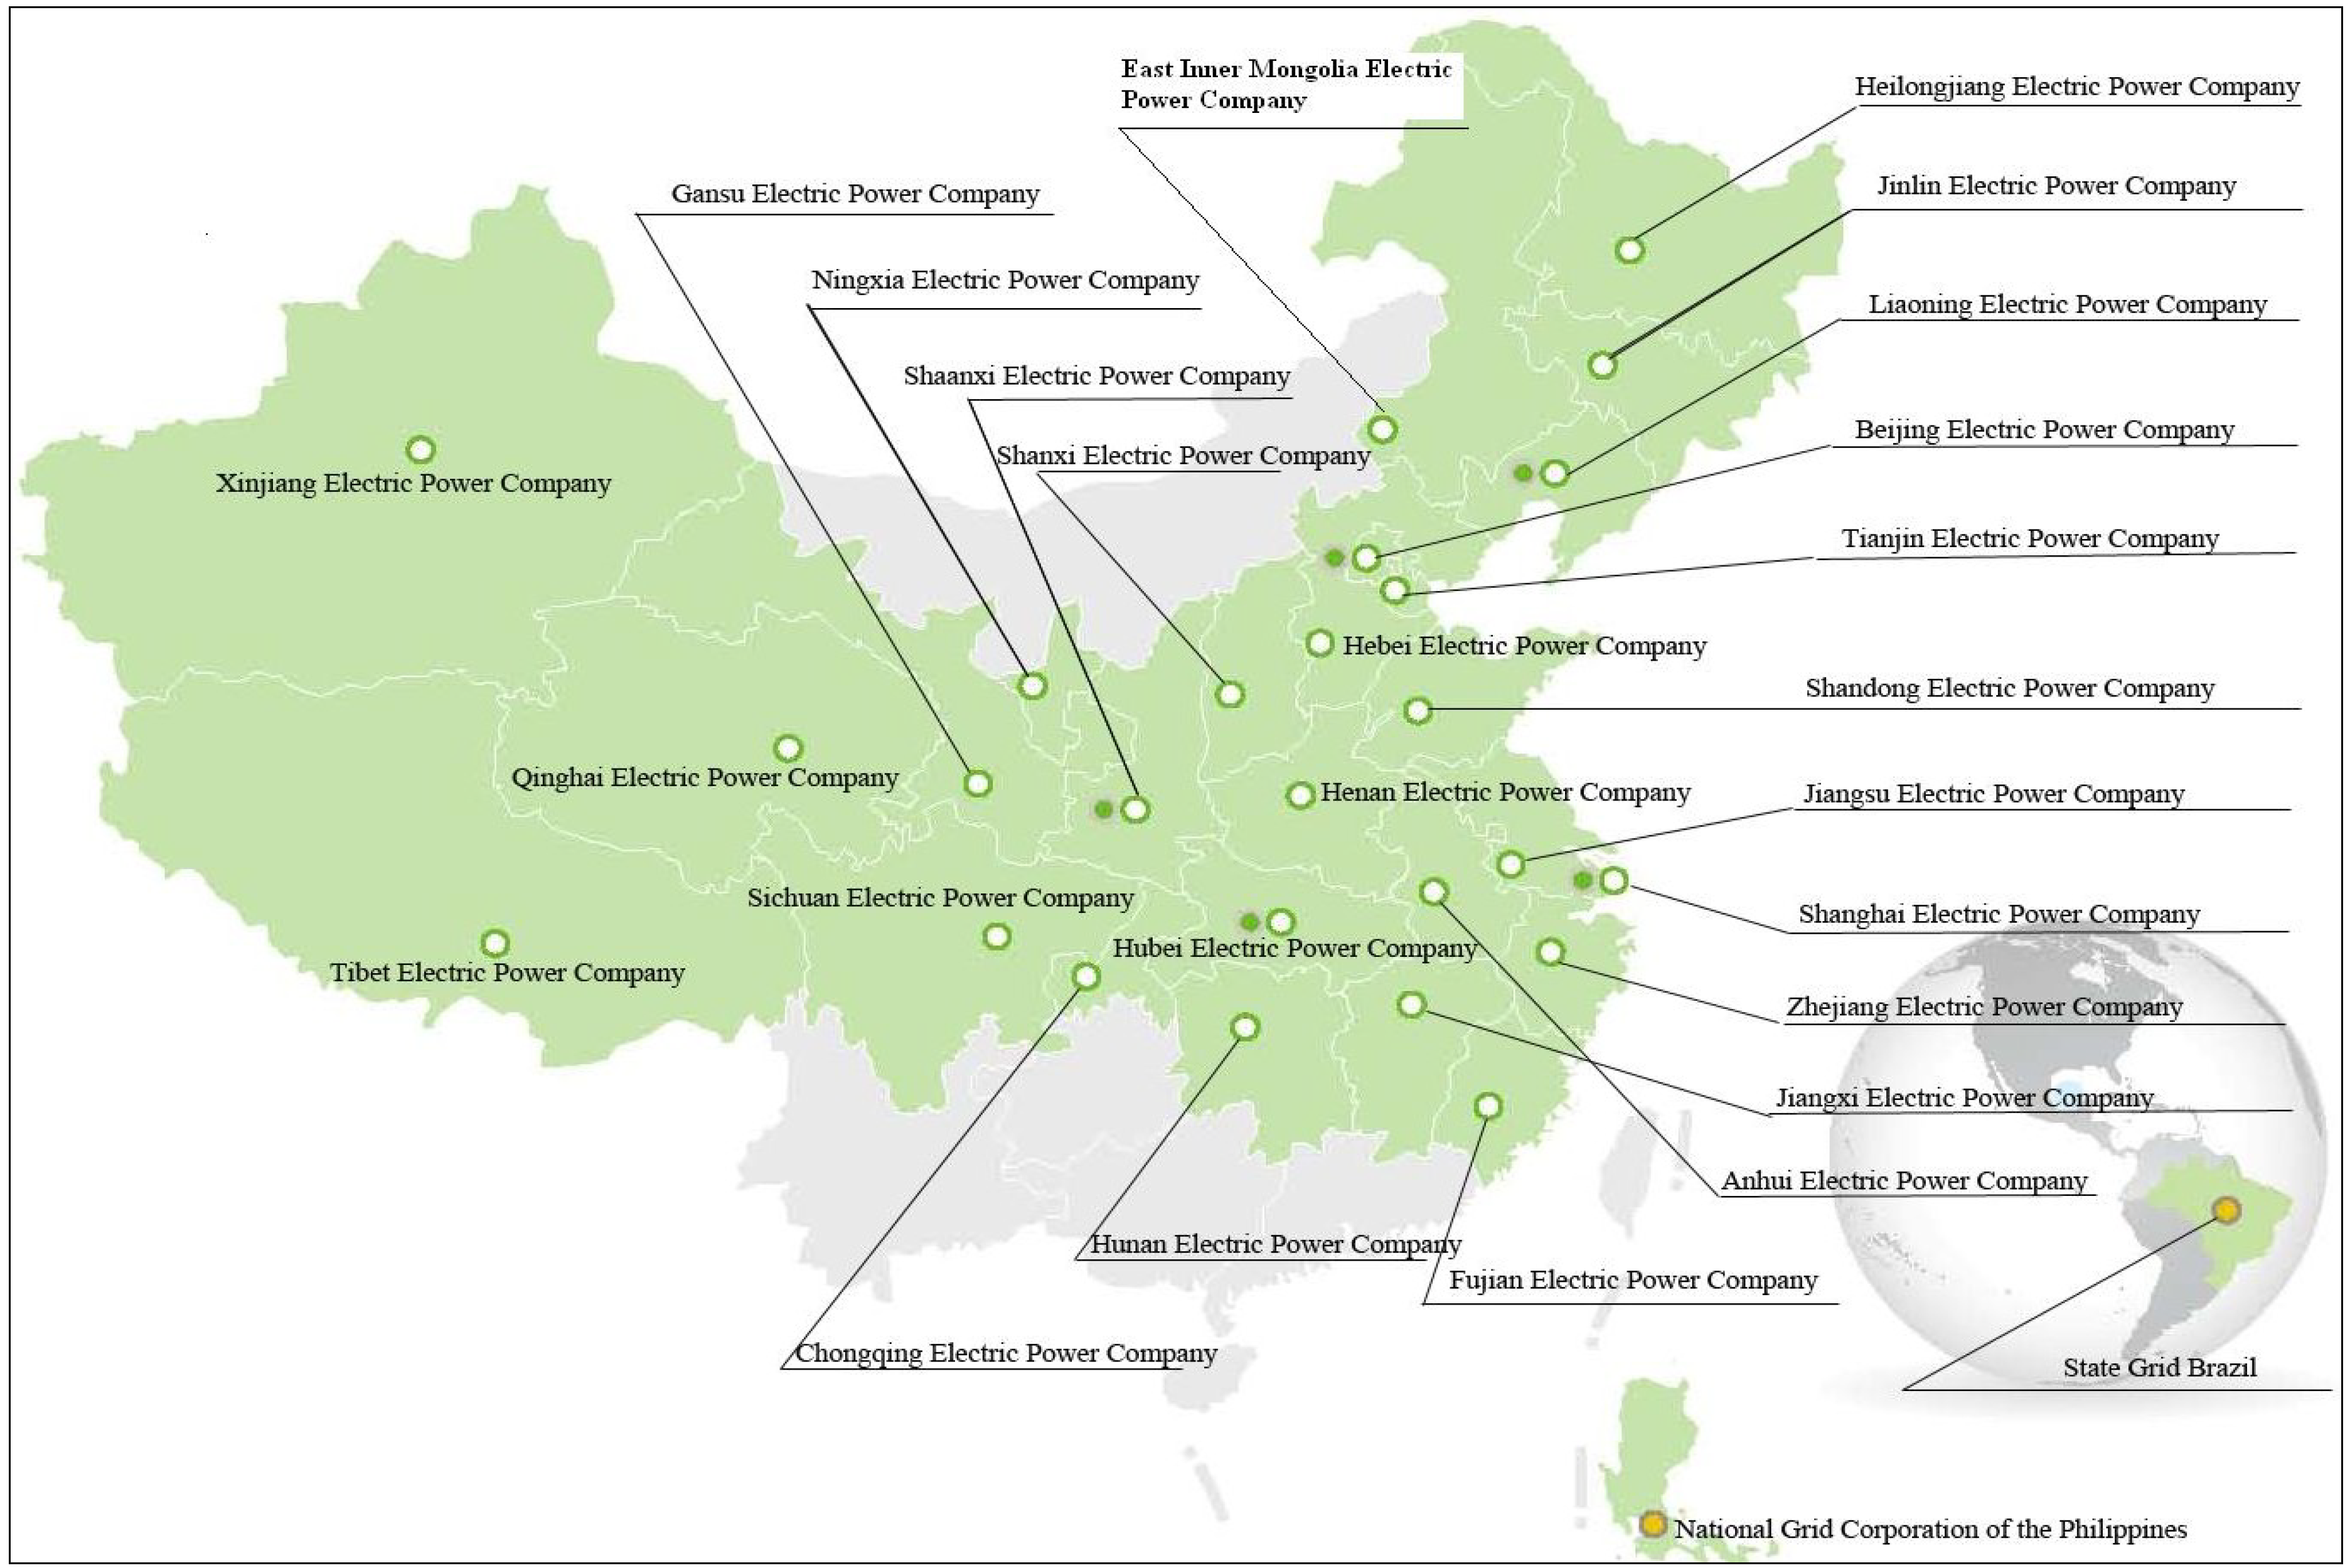
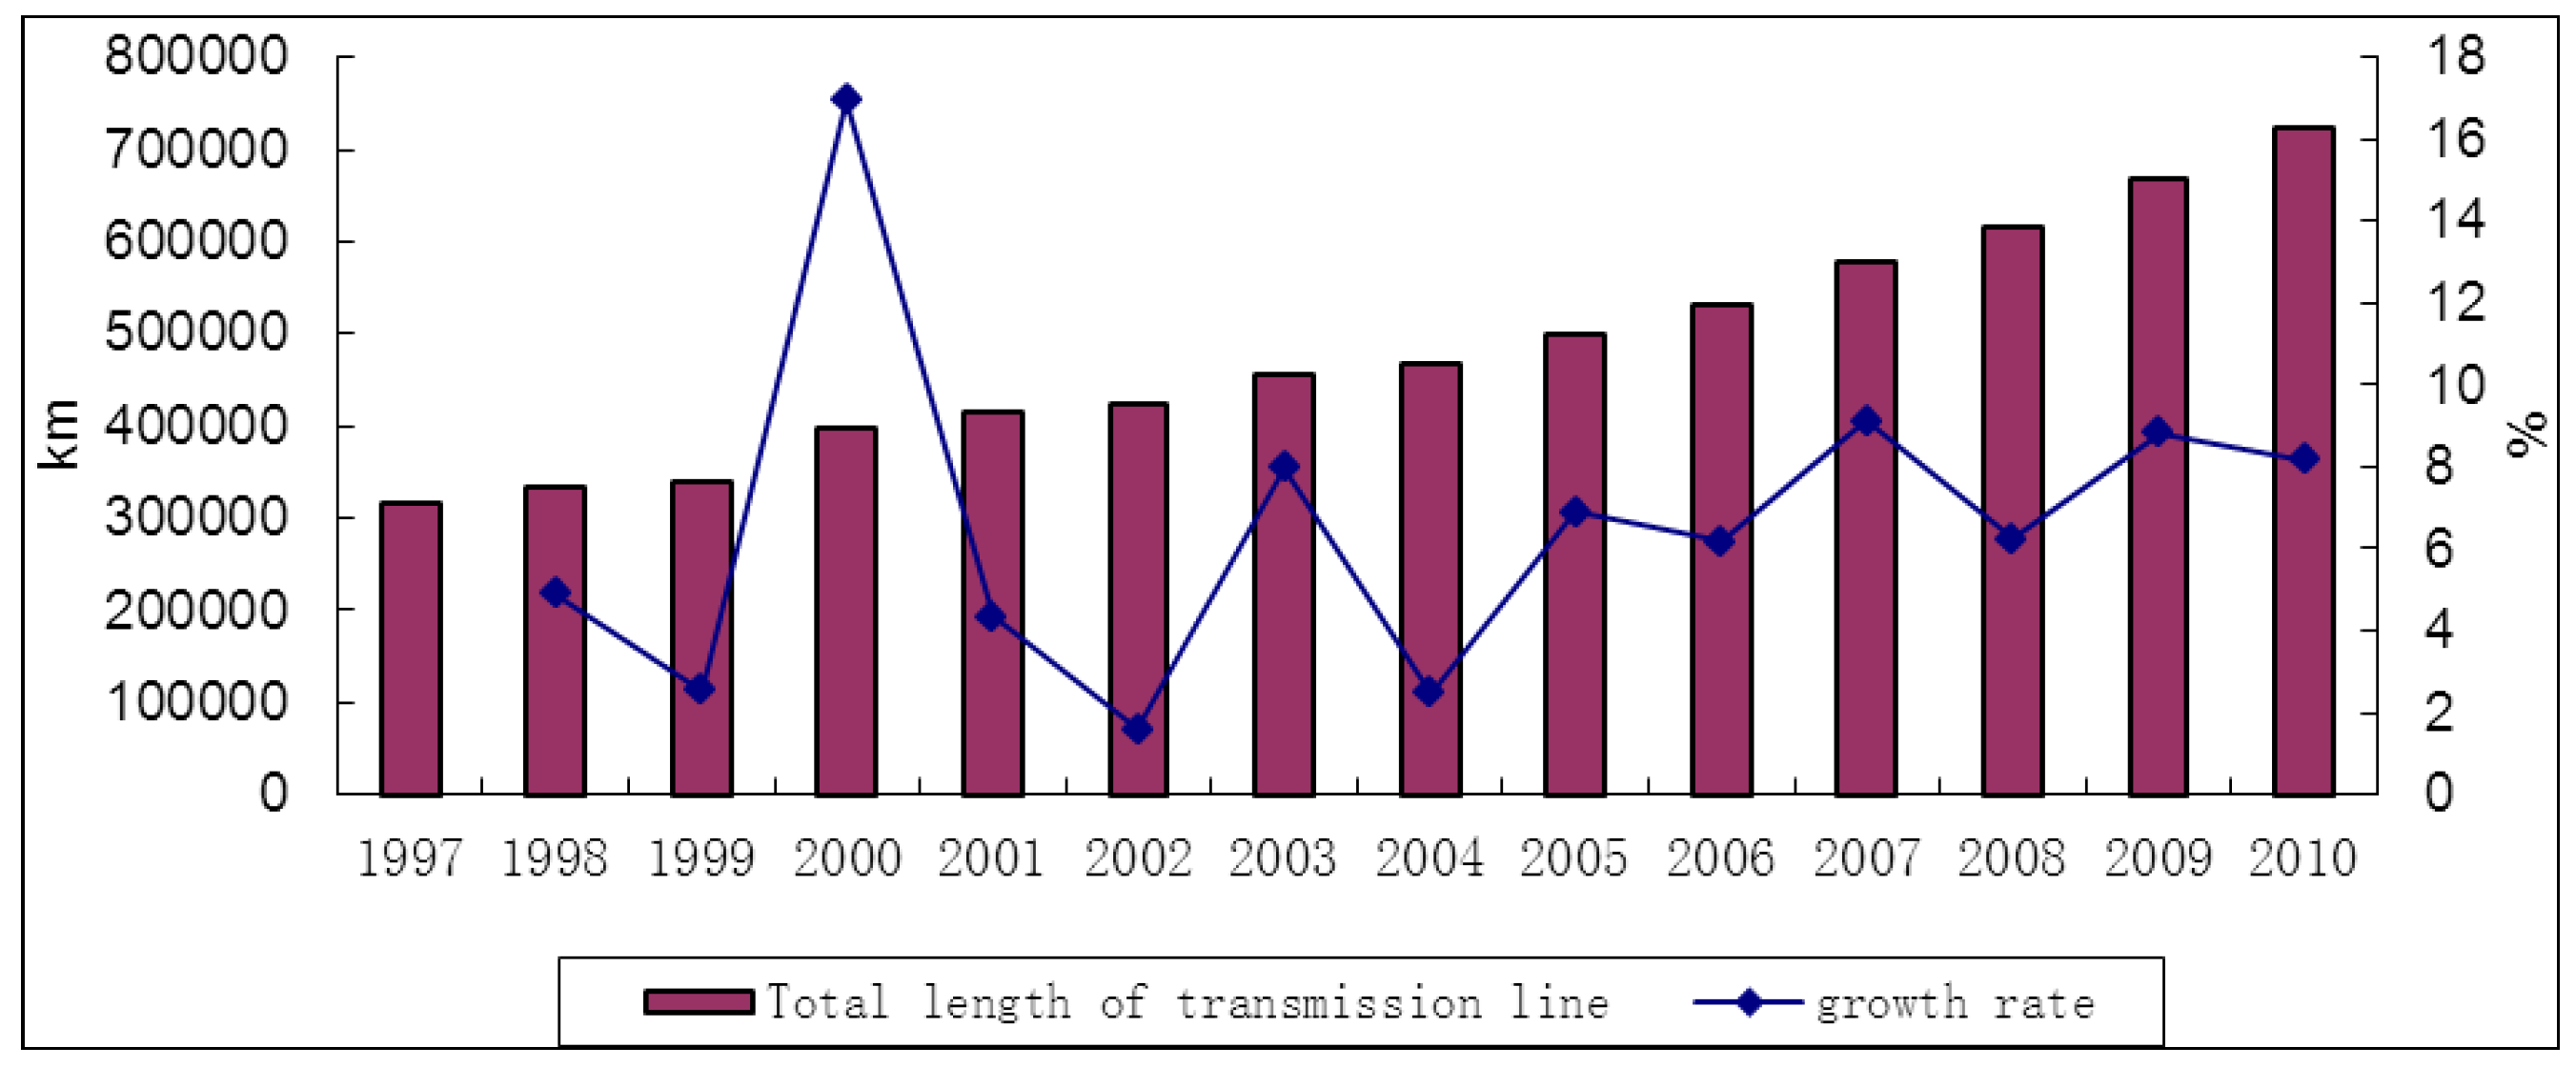
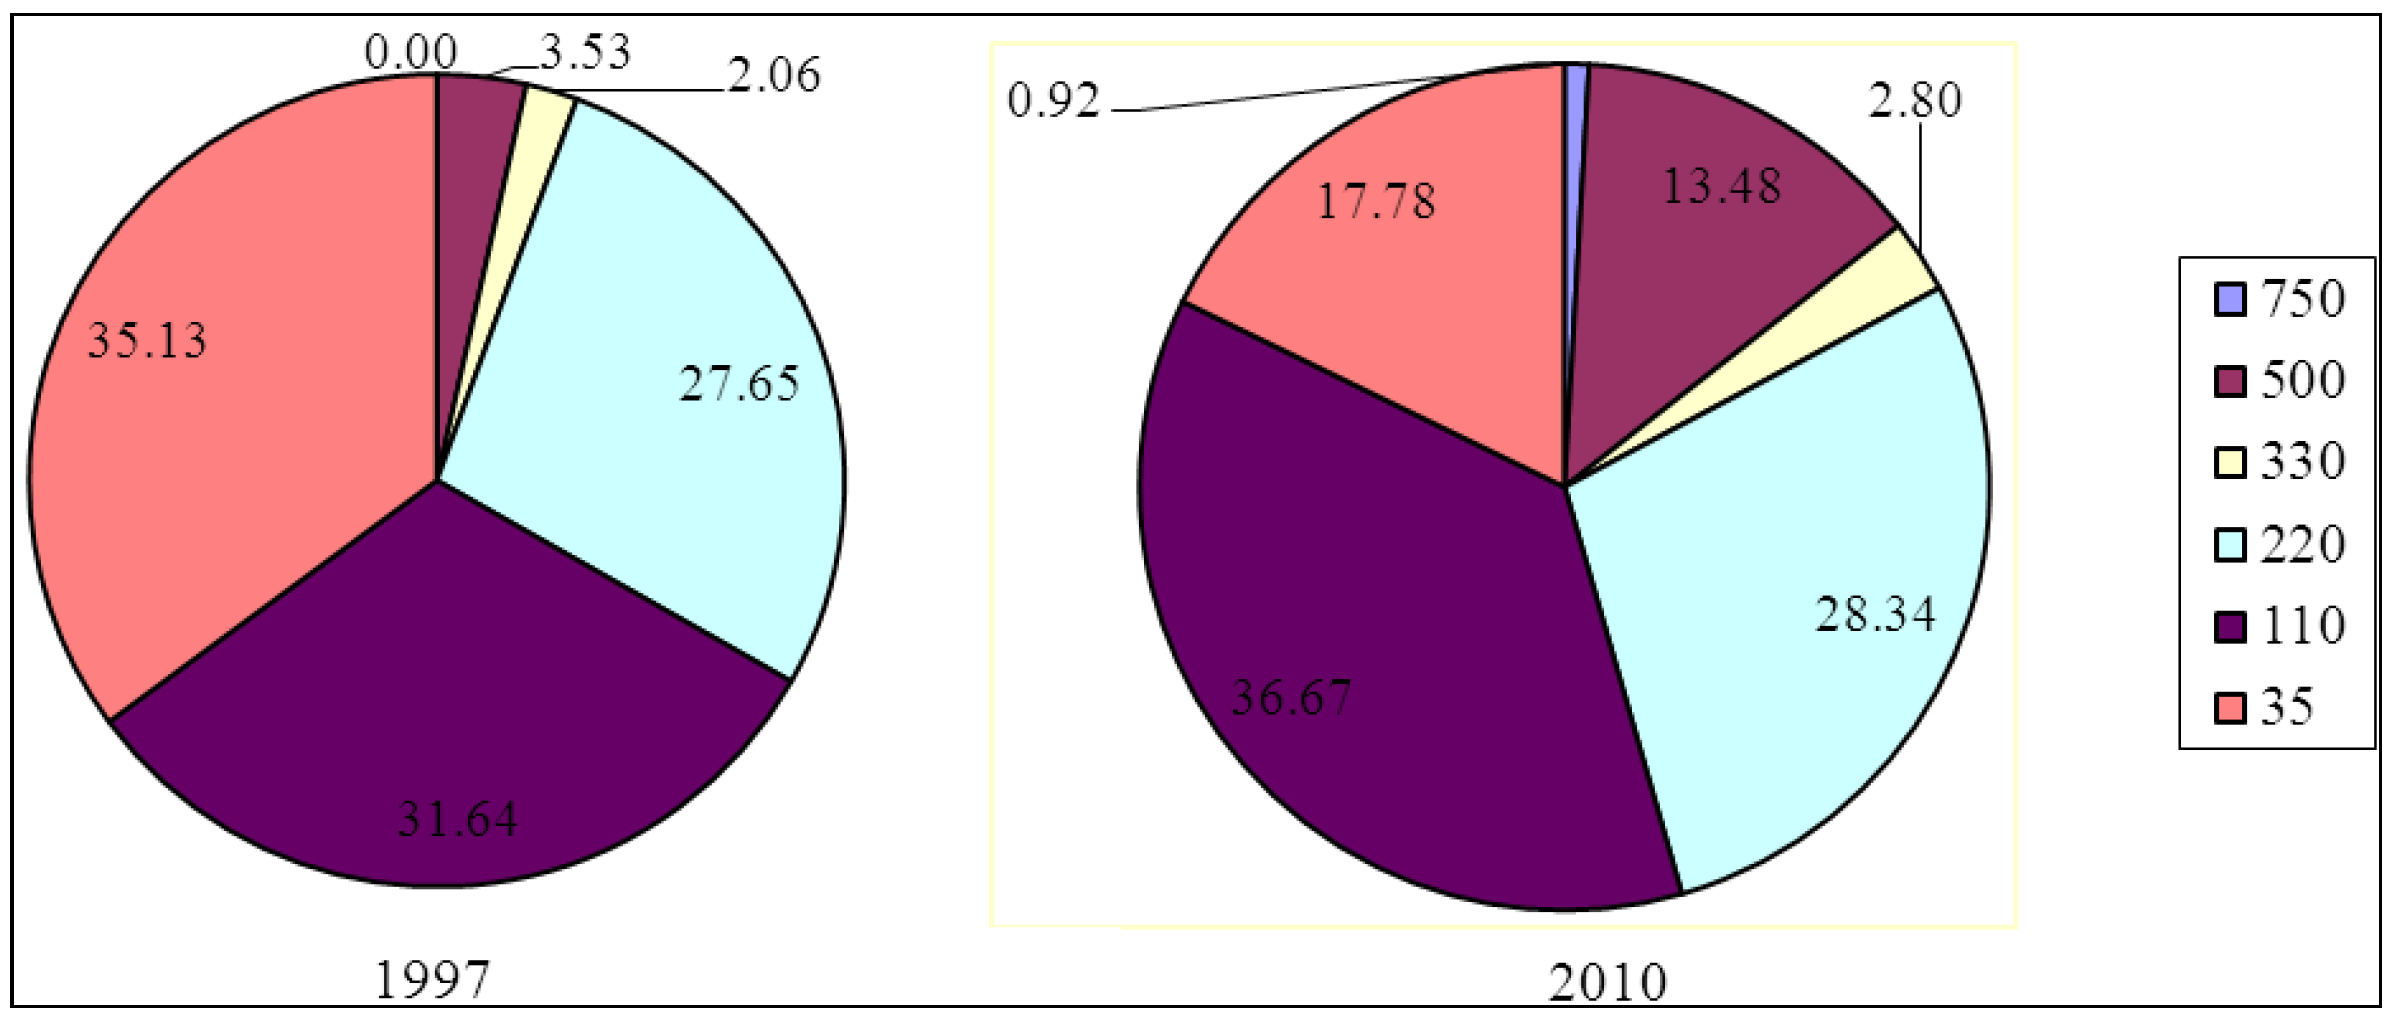
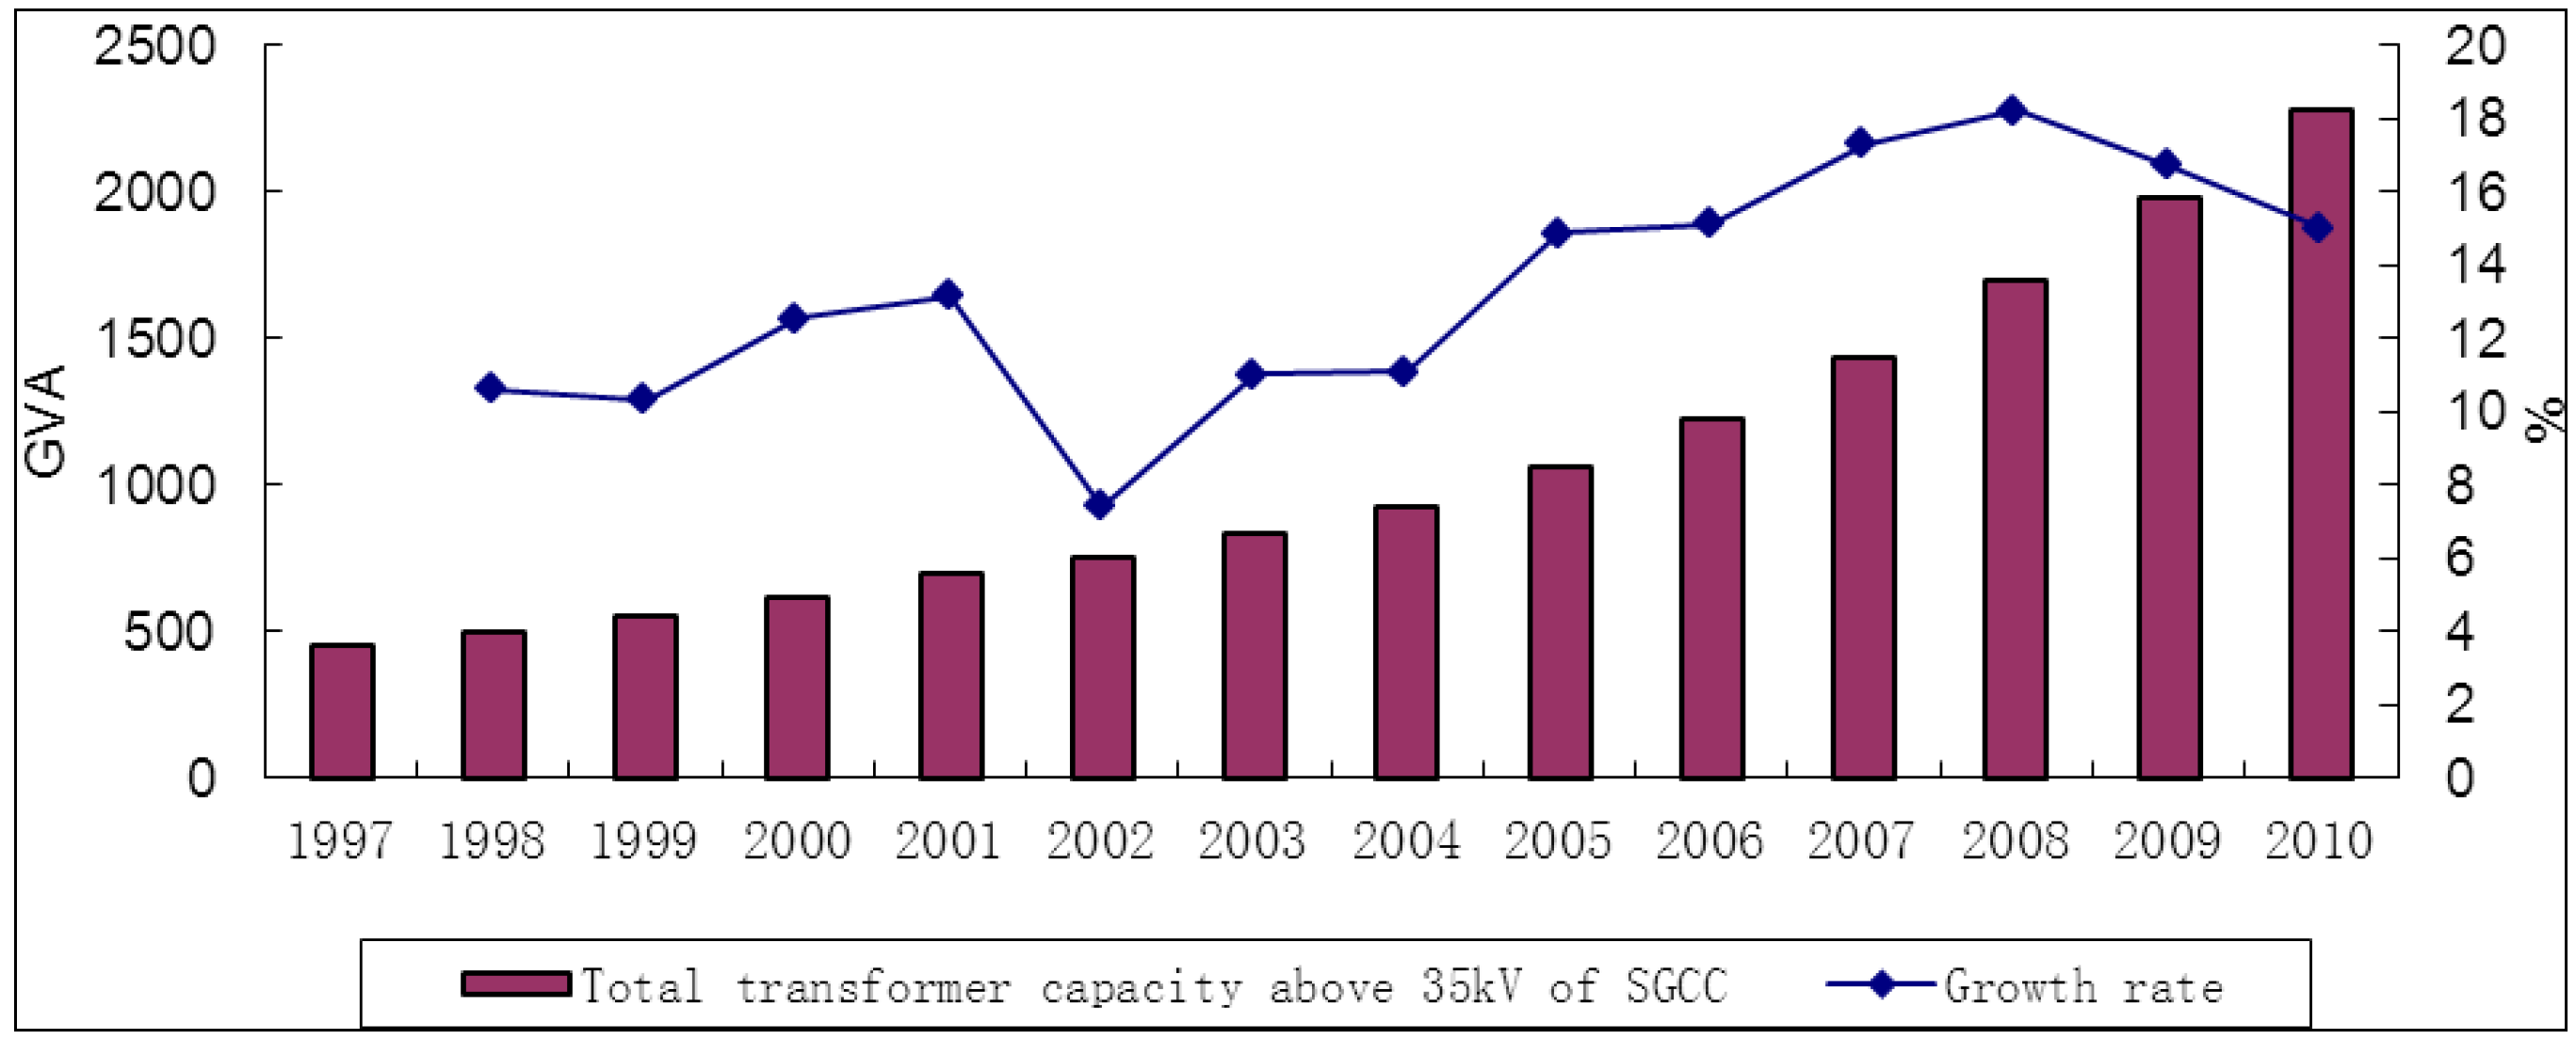
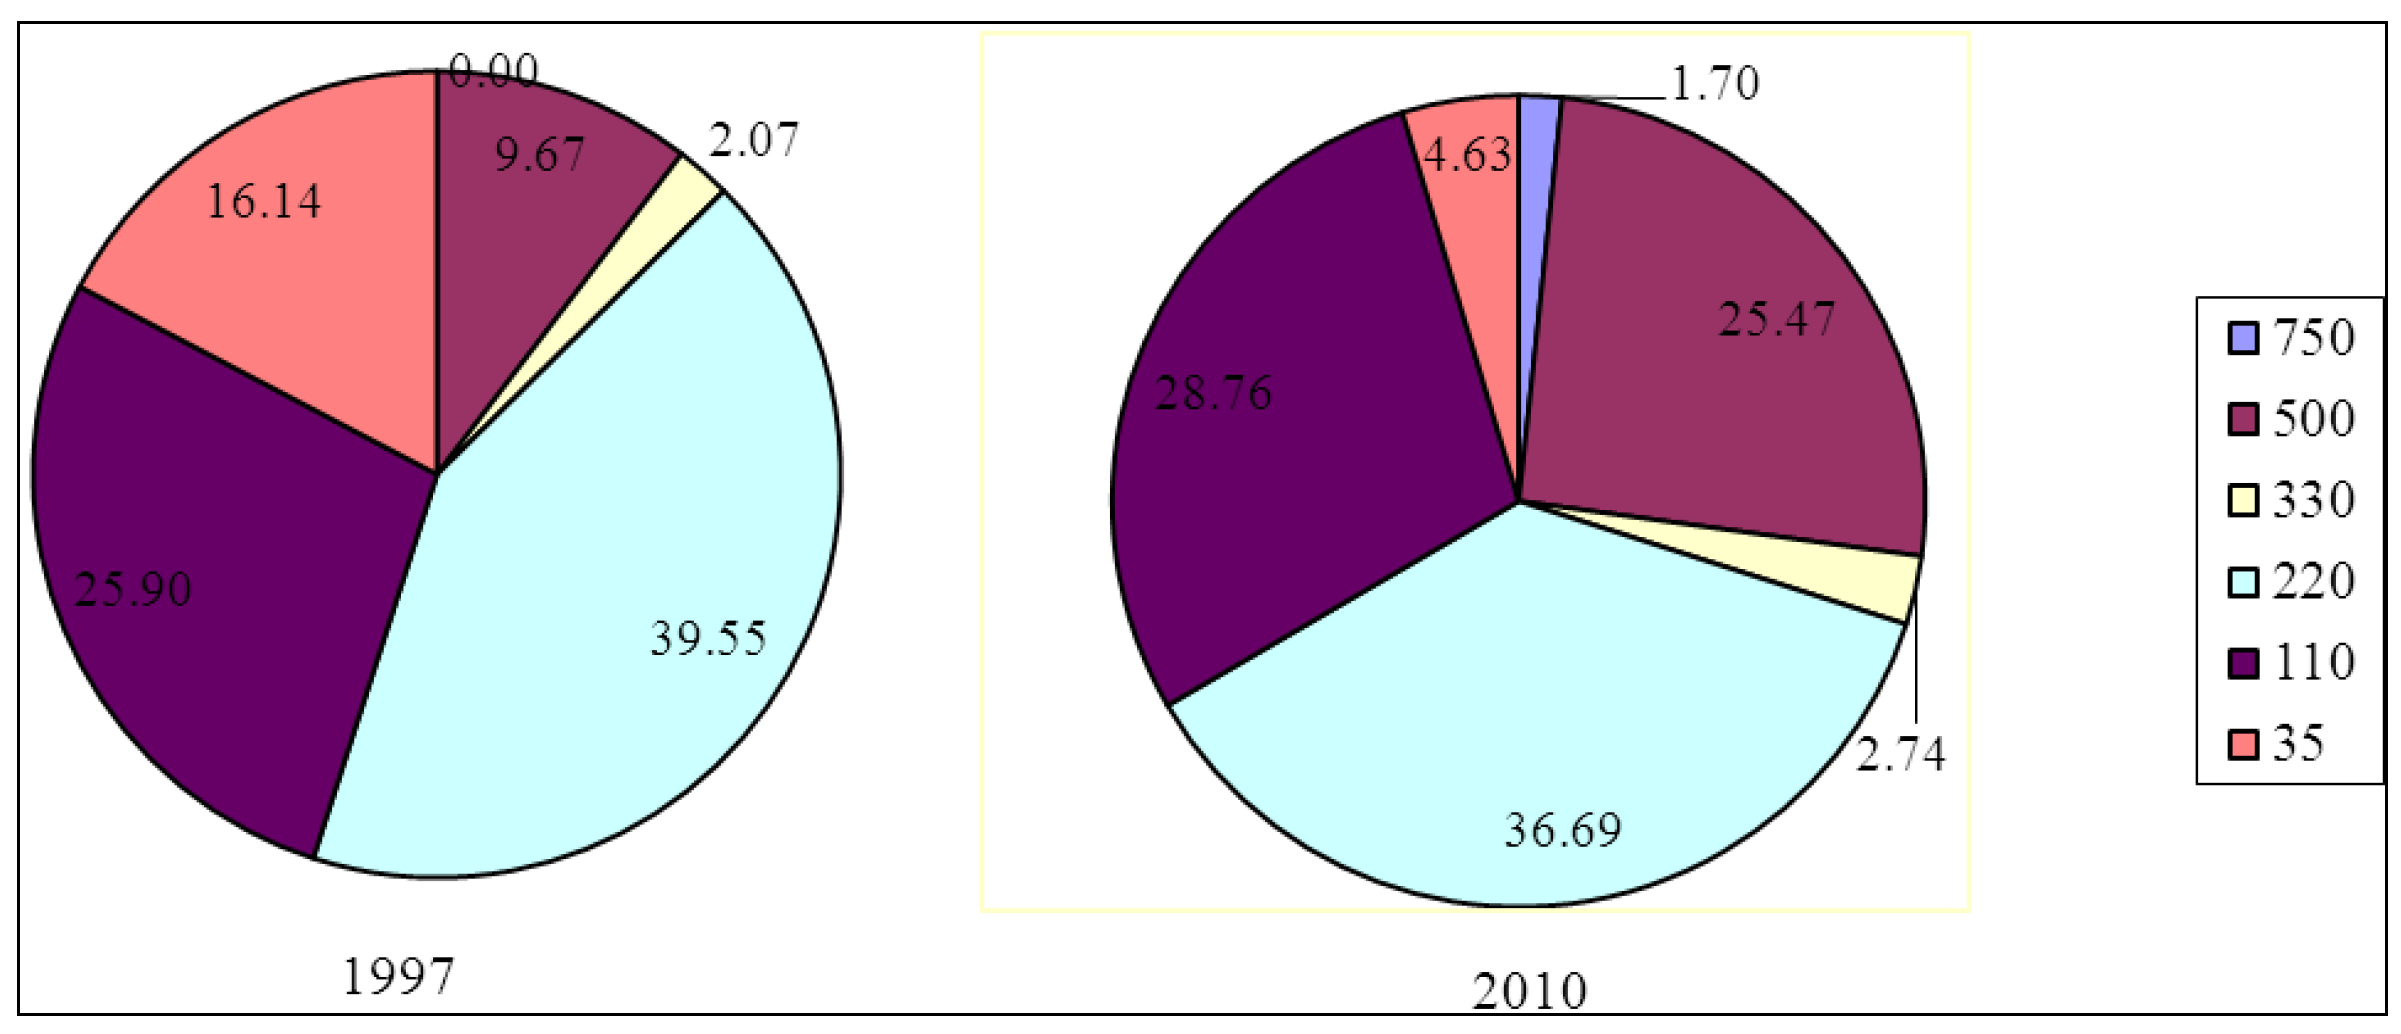
2. The Current Structure of the Electric Power Supply Industry in China


3. Literature Survey

| Author(s) | Data | Inputs | Outputs | Sources | Methods | |
|---|---|---|---|---|---|---|
| Abbott (2006) [13] | Australia’s electricity supply industry in 1969–1999 | Capital stock | Electricity consumed | Energy Economics | DEA | |
| Energy used (in TJ) | ||||||
| Labor employed | ||||||
| Wang et al. (2007) [14] | Hong Kong electricity supply industry in 1978–2003 | Capital expenditure | Sales of electricity delivered | Energy Policy | Malmquist index | |
| Labor | Customer density (customer/km2) | |||||
| Vinod Kumar Yadav, N.P. Padhy, H.O. Gupta (2010) [15] | 29 Electricity Distribution Divisions Uttarakhand | Operation & Maintenance Cost (Rs Million) | Energy sold (Million Units) | Energy | DEA | |
| Number of customers | ||||||
| Average duration of interruption (Hours) | ||||||
| Number of employees | ||||||
| Distribution line length (Circuit kilometer) | ||||||
| Transformer capacity | ||||||
| Dag Fjeld Edvardsen, Finn R. Førsund (2003) [16] | Denmark, Finland, Norway, Sweden and The Netherlands in 1997 | Total operating and maintenance costs | Number of customers | Resource and Energy Economics | DEA; Malmquist productivity index | |
| the loss in MWh | Total lines | |||||
| the replacement value | Energy delivered | |||||
| Kaoru Tonea, Miki Tsutsui (2007) [17] | Japanese-US electric utility | generation capacity | Net electricity power sales | Socio-Economic Planning Sciences | DEA | |
| transmission line length | ||||||
| distribution transformer capacity | ||||||
| index of capital stock | ||||||
| total cost for capital input | ||||||
| total number of employees | ||||||
| fuel data | ||||||
| A.Azadeh, S.F.Ghaderi, H.Omrani, H.Eivazy (2009) [18] | 38 electricity distribution units in Iran | Network length (km) | Number of customers | Energy policy | DEA-COLS-SFA | |
| Transformers capacity (MWA) | ||||||
| Total electricity sales | ||||||
| Number of employees | ||||||
| Vinod KumarYadav, N.P.Padhy, H.O.Gupta (2011) [19] | 29 Electricity Distribution Divisions of an Indian state–Uttarakhand | O & M cost | Energy sold (MillionUnit) | Energy Policy | DEA | |
| Number of customers | ||||||
| Duration of interruption/feeder | ||||||
| Number of employees | ||||||
| Carlos Pombo, Rodrigo Taborda [20] | 12 distribution companies from 1985 to 2001 of Colombia | Employees in power distribution + commercialization | Total sales (GWh) | Energy Economics | DEA | |
| Number of transformers + substations | Total customers | |||||
| Power lines network (km) | Urban area served | |||||
| Regional GDP per capita | ||||||
| National installed capacity in electricity generation | ||||||
| Marcos Pereira Estellita Lins, Maria Karla Vervloet Sollero, Guilherme Marques Caloba, Angela Cristina Moreira da Silva (2007) [21] | Brazilian electricity sector | Operational cost | Number of Consumers | European Journal of Operational Research | DEA | |
| Number of employees | ||||||
| Losses | Delivered energy | |||||
| System Average Interruption | ||||||
| Duration Index | Service Area | |||||
| Network size |
4. Model Descriptions
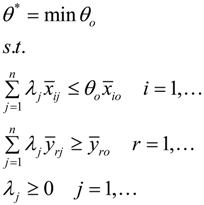
4.1. Data Envelopment Analysis
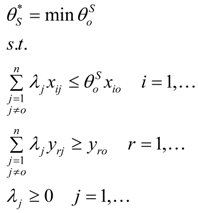
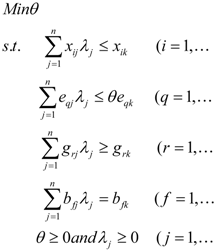
4.2. Super-Efficiency DEA (SDEA) Model
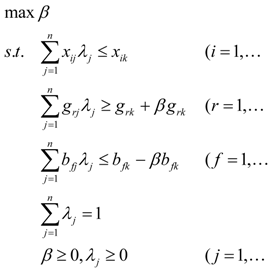
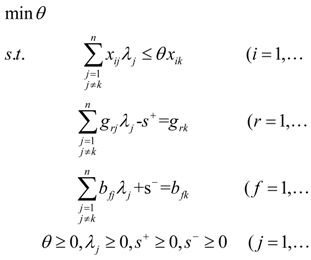
4.3. Unified Efficiency DEA Model


4.4. The Unified Super DEA Model
5. The Unified Efficiency of Chinese Electric Power Supply Companies
5.1. The Efficiency Analysis Indexes of the Electric Power Supply Company
- Input1 (x1): network length above 35 kV (km)
- Input2 (x2): transformers capacity above 35 kV (MVA)
- Input3 (x3): number of employees
- Input4 (x4): cost of the main business (104 RMB)
- Economic variables:
- Output1 (y1): Electric power supply amount (108 kWh)
- Social variables:
- Output2 (y2): Power supply reliability (%)
- Output3 (y3): The quality of the voltage (%)
- Environmental variables
- Output4 (y4): Line loss (%)
5.2. Data Collection
| Input or Output | x1 | x2 | x3 | x4 | y1 | y2 | y3 | y4 | |
|---|---|---|---|---|---|---|---|---|---|
| Statistics | Year | km | MVA | person | 104 RMB | 108 kWh | % | % | % |
| Avg. | 2003 | 17,988.21 | 32,585,447.29 | 27,882 | 1,852,066.5 | 494.28 | 99.85 | 98.923 | 7.33 |
| 2005 | 18,660.04 | 38,841,223.33 | 26,873 | 2,713,685.1 | 636.94 | 99.92 | 99.357 | 6.99 | |
| 2008 | 21,619.95 | 54,380,961.41 | 30,823 | 4,356,075.8 | 896.08 | 99.86 | 99.094 | 6.71 | |
| 2010 | 23,331.50 | 63,781,929.07 | 31,420 | 5,827,761.3 | 1,132.99 | 99.94 | 99.145 | 6.46 | |
| Max. | 2003 | 30,032.00 | 81,142,925 | 57,890 | 5,070,172.0 | 1,186.20 | 99.99 | 99.750 | 9.68 |
| 2005 | 32,498.00 | 101,646,300 | 53,975 | 8,429,622.0 | 1,700.44 | 99.99 | 99.910 | 9.82 | |
| 2008 | 42,296.60 | 148,898,407 | 50,000 | 12,854,647.3 | 2,467.00 | 99.98 | 99.726 | 9.64 | |
| 2010 | 48,378.20 | 179,084,565 | 58,569 | 16,960,404.0 | 3,117.35 | 99.99 | 99.771 | 10.03 | |
| Min. | 2003 | 5,623.00 | 6,199,795 | 7,775 | 357,199.0 | 129.06 | 99.29 | 97.960 | 5.00 |
| 2005 | 6,090.00 | 8,266,095 | 7,590 | 510,641.0 | 170.04 | 99.65 | 98.807 | 4.80 | |
| 2008 | 6,734.60 | 15,712,429.5 | 8,553 | 843,629.9 | 270.00 | 99.54 | 98.276 | 3.96 | |
| 2010 | 7,085.80 | 18,310,338.5 | 8,638 | 1,361,123.0 | 380.60 | 99.85 | 98.336 | 3.65 | |
| S.D. | 2003 | 7,943.12 | 19,174,585.21 | 13,162 | 1,258,966.1 | 303.92 | 0.18 | 0.414 | 1.29 |
| 2005 | 8,174.88 | 25,411,117.08 | 13,041 | 1,943,449.3 | 419.35 | 0.09 | 0.327 | 1.32 | |
| 2008 | 10,071.58 | 36,669,123.61 | 12,460 | 2,977,477.4 | 612.86 | 0.09 | 0.430 | 1.38 | |
| 2010 | 11,409.58 | 44,375,521.66 | 13,421 | 4,025,598.2 | 783.34 | 0.04 | 0.426 | 1.50 | |
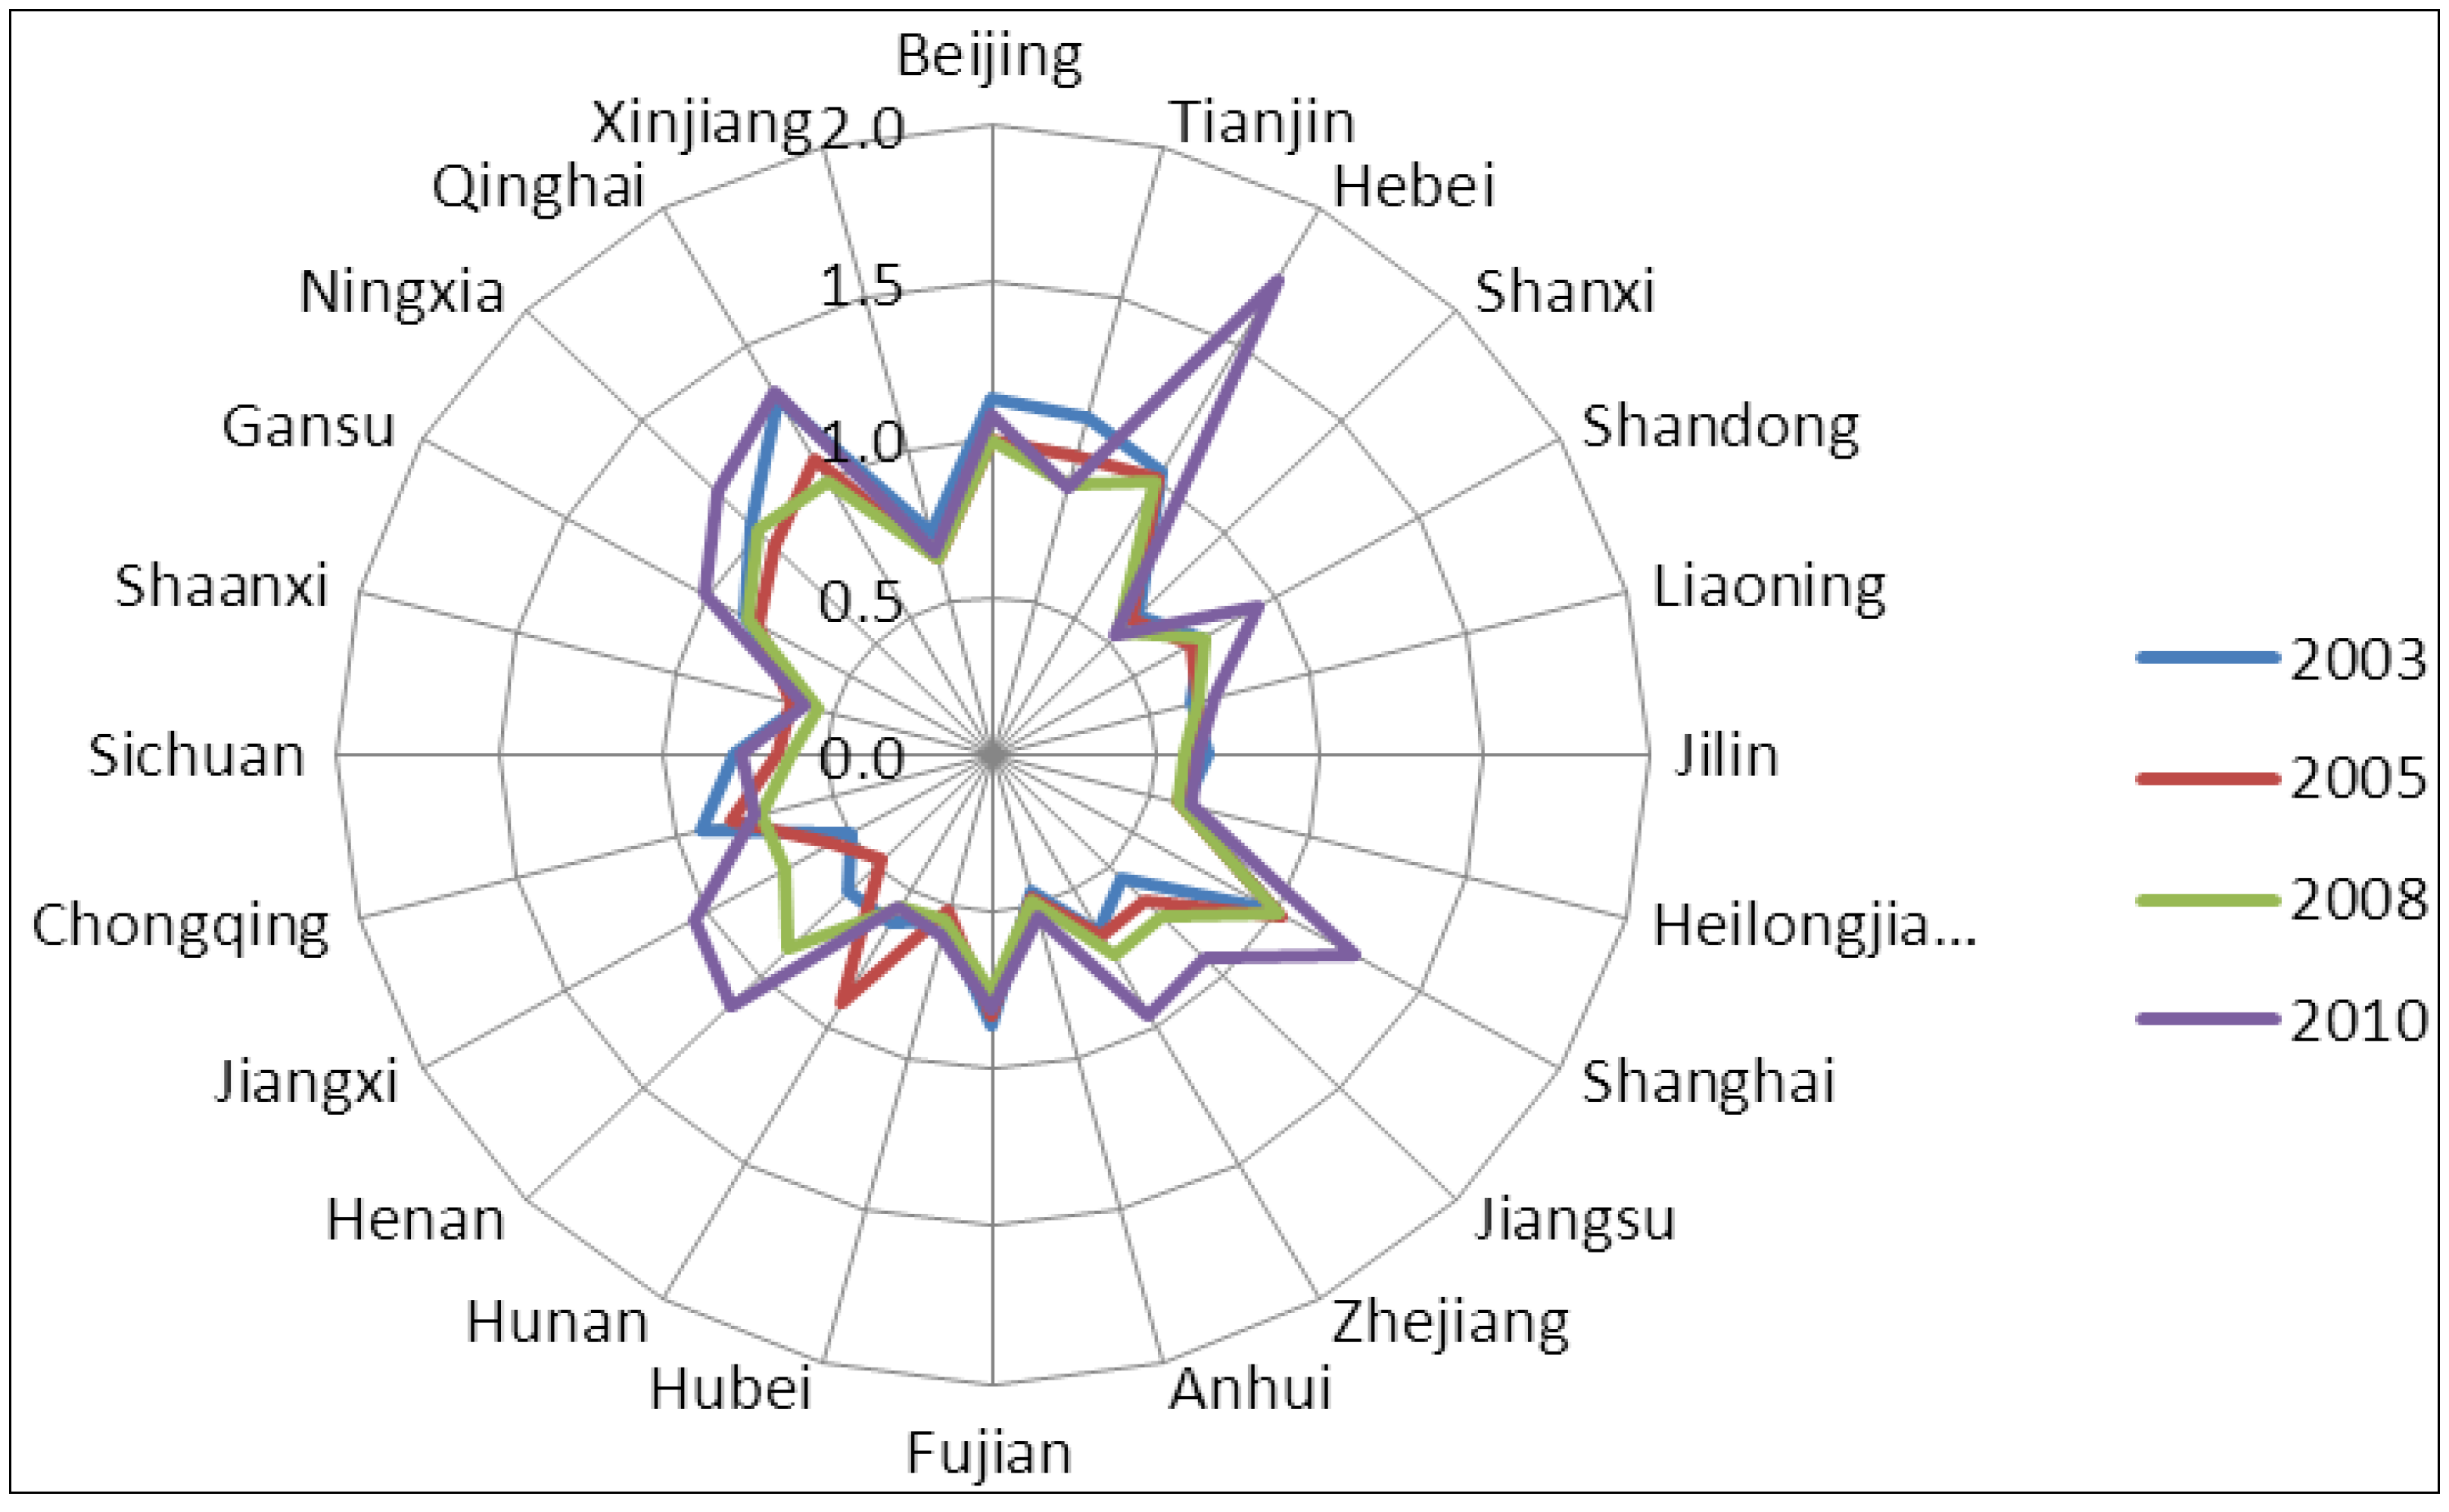
5.3. The Unified Efficiency of 24 Electric Power Supply Subsidiary Companies of SGCC
| Firm | 2003 | 2004 | 2005 | 2006 | 2007 | 2008 | 2009 | 2010 | Average | S.D. | Ranking |
|---|---|---|---|---|---|---|---|---|---|---|---|
| Beijing | 1.131 | 0.975 | 0.997 | 1.091 | 1.003 | 1.002 | 0.996 | 1.083 | 1.035 | 0.058 | 5 |
| Tianjin | 1.110 | 0.951 | 0.982 | 0.943 | 0.899 | 0.887 | 0.867 | 0.878 | 0.940 | 0.080 | 6 |
| Hebei | 1.031 | 1.021 | 1.013 | 1.017 | 1.029 | 0.998 | 1.020 | 1.735 | 1.108 | 0.254 | 2 |
| Shanxi | 0.625 | 0.621 | 0.601 | 0.573 | 0.586 | 0.548 | 0.502 | 0.533 | 0.574 | 0.043 | 22 |
| Shandong | 0.731 | 0.701 | 0.704 | 0.696 | 0.779 | 0.743 | 0.743 | 0.930 | 0.753 | 0.077 | 11 |
| Liaoning | 0.624 | 0.650 | 0.650 | 0.658 | 0.664 | 0.650 | 0.637 | 0.700 | 0.654 | 0.022 | 16 |
| Jilin | 0.657 | 0.625 | 0.613 | 0.592 | 0.575 | 0.586 | 0.582 | 0.626 | 0.607 | 0.028 | 19 |
| Heilongjiang | 0.610 | 0.590 | 0.590 | 0.588 | 0.563 | 0.589 | 0.596 | 0.631 | 0.594 | 0.020 | 20 |
| Shanghai | 0.991 | 1.030 | 1.022 | 1.014 | 1.023 | 1.009 | 0.994 | 1.272 | 1.045 | 0.093 | 4 |
| Jiangsu | 0.562 | 0.685 | 0.651 | 0.658 | 0.661 | 0.726 | 0.724 | 0.913 | 0.698 | 0.101 | 13 |
| Zhejiang | 0.648 | 0.638 | 0.665 | 0.707 | 0.688 | 0.737 | 0.808 | 0.957 | 0.731 | 0.106 | 12 |
| Anhui | 0.445 | 0.463 | 0.468 | 0.460 | 0.452 | 0.479 | 0.489 | 0.531 | 0.473 | 0.027 | 24 |
| Fujian | 0.859 | 0.863 | 0.831 | 0.817 | 0.775 | 0.763 | 0.764 | 0.807 | 0.810 | 0.040 | 8 |
| Hubei | 0.547 | 0.534 | 0.513 | 0.531 | 0.509 | 0.544 | 0.554 | 0.599 | 0.541 | 0.028 | 23 |
| Hunan | 0.618 | 0.637 | 0.910 | 0.573 | 0.566 | 0.556 | 0.544 | 0.565 | 0.621 | 0.121 | 18 |
| Henan | 0.618 | 0.613 | 0.477 | 0.737 | 0.779 | 0.873 | 0.922 | 1.126 | 0.768 | 0.205 | 10 |
| Jiangxi | 0.501 | 0.591 | 0.562 | 0.542 | 0.551 | 0.724 | 0.831 | 1.045 | 0.668 | 0.188 | 14 |
| Chongqing | 0.920 | 0.941 | 0.826 | 0.758 | 0.719 | 0.733 | 0.715 | 0.752 | 0.795 | 0.090 | 9 |
| Sichuan | 0.789 | 0.665 | 0.651 | 0.598 | 0.524 | 0.611 | 0.629 | 0.761 | 0.654 | 0.086 | 17 |
| Shaanxi | 0.605 | 0.598 | 0.630 | 0.574 | 0.549 | 0.544 | 0.546 | 0.590 | 0.580 | 0.032 | 21 |
| Gansu | 0.871 | 0.783 | 0.828 | 0.802 | 0.810 | 0.859 | 0.895 | 1.015 | 0.858 | 0.074 | 7 |
| Ningxia | 1.043 | 0.960 | 0.939 | 1.338 | 1.103 | 1.004 | 0.993 | 1.181 | 1.070 | 0.134 | 3 |
| Qinghai | 1.304 | 1.030 | 1.084 | 1.005 | 1.267 | 1.005 | 1.281 | 1.333 | 1.164 | 0.145 | 1 |
| Xinjiang | 0.729 | 0.660 | 0.648 | 0.671 | 0.658 | 0.649 | 0.653 | 0.663 | 0.666 | 0.026 | 15 |
| Firm | 2003 | 2004 | 2005 | 2006 | 2007 | 2008 | 2009 | 2010 | Average | S.D. | Ranking |
|---|---|---|---|---|---|---|---|---|---|---|---|
| Beijing | 0.816 | 0.763 | 0.758 | 0.808 | 0.745 | 0.773 | 0.799 | 0.866 | 0.791 | 0.039 | 4 |
| Tianjin | 0.556 | 0.528 | 0.516 | 0.552 | 0.572 | 0.574 | 0.575 | 0.631 | 0.563 | 0.035 | 20 |
| Hebei | 1.010 | 1.021 | 1.013 | 1.008 | 1.019 | 0.993 | 1.014 | 1.149 | 1.028 | 0.049 | 1 |
| Shanxi | 0.600 | 0.613 | 0.601 | 0.573 | 0.586 | 0.548 | 0.502 | 0.533 | 0.569 | 0.039 | 19 |
| Shandong | 0.705 | 0.667 | 0.675 | 0.661 | 0.751 | 0.723 | 0.726 | 0.855 | 0.720 | 0.063 | 8 |
| Liaoning | 0.624 | 0.650 | 0.650 | 0.658 | 0.664 | 0.650 | 0.635 | 0.694 | 0.653 | 0.021 | 10 |
| Jilin | 0.614 | 0.603 | 0.594 | 0.579 | 0.566 | 0.584 | 0.581 | 0.626 | 0.594 | 0.020 | 15 |
| Heilongjiang | 0.573 | 0.570 | 0.581 | 0.588 | 0.563 | 0.589 | 0.596 | 0.631 | 0.586 | 0.021 | 17 |
| Shanghai | 0.807 | 0.880 | 0.920 | 0.923 | 0.943 | 0.949 | 0.954 | 1.117 | 0.936 | 0.087 | 2 |
| Jiangsu | 0.559 | 0.675 | 0.632 | 0.645 | 0.658 | 0.659 | 0.689 | 0.812 | 0.666 | 0.071 | 9 |
| Zhejiang | 0.596 | 0.565 | 0.580 | 0.610 | 0.663 | 0.642 | 0.667 | 0.772 | 0.637 | 0.066 | 13 |
| Anhui | 0.413 | 0.448 | 0.457 | 0.460 | 0.451 | 0.471 | 0.481 | 0.519 | 0.463 | 0.030 | 24 |
| Fujian | 0.657 | 0.664 | 0.618 | 0.617 | 0.591 | 0.637 | 0.660 | 0.727 | 0.646 | 0.041 | 12 |
| Hubei | 0.511 | 0.520 | 0.508 | 0.531 | 0.509 | 0.541 | 0.550 | 0.597 | 0.534 | 0.030 | 22 |
| Hunan | 0.577 | 0.611 | 0.910 | 0.564 | 0.554 | 0.556 | 0.544 | 0.564 | 0.610 | 0.123 | 14 |
| Henan | 0.606 | 0.605 | 0.452 | 0.737 | 0.778 | 0.871 | 0.918 | 1.080 | 0.756 | 0.201 | 6 |
| Jiangxi | 0.450 | 0.486 | 0.458 | 0.470 | 0.493 | 0.545 | 0.587 | 0.742 | 0.529 | 0.098 | 23 |
| Chongqing | 0.763 | 0.618 | 0.563 | 0.524 | 0.513 | 0.518 | 0.510 | 0.562 | 0.571 | 0.086 | 18 |
| Sichuan | 0.771 | 0.665 | 0.651 | 0.598 | 0.524 | 0.611 | 0.629 | 0.761 | 0.651 | 0.083 | 11 |
| Shaanxi | 0.554 | 0.562 | 0.608 | 0.558 | 0.536 | 0.544 | 0.546 | 0.590 | 0.562 | 0.025 | 21 |
| Gansu | 0.788 | 0.722 | 0.805 | 0.785 | 0.810 | 0.828 | 0.846 | 0.949 | 0.817 | 0.065 | 3 |
| Ningxia | 0.748 | 0.743 | 0.691 | 1.096 | 0.705 | 0.740 | 0.690 | 0.769 | 0.773 | 0.134 | 5 |
| Qinghai | 0.781 | 0.813 | 0.762 | 0.683 | 0.744 | 0.668 | 0.677 | 0.752 | 0.735 | 0.053 | 7 |
| Xinjiang | 0.543 | 0.534 | 0.539 | 0.585 | 0.595 | 0.616 | 0.633 | 0.663 | 0.588 | 0.048 | 16 |
6. Conclusions
Acknowledgments
Author Contributions
Conflicts of Interest
References
- Charnes, A.; Cooper, W.W.; Rhodes, E. Measuring the efficiency of decision making units. Eur. J. Oper. Res. 1978, 2, 429–444. [Google Scholar] [CrossRef]
- Bagdadioglu, N.; Price, C.M.W.; Weyman-Jones, T.G. Efficiency and ownership in electricity distribution: A nonparametric model of the Turkish experience. Energy Econ. 1996, 18, 1–23. [Google Scholar] [CrossRef]
- Hjalmarsson, L.; Veiderpass, A. Productivity in Swedish electricity retail distribution. J. Econ. 1992, 94, 193–205. [Google Scholar]
- Zhang, Y.; Bartels, B. The effect of sample size on the mean efficiency in DEA with an application to electricity distribution in Australia, Sweden and New Zealand. J. Prod. Anal. 1998, 9, 187–204. [Google Scholar] [CrossRef]
- Pacudan, R.; de Guzman, E. Impact of energy efficiency policy to productive efficiency of electricity distribution industry in the Philippines. Energy Econ. 2002, 24, 41–54. [Google Scholar] [CrossRef]
- Giannakis, D.; Jamasb, T.; Pollitt, M. Benchmarking and incentive regulation of quality of service: An application to the UK electricity distribution networks. Energ. Policy 2005, 33, 2256–2271. [Google Scholar] [CrossRef]
- Chien, C.F.; Lo, F.Y.; Lin, J.T. Using DEA to measure the relative efficiency of the service center and improve operation efficiency through reorganization. IEEE. T. Power Syst. 2003, 18, 366–373. [Google Scholar]
- Agrell, P.J.; Bogetoft, P. Economic and environmental efficiency of district heating plants. Energ. Policy 2005, 33, 1351–1362. [Google Scholar] [CrossRef]
- Weyman-Jones, T.G. Productive efficiency in a regulated industry: The area electricity boards of England and Wales. Energy Econ. 1991, 13, 116–122. [Google Scholar] [CrossRef]
- Perez-Reyes, R.; Tovar, B. Measuring efficiency and productivity change (PTF) in the Peruvian electricity distribution companies after reforms. Energ. Policy 2009, 37, 2249–2261. [Google Scholar]
- Ramos-Real, F.J.; Tovar, B.; Iootty, M.; de Almeida, E.F.; Pinto, H.Q., Jr. The evolution and main determinants of productivity in Brazilian electricity distribution 1998–2005: An empirical analysis. Energy Econ. 2009, 31, 298–305. [Google Scholar]
- Jamasb, T.; Pollitt, M. International benchmarking and regulation: An application to European electricity distribution utilities. Energ. Policy 2003, 31, 1609–1622. [Google Scholar]
- Abbott, M. The productivity and efficiency of the Australian electricity supply industry. Energy Econ. 2006, 28, 444–454. [Google Scholar]
- Wang, J.H.; Ngan, H.W.; Engriwan, W.; Lo, K.L. Performance based regulation of the electricity supply industry in Hong Kong: An empirical efficiency analysis approach. Energ. Policy 2007, 35, 609–615. [Google Scholar] [CrossRef]
- Yadav, V.K.; Padhy, N.P.; Gupta, H.O. A micro level study of an Indian electric utility for efficiency enhancement. Energy 2010, 35, 4053–4063. [Google Scholar] [CrossRef]
- Edvardsen, D.F.; Forsund, F.R. International benchmarking of electricity distribution utilities. Res. Energy Econ. 2003, 25, 353–371. [Google Scholar] [CrossRef]
- Tone, K.; Tsutsui, M. Decomposition of cost efficiency and its application to Japanese-US electric utility comparisons. Socioecon. Plann. Sci. 2007, 41, 91–106. [Google Scholar] [CrossRef]
- Azadeh, A.; Ghaderi, S.F.; Omrani, H.; Eivazy, H. An integrated DEA–COLS–SFA algorithm for optimization and policy making of electricity distribution units. Energ. Policy 2009, 37, 2605–2618. [Google Scholar] [CrossRef]
- Yadav, V.K.; Padhy, N.P.; Gupta, H.O. Performance Evaluation and Improvement Directions for an Indian Electric Utility. Energ. Policy 2011, 39, 7112–7120. [Google Scholar] [CrossRef]
- Pombo, C.; Taborda, R. Performance and efficiency in Colombia's power distribution system: Effects of the 1994 reform. Energy Econ. 2006, 28, 339–369. [Google Scholar] [CrossRef]
- Lins, M.P.E.; Sollero, M.K.V.; Caloba, G.M.; da Silva, A.C.M. Integrating the regulatory and utility firm perspectives, when measuring the efficiency of electricity distribution. Eur. J. Oper. Res. 2007, 181, 1413–1424. [Google Scholar] [CrossRef]
- Lovell, C.A.K.; Schmidt, P. A comparison of alternative approaches to the measurement of productive efficiency. Appl. Mod. Prod. Theor.: Eff. Prod. 1988, 9, 3–32. [Google Scholar]
- Adler, N.; Friedman, L.; Sinuany-Stern, Z. Review of ranking methods in the data envelopment analysis context. Eur. J. Oper. Res. 2002, 140, 249–265. [Google Scholar] [CrossRef]
- Cook, W.D.; Seiford, L.M. Data envelopment analysis (DEA)—Thirty years on. Eur. J. Oper. Res. 2009, 192, 1–17. [Google Scholar] [CrossRef]
- Andersen, P.; Petersen, N.C. A procedure for ranking efficient units in data envelopment analysis. Manage. Sci. 1993, 39, 1261–1264. [Google Scholar] [CrossRef]
- Färe, R.; Grosskopf, S.; Noh, D.; Weber, W. Characteristics of a polluting technology: Theory and practice. J. Econ. 2005, 126, 469–492. [Google Scholar] [CrossRef]
- Mandal, S.K.; Madheswaran, S. Environmental efficiency of the Indian cement industry: An interstate analysis. Energ. Policy 2010, 38, 1108–1118. [Google Scholar] [CrossRef]
- Zhou, P.; Ang, B.W. Linear programming models for measuring economy-wide energy efficiency performance. Energ. Policy 2008, 36, 2911–2916. [Google Scholar] [CrossRef]
© 2014 by the authors; licensee MDPI, Basel, Switzerland. This article is an open access article distributed under the terms and conditions of the Creative Commons Attribution license (http://creativecommons.org/licenses/by/3.0/).
Share and Cite
Li, J.; Li, J.; Zheng, F. Unified Efficiency Measurement of Electric Power Supply Companies in China. Sustainability 2014, 6, 779-793. https://doi.org/10.3390/su6020779
Li J, Li J, Zheng F. Unified Efficiency Measurement of Electric Power Supply Companies in China. Sustainability. 2014; 6(2):779-793. https://doi.org/10.3390/su6020779
Chicago/Turabian StyleLi, Jinchao, Jinying Li, and Fengting Zheng. 2014. "Unified Efficiency Measurement of Electric Power Supply Companies in China" Sustainability 6, no. 2: 779-793. https://doi.org/10.3390/su6020779
APA StyleLi, J., Li, J., & Zheng, F. (2014). Unified Efficiency Measurement of Electric Power Supply Companies in China. Sustainability, 6(2), 779-793. https://doi.org/10.3390/su6020779