Effects of Two Environmental Best Management Practices on Pond Water and Effluent Quality and Growth of Nile Tilapia, Oreochromis niloticus

Abstract
:1. Introduction
2. Experimental
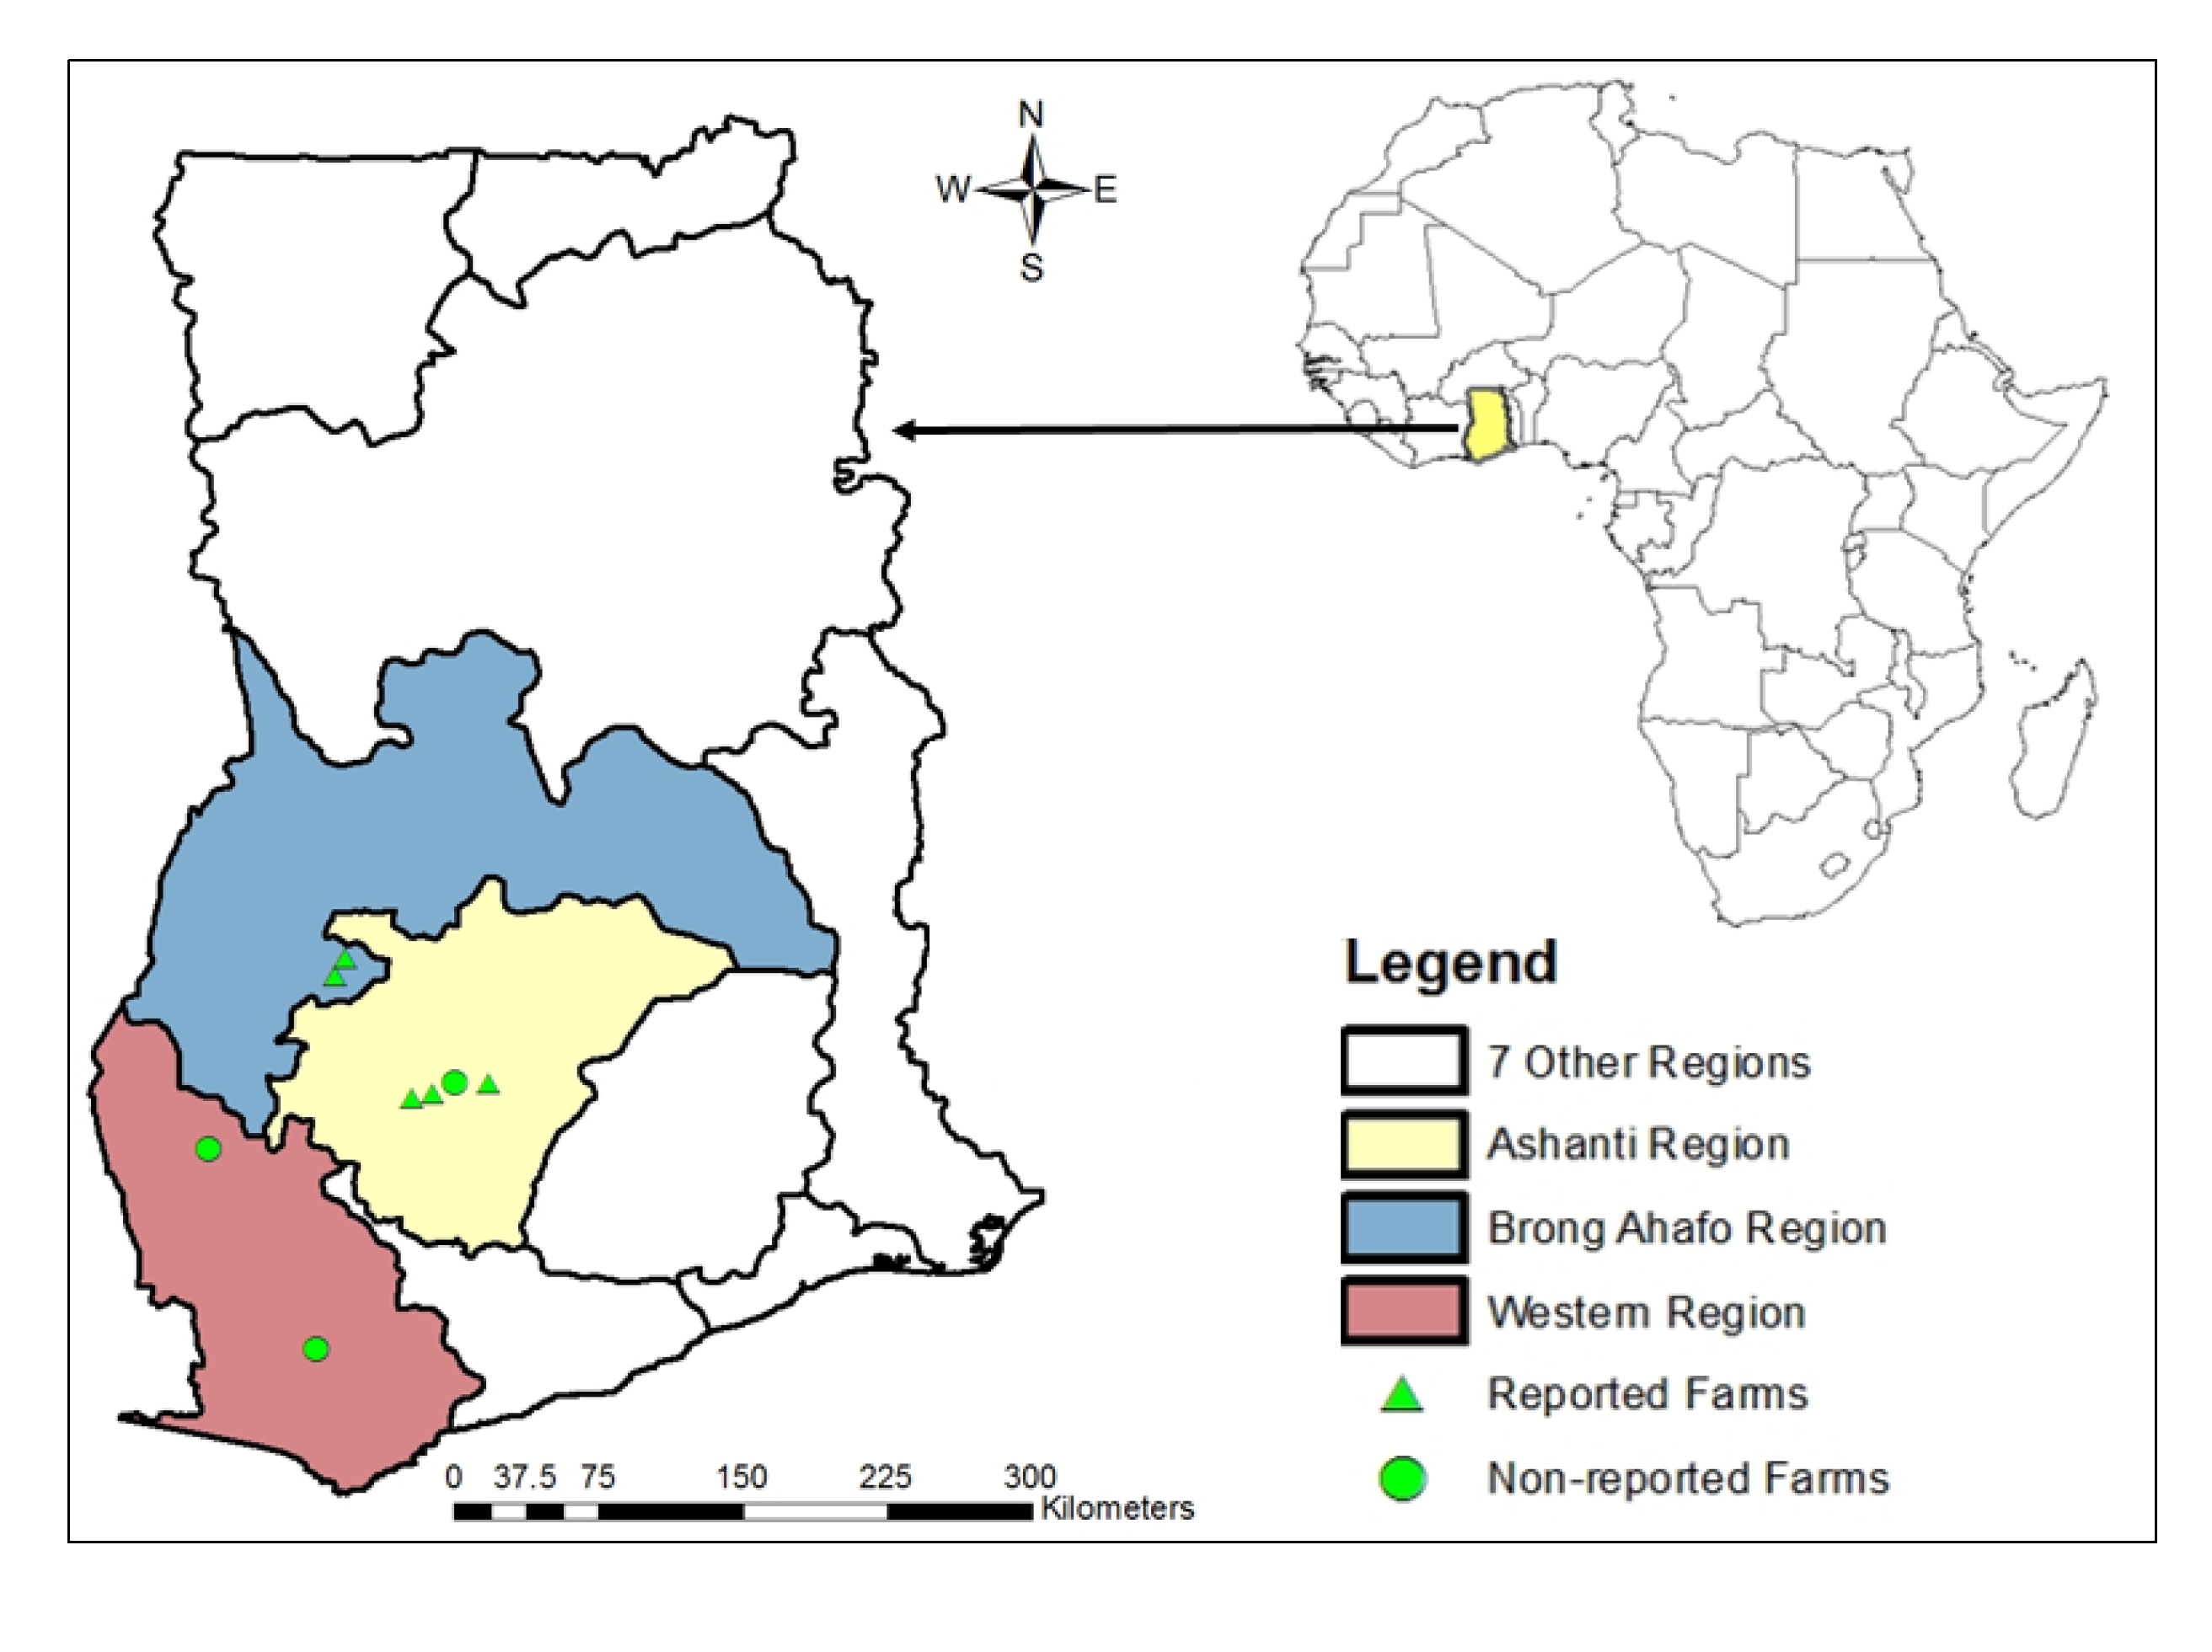
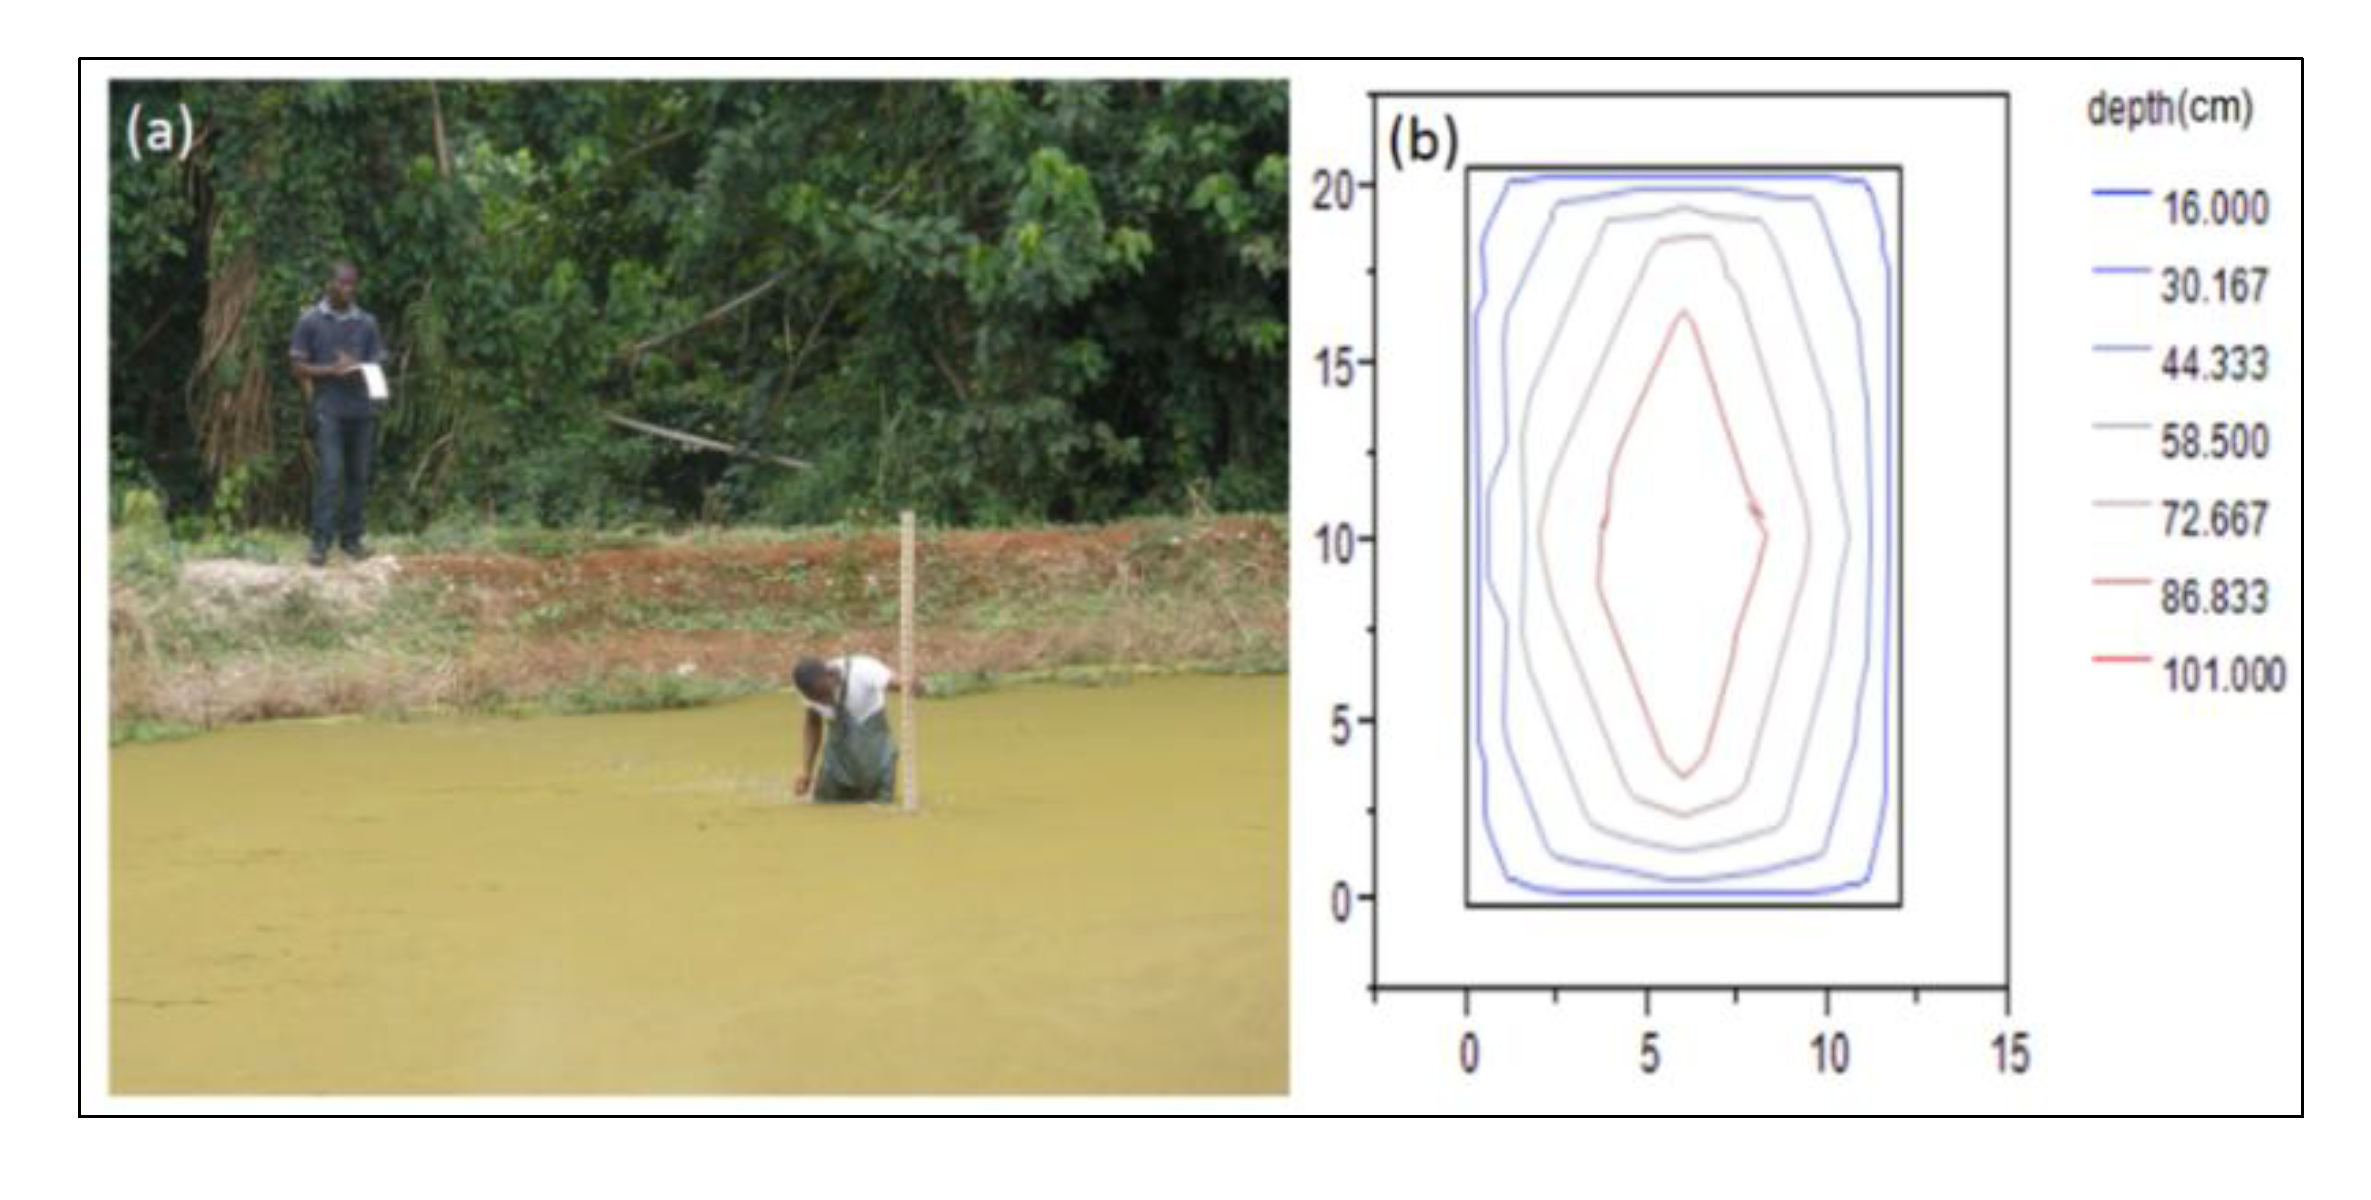
2.1. Study Location
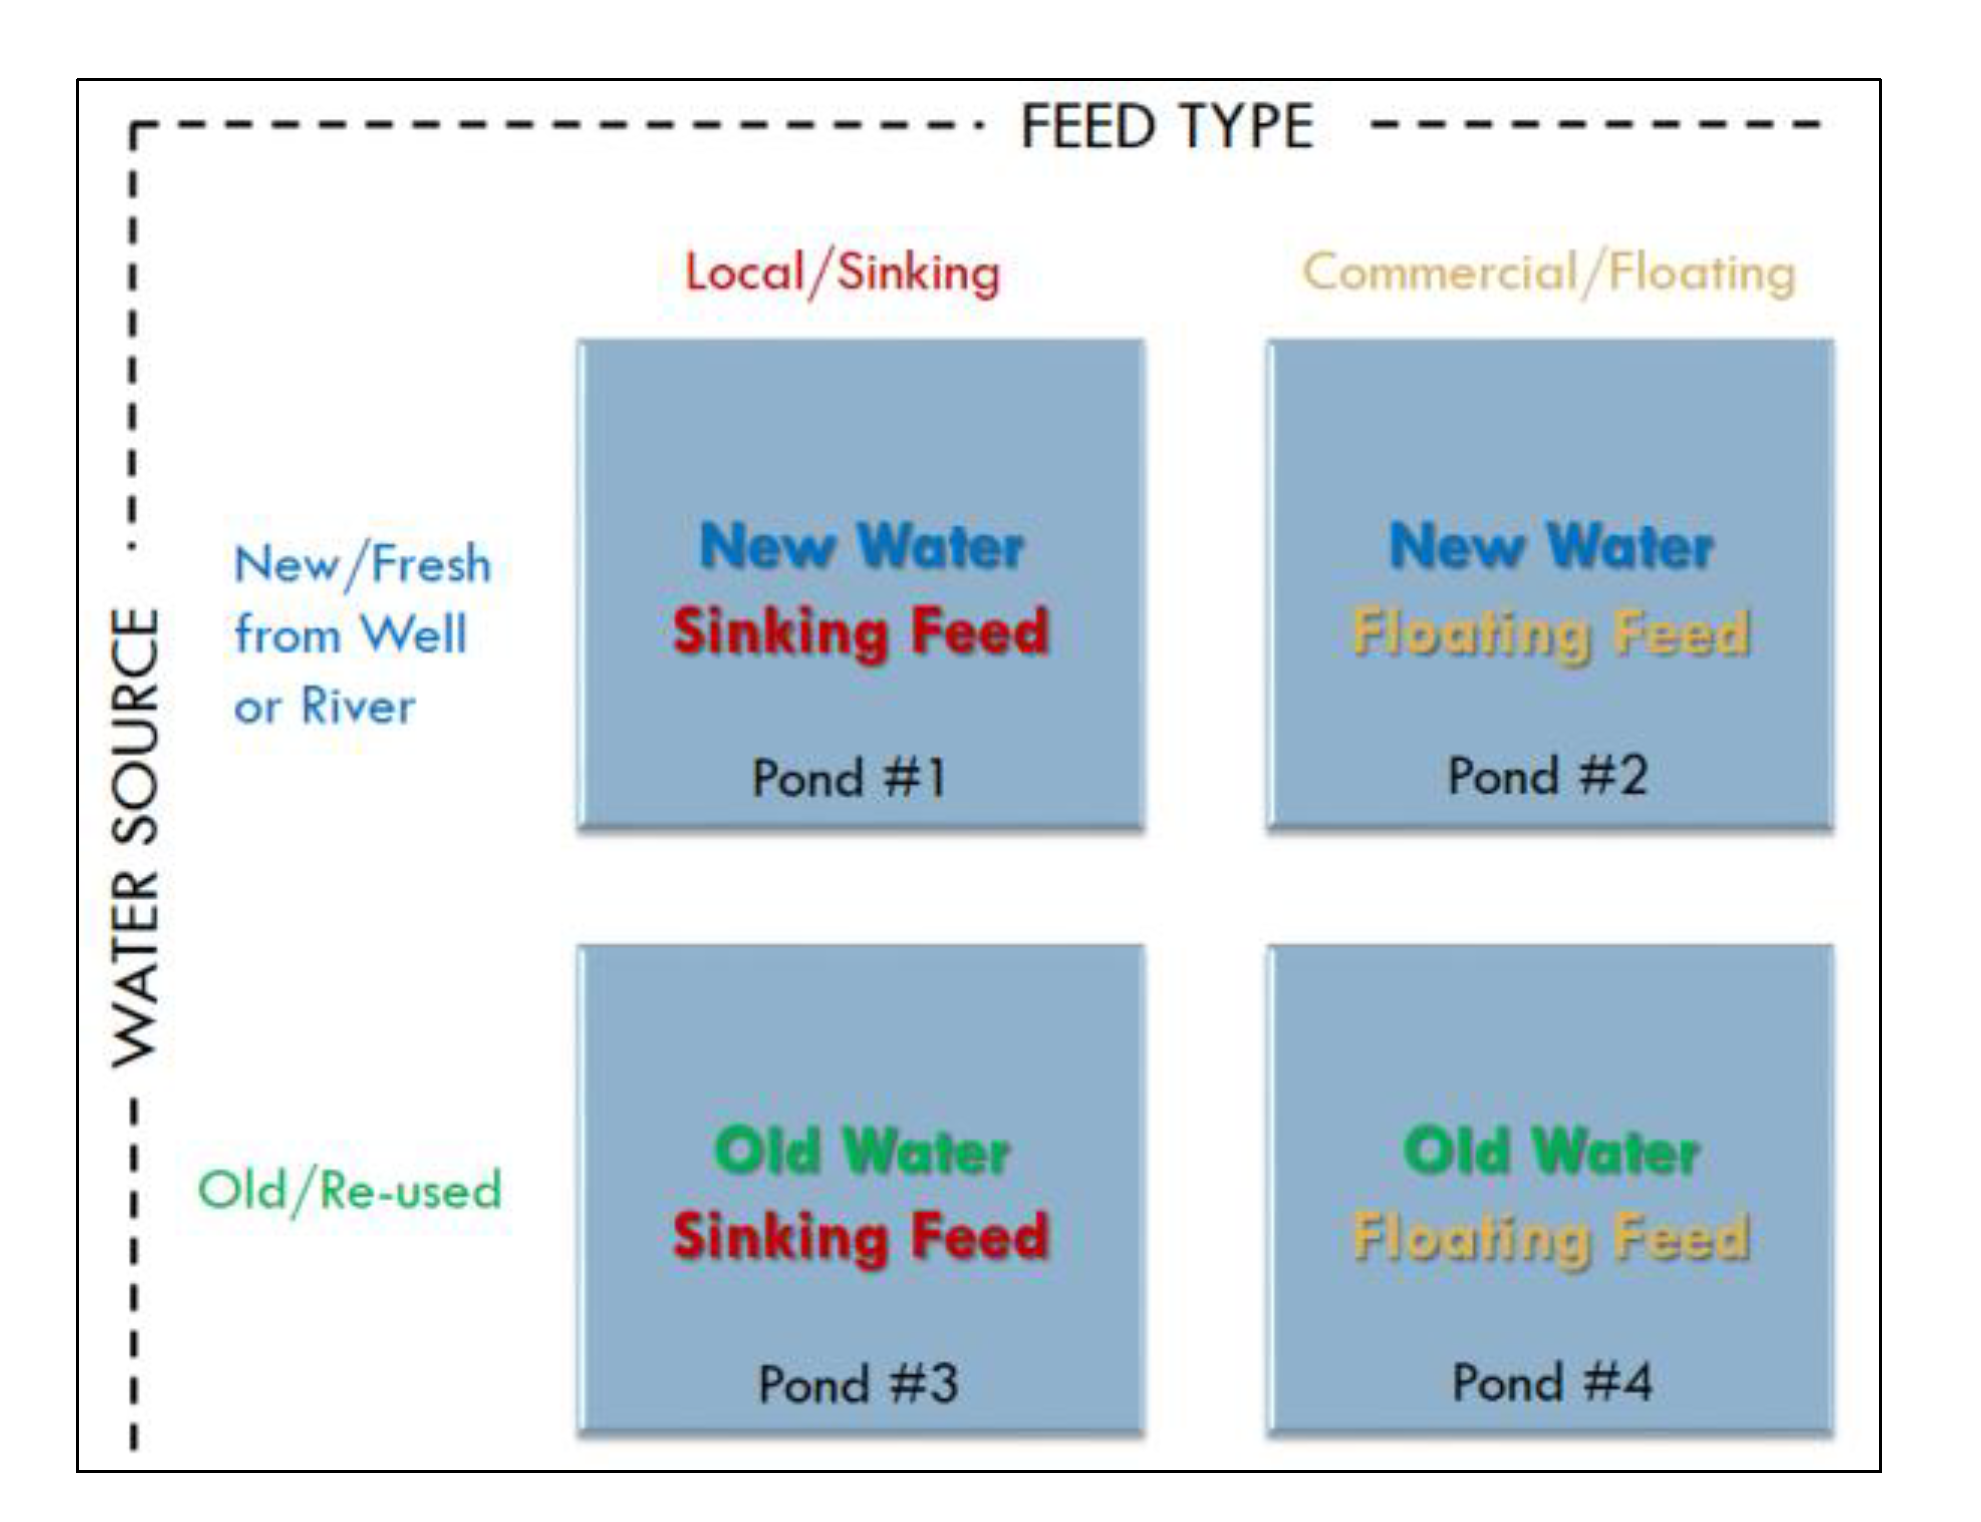
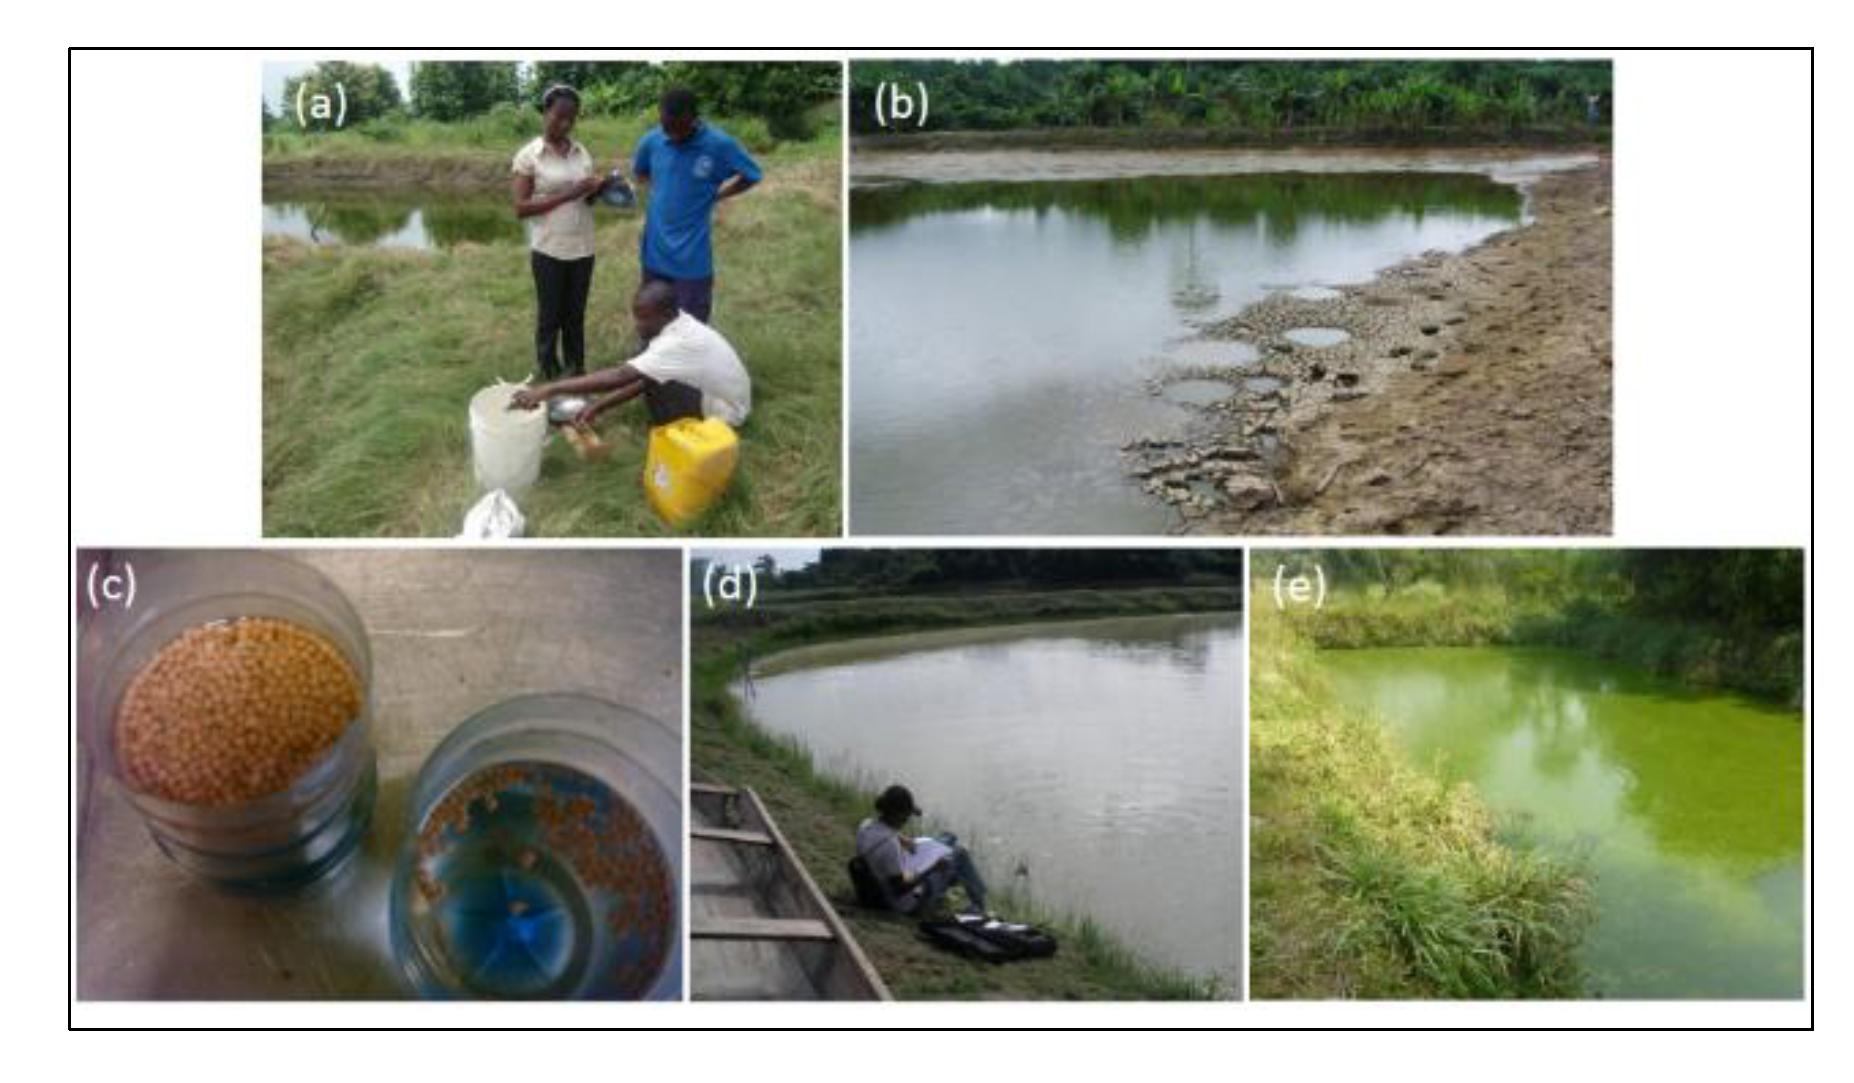
2.2. Experiment Setup and Monitoring


| Variable | Stage of production | Frequency of measurements | Timing | Level in the pond | Number of subsamples | Analytical technique |
|---|---|---|---|---|---|---|
| Temperature | Middle | Weekly | 9:00 am | Bottom/Middle/Upper | 1 | Hand-held meter |
| Dissolved oxygen | Middle | Weekly | 9:00 am | Bottom/Middle/Upper | 1 | Hand-held meter |
| pH | Middle | Weekly | 9:00 am | Bottom/Middle/Upper | 1 | Hand-held meter |
| Alkalinity (as HCO3−) | Middle | Weekly | 9:00 am | Composite | 1 | Laboratory |
| Unionized Ammonia NH3 | Middle | Weekly | 9:00 am | Composite | 1 | Laboratory |
| Ammonium Ion NH4+ | Middle | Weekly | 9:00 am | Composite | 1 | Laboratory |
| Nitrate NO3− | Middle | Weekly | 9:00 am | Composite | 1 | Laboratory |
| Nitrite NO2− | Middle | Weekly | 9:00 am | Composite | 1 | Laboratory |
| Total Kjeldal Nitrogen TKN | Middle | Weekly | 9:00 am | Composite | 1 | Laboratory |
| Chlorophyll-a | Middle | Weekly | 9:00 am | Composite | 1 | Laboratory |
| Turbidity (as Secchi disk depth) | Middle | Weekly | 9:00 am | n/a | 5 | Field |
| Total Suspended Solids | Middle | Weekly | 9:00 am | Composite | 1 | Laboratory |
| Total Suspended Solids | Beginning/End | One time | Daylight | Bottom/Upper(surface) | 1 | Laboratory |
| Settleable Solids | Beginning/End | One time | Daylight | Bottom/Upper(surface) | 1 | Laboratory |
| Orthophosphates PO4 | Beginning/End | One time | Daylight | Bottom/Upper(surface) | 1 | Laboratory |
| Total Phosphates PO43− | Beginning/End | One time | Daylight | Bottom/Upper(surface) | 1 | Laboratory |
| Biochemical Oxygen Demand BOD5 | Beginning/End | One time | Daylight | Bottom/Upper(surface) | 1 | Laboratory |
| Dissolved Inorganic Nitrogen DIN | Beginning/End | One time | Daylight | Bottom/Upper(surface) | 1 | Laboratory |
| Dissolved Organic Nitrogen DON | Beginning/End | One time | Daylight | Bottom/Upper(surface) | 1 | Laboratory |
| Total Dissolved Nitrogen TDN | Beginning/End | One time | Daylight | Bottom/Upper(surface) | 1 | Laboratory |
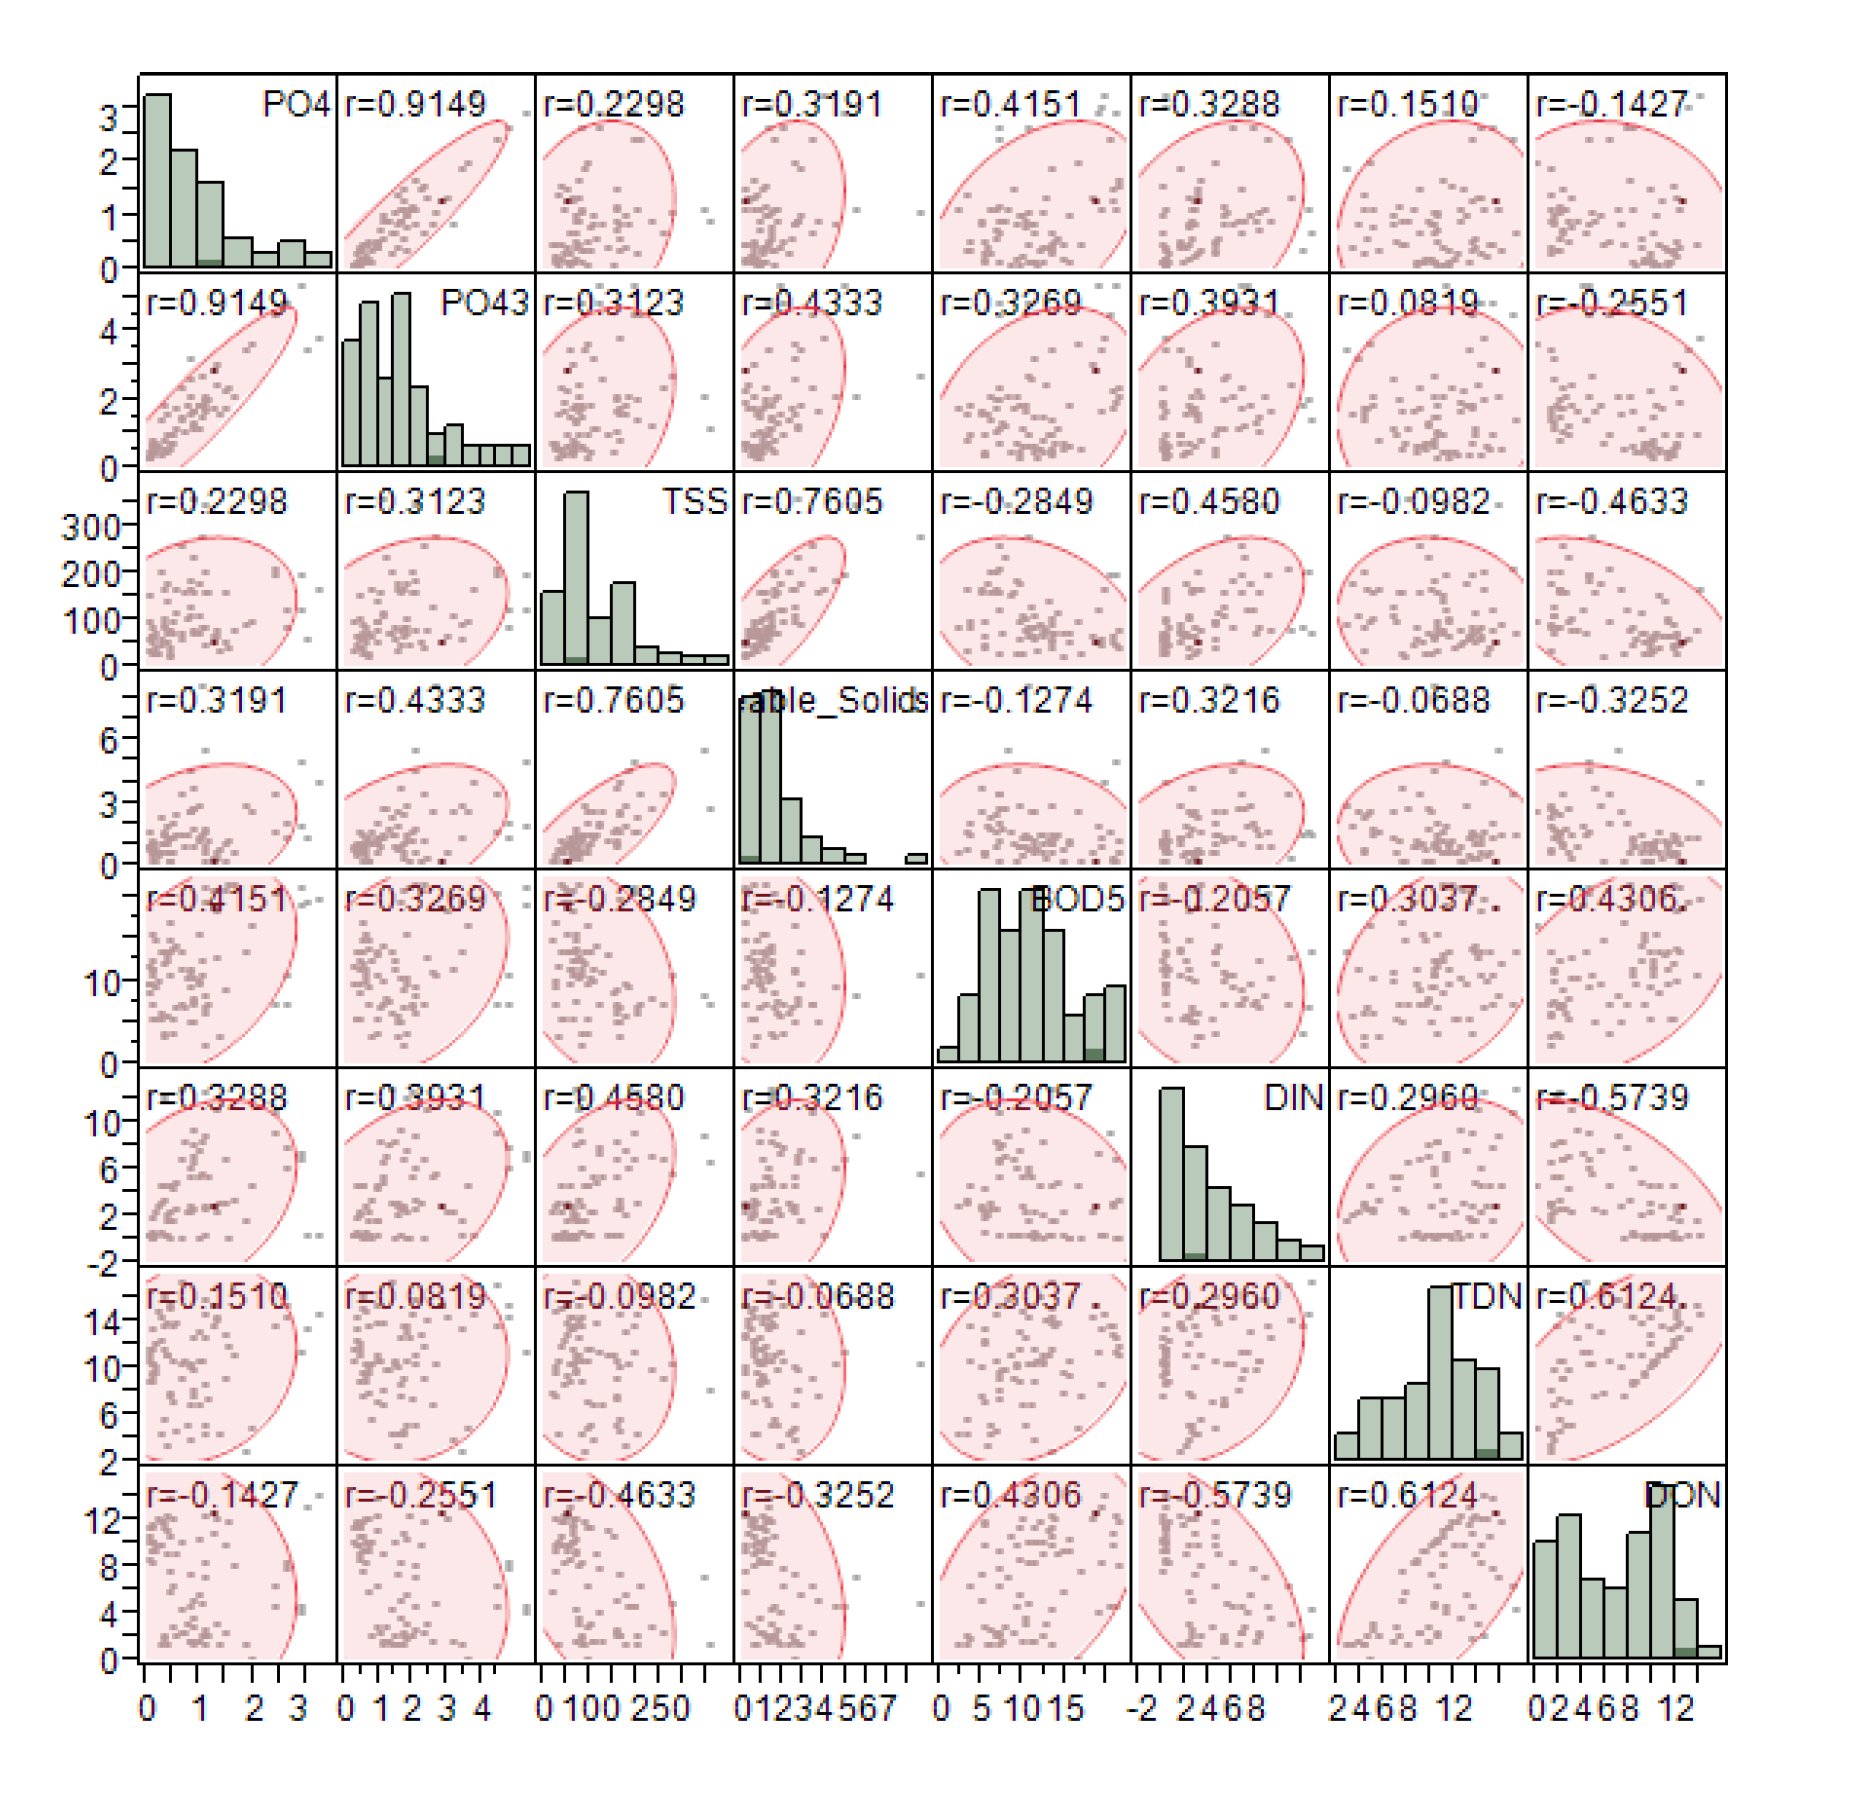
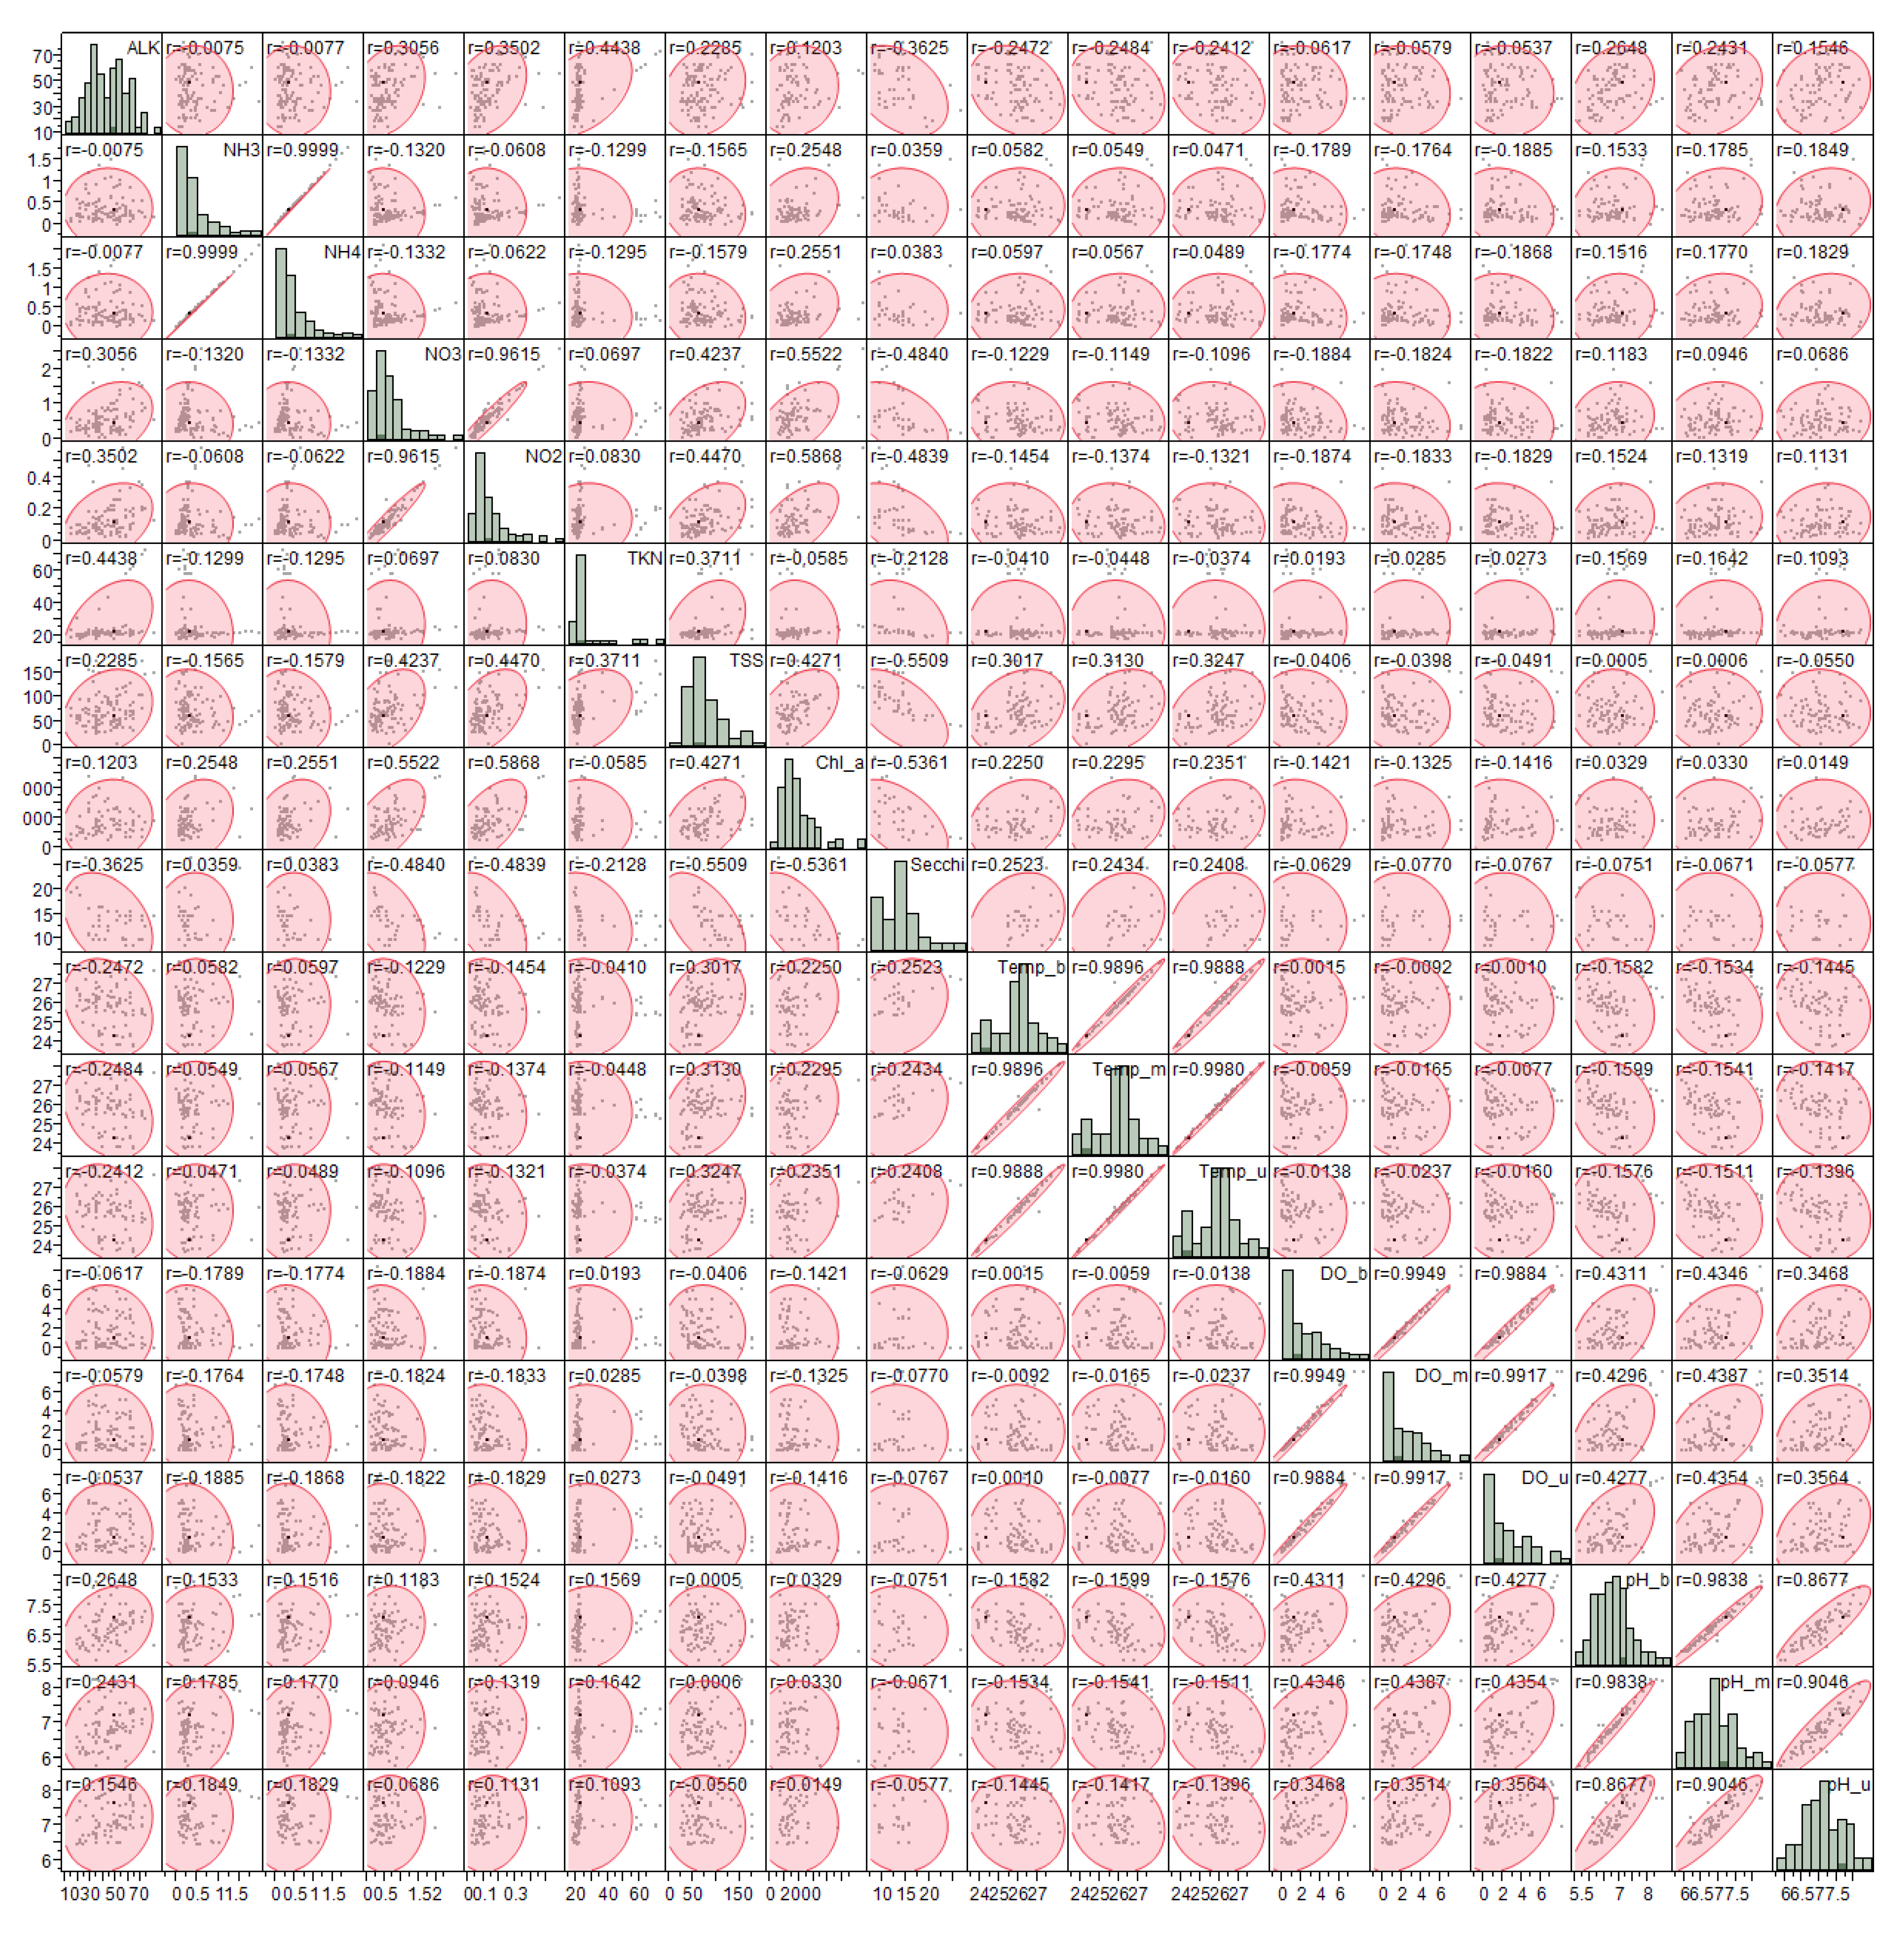
2.3. Statistical Analysis
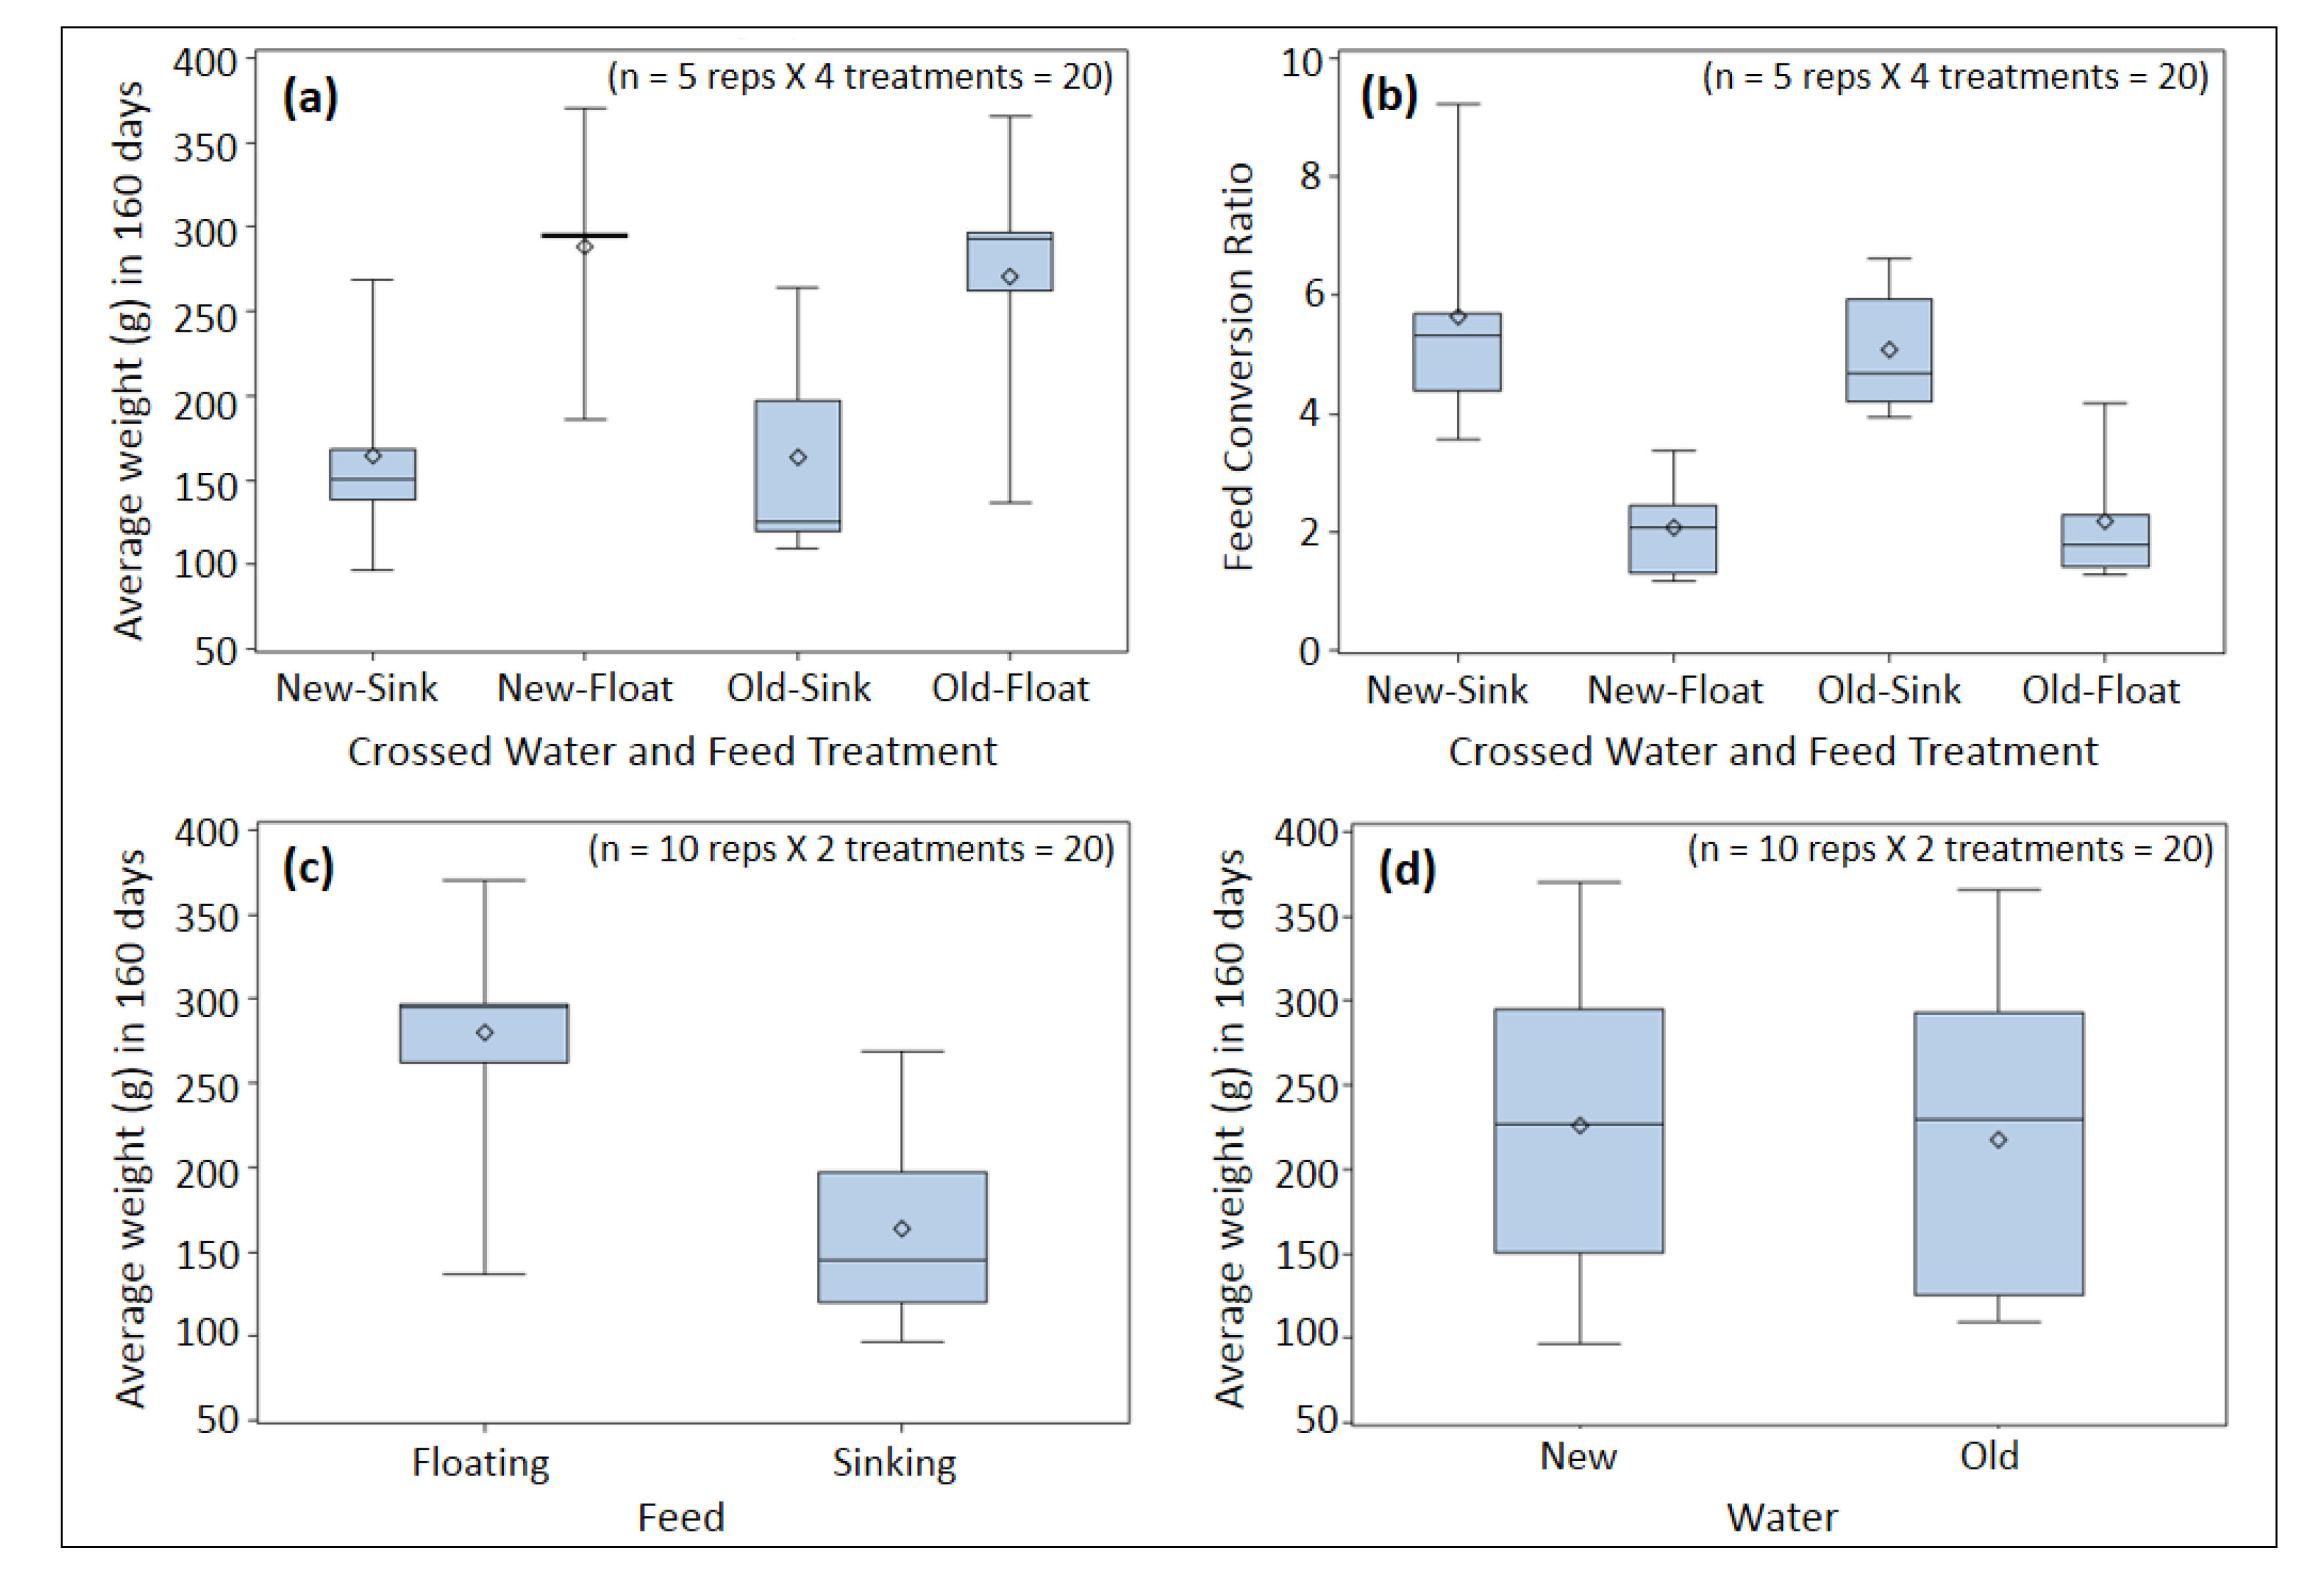
3. Results and Discussion

| Source\Variable | DF | PO4 (mg/L) | PO43− (mg/L) | TSS (mg/L) | Settleable Solids (mL) | BOD5 (mg/L) | DIN (mg/L) | DON (mg/L) | TDN (mg/L) |
|---|---|---|---|---|---|---|---|---|---|
| Farm | 4 | <0.0001 | <0.0001 | 0.0202 | 0.0334 | <0.0001 | 0.0074 | <0.0001 | <0.0001 |
| Water | 1 | 0.5384 | 0.0617 | 0.0793 | 0.2829 | 0.0122 | 0.0305 | 0.1256 | 0.0073 |
| Feed | 1 | 0.1596 | 0.1389 | 0.2472 | 0.0621 | 0.8690 | 0.6017 | 0.0066 | 0.2043 |
| Water × Feed | 1 | 0.2214 | 0.3930 | 0.3908 | 0.1519 | 0.6923 | 0.0536 | 0.0953 | 0.0101 |
| Stage | 1 | 0.0002 | <0.0001 | <0.0001 | <0.0001 | <0.0001 | <0.0001 | <0.0001 | <0.0001 |
| Water × Stage | 1 | 0.6873 | 0.8927 | 0.5368 | 0.7602 | 0.2644 | 0.5947 | 0.5093 | 0.4008 |
| Feed × Stage | 1 | 0.2875 | 0.9717 | 0.1532 | 0.0359 | 0.5101 | 0.6417 | 0.3507 | 0.8520 |
| Water × Feed × Stage | 1 | 0.1356 | 0.5327 | 0.1532 | 0.8867 | 0.2644 | 0.0468 | 0.8905 | 0.0835 |
| Level | 1 | 0.6738 | 0.3904 | 0.0064 | 0.0112 | 0.5531 | 0.5722 | 0.7510 | 0.7850 |
| Water × Level | 1 | 0.9223 | 0.7710 | 0.3608 | 0.5420 | 0.5314 | 0.0329 | 0.0837 | 0.0056 |
| Feed × Level | 1 | 0.9253 | 0.8927 | 0.8491 | 0.3940 | 0.8690 | 0.2281 | 0.7697 | 0.2408 |
| Water × Feed × Level | 1 | 0.9545 | 0.8983 | 0.5397 | 0.8387 | 0.9737 | 0.7392 | 0.1055 | 0.2063 |
| Stage × Level | 1 | 0.9721 | 0.8240 | 0.4897 | 0.597 | 0.9474 | 0.7679 | 0.6492 | 0.6023 |
| Water × Stage × Level | 1 | 0.8325 | 0.8964 | 0.8694 | 0.8387 | 0.7919 | 0.0045 | 0.3470 | 0.0038 |
| Feed × Stage × Level | 1 | 0.9077 | 0.7422 | 0.6972 | 0.2248 | 0.7168 | 0.1703 | 0.5214 | 0.4545 |
| Water × Feed × Stage × Level | 1 | 0.8526 | 0.7873 | 0.2353 | 0.9675 | 0.9474 | 0.6998 | 0.7042 | 0.9309 |
| Model degrees of freedom | 19 | 19 | 19 | 19 | 19 | 19 | 19 | 19 | |
| Error degrees of freedom | 60 | 60 | 60 | 60 | 60 | 60 | 60 | 60 | |
| Model R-Square | 0.54 | 0.58 | 0.60 | 0.52 | 0.53 | 0.72 | 0.89 | 0.61 | |
| Mean value | 0.90 | 1.68 | 105.88 | 1.53 | 11.25 | 3.72 | 6.85 | 10.57 | |
| Root MSE (StDev) | 0.61 | 0.94 | 51.48 | 1.09 | 4.05 | 2.08 | 1.54 | 2.52 | |
| Coefficient of Variation (%) | 67.2 | 55.9 | 48.6 | 71.6 | 36.0 | 56.0 | 22.4 | 23.8 |
| Water | Feed | Stage | Level | |||||
|---|---|---|---|---|---|---|---|---|
| New | Old | Floating | Sinking | Begin | End | Bottom | Surface | |
| PO4 (mg/L) | 0.86 (0.67, 1.05) | 0.94 (0.75, 1.13) | 0.81 (0.61, 1.00) | 1.00 (0.81, 1.20) | 0.64 (0.44, 0.83) | 1.17 (0.98, 1.36) | 0.93 (0.74, 1.12) | 0.87 (0.68, 1.06) |
| PO43− (mg/L) | 1.52 (1.23, 1.82) | 1.84 (1.54, 2.14) | 1.48 (1.18, 1.78) | 1.88 (1.58, 2.18) | 1.10 (0.80, 1.40) | 2.26 (1.97, 2.56) | 1.77 (1.47, 2.07) | 1.59 (1.29, 1.89) |
| TSS (mg/L) | 99.15 (82.87, 115.43) | 112.6 (96.32, 128.88) | 95.60 (79.32, 111.88) | 116.15 (99.87, 132.43) | 63.20 (46.92, 79.48) | 148.55 (132.27, 164.83) | 122.13 (105.84, 138.41) | 89.63 (73.34, 105.91) |
| Settleable Solids (mL) | 1.30 (0.95, 1.64) | 1.76 (1.41, 2.11) | 1.40 (1.05, 1.74) | 1.66 (1.31, 2.01) | 0.82 (0.47, 1.17) | 2.24 (1.89, 2.58) | 1.85 (1.50, 2.19) | 1.21 (0.86, 1.55) |
| BOD5 (mg/L) | 10.08 (8.80, 11.36) | 12.42 (11.14, 13.70) | 11.18 (9.89, 12.46) | 11.33 (10.04, 12.61) | 13.61 (12.32, 14.89) | 8.90 (7.61, 10.18) | 11.52 (10.24, 12.80) | 10.98 (9.70, 12.26) |
| DIN (mg/L) | 3.20 (2.54, 3.86) | 4.23 (3.57, 4.89) | 3.84 (3.18, 4.50) | 3.60 (2.94, 4.25) | 1.34 (0.68, 2.00) | 6.10 (5.44, 6.76) | 3.58 (2.93, 4.24) | 3.85 (3.19, 4.51) |
| DON (mg/L) | 6.58 (6.10, 7.07) | 7.12 (6.63, 7.60) | 6.37 (5.88, 6.85) | 7.33 (6.85, 7.82) | 10.47 (9.98, 10.96) | 3.23 (2.74, 3.72) | 6.90 (6.42, 7.39) | 6.80 (6.31, 7.28) |
| TDN (mg/L) | 9.78 (8.99, 10.58) | 11.35 (10.55, 12.15) | 10.21 (9.41, 11.00) | 10.93 (10.13, 11.73) | 11.81 (11.00, 12.60) | 9.33 (8.53, 10.13) | 10.49 (9.69, 11.29) | 10.64 (9.85, 11.44) |
| Source\Variable | DF | Dissol. Oxygen (mg/L) | Template (°C) | pH | Alkalinity (mg/L HCO3−) | NH4+ (mg/L) | NH3 (mg/L) | NO3− (mg/L) | NO2− (mg/L) | TKN (mg/L) | TSS (mg/L) | Chl-a (μg/L) | Turbidity (Secchi depth, cm) |
|---|---|---|---|---|---|---|---|---|---|---|---|---|---|
| Farm | 1 | <0.0001 | <0.0001 | <0.0001 | <0.0001 | 0.4623 | 0.4672 | 0.0256 | 0.0023 | 0.0004 | 0.0138 | 0.2548 | <0.0001 |
| Water | 1 | 0.0062 | 0.1403 | 0.2550 | 0.0023 | 0.1438 | 0.1438 | 0.3527 | 0.3558 | 0.4899 | 0.9624 | 0.0095 | <0.0001 |
| Feed | 1 | <0.0001 | 0.0023 | 0.0075 | 0.5047 | 0.3479 | 0.3428 | 0.6211 | 0.4025 | 0.4493 | 0.9774 | 0.2060 | 0.0005 |
| Water × Feed | 1 | 0.0049 | 0.4991 | 0.3261 | <0.0001 | 0.1490 | 0.1497 | 0.5784 | 0.2811 | 0.6878 | 0.4163 | 0.2917 | 0.0671 |
| Level | 2 | 0.1859 | 0.8652 | 0.0002 | |||||||||
| Water × Level | 2 | 0.9959 | 0.9969 | 0.9899 | |||||||||
| Feed × Level | 2 | 0.9546 | 0.9896 | 0.9343 | |||||||||
| Water × Feed × Level | 2 | 0.9953 | 0.9953 | 0.9974 | |||||||||
| Day | 1 | <0.0001 | <0.0001 | 0.0116 | 0.1313 | 0.0228 | 0.0239 | <0.0001 | <0.0001 | 0.0155 | <0.0001 | <0.0001 | 0.0355 |
| Day (Replicate) | 4 | 0.9953 | |||||||||||
| Model degrees of freedom | 13 | 13 | 13 | 5 | 5 | 5 | 5 | 5 | 5 | 5 | 5 | 9 | |
| Error degrees of freedom | 250 | 250 | 250 | 106 | 105 | 105 | 106 | 106 | 106 | 106 | 74 | 190 | |
| Model R-Square | 0.56 | 0.39 | 0.31 | 0.51 | 0.10 | 0.10 | 0.30 | 0.32 | 0.19 | 0.31 | 0.30 | 0.32 | |
| Mean value | 2.15 | 25.85 | 6.91 | 43.44 | 0.42 | 0.40 | 0.58 | 0.13 | 25.21 | 73.31 | 1843.06 | 13.73 | |
| Root MSE (StDev) | 1.35 | 0.82 | 0.49 | 10.33 | 0.39 | 0.37 | 0.38 | 0.08 | 11.13 | 29.99 | 993.72 | 3.34 | |
| Coefficient of Variation (%) | 62.6 | 3.2 | 7.2 | 23.8 | 92.9 | 93.1 | 64.8 | 64.4 | 44.2 | 40.9 | 53.9 | 24.3 |
| Water | Feed | Level | |||||
|---|---|---|---|---|---|---|---|
| New | Old | Floating | Sinking | Bottom | Middle | Upper | |
| Dissolved Oxygen (mg/L) | 1.92 (1.69, 2.15) | 2.38 (2.15, 2.61) | 3.33 (3.10, 3.56) | 0.97 (0.74, 1.20) | 1.98 (1.70, 2.27) | 2.11 (1.83, 2.40) | 2.35 (2.07, 2.64) |
| Temp (°C) | 25.93 (25.79, 26.07) | 25.78 (25.64, 25.92) | 26.01 (25.87, 26.15) | 25.70 (25.55, 25.84) | 25.88 (25.71, 26.05) | 25.86 (25.69, 26.03) | 25.81 (25.64, 25.99) |
| pH | 6.87 (6.79, 6.96) | 6.94 (6.86, 7.03) | 6.99 (6.90, 7.07) | 6.82 (6.74, 6.91) | 6.78 (6.67, 6.88) | 6.86 (6.76, 6.96) | 7.08 (6.98, 7.18) |
| Alkalinity (mg/L HCO3−) | 46.50 (43.75, 49.23) | 40.39 (37.65, 43.13) | 42.79 (40.05, 45.52) | 44.09 (41.36, 46.83) | |||
| NH4+ (mg/L) | 0.37 (0.26, 0.47) | 0.48 (0.37, 0.58) | 0.39 (0.28, 0.49) | 0.46 (0.35, 0.56) | |||
| NH3 (mg/L) | 0.35 (0.25, 0.44) | 0.45 (0.35, 0.55) | 0.36 (0.26, 0.46) | 0.43 (0.33, 0.53) | |||
| NO3− (mg/L) | 0.55 (0.45, 0.65) | 0.62 (0.52, 0.72) | 0.56 (0.46, 0.66) | 0.60 (0.50, 0.70) | |||
| NO2− (mg/L) | 0.12 (0.10, 0.14) | 0.14 (0.11, 0.16) | 0.12 (0.10, 0.14) | 0.13 (0.11, 0.16) | |||
| TKN (mg/L) | 25.94 (23.00, 28.89) | 24.49 (21.54, 27.43) | 24.42 (21.47, 27.37) | 26.01 (23.06, 28.96) | |||
| TSS (mg/L) | 73.45 (65.50, 81.39) | 73.18 (65.23, 81.12) | 73.39 (65.45, 81.34) | 73.23 (65.29, 81.18) | |||
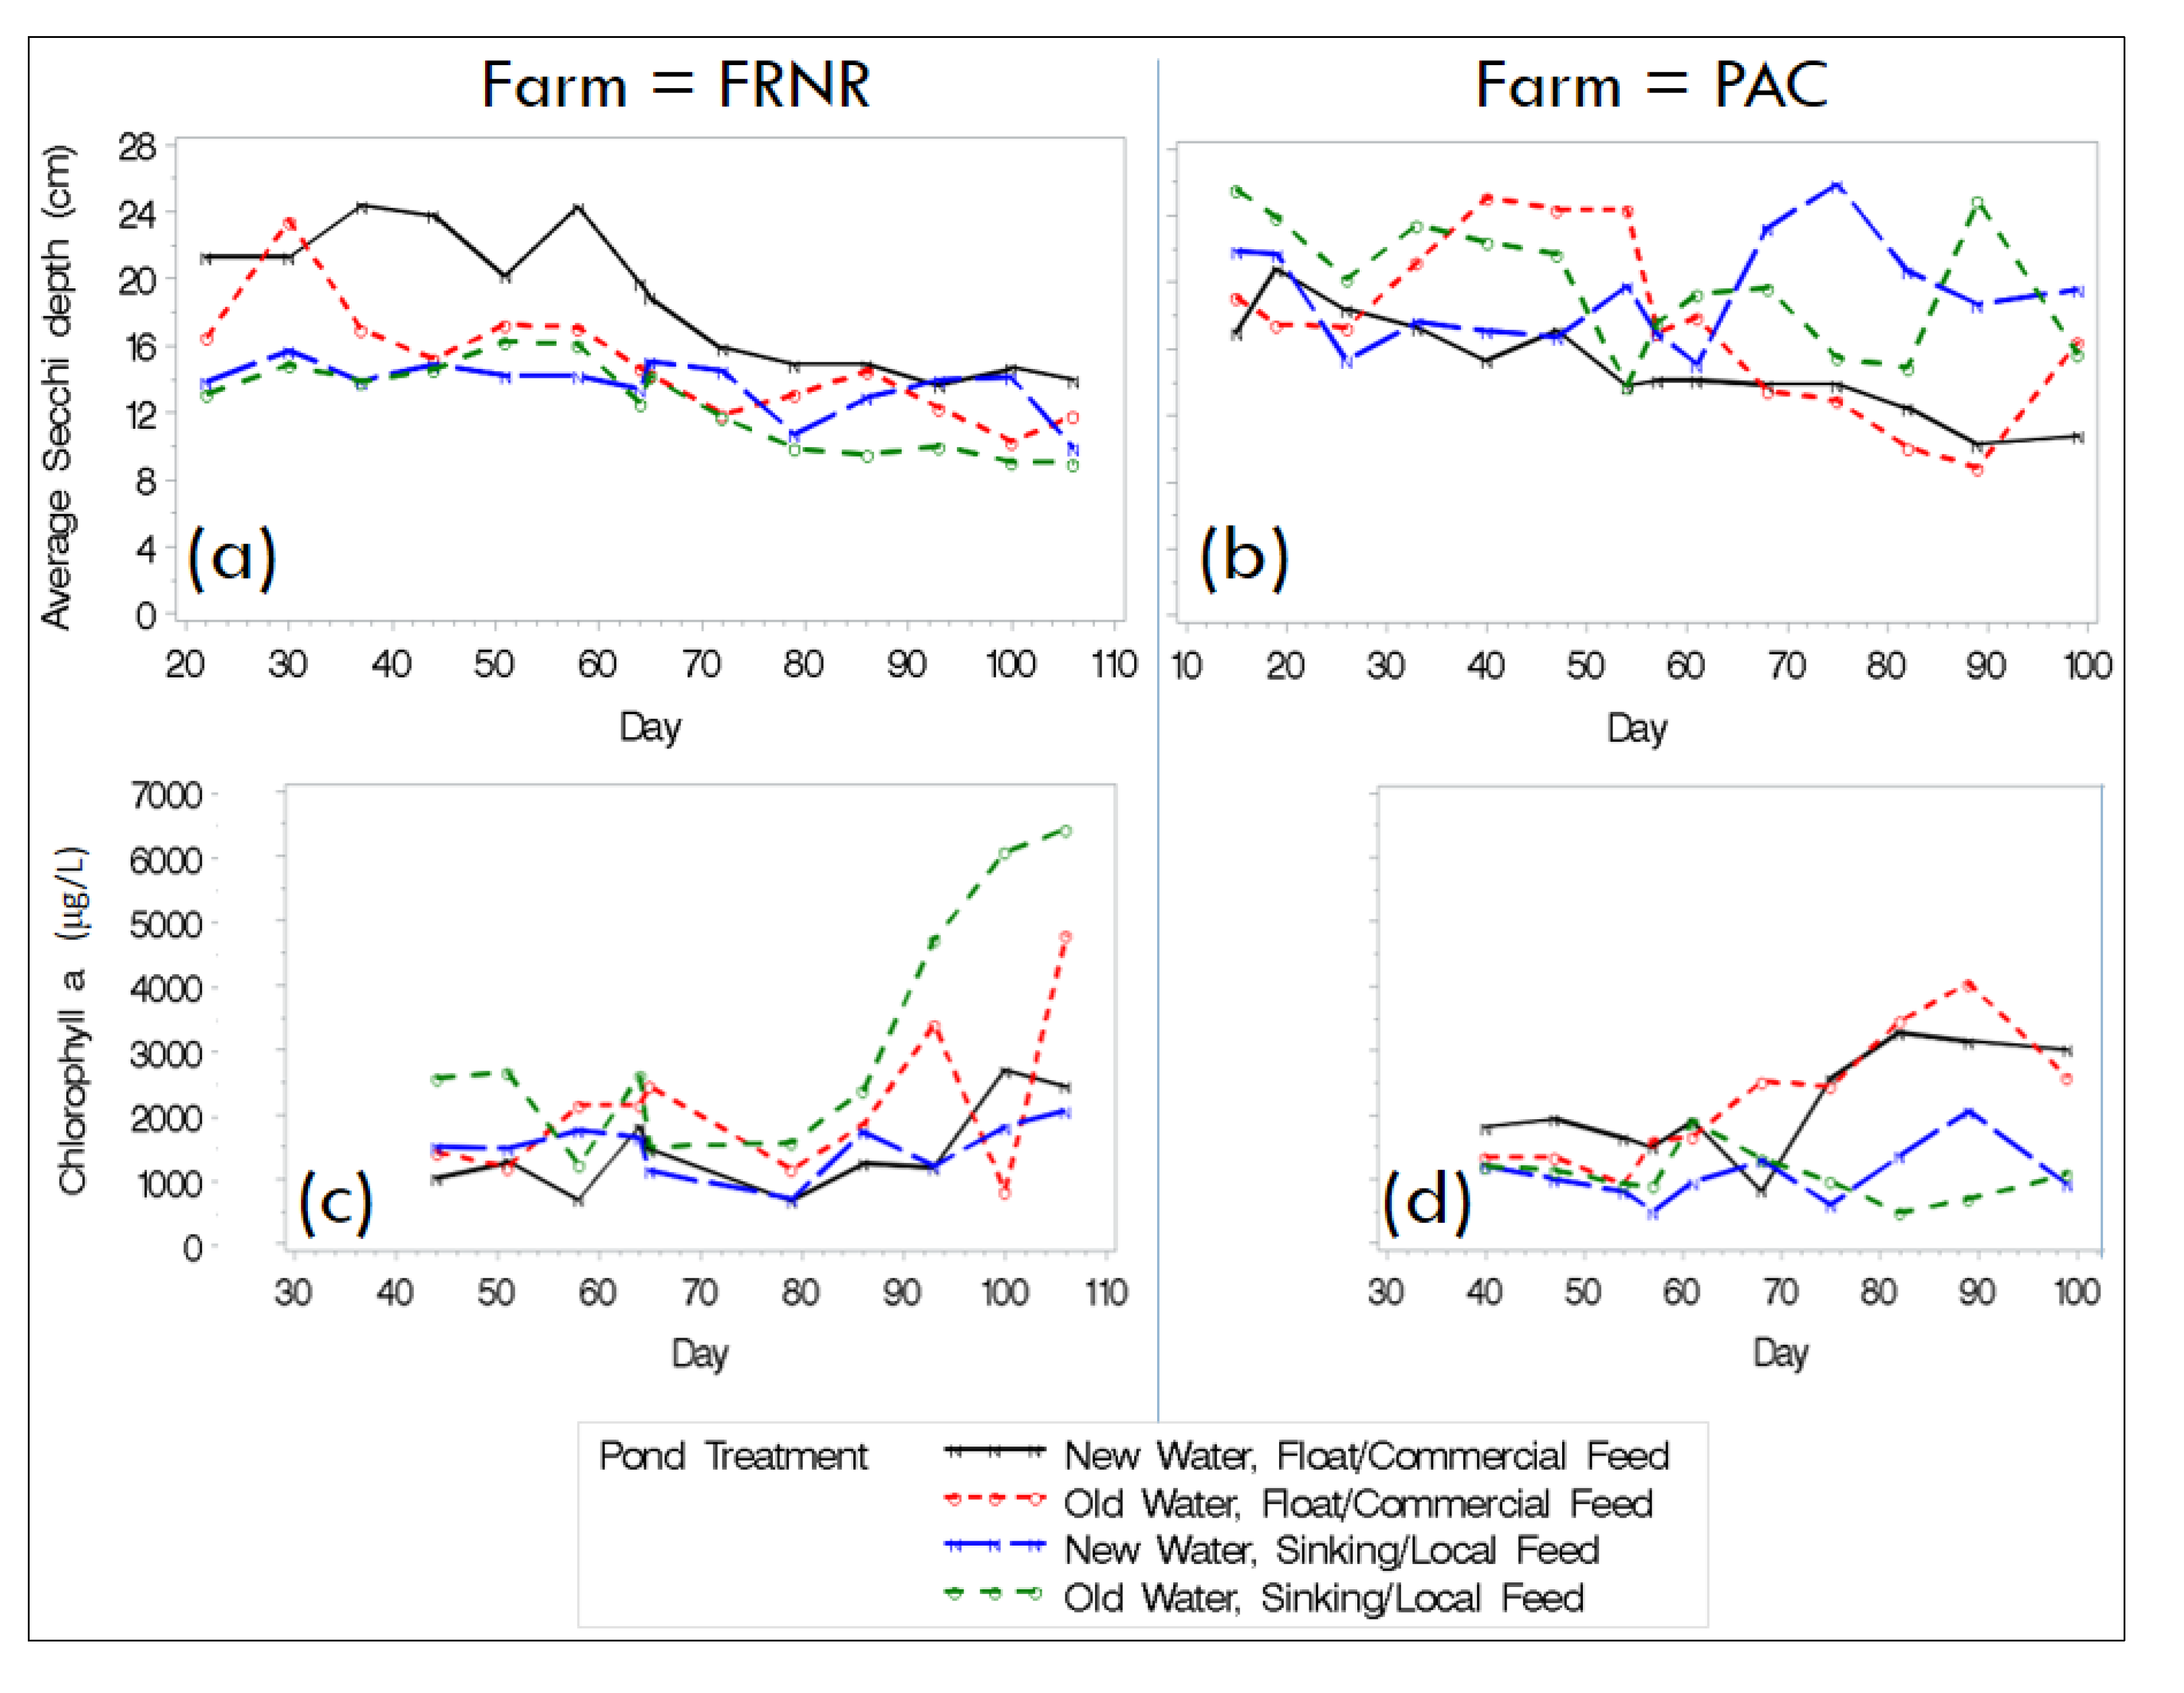
| Chl-a (μg/L) | 1547.12 (1234.05, 1860.19) | 2139.00 (1825.93, 2452.07) | 1984.81 (1671.74, 2297.87) | 1701.31 (1388.24,2014.38) | |||
| Turbidity (Secchi depth, cm) | 15.15 (14.48, 15.82) | 12.94 (12.27, 13.61) | 13.21 (12.54, 13.88) | 14.88 (14.21, 15.55) | |||
| Variable | Typical Pond Effluent a | Baitfish Pond Effluent, AR, USA b | Channel Catfish Pond Effluent, AL, USA c | Ghana Overall Average | Pond Surface Average for End of Production in Current Study | |||||
|---|---|---|---|---|---|---|---|---|---|---|
| Low Intensity | Semi-intensive | Intensive | Old Water | New Water | Floating feed | Sinking feed | ||||
| NH3 & NH4+-N (mg/L) | 0.1–0.5 | 0.5–2.0 | 2.0–5.0 | - | 1.13 | 0.82 | - | - | - | - |
| NO3-N (mg/L) | 0.01–0.1 | 0.1–0.2 | 0.2–0.3 | - | 0.69 | 0.58 | - | - | - | - |
| TKN (mg/L) | 0.5–2.0 | 2.0–4.0 | 4.0–10.0 | - | 4.42 | 25.21 | - | - | - | - |
| Total P (PO43−) (mg/L) | 0.05–0.1 | 0.1–0.3 | 0.3–0.7 | 0.50 | 0.25 | 1.68 | 2.36 | 1.94 | 2.01 | 2.29 |
| Chl-a (µ/L) | 10–50 | 50–150 | 150–500 | - | - | 1843.1 | - | - | - | - |
| BOD5 (mg/L) | 2.0–5.0 | 5.0–20.0 | 20.0–40.0 | 9.0 | 9.43 | 11.25 | 10.11 | 7.08 | 8.91 | 8.28 |
| TSS (mg/L) | - | - | - | 36.0 | 69.4 | 105.9 | 140.0 | 116.6 | 118.8 | 137.8 |
| Settleable Solids (ml/L) | 0.0–0.05 | 0.05–0.1 | 0.1–0.5 | - | 0.08 | 1.09 | 2.09 | 1.61 | 1.73 | 1.97 |

4. Conclusions
Acknowledgments
Conflicts of Interest
References
- Food and Agriculture Organization. State of World Fisheries and Aquaculture; Food and Agriculture Organisation: Rome, Italy, 2012; p. 209. [Google Scholar]
- Fast-growing Fish Variety Could Benefit Egypt and West Africa. Available online: http://www.scidev.net/global/r-d/news/fast-growing-fish-variety-could-benefit-egypt-and-west-africa-.html (accessed on 2 December 2013).
- Fish Feed Mill Inaugurated at Prampram. Available online: http://www.ghana.gov.gh/index.php/2012–02–08–08–18–09/ministries/129-ministries/1324-ministry-of-fisheries-and-aquaculture-development (accessed on 2 December 2013).
- Ghana Fisheries Commission. Ghana National Aquaculture Development Plan; Ghana Ministry of Food and Agriculture: Accra, Ghana, 2012; p. 85. [Google Scholar]
- Ministry of Fisheries and Aquaculture Development. Available online: http://www.ghana.gov.gh/index.php/2012-02-08-08-18-09/ministries/129-ministries/1324-ministry-of-fisheries-and-aquaculture-development (accessed on 2 December 2013).
- Garnett, T.; Godfray, C. Sustainable Intensification in Agriculture. Navigating a Course through Competing Food System Priorities. In Food Climate Research Network and the Oxford Martin Programme on the Future of Food; University of Oxford: Oxford, UK, 2012. [Google Scholar]
- Goldburg, R.; Triplett, T. Murky Waters: Environmental Effects of Aquaculture in the US; Environment Defence Fund: New York, NY, USA, 1997. [Google Scholar]
- Naylor, R.L.; Goldburg, R.J.; Primavera, J.H.; Kautsky, N.; Beveridge, M.C.M.; Clay, J.; Folke, C.; Lubchenco, J.; Mooney, H.; Troell, M. Effect of aquaculture on world fish supplies. Nature 2000, 405, 1017–1024. [Google Scholar] [CrossRef]
- Boyd, C.E.; Queiroz, J.F. Nitrogen, phosphorus loads vary by system: USEPA should consider system variables in setting new effluent rules. Glob. Aquac. Advocate 2001, 4, 84–86. [Google Scholar]
- Schwartz, M.F.; Boyd, C.E. Channel catfish pond effluents. Progress. Fish-Cult. 1994, 56, 273–281. [Google Scholar] [CrossRef]
- Shireman, J.V.; Cichra, C.E. Evaluation of aquaculture effluents. Aquaculture 1994, 123, 55–68. [Google Scholar] [CrossRef]
- Boyd, C.E.; Dhendup, T. Quality of potential effluents from the hypolimnia of watershed ponds used in aquaculture. Progress. Fish-Cult. 1995, 57, 59–63. [Google Scholar] [CrossRef]
- Bodary, M.J.; Stone, N.; Lochmann, S.E.; Frimpong, E. Characteristics of effluents from central Arkansas baitfish ponds. J. World Aquac. Soc. 2004, 35, 489–497. [Google Scholar] [CrossRef]
- Frimpong, E.A.; Lochmann, S.E. Mortality of fish larvae exposed to varying concentrations of cyclopoid copepods. N. Am. J. Aquac. 2005, 67, 66–71. [Google Scholar] [CrossRef]
- Stephens, W.W.; Farris, J.L. Instream community assessment of aquaculture effluents. Aquaculture 2004, 231, 149–162. [Google Scholar] [CrossRef]
- Boyd, C.E.; Queiroz, J.; Lee, J.; Rowan, M.; Whitis, G.N.; Gross, A. Environmental assessment of channel catfish Ictalurus punctatus farming in Alabama. J. World Aquac. Soc. 2000, 31, 511–544. [Google Scholar]
- Kouka, P.-J.; Engle, C.R. Cost of Alternative Effluent Treatments for Catfish Production; Southern Regional Aquaculture Center: Stoneville, MS, USA, 1994. [Google Scholar]
- Schwartz, M.F.; Boyd, C.E. Effluent quality during harvest of channel catfish from watershed ponds. Progress. Fish-Cult. 1994, 56, 25–32. [Google Scholar] [CrossRef]
- Seok, K.; Leonard, S.; Boyd, C.E.; Schwartz, M.E. Communications: Water quality in annually drained and undrained channel catfish ponds over a three-year period. Progress. Fish-Cult. 1995, 57, 52–58. [Google Scholar] [CrossRef]
- Tucker, C.S.; Kingsbury, S.K.; Pole, J.W.; Wax, C.L. Effects of water management practices on discharge of nutrients and organic matter from channel catfish (Ictalurus punctatus) ponds. Aquaculture 1996, 147, 57–69. [Google Scholar] [CrossRef]
- Cripps, S.J.; Kelly, L.A. Reductions in Wastes from Aquaculture. In Aquaculture and Water Resource Management; Baired, D.J., Beveridge, M.C.M., Kelly, L.A., Muir, J.F., Eds.; Blackwell Science: Cambridge, UK, 1996; pp. 166–201. [Google Scholar]
- Boyd, C.E. Guidelines for aquaculture effluent management at the farm-level. Aquaculture 2003, 226, 101–112. [Google Scholar] [CrossRef]
- Engle, C.; Valderrama, D. Economic effects of implementing selected components of best management practices (BMPs) for semi-intensive shrimp farms in honduras. Aquac. Econ. Manag. 2004, 8, 157–177. [Google Scholar] [CrossRef]
- Engle, C.R.; Pomerleau, S.; Fornshell, G.; Hinshaw, J.M.; Sloan, D.; Thompson, S. The economic impact of proposed effluent treatment options for production of trout Oncorhynchus mykiss in flow-through systems. Aquac. Eng. 2005, 32, 303–323. [Google Scholar] [CrossRef]
- Frimpong, E.A.; Lochmann, S.E.; Bodary, M.J.; Stone, N.M. Suspended solids from baitfish pond effluents in drainage ditches. J. World Aquac. Soc. 2004, 35, 159–166. [Google Scholar] [CrossRef]
- Best Aquaculture Practices. Available online: http://www.gaalliance.org/bap/standards.php (accessed on 2 December 2013).
- Boyd, C.E.B.; Lim, C.; Queiroz, J.; Salie, K.; de Wet, L.; McNevin, A. Best Management Practices for Responsible Aquaculture; Aquaculture Collaborative Research Support Program: Bethesda, MD, USA, 2008; p. 47. [Google Scholar]
- Draft Code of Conduct for Responsible Aquaculture in the U.S. Exclusive Economic Zone. Available online: https://www.federalregister.gov/articles/2002/10/03/02-25173/draft-code-of-conduct-for-responsible-aquaculture-in-the-u-s-exclusive-economic-zone (accessed on 27 January 2014).
- Diana, J.S.; Egna, H.S.; Chopin, T.; Peterson, M.S.; Cao, L.; Pomeroy, R.; Verdegem, M.; Slack, W.T.; Bondad-Reantaso, M.G.; Cabello, F. Responsible aquaculture in 2050: Valuing local conditions and human innovations will be key to success. BioScience 2013, 63, 255–262. [Google Scholar] [CrossRef]
- Hambrey, J.; Phillips, M.; Chowdhury, M.K.; Shivappa, R.B. Composite Guidelines for the Environmental Assessment of Coastal Aquaculture Development. Prepared for the Secretariat for East Africa Coastal Area Management. 1999, Voluem 2. Available online: http://www.fao.org/fishery/gisfish/cds_upload/1151336041816_Hambrey__1999_.pdf (accessed on 2 December 2013).
- Ghana Water Resources Commission. Technical Guidelines for Sustainable Cage Aquaculture; Water Resources Commission: Accra, Ghana, 2013. [Google Scholar]
- Ansah, Y.B.; Frimpong, E.A.; Amisah, S. Characterisation of potential aquaculture pond effluents, and physico-chemical and microbial assessment of effluent-receiving waters in central Ghana. Afr. J. Aquatic Sci. 2013, 38, 1–8. [Google Scholar]
- Ansah, Y.B.; Frimpong, E.A.; Amisah, S. Biological assessment of aquaculture effects on effluent-receiving streams in Ghana using structural and functional composition of fish and macroinvertebrate assemblages. Environ. Manag. 2012, 50, 166–180. [Google Scholar] [CrossRef]
- Louisiana State University AgCenter. Aquaculture Production Best Management Practices; LSU AgCenter Research and Extension: Baton Rouge, LA, USA, 2003. [Google Scholar]
- Cole, B.A.; Boyd, C.E. Feeding rate, water quality, and channel catfish production in ponds. Progress. Fish-Cult. 1984, 48, 25–29. [Google Scholar]
- McMahon, T.; Zale, A.; Orth, D. Aquatic habitat measurements. Fish. Tech. 1996, 2, 83–115. [Google Scholar]
- Eaton, A.D.; Clesceri, L.S.; Rice, E.W.; Greenberg, A.E. Standard Methods for Examination of Water & Wastewater, 21st ed.; American Public Health Association, American Water Works Association, and Water Environment Federation: Washington, DC, USA, 2005. [Google Scholar]
- Her Majesty’s Stationery Office (HMSO). The Determination of Chlorophyll-a in Aquatic Environments; HMSO Publications: London, UK, 1983.
- Seim, W.; Boyd, C.; Diana, J. Environmental considerations. In Dynamics of Pond Aquaculture; Chemical Rubber Company (CRC) Press: Boca Raton, FL, USA, 1997; pp. 163–182. [Google Scholar]
- Tucker, C.S.; Hargreaves, J.A.; Boyd, C.E. Better Management Practices for Freshwater Pond Aquaculture. In Environmental Best Management Practices for Aquaculture; Tucker, C.S., Hargreaves, J.A., Eds.; Wiley-Blackwell: Hoboken, NJ, USA, 2008; pp. 151–226. [Google Scholar]
- Odum, W.E. Environmental degradation and the tyranny of small decisions. BioScience 1982, 32, 728–729. [Google Scholar] [CrossRef]
© 2014 by the authors; licensee MDPI, Basel, Switzerland. This article is an open access article distributed under the terms and conditions of the Creative Commons Attribution license (http://creativecommons.org/licenses/by/3.0/).
Share and Cite
Frimpong, E.A.; Ansah, Y.B.; Amisah, S.; Adjei-Boateng, D.; Agbo, N.W.; Egna, H. Effects of Two Environmental Best Management Practices on Pond Water and Effluent Quality and Growth of Nile Tilapia, Oreochromis niloticus. Sustainability 2014, 6, 652-675. https://doi.org/10.3390/su6020652
Frimpong EA, Ansah YB, Amisah S, Adjei-Boateng D, Agbo NW, Egna H. Effects of Two Environmental Best Management Practices on Pond Water and Effluent Quality and Growth of Nile Tilapia, Oreochromis niloticus. Sustainability. 2014; 6(2):652-675. https://doi.org/10.3390/su6020652
Chicago/Turabian StyleFrimpong, Emmanuel A., Yaw B. Ansah, Stephen Amisah, Daniel Adjei-Boateng, Nelson W. Agbo, and Hillary Egna. 2014. "Effects of Two Environmental Best Management Practices on Pond Water and Effluent Quality and Growth of Nile Tilapia, Oreochromis niloticus" Sustainability 6, no. 2: 652-675. https://doi.org/10.3390/su6020652
APA StyleFrimpong, E. A., Ansah, Y. B., Amisah, S., Adjei-Boateng, D., Agbo, N. W., & Egna, H. (2014). Effects of Two Environmental Best Management Practices on Pond Water and Effluent Quality and Growth of Nile Tilapia, Oreochromis niloticus. Sustainability, 6(2), 652-675. https://doi.org/10.3390/su6020652