1. Introduction
There has been increasing diversity in household profiles in the last few decades, due to major changes in contemporary lifestyles. Consequently, dwellers are no longer satisfied with standardized houses, and there is a growing demand for housing products that are able to meet individual needs [
1]. Indeed, previous studies on the housing market of different countries, such as Brazil [
2,
3], México [
4], and U.K. [
5], indicate that standard products often lead to dwellers dissatisfaction. In this context, the application of the Mass Customization (MC) strategy can potentially increase the value of housing, by delivering products that fulfill specific requirements of different customers through flexible process and organizational structures with delivery times and costs similar to mass production [
6,
7,
8,
9]. This strategy has been successfully applied by some house-building companies from different countries, including U.K. [
5,
10], Netherlands [
11], México [
4], Brazil [
12,
13], and especially Japan [
14,
15].
In mass customization, organizations must identify attributes and options that can effectively generate value for clients [
9,
16]. One of the key decisions in MC is the level of customization of the product, which is determined by the range of choices that are offered to clients [
9]. On one hand, the boundaries between MC and craft production lies in limiting the range of choices so that efficiency in production can still be attained [
17]. On the other hand, clients’ perceived values must be considered for defining the range of options to be offered, since not all options might add value to clients [
17,
18].
However, not much has been published on how to determine the level of customization based on clients’ requirements and organizational capabilities [
9,
12,
19]. In fact, only a few studies have focused on the definition of attributes and options to be offered [
19]. In addition, those studies are mostly focused on demand forecast and suggestions based on clients’ prior preferences, instead of market segmentation [
19]. As a result, defining customizable attributes and options from a value generation perspective remains largely unexplored. This also applies to the housing sector, since house-building companies often define customizable options without a systematic analysis of clients’ profile and requirements [
12,
20].
This paper aims to address this gap by proposing a method to define value-adding attributes in customized housing projects, which can support decision-making regarding product attributes to be customized and the range of options to be offered. This method builds upon the means-end chain (MEC) conceptual model developed by Gutman [
21]. This model organizes product attributes, consequences from product use, and clients’ values in a hierarchical structure, normally represented by a tree diagram, named hierarchical value map (HVM) [
22,
23]. This map is a summary of information about value generation that might be used as a visual device for supporting decision-making [
22].
The MEC conceptual model was chosen due to some advantages in relation to some currently used tools and practices, such as Quality Function Deployment (QFD), and post occupancy evaluation surveys: (i) it is built upon an in-depth, well structured conceptualization of value [
21,
24]; (ii) it provides an understanding of value generation by explicitly exploring the consequences of products-in-use and the generation of benefits from the point of view of the final customers [
21,
24]; (iii) there are a number of data collection and processing techniques, known as laddering, that can be effectively used for generating hierarchical value maps [
25,
26,
27]; and (iv) hierarchical value maps can be refined and be used as visual devices to support decision making [
22,
28].
The proposed method was tested by applying it in the evaluation of two construction projects delivered by a small-sized construction company, based in the Metropolitan Region of Porto Alegre, Southern Brazil.
Besides improving value generation in house building projects, the development of the method aims to make a contribution in terms of making those types of projects environmentally and socially sustainable. Providing housing tailored to clients specific requirements’ can potentially reduce waste resulting from the changes carried out by dwellers after moving in. In addition, such changes often compromise air and lighting conditions [
20], thus eventually leading to increases in energy consumption. Finally, self-expression and personal identity have been pointed out as important qualities of dwellings [
16]. As a result, providing tailored housing can increase dweller sense of identity and ownership, thus improving care and maintenance and potentially expanding the dwelling life cycle.
2. Theoretical Framework
2.1. Defining the Scope of Customization in House Building
Rocha [
12] proposed a conceptual framework for devising customization strategies in the house-building sector, based on the adaptation of a set of concepts related to MC to the specific context of house-building. Three core categories of decision were proposed in this framework for defining the scope of customization: customization units, solution spaces, and classes of items. This set of decisions aims to define the product variants that will be offered to clients [
12].
“Customization units” are the building blocks of a customization strategy: they consist of customizable attributes of a product and the range of options to be offered to clients [
12]. Once customization units are defined, the processes for delivering each one of them must be defined [
9], as well as the visualization approach to be used,
i.e., how the customization units are presented to clients and internally to the organization [
12]. A key decision in the definition of the customization strategy is the order penetration point, in which the client order first enters the supply chain, differentiating the activities that are demand driven from the ones that are forecast driven [
29].
The “solution spaces” decision category defines how the customization units are combined or grouped. This decision category establishes the boundaries within which the customization units can vary, considering limitations in production capabilities [
17]. For each solution space, there might be a platform, as well as an order penetration point. A platform is the product part that remains unchanged throughout the different configurations of a product within a solution space [
30]. It is necessary to map the customization units and how these are combined so that the solution space can be clearly established in the customization strategy [
12].
The “classes of items” category expresses the different properties of the customization units based on the items contained in each one of them [
12]. Customization units can include a limited number of items for a given attribute (e.g., three options for color). Yet, as discussed in Rocha [
12], they can also be devised for clients to define any item for the attribute under consideration (e.g., specify any color). Finally, customization units might require the selection of an option or allow clients to refuse these options (e.g., no coloring).
The definition of the scope of customization must consider constraints in the production system, so that economies of scope can be achieved,
i.e., reductions in the average cost by producing a limited range of products that require similar operations [
17]. Therefore, there should be a balance between product flexibility, defined according to customers’ preferences, and the performance of the production system [
9,
18]. It means that it is necessary to understand the trade-offs between benefits provided to customers by customizing products and sacrifices such as increased cost or delivery time [
6,
17]. One of the key aspects for reaching success in the implementation of MC is the integration between different product development areas, such as design, marketing, production management, and supply chain management, since different types of decisions are involved in the definition and in the implementation of a customization strategy [
6,
9].
2.2. The Means-End Chain Model and the Laddering Technique
The means-end chain model was originally developed by Gutman [
21] to describe how consumers categorize information about products in the memory, seeking to understand their purchasing choices. Subsequently, Woodruff and Gardial [
24] expanded this conceptual model, considering not only the desired value upon purchase, but also the value received during the use of a product.
The means-chain model establishes an association between the characteristics of a product-in-use and the motivations that lead to consumption. According to Gutman [
21], the means are represented by the products or services in which individuals engage, and the ends are valued states of being. According to Reynolds and Olson [
31], the means-end chain model connects the concrete attributes of a product (tangible attributes) with the emotional and personal values (abstract and intangible objectives) through a chain with six levels of abstraction: concrete attributes, abstract attributes, functional consequences, psychological consequences, instrumental values and terminal values.
The concrete attributes are inherent to the product or service, and can be directly perceived (for example, color, brand name). Abstract attributes are aspects of the product or service that cannot be measured or perceived through the senses, such as quality or reputation [
23]. The functional consequences emerge from the direct relationship between the consumption of a product and the individual and are related to the utility of the product in a specific use situation [
32]. The psychosocial consequences are related to the ability of a product or service to satisfy intrinsic objectives that are symbolic, self-oriented or other-oriented,
i.e., projecting an image that is congruent with the norms of meanings of others [
32]. The instrumental values are intangible goals related to the behavioral means used to achieve the ends [
33]. Finally, the terminal values refer to desired end states (for example, happiness, security, accomplishment) [
21,
33].
The representation of these hierarchical levels through a visual device, such as a hierarchical value map, can help decision makers involved in the provision of a product to understand the value generation for the users of that product [
22]. There are several techniques that can be used for mapping the relationships between the product’s attributes, its consequences in use, and desired values, such as association pattern technique (APT), hard laddering [
25], and soft laddering [
25,
26,
27]. In this study, the soft laddering technique was chosen, due to its ability to cope with complex products, such as housing. This technique provides a rich picture of customers’ perceived value that can be used for generating new ideas.
The main source of evidence used in the soft laddering technique is a one-to-one interview, consisting mainly of questions like “why is this important to you?” [
26]. The term ladder expresses the main goal of this technique: to go from the more superficial to the deeper levels, from the more tangible to the more abstract levels by using open questions. The main outcome is a hierarchical structure for the attributes, consequences and values of a specific product in use. Reynolds and Gutman [
26] proposed five steps for the application of the soft laddering technique: (i) in-depth interviews; (ii) analysis of the content of the ladders, which is a sequence of answers by an interviewee to questions ranging from the attribute to the highest level of abstraction, and the codification of those answers in means-end chains; (iii) elaboration of the implication matrix, where the relations between the elements in the means-end chains are analyzed; (iv) construction of the hierarchical value map (HVM); and (v) interpretation.
3. Research Method
Design science research was the methodological approach adopted in this study. It is a form of scientific knowledge production that involves the development of innovative constructions, intended to solve problems faced in the real world, and simultaneously makes a kind of prescriptive scientific contribution [
34]. An important outcome of this type of research is an artifact that solves a domain problem, also known as solution concept, which must be assessed against criteria of value or utility [
35]. In this research study the proposed artifact is a method for defining value-adding attributes for customized housing, which can be used to support decision-making in the definition of the scope of customization.
Similar to the research process suggested by Lukka [
34] for design science research, this investigation was divided into four main phases: (i) choosing a relevant practical problem and understanding the topic from a theoretical point of view; (ii) devising the artifact; (iii) implementing the method in a practical situation; and (iv) analyzing the scope of applicability and the theoretical contribution of the solution.
Phase 1 started by understanding the context of the product development process of social housing. Initially, information about the housing provision programs in Brazil, especially from the My House My Life (Minha Casa Minha Vida) Program, was obtained from different sources: articles that reported previous research studies on low-cost housing, official documents about program procedures and minimum requirements, and a small number of open interviews with technical staff of the National Savings Bank (Caixa Econômica Federal), the financial organization that operates the funding for most low-cost housing programs in Brazil. Then, some information of the product development process carried out by the house building company involved in this investigation was obtained in two open interviews with the design manager of that company. The scope of product customization offered by the company was analyzed, based on leaflets, architectural drawings, and choice menus for previous projects. Moreover, the research team had access to an existing database of projects already delivered, which contained relevant information about the demand for customization, including client satisfaction surveys, post-occupancy complaints, and design changes demanded by clients.
The first version of the method was devised in Phase 2. The method was divided in several elements: a data collection protocol, a set of statistical techniques for analyzing the data, and some visual devices for presenting information. The development of the data collection protocol was based on previous studies concerned with the evaluation of low-cost housing in Brazil [
13,
28].
In Phase 3, the proposed method was tested considering the current context of the house-building company, This company was chosen due to the fact that it had a good reputation on the development and construction of low-cost housing projects, and adopted the strategy of customizing housing units in most projects. The company suggested two projects for implementing the method. These were chosen due to the availability of data about clients, and also because both were financed by housing provision programs that allowed the company to offer customized units. In both projects, the clients had three months to make a decision about the customization units. They were asked which changes they would like to make in the housing unit from a pre-set choice menu.
Table 1 presents an overview of the two projects.
Table 1.
Brief description of the two house-building projects.
Table 1.
Brief description of the two house-building projects.
| Project | Housing Program | Type of Housing Unit | Gross Floor Area | Number of Housing Units | Sample | Delivery Date |
|---|
| DL | Funding to Support Production | 1 and 2- bedroom apartments | 55 to 64 m2 | 64 | 32 | March 2008 |
| DE | Associative Credit | 2 and 3- bedroom apartments | 64 to 110 m2 | 20 | 10 | May 2009 |
Altogether, 42 housing units were selected for data collection, using the simple random sampling technique with finite population correction. This sampling technique can be used for reducing slightly the sample size when the population is small. The sampling error of 10% and the level of significance of 90% were adopted. For each unit, a face-to-face interview with one of the dwellers was carried out, and, when possible, direct observations of changes made in the apartments were undertaken.
Finally, in Phase 4, a discussion of the results in a one-hour meeting, using the visual displays produced by the method, was carried out with the participation of the design manager, two architectural designers and the company director. Based on that discussion and also on the analysis of the data collection and processing process, the applicability of the method was assessed.
4. Method for Defining Value-Adding Attributes in Customized Housing Projects
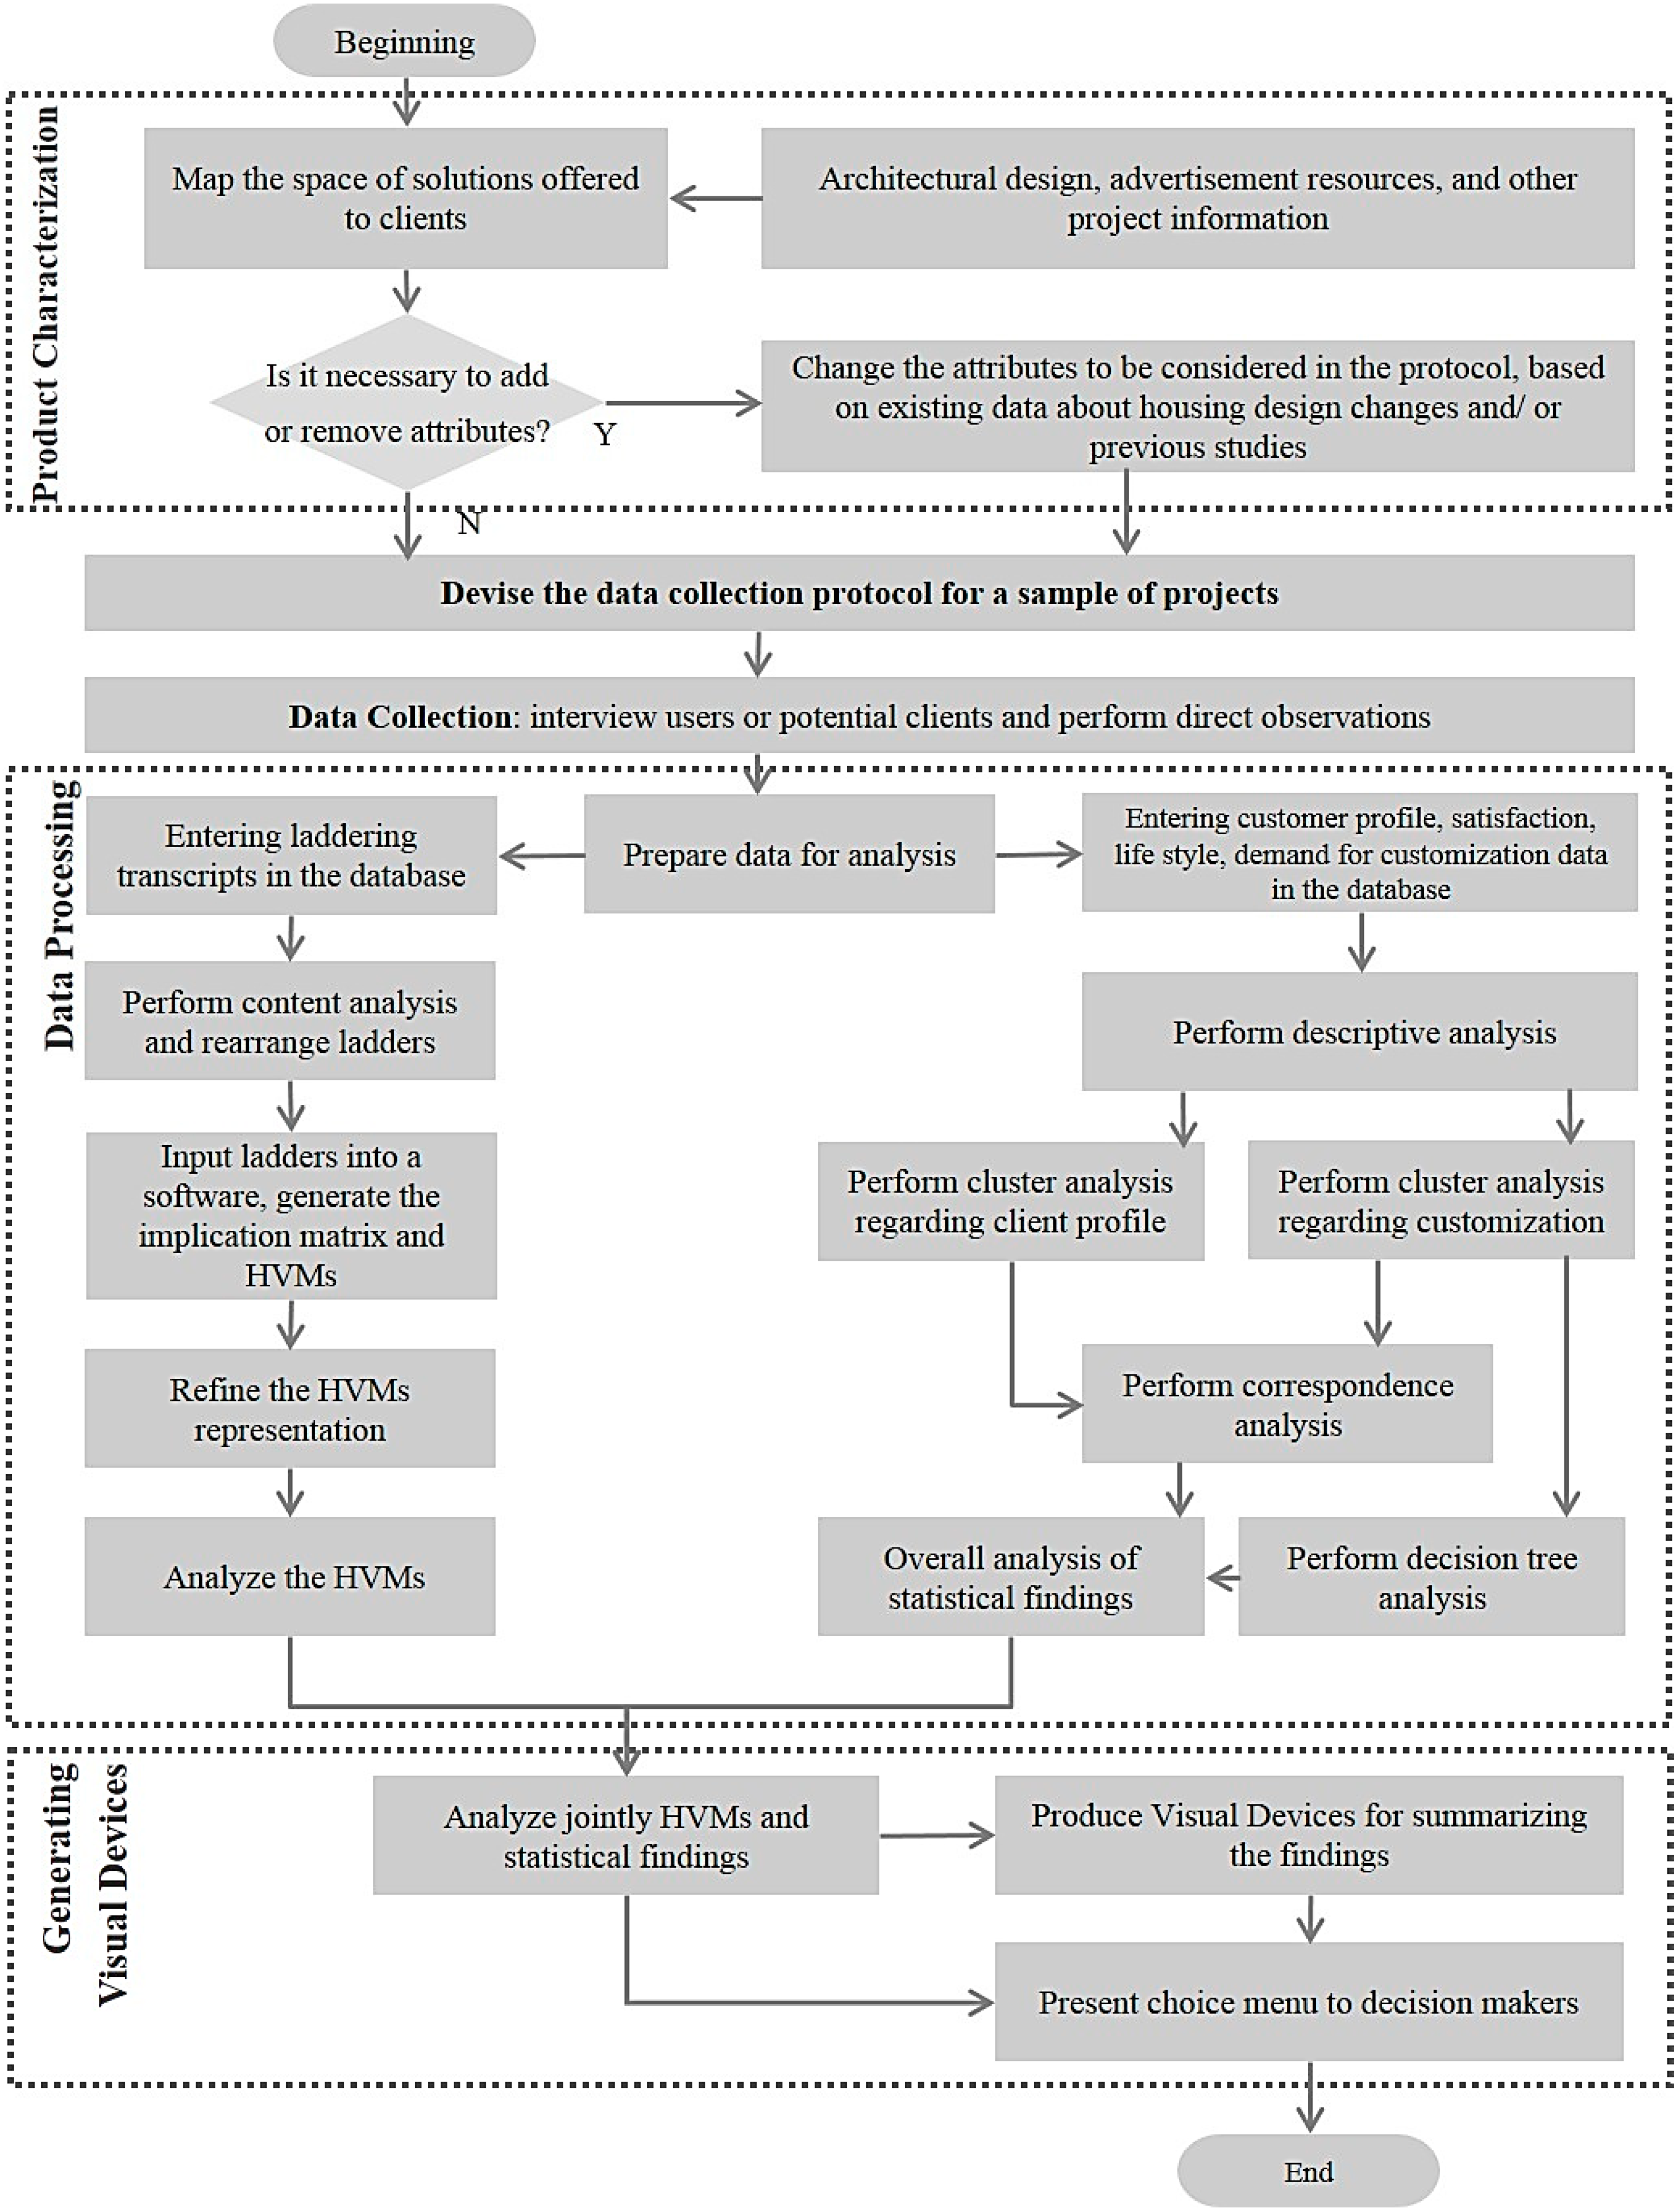
Figure 1 presents an overview of the proposed method for identifying value-adding customization units. The method has been devised for organizations interested in defining or refining the space of solutions to be offered in customized house-building projects. The method is divided into five main steps: (i) characterizing the housing products delivered in past projects; (ii) devising the data collection protocol; (iii) collecting data in a sample of house-building projects; (iv) data processing and analysis, including a number of statistical tests; and (v) producing visual devices to support decision making.
Figure 1.
Method for proposing value-adding attributes for customized housing.
Figure 1.
Method for proposing value-adding attributes for customized housing.
The characterization of the housing products consists of mapping the products being offered to the clients, mostly based on the architectural design, and on resources used to advertise the project, such as leaflets, and company website. Based on that information, a clear definition of the space of solutions offered to clients can be obtained. Some customization units can also be added or removed, based on additional data on customization demands obtained from other sources, such as post occupancy evaluations, and surveys with potential customers.
In the second and third steps, a data collection protocol is devised and applied in a sample of projects, which might be representative of one or more market segments in which the company operates. This data collection protocol comprises: a semi-structured interview with a sample of users on customer profile, evaluation of satisfaction, and demands for customization; sampling criteria; and guidelines for the direct observation of the housing units, buildings and surrounding areas.
Data processing, the fourth step, is initially divided into two main blocks: (i) the analysis of laddering data, focused on the three most important changes (made or desired) in the housing unit from the point of view of the dwellers; and (ii) statistical analysis of data about the customer profile and life style, demands for customization, and customer satisfaction.
As suggested by Reynolds and Gutman [
26], it is necessary to use a content analysis technique to identify a chain of connections between attributes, consequences and values, named ladders.
Table 2 presents a typical outcome of the laddering technique, after the codification that results from the content analysis. Reynolds and Gutman [
26] suggested that a cut-off point that represents 66% of the relationships should be considered in the map, while Gengler, Klenosky and Mulvey [
22] proposed that a balance should be achieved between reduction and retention of information. The cut-off point indicates the minimum number of times a link between two constructs has to be established by subjects in order to appear in the HVM [
26]. A software package can be used to support the production of hierarchical value maps—the
LadderUX software package has been successfully used in this research study.
Regarding statistical analysis, a wide range of techniques can be used.
Figure 1 presents the techniques used in this implementation of the method: descriptive analysis, cluster analyses, and correspondence analysis. However, depending on the aims of the evaluation, other techniques could be brought into the method. At the end of this step, an overall analysis of the statistical findings is made.
In the fifth step, a cross analysis of the hierarchical value maps and the results of the statistical analysis should be made. For instance, different hierarchical value maps can be produced for each cluster of dwellers. Finally, a number of visual devices are produced, including different hierarchical value maps and a choice menu, which summarize the data produced by the method.
Table 2.
Examples of ladders, codification and reordering.
Table 2.
Examples of ladders, codification and reordering.
| Raw data | Codified and reordered data |
|---|
| The wall painting didn’t give it much life; the white. More about the aesthetics. Much lower quality paint. Feeling good. | ALL ROOMS | WALL FINISHING | QUALITY OF MATERIALS | HYGIENE | |
| A place to rest. Like a clean and well looked after room. Well-being | AESTHETICS | RESTING AND ENJOYING ONE’S FREE TIME | WELL-BEING |
5. Implementation of the Method in an Empirical Study
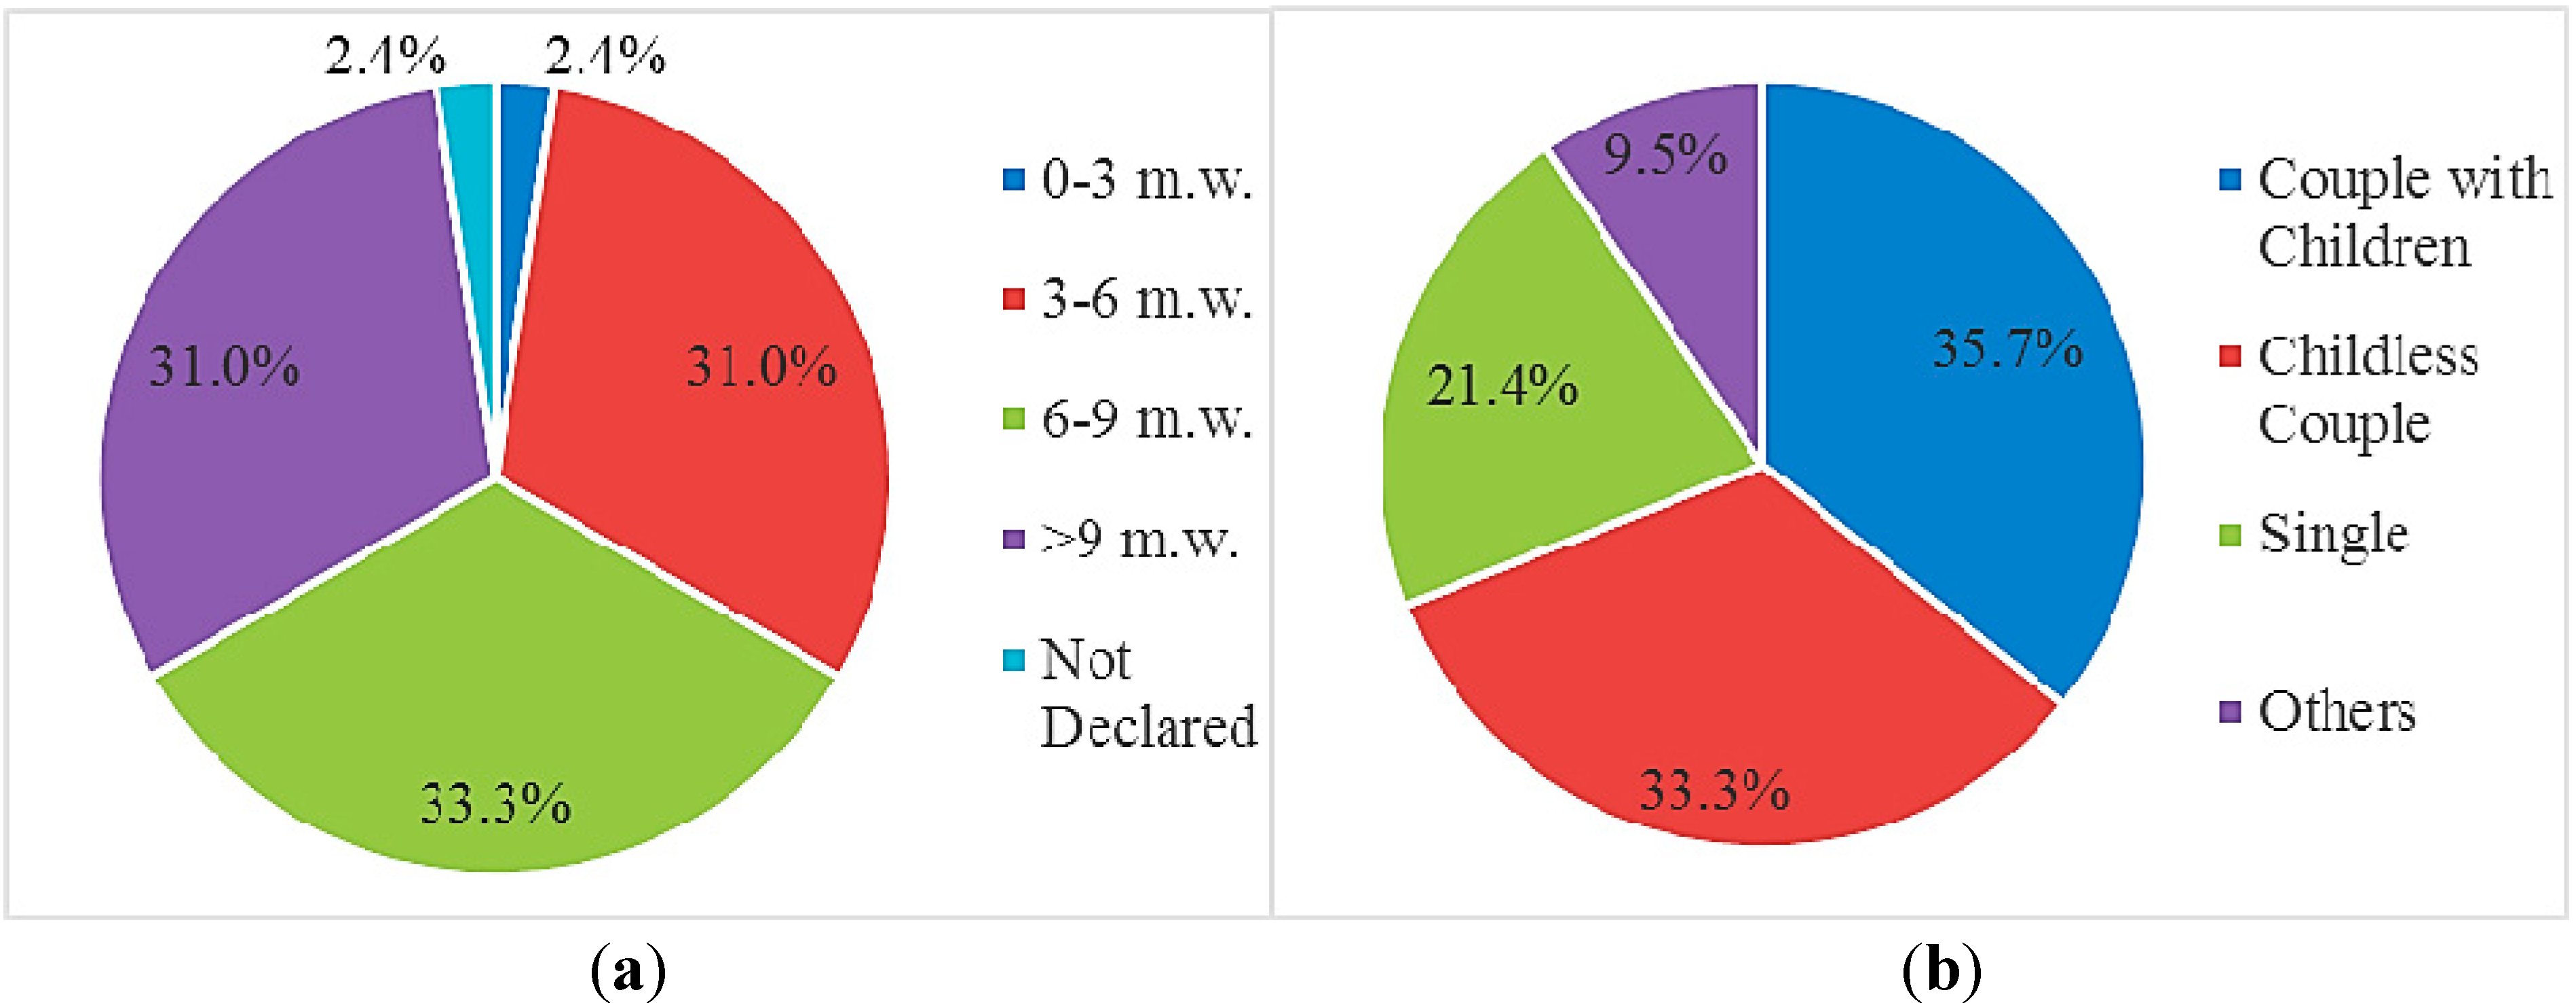
5.1. Customer Profile
The majority of the families in the two projects were small ones: 90% of them had up to three members, and 36% consisted of couples with children (
Figure 2a). However, there was much diversity in the configuration of families, as shown in
Figure 2a, confirming the results of the research studies carried out by Formoso, Leite and Miron [
3] and Villa [
36]. In terms of family income, the large majority of families earned more than the equivalent of three minimum wages (m.w.); most of them earning between six and nine minimum wages (
Figure 2b).
Figure 2.
Profile of the families: (a) configuration and (b) income (minimum wages).
Figure 2.
Profile of the families: (a) configuration and (b) income (minimum wages).
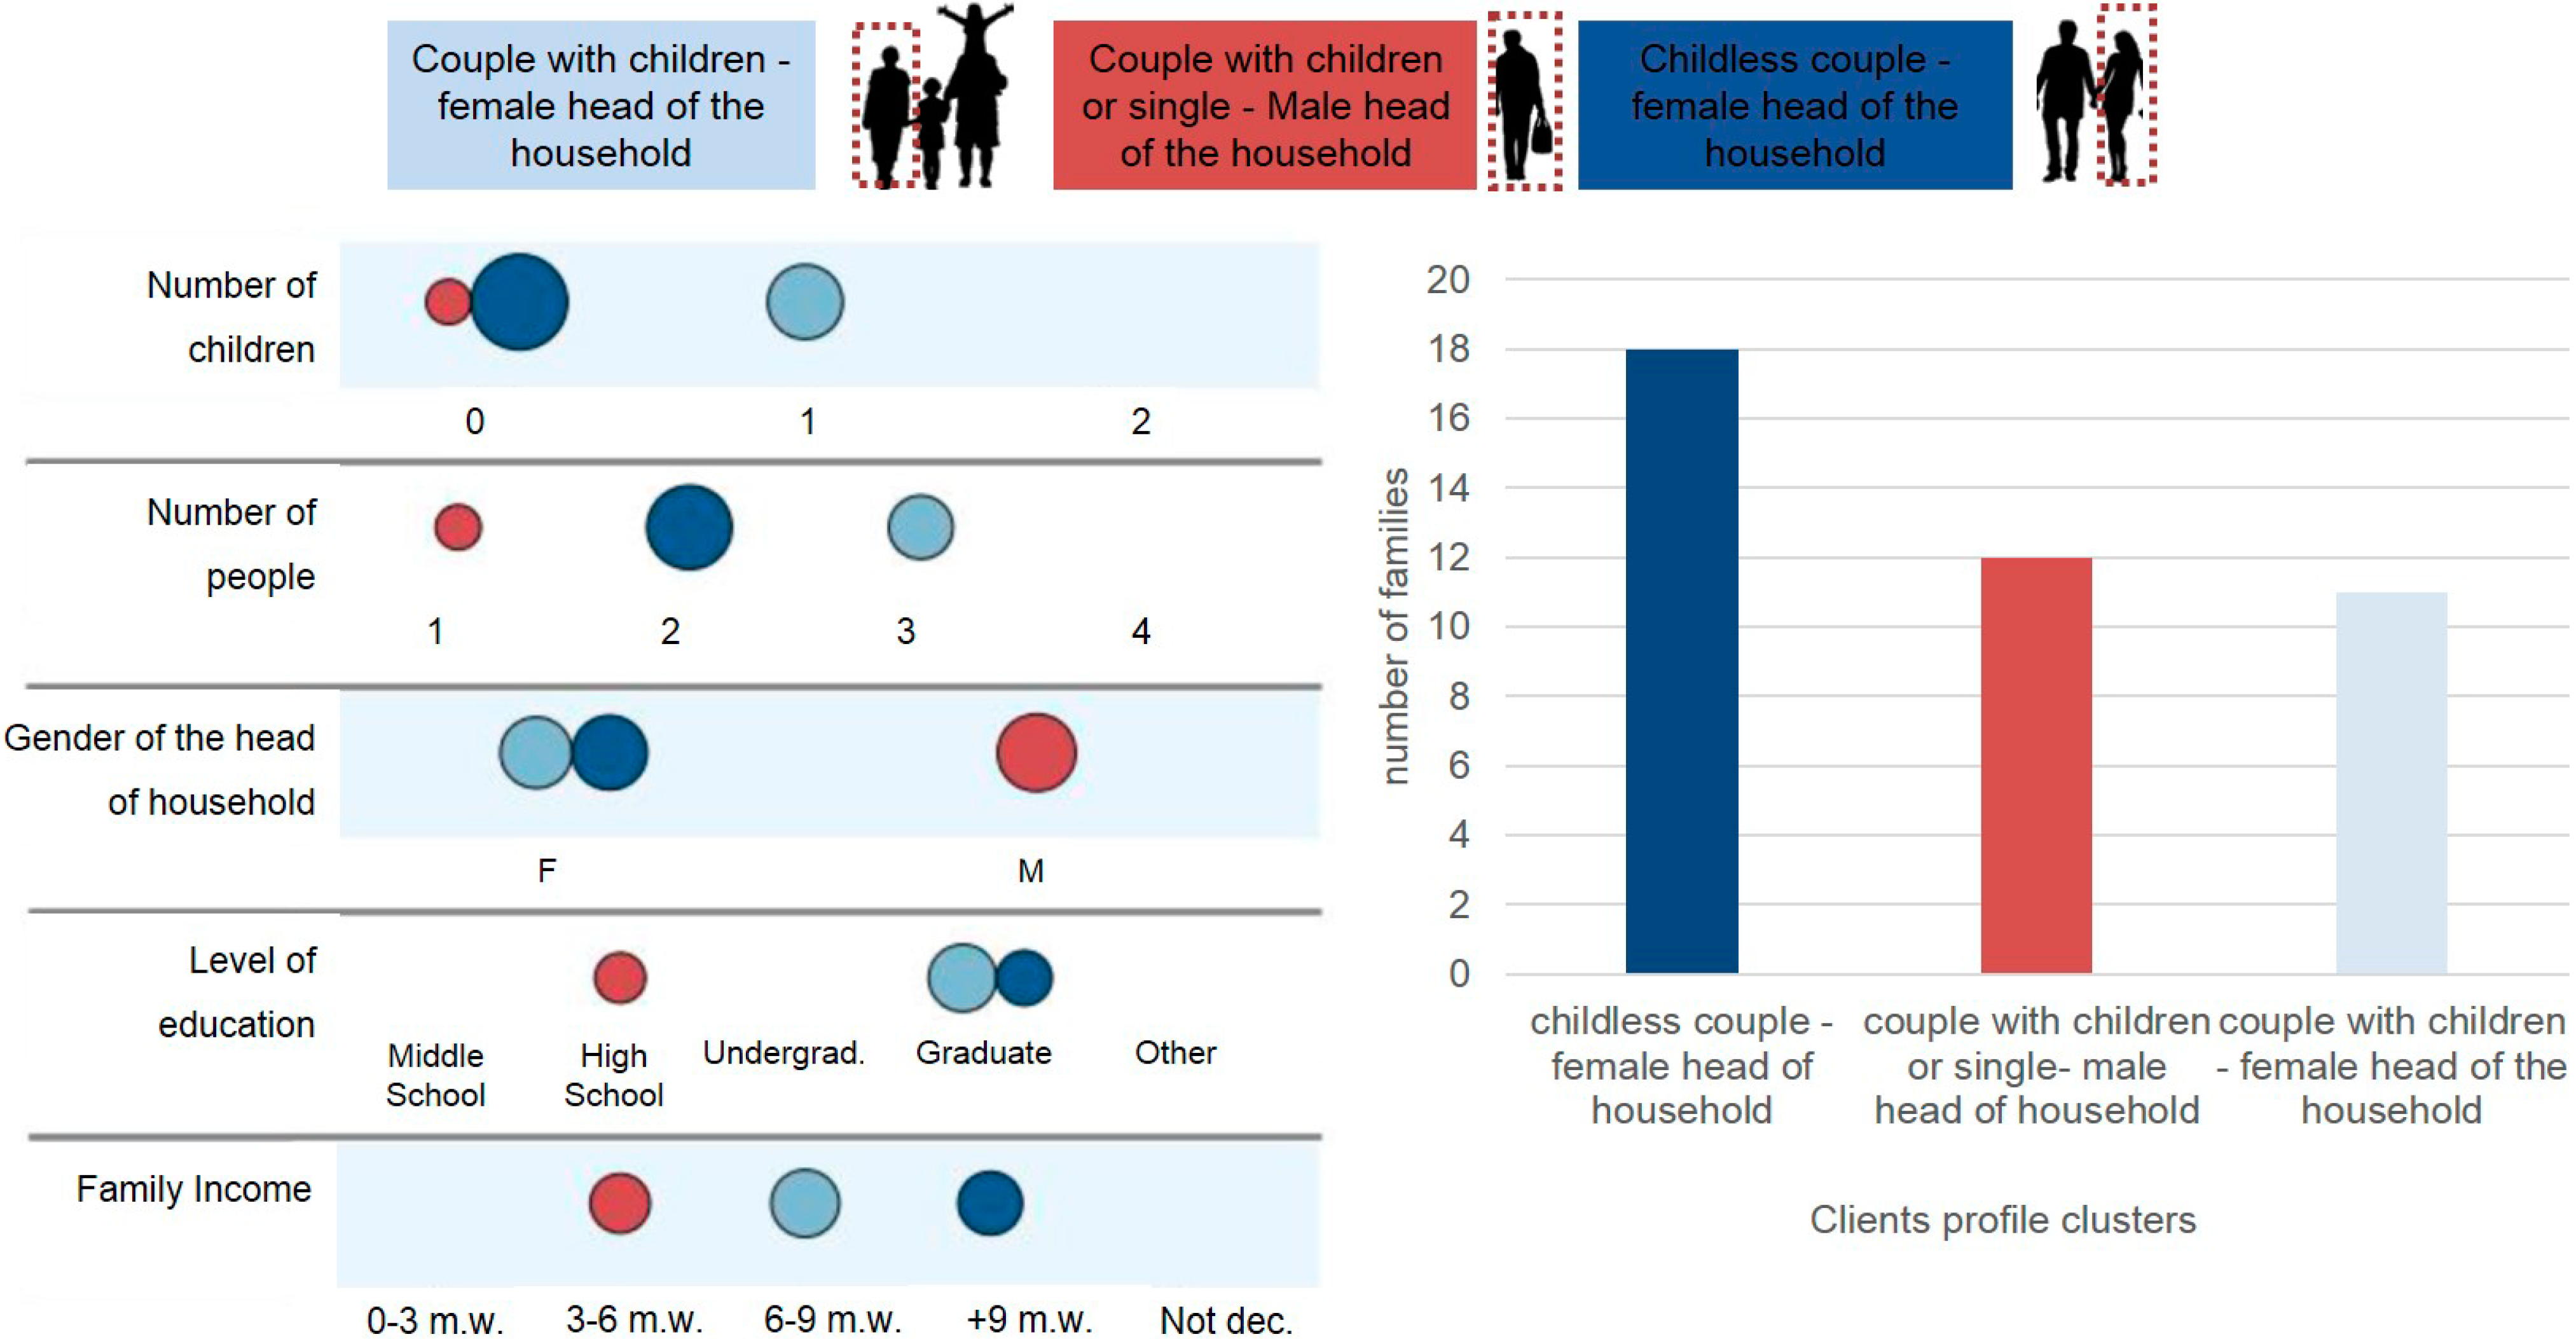
A two-step cluster analysis was performed using the customers profile information, such as family configuration, income, gender of the head of the household and amount of children.
Figure 3 compares three customer profile clusters that were identified: (i) couples with children, in which a female is the head of household (18 families); (ii) family in which a male was the head of household—either couples with children or singles (12 families); (iii) childless couples in which a female is the head of household (11 families). Those clusters represent 97.61% of the sample (41 families). An average silhouette measure of cohesion and separation of 0.3 was obtained, indicating that the quality of the cluster solution was fair. In both clusters that had women as heads of household, she predominantly had a university degree. In terms of income, the households headed by men had the lowest income, and the households without children the highest.
Figure 3.
Comparison of customer profile clusters.
Figure 3.
Comparison of customer profile clusters.
5.2. Frequency of Product Changes
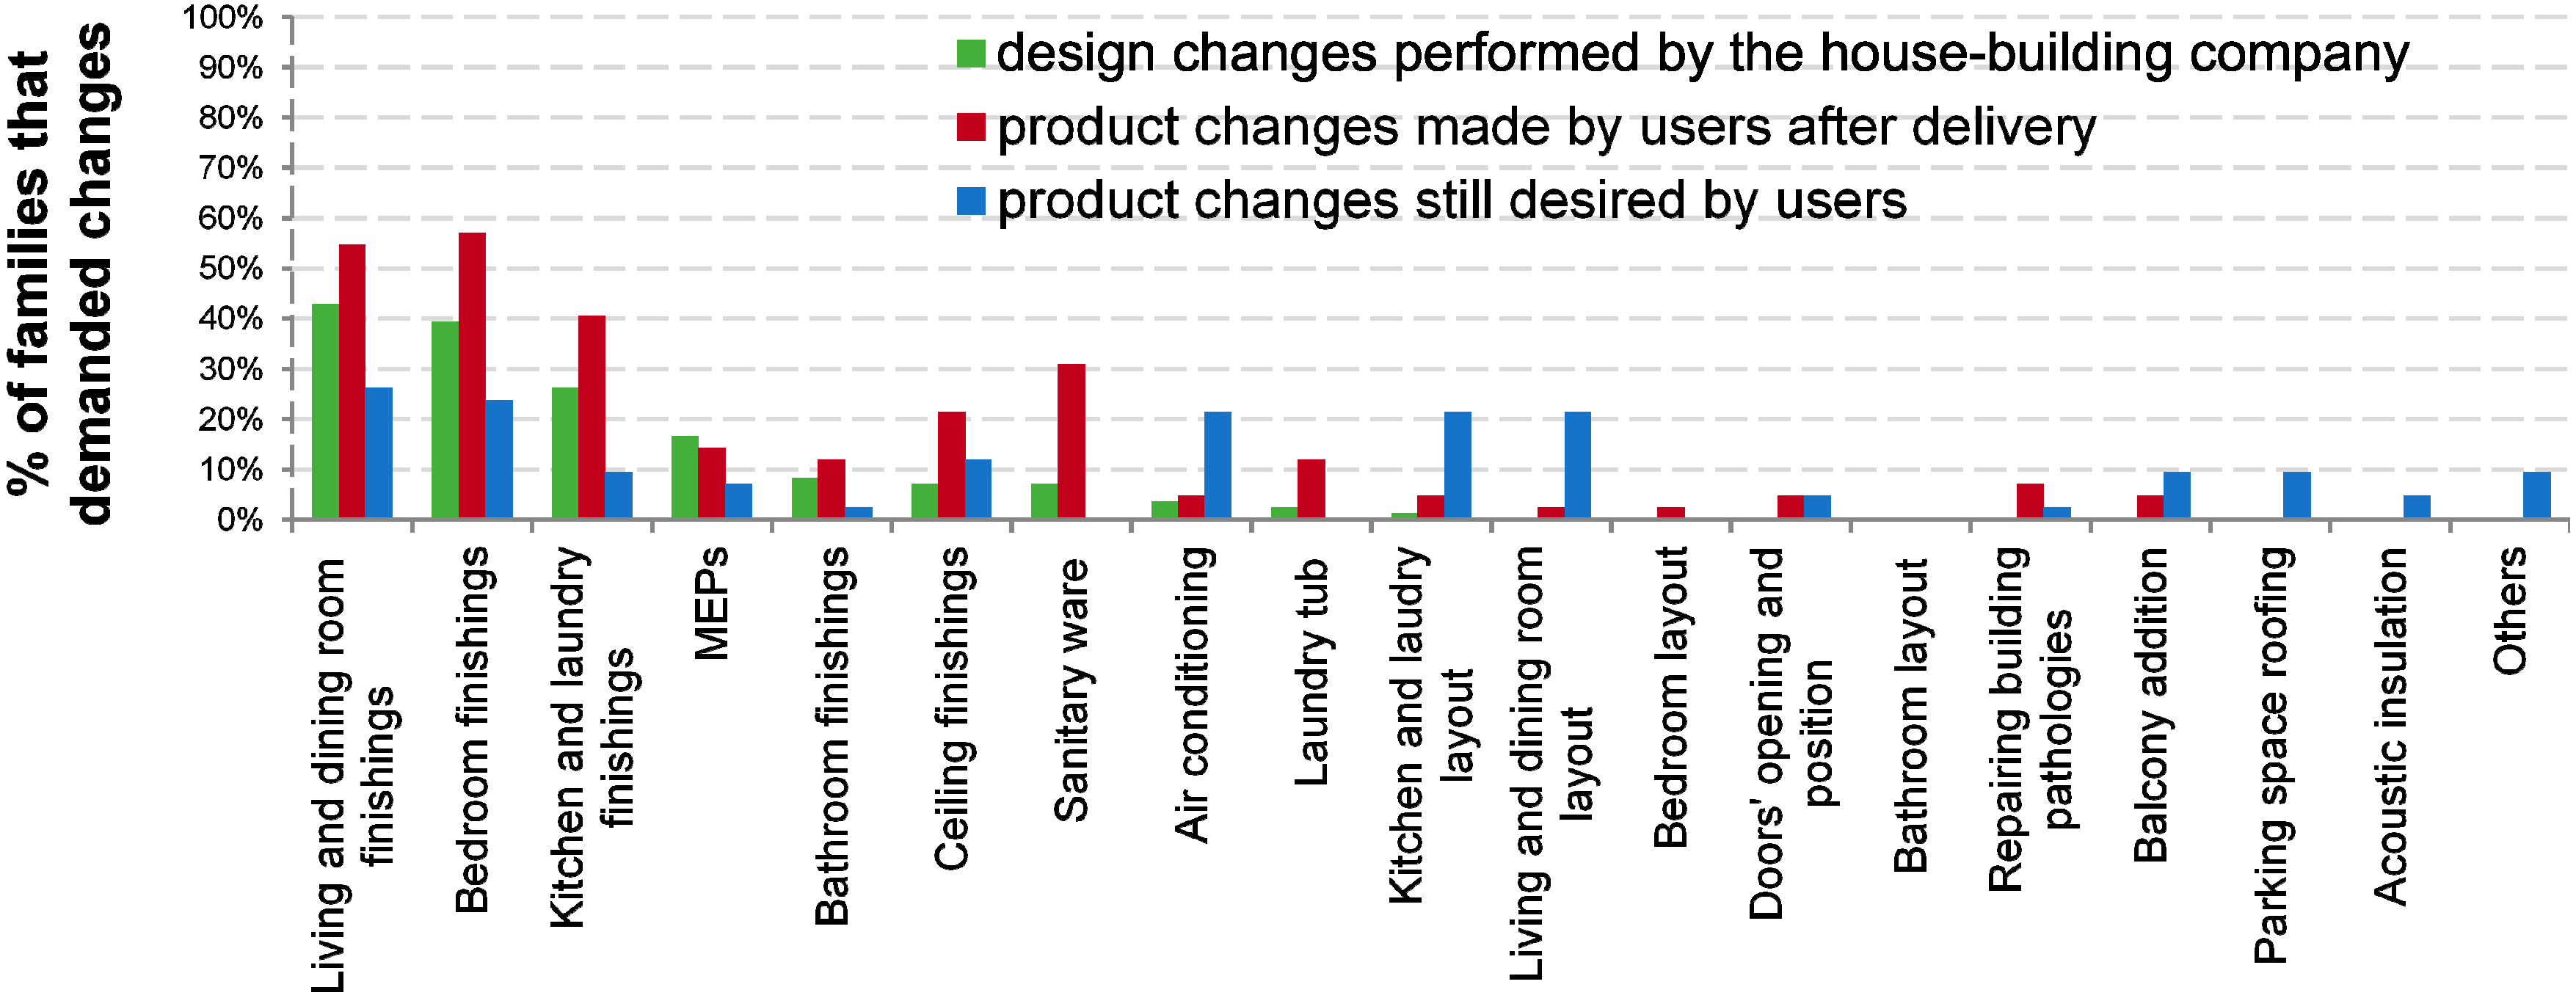
For the analysis of the frequency, three types of product changes were considered: (i) asked by the client at the design stage as product specifications and carried out by the company; (ii) made by users after delivery; (iii) still desired by users.
Table 3 describes the solution space offered by the house building company, and compares it to the product changes made or desired by users. It is worth noting that for most of the design changes made by the company an extra payment was required. Both
Table 3 and
Figure 4 indicate that most product changes demanded or performed by users after delivery had been offered by the house building company before sale. This might indicate that some of the clients were not aware of the customization units or classes of items offered by the company. In other cases, users decided to choose an option (e.g., finishings) that was not among the ones offered by the company.
Table 3.
Comparison of customization units and options offered by the house building company with product changes made or desired by users.
Table 3.
Comparison of customization units and options offered by the house building company with product changes made or desired by users.
| Customization Units | Design Changes Performed by House Building Company | Product Changes Made or still Desired by Users |
|---|
| Kitchen and laundry room wall finishings | Standard (ceramic tiles up to half-height), or ceramic tiles up to ceiling | Ceramic tiles up to ceiling, or washable and anti-mold paint |
| Kitchen and laundry room floor finishings | Standard (Ceramic tiles) or porcelain tiles | Ceramic tiles, or porcelain tiles |
| Living and dining room floor finishings | Standard (none), ceramic tiles or wood veneer | Ceramic tiles, porcelain tiles or wood veneer floor |
| Living and dining room wall finishings | | Other colors, or washable and anti-mold paint |
| Bedroom floor finishings | Standard (none), ceramic or wood veneer | Ceramic tiles, porcelain tiles or wood veneer |
| Bedroom wall finishings | | Other colors, or washable and anti-mold paint |
| Bathroom floor finishings | Standard (Ceramic tiles), or porcelain tiles | Ceramic tiles, or porcelain tiles |
| Ceiling finishing | Standard (Painted slab), or Gypsum lining on the living and dining room | Anti-mold paint, or gypsum lining in all rooms |
| Sanitary ware (sink and toilet) | Standard (colonial line), laguna line and valentina line | Sink over a cabinet, other lines |
| Laundry tub | | Remove for installing a washing machine, or change for a new one |
| Electrical Services | Change voltage, change stove and hood outlets position | Change voltage, change outlet position, change wiring |
| Cable TV | | Installation of cable TV |
| Air conditioning | Include outlets | Include outlets and installation, and desire for more spots |
| Kitchen and Living and dining room Layout | Standard in DE (Segregated), or Standard in DL, optional in DE (American kitchen) | Desire for an open-plan kitchen |
| Doors (opening and position) | - | Change the kitchen door for a sliding door or removing it |
| Building envelop | - | Repair cracks and ineffective window sealing |
| Balcony | - | Desire for a balcony |
| Parking space roof | - | Desire to have roof in the parking space |
| Acoustic insulation for slabs and between housing units walls | - | Desire for acoustic insulation |
| Other | - | Desire for radiant floor heating, paint doors and change doorknobs, and add a bedroom |
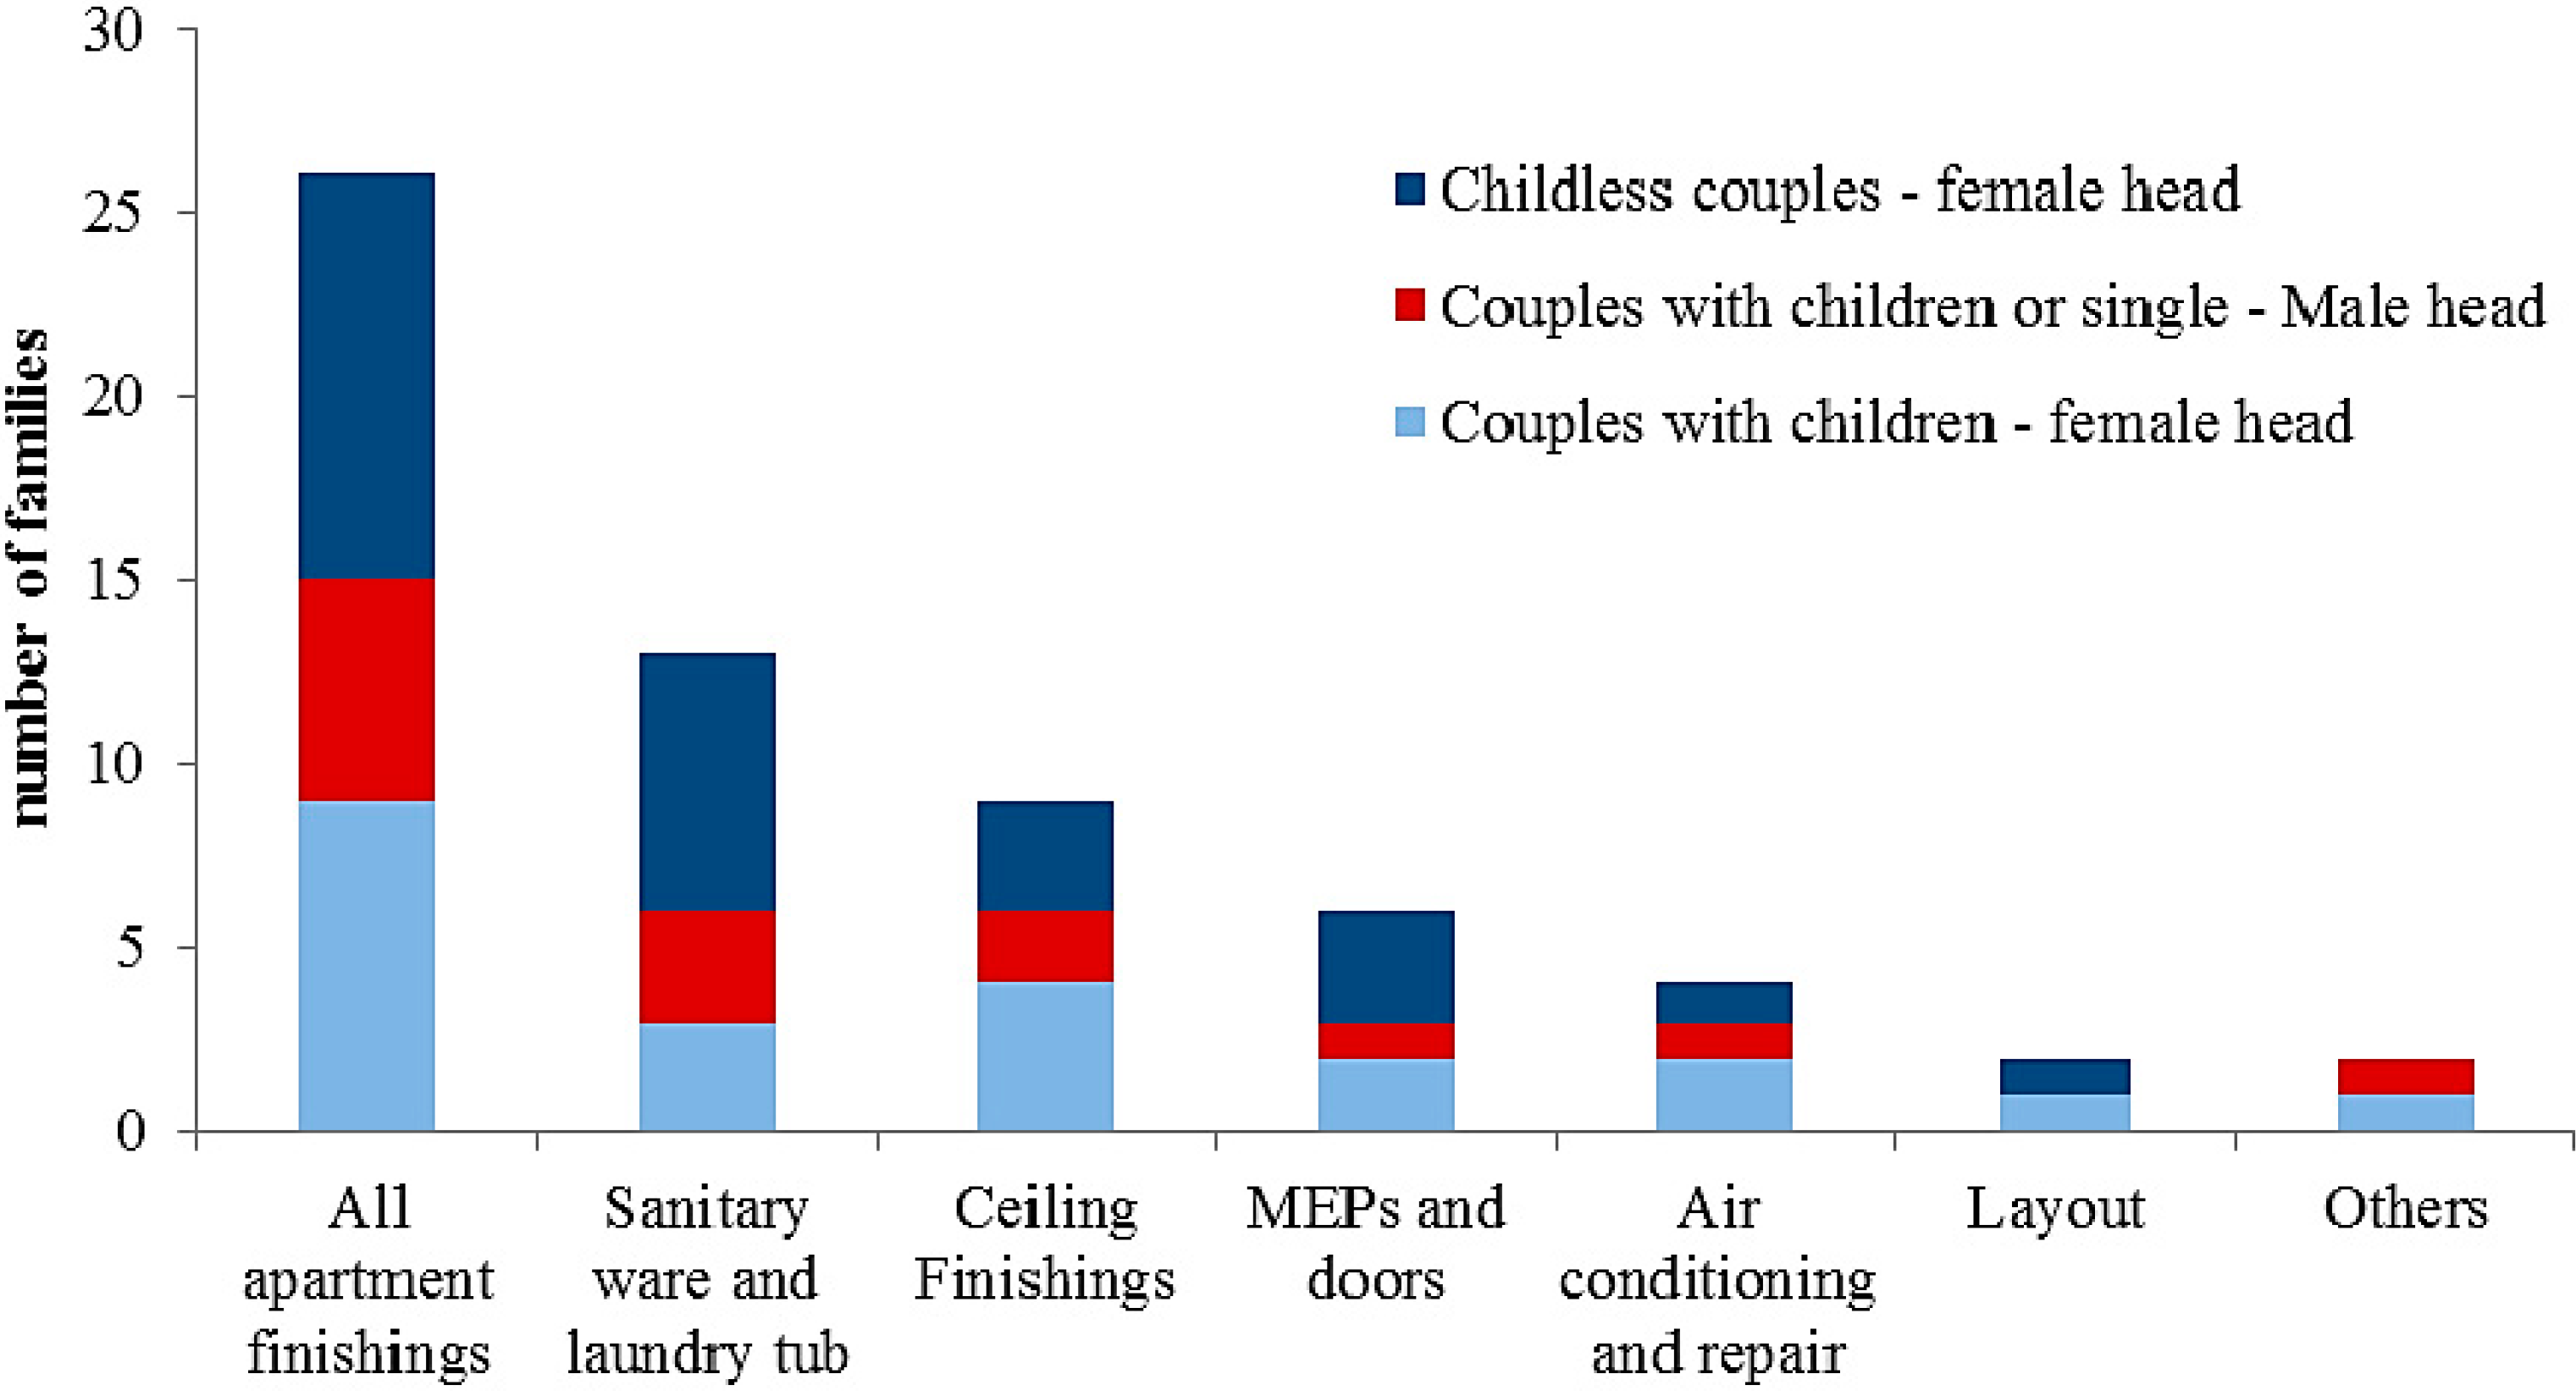
As shown in
Figure 4, the most frequent changes made or desired in the housing units were concerned with finishings. Regarding the living and dining room, and the bedroom, even though around 40% of the housing units had customized floors at the design stage, approximately 55% of the users performed changes in the wall and floor finishings of those rooms after delivery, and 25% still desire those product changes. The need for those customizations may be related to the lifestyle of users, who tend to privilege social interaction and entertainment in those areas. It is worth noting that some of the product changes were the result of a number of necessary repairs due to building pathologies, such as cracks, ineffective window sealing, low quality of painting, and poor acoustic insulation.
Figure 4.
Percentage of families that demanded design changes before construction, or that made or still desire product changes after delivery.
Figure 4.
Percentage of families that demanded design changes before construction, or that made or still desire product changes after delivery.
In the case of the laundry and kitchen finishings, all units were delivered with ceramic tiles on the floor and walls up to half-height, which had specifications changed by customer demand in 25% of the units. Forty percent of customizations made after delivery of the unit consisted mostly of painting the walls or completing the tiles up to the ceiling. According to the respondents, their dissatisfaction with those finishings was due to the difficulty to clean and the low quality of the paint. Moreover, 30% of the users changed the sanitary ware after the purchase of the unit, due to aesthetics reasons.
Most of the desired items are related to attributes that the product does not have or are not feasible to provide due to technical reasons. For instance, the installation of air conditioning, desired by 20% of the dwellers was hindered because it would require changes in the façade, and due to the lack of capacity of the electricity grid. In fact, air conditioning had the lowest degree of satisfaction among all attributes due to the difficulty of adding additional equipment. Likewise, the integration of the living/dining room and kitchen, desired by 20% of users, was not possible due to the fact that the kitchen area is too small.
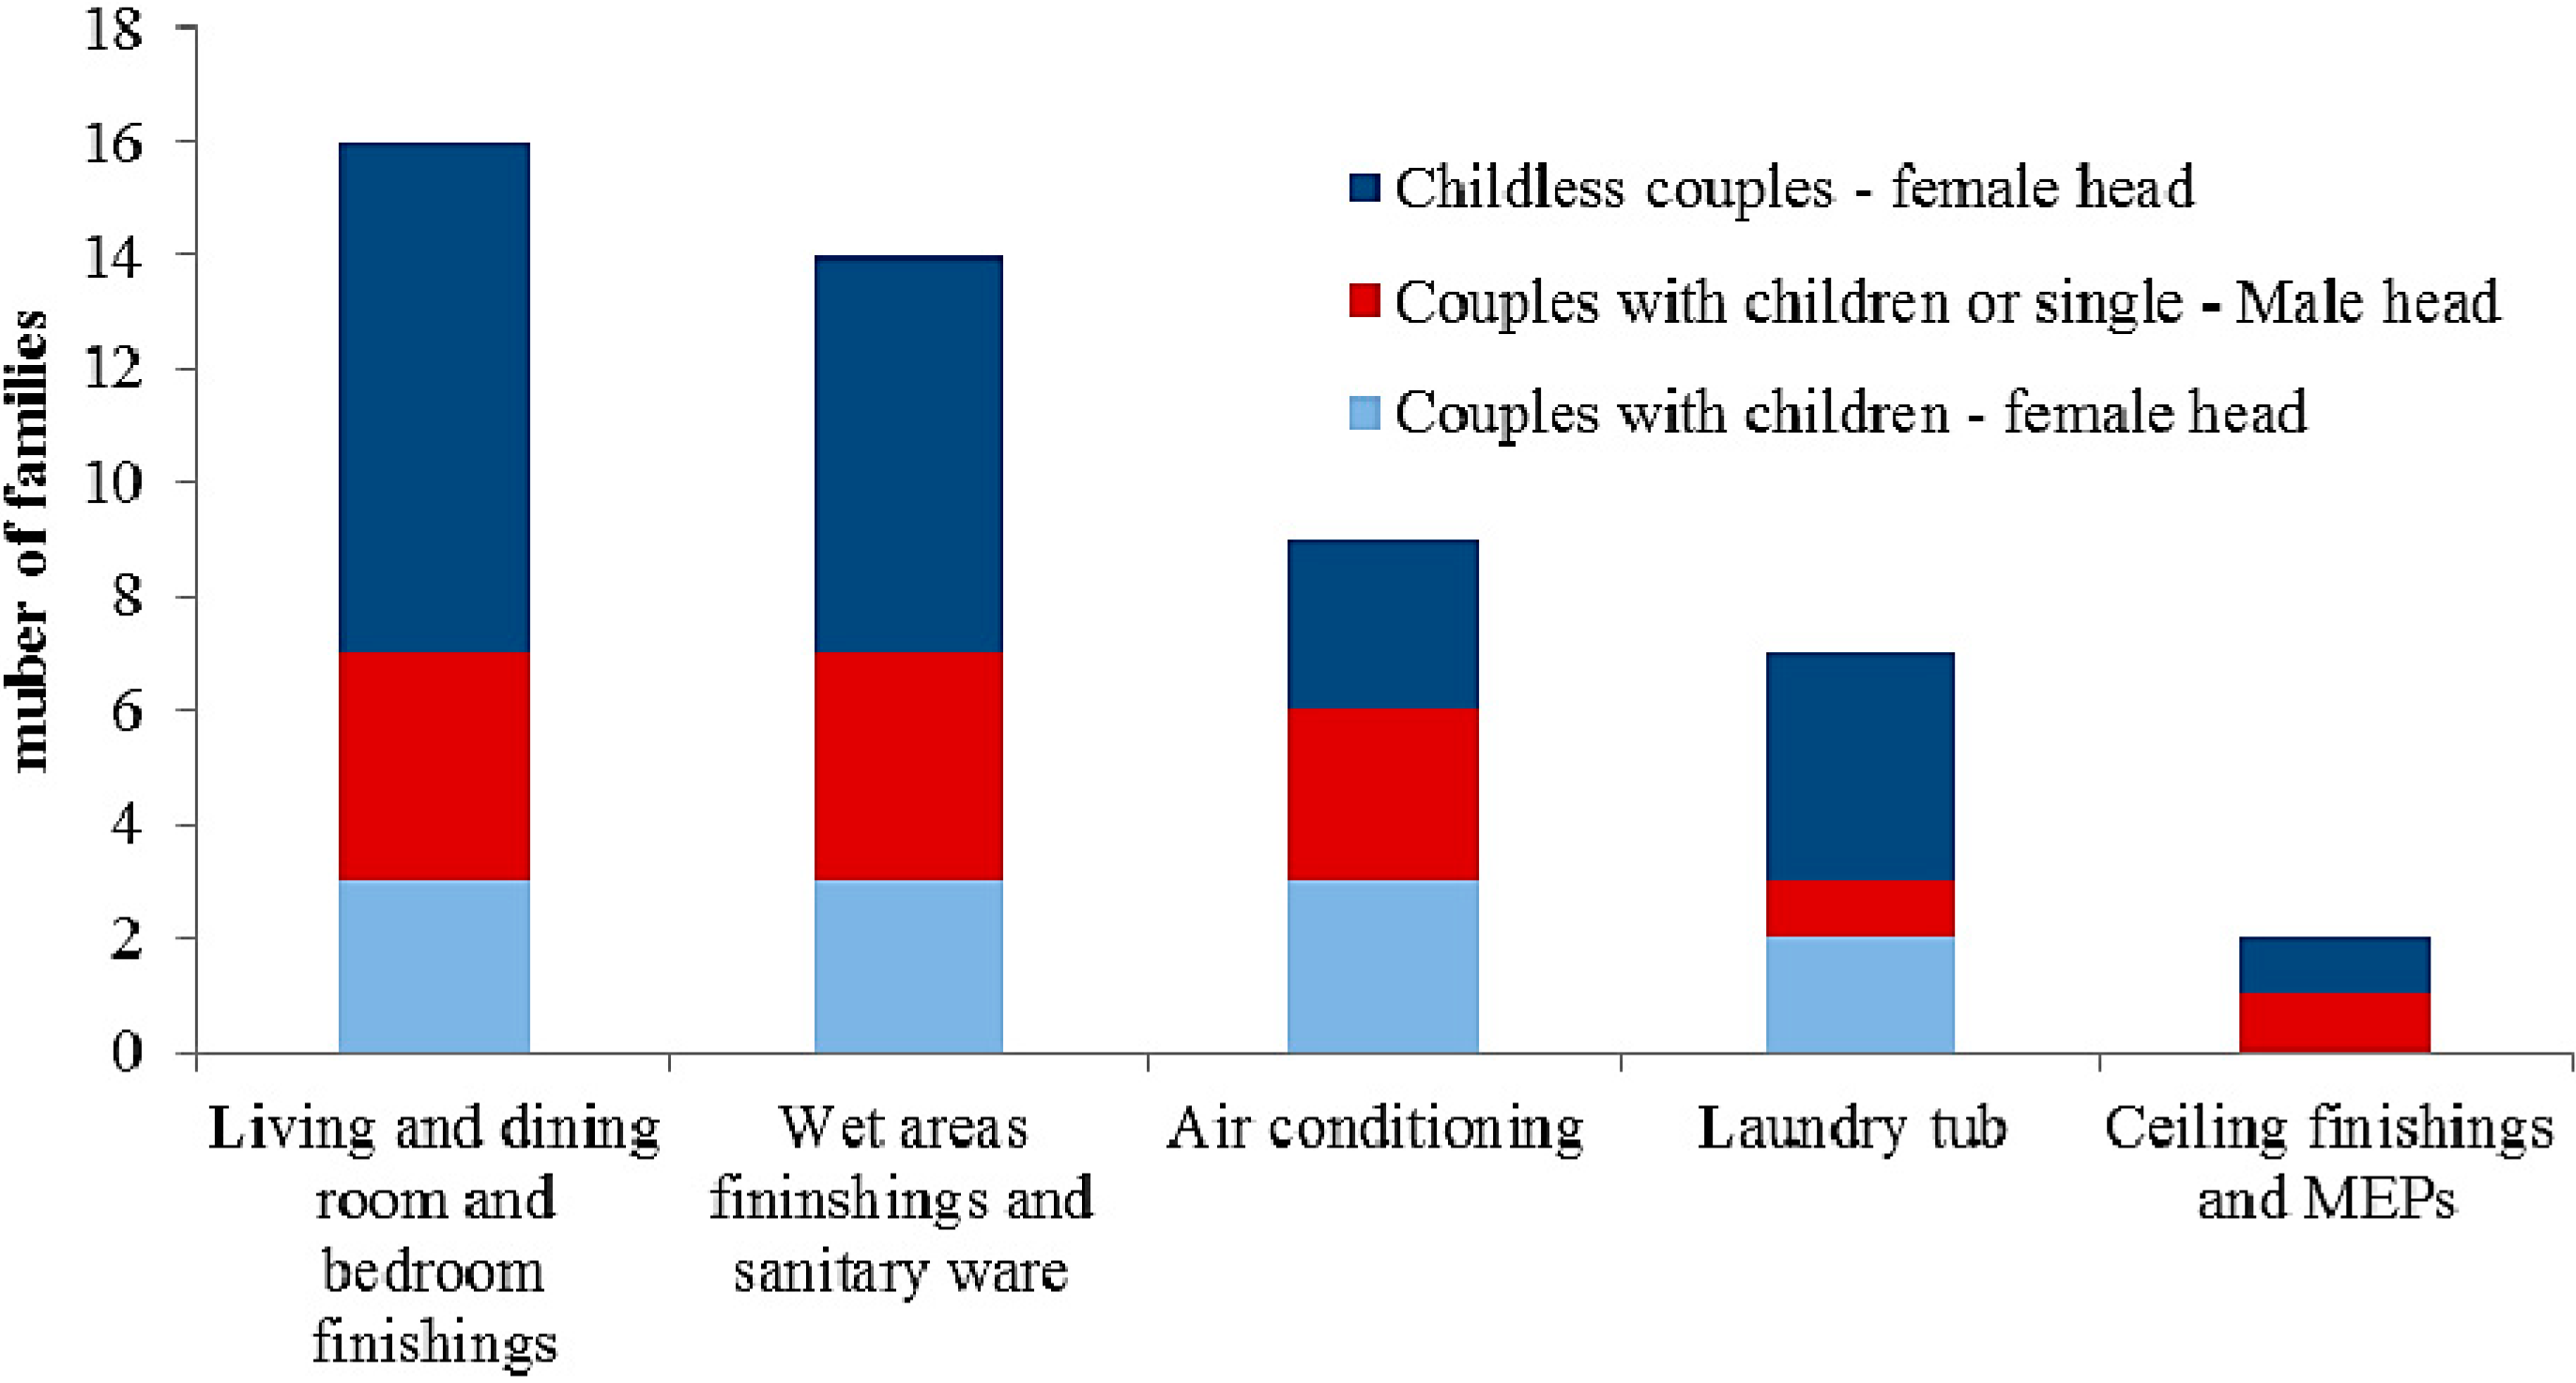
5.3. Clusters of Product Changes
Hierarchical cluster analyses were also performed for product changes with the aim of identifying which customization units were changed together. The association between customization units resulted in sets of clusters (
Table 4,
Table 5 and
Table 6): five clusters of design changes made by the house building company (Φ = 0.492 and 15 < δ < 25); seven clusters of product changes performed by users (Φ = 0.337 and 16 < δ < 25); and six clusters of product changes still desired (Φ = 0.308 and 19 < δ < 25). The phi coefficient (Φ) measures the association between categorical dichotomous variables, similar to the Pearson correlation coefficient for quantitative variables, and the distance between clusters is measured by the average linkage (δ) [
37]. The clusters were ordered from the most to the least frequently undertaken or desired product changes.
Table 4.
Clusters of design changes performed by house building company.
Table 4.
Clusters of design changes performed by house building company.
| Cluster Name/Frequency | Variables |
|---|
| Living and dining room and bedroom finishings 18 families (42.9%) | Living and dining room finishings and Bedroom finishings |
| Wet areas finishings and sanitary ware 15 families (35.7%) | Kitchen and laundry finishings, Bathroom finishings and Sanitary ware |
| Air conditioning/9 families (21.4%) | Air conditioning |
| Laundry tub/7 families (16.7%) | Laundry tub |
| Ceiling finishings and MEPs/2 families (2.4%) | Ceiling finishings and Mechanical electrical and plumbing installations |
Table 5.
Clusters of product changes made by users.
Table 5.
Clusters of product changes made by users.
| Cluster Name/Frequency | Variables |
|---|
| All apartment finishings/26 families (61.9%) | Kitchen and laundry finishings, Living and dining room finishings, Bedroom finishings and Bathroom finishings |
| Sanitary ware and laundry tub/14 families (33.3%) | Sanitary ware and Laundry tub |
| Ceiling Finishings/9 families (21.4%) | Ceiling finishings |
| MEPs and doors/7 families (16.7%) | Mechanical electrical and plumbing installations and Doors’ opening and position |
| Air conditioning and repairs/4 families (9.5%) | Air conditioning and Fixing building pathologies |
| Layout/2 families (2.4%) | Kitchen layout, Living and dining room layout and Bedroom layout |
| Others/2 families (2.4%) | Others (floor heating and add a bedroom) |
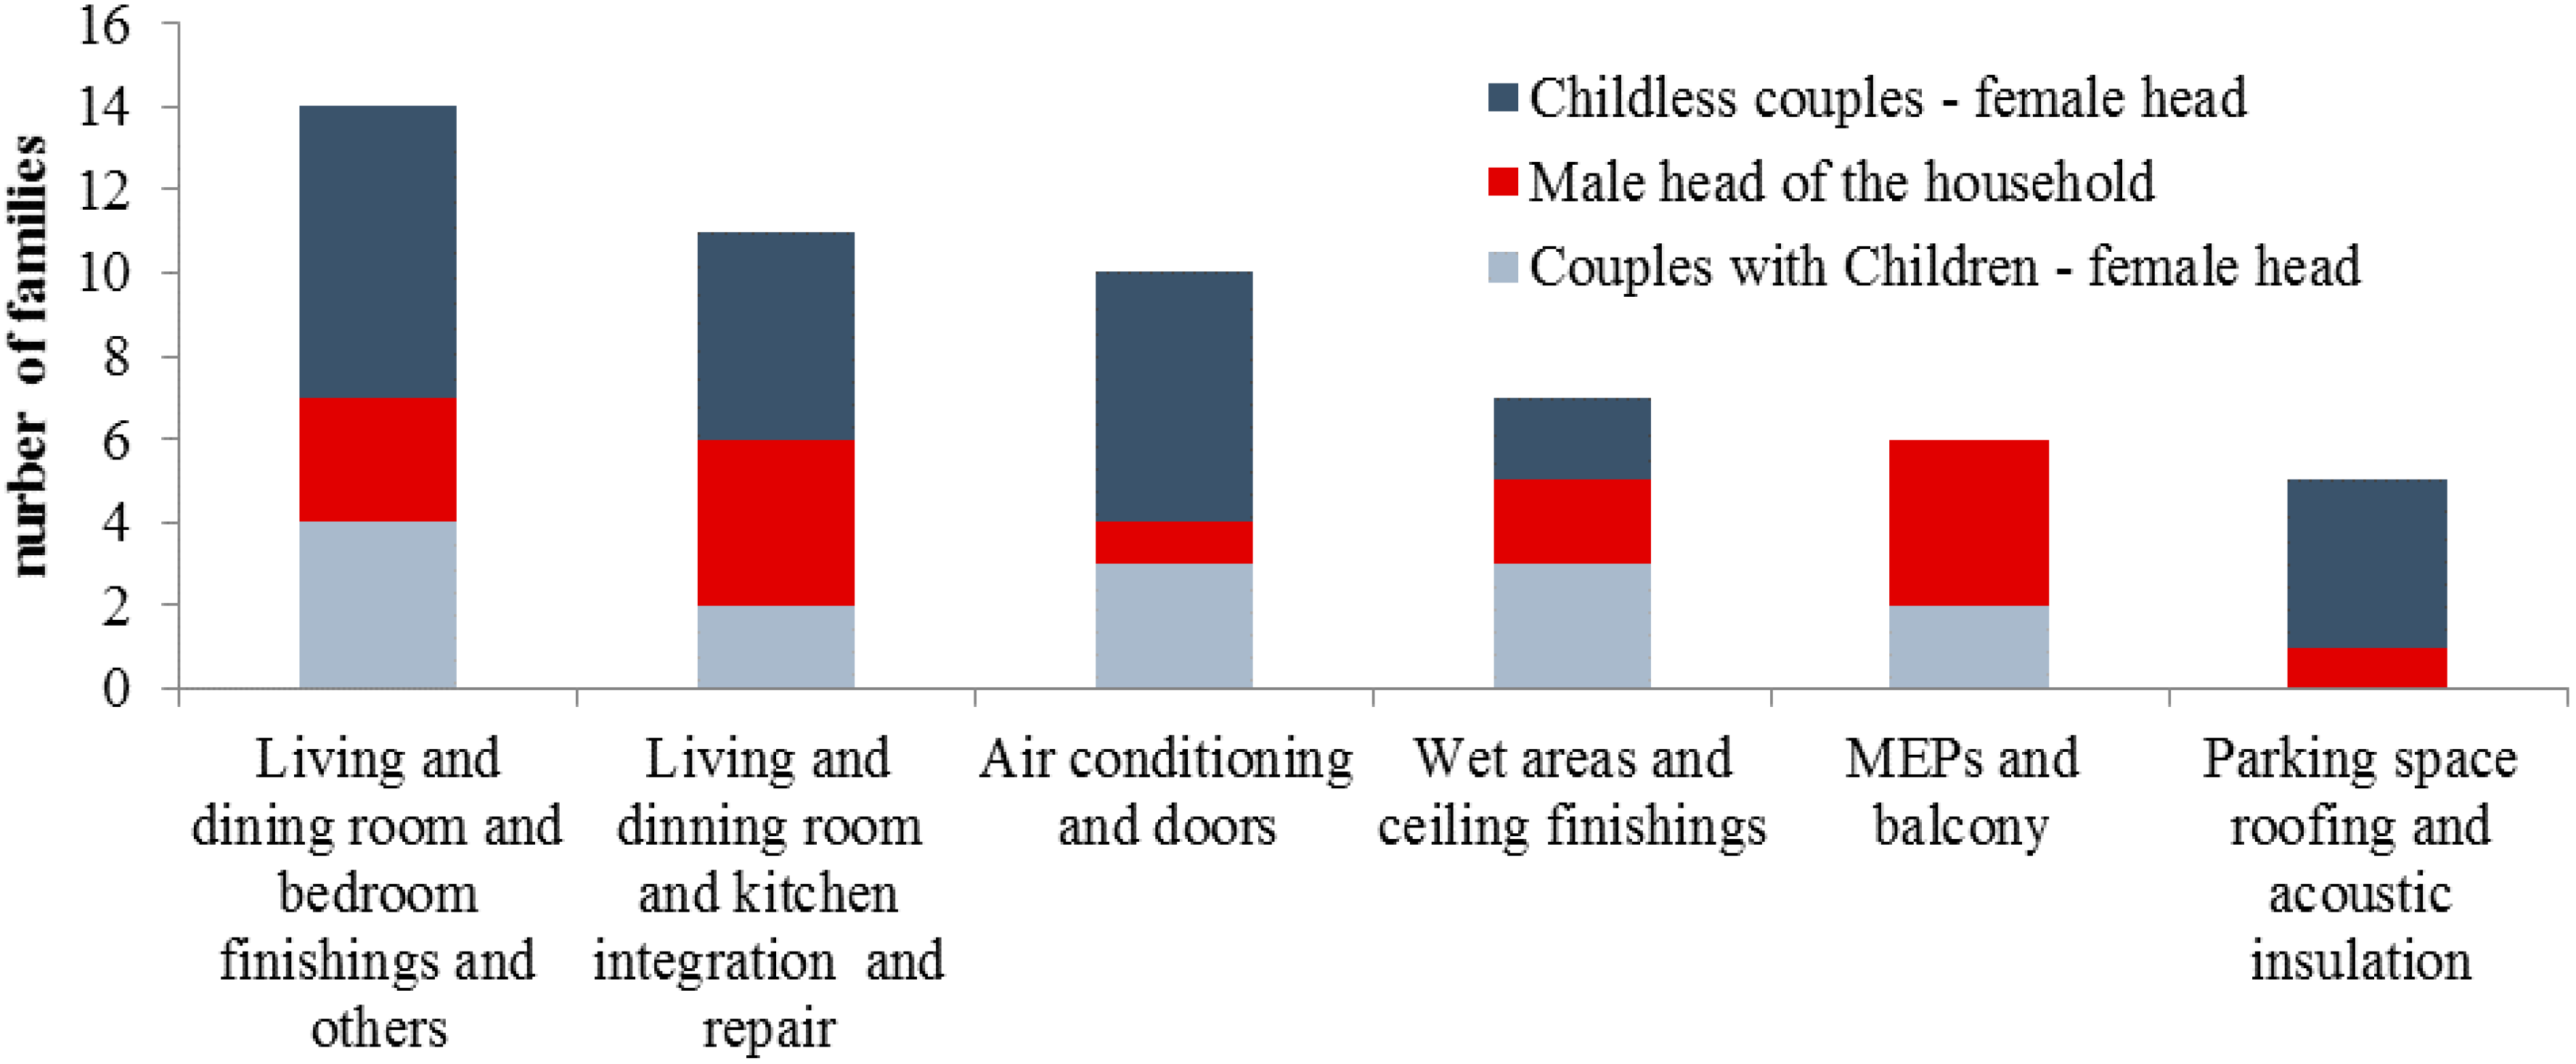
Table 6.
Clusters of product changes still desired by users.
Table 6.
Clusters of product changes still desired by users.
| Cluster Name/Frequency | Variables |
|---|
| Living and dining room and bedroom finishings and others/15 families (35.7%) | Living and dining room finishings, Bedroom finishings and Others (floor heating, paint doors and change doorknobs) |
| Living and dining room and kitchen integration and repairs/11 families (26.2%) | Kitchen layout, Living and dining room layout and Fixing building pathologies |
| Air conditioning and doors/10 families (23.8%) | Air conditioning and Doors’ opening and position |
| Wet areas and ceiling finishings/7 families (16.7%) | Kitchen and laundry finishings, Ceiling Finishings and Bathroom finishings |
| MEPs and balcony/6 families (14.3%) | Mechanical electrical and plumbing installations and Addition of a balcony |
| Parking space roofing and acoustic insulation/5 families (11.9%) | Parking space roofing and Acoustic insulation |
5.4. Correspondence Analysis
Correspondence analysis was used to associate customer profile clusters and product change clusters, with the aim of identifying the customization units that are more suitable for each customer profile.
Figure 5,
Figure 6 and
Figure 7 present the results of correspondence analysis for each type of product change. Based on that, some trends became evident:
- (a)
Households headed by women customize more than those headed by men, and couples without children customize even more, which may also be related to a higher family income or to more time available;
- (b)
The childless couple cluster, as they have higher income, tend to choose costly customizations, such as floor lining, ceiling finishings, and sanitary ware; and
- (c)
Families with children apparently invest less in improving housing units, probably because they prioritize other types of expenditure.
- (d)
There seems to be no relationship between the need for air conditioning points, which stands out as a source of dissatisfaction, and the customer profile;
Figure 5.
Correspondence analysis of client profile clusters in relation to design changes performed by the company.
Figure 5.
Correspondence analysis of client profile clusters in relation to design changes performed by the company.
Figure 6.
Correspondence analysis of the client profile clusters in relation to product changes made by users.
Figure 6.
Correspondence analysis of the client profile clusters in relation to product changes made by users.
Figure 7.
Correspondence analysis of client profile in relation to product changes still desired by users.
Figure 7.
Correspondence analysis of client profile in relation to product changes still desired by users.
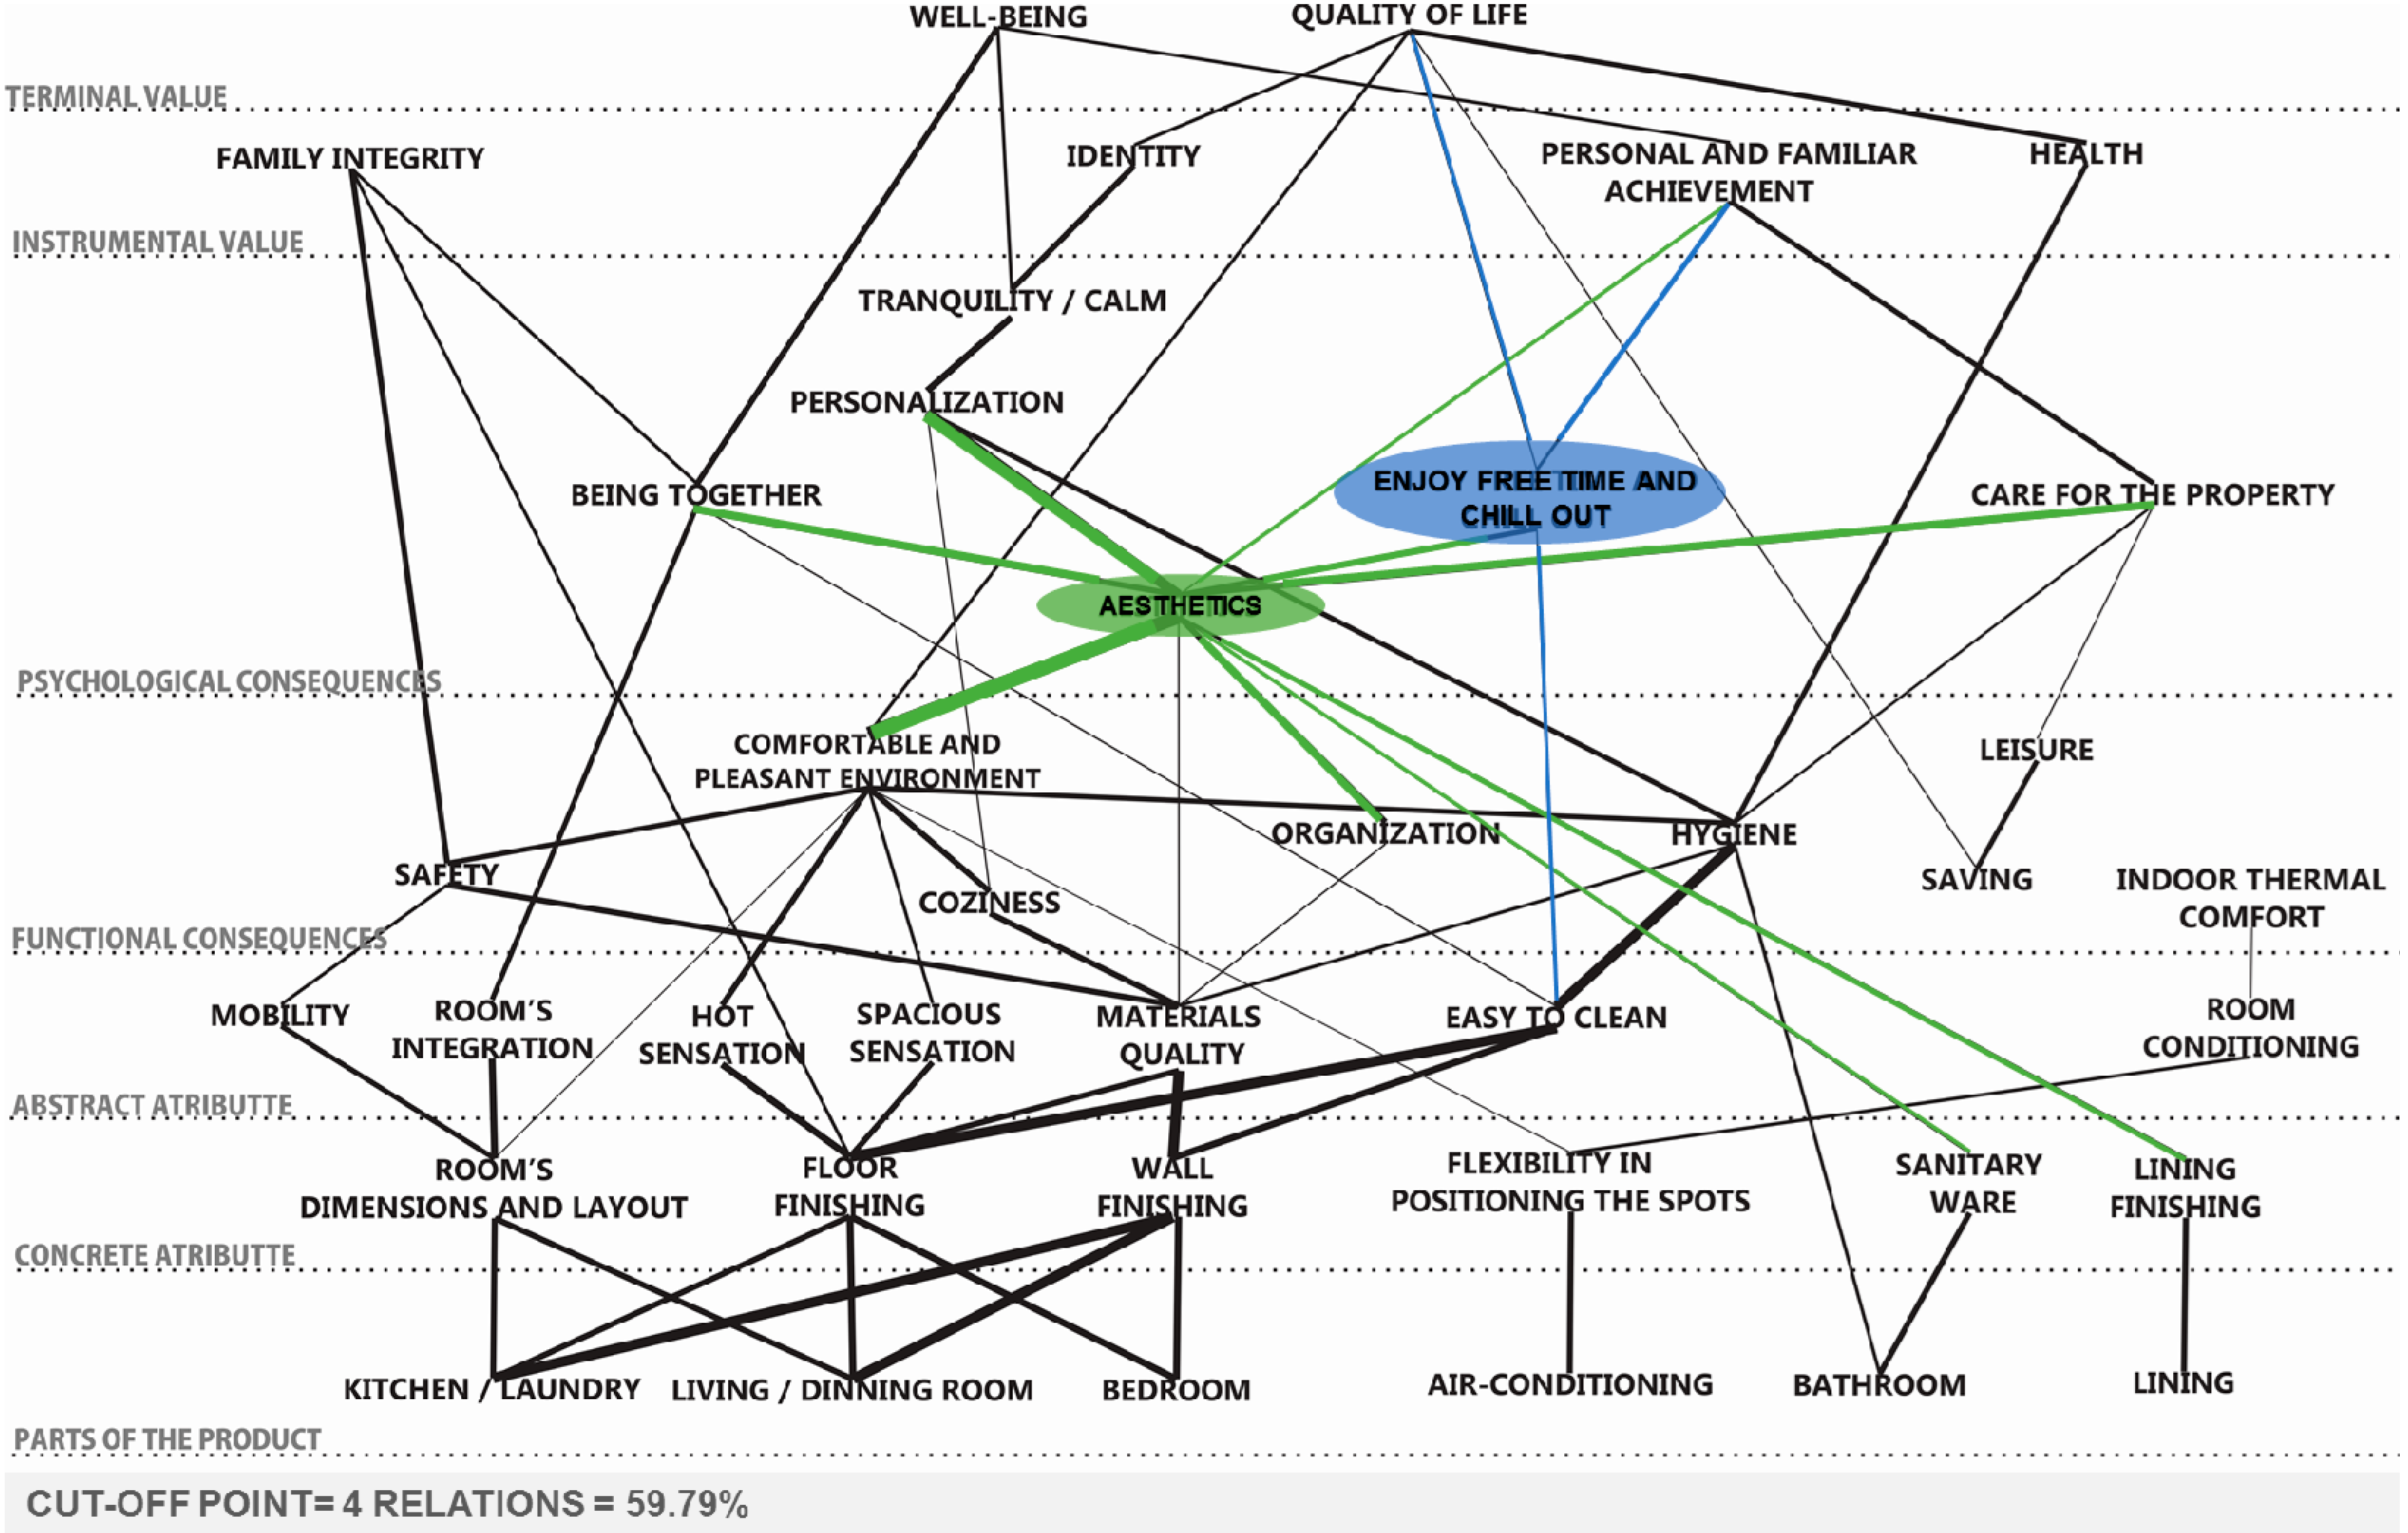
5.5. Hierarchical Value Maps
Figure 8 presents a HVM for the two house-building projects, considering the cut-off point of four relationships or 59% of the relationships. This map represents the main relationships between product attributes, consequences obtained in use, and expected values. For instance, it is possible to visualize the relationship between both floor and wall finishings in different rooms, in terms of the quality of materials, and how easy these are to clean. A major consequence is the hygiene and its impact on users’ health, which increases the quality of living. The map also makes explicit the connection between users’ complaints about the quality of the paint used, and the difficultly to clean the walls. Regarding the floor finishings, these were chosen based on how it feels,
i.e., tiled floors are connected with spacious sensation while wooden floors are connected with warmth. Those finishings mainly contribute to make a pleasant environment in terms of aesthetics, tranquility, and identity, leading to a better quality of life.
Figure 8.
General hierarchical value map.
Figure 8.
General hierarchical value map.
The items that generated dissatisfaction due to the lack of design flexibility also appear in the map. One of those items is the desire to integrate the living and dining room with the kitchen, shown in the map by the strong relationship between these two environments, and by the abstract attribute of dimension and the layout of the rooms, followed by integration. This customization is concerned with social interaction, resulting in the family well-being and integrity. Another source of dissatisfaction was the difficulty to install additional air conditioning units, which is related to thermal comfort and, subsequently, quality of living. Moreover, the problems related to the quality of execution and materials were mostly associated to the family’s safety and physical integrity.
It is worth pointing out that the construct aesthetics is a central element in the map shown in
Figure 8 (in green). From one hand, it is an important reason for customizing several attributes, such as wall and floor finishings, ceiling, and sanitary ware. On the other hand, it has a strong contribution to the achievement of different abstract goals, psychosocial consequences and values, such as personalization, care for the acquired property, personal and family fulfillment, and social interaction. The construct “enjoy free time and chill out” was repeatedly cited in connection to comments about a hectic daily life and working hard to be able to buy an apartment (connections in blue in
Figure 8). Therefore, it is closely related to personal and family fulfillment, as well as with the quality of living. Two terminal values mentioned by interviewees, well-being and quality of living, seem to have similar meanings. However, in this context, the respondents made a distinction: quality of living was referred as an improved and lasting future condition, while well-being was related to feeling good momentary.
5.7. Evaluation of the Method by the Company
In the meeting carried out at the construction company for the evaluation of the method, three guiding questions were made to the participants:
- (i)
How useful was the information provided in terms of planning the space of solutions in the development of new projects?
- (ii)
How relevant and clear was the information about customization units?
- (iii)
How easy for the company was to use visual devices summarizing relevant information about the demands for customization?
The reaction of the participants in relation to the results of the implementation of the method was in general positive. They pointed out that the visual devices were useful not only for defining the customization units, but also for supporting other design decisions. For instance, the discussion was useful for the company in terms of deciding whether the laundry area should be an open area or not. The application of the method indicated that, although the company had plenty of data on customer requirements and satisfaction, these were not appropriately processed and analyzed.
A major interest of the company in the information produced was the complaints that came out in this investigation, and to check whether all the problems had been solved. This indicated that information on product changes carried out or desired by the user can be regarded as additional requirements or sources of dissatisfaction that have not been properly communicated through other channels. For a company that delivers customized products, those quality problems should be addressed before offering further choices, as suggested by Pine II [
8], Barlow [
5] and Svensson and Barfod [
18].
The participants also pointed out that there was a misalignment between the purpose of the funding programs and what the clients expected in this type of house-building project. They suggested that the large number of product changes demanded or desired by customers might be caused by the fact that the decision to purchase a housing unit in those projects were mostly due to the favorable funding conditions, such as low interest rates, long time for paying the mortgage, rather than the housing product itself. For instance, many clients would like to have a balcony and a barbecue place, which is not typical for this type of funding program. This indicates that understanding the diversity of requirements and the demands for customization represent improvement opportunities not only for the product development process of house-building companies but also for the conception of governmental funding programs.
Finally, although the participants found useful the information on customization demands, they think that the company is not capable of delivering all customization units to the clients, due to limitations of the existing production control system, which is not capable of managing a very large space of solutions, in their opinion. They are very much concerned with the possibility of increasing costs beyond what is required by funding programs. Moreover, some of the customization units could not be offered due to the fact that the company needs to deliver all housing units complete at the end of the contract with the funding agency—for instance, a housing unit could not be delivered without all the sanitary ware installed, although some customers would prefer that.
6. Discussion and Conclusions
This paper has proposed a method for identification of the customization demands in low-cost housing. Its main practical contribution is a step-by-step process to identify relevant customization units and connect them with the benefits pursued by customers. By segmenting its market according to customer profiles, a housing-building company should be able to identify the most relevant product attributes to specific customers, and use that information as an input to analyze the feasibility of customization units, considering organizational capabilities. The outcomes of the method can also be used to structure the information that will be disseminated to potential customers. Therefore, a set of customization units can be chosen to be offered to potential customers that have the same profile, through the interpretation of bivariate analyses concerned with customization clusters and client profile clusters.
This investigation has made a contribution in terms of using MEC for a complex product such as social housing, which has not been investigated in previous studies. Such complexity demands an additional effort for clarifying the relationship between the parts of the product and the customization units, consequences in use and the desired values. In fact, one of the adaptations that was necessary in the MEC conceptual model, was the inclusion of an additional category at the bottom of the hierarchy, named product parts, which are connected to different product attributes. In order to deal with the complexity of considering so many attributes in the hierarchical value map, only the most relevant customization units were addressed in this application. In this respect, the laddering technique was useful for establishing a cut-off point, and choosing the most relevant links to be included in the map.
This method should be applicable to any type of housing market, although it seems to be much more relevant to the low-cost market segment, due to the obvious constraints in terms of costs. Further research is necessary to adapt this method to other types of building projects, such as commercial, industrial, and health care, since the data collection procedures and statistical analysis techniques were designed for the typical characteristics of low-cost housing projects, such as multiple housing units, subsidized funding, and wide range of customer profiles.
This investigation has also made a number of contributions related to the reasons why low-cost housing customers would like to change their units. For example, all clients have a declared preference for finishings that are easy to clean, so that the home hygiene is easy to be kept, contributing for the good health conditions, and the quality of living of the family, confirming the results of the study carried out by Zinas and Jusan [
39]. The results obtained in the two projects have also pointed out the central role of aesthetics. Most users wanted to change the finishings of the units, including walls, floor, ceiling, and sanitary ware, in order to achieve some desired end states that can be explained by a set of very abstract constructs, such as identity, personal and familiar achievement, well-being and quality of life.
However, some customization demands are strongly related to specific clusters of customer profiles. For instance, the desire for a balcony in the apartment for leisure was made explicit only by male heads of the household. Moreover, this type of client tends to prefer a ceramic floor to create a spacious sensation, in order to have a comfortable and nice home. By contrast, for childless couple with a female as the head of the household, it is more important to integrate the living and dining room with the kitchen, and paint those rooms, in order to offer a pleasant personalized environment for socializing. Although the desire for personalization in housing in connection with the household lifestyle was already pointed out by Ozaki [
40] and Schoenwitz, Naim and Potter [
38], the application of the proposed method provide insights on which types of personalization are the most important ones and why.
A set of visual devices were proposed to disseminate the outcomes of the method, such as hierarchical value maps and the summary choice menu, which can be support decision-making in the product development process, or be used as templates for evaluation exercises.
The method was applied in two similar projects from the same company, with the aim of testing the method from the perspective of a single organization. In future studies, the method could be tested in a larger sample of projects, with the aim of carrying an analysis for segments of the low-cost housing market. Another possibility for future studies is to fully implement the method in the context of an organization in order to further evaluate its utility and applicability.


